
- Academic Editor
†These authors contributed equally.
Background: Although the role of dynamic factors in DNA function still
remains unclear, research in this direction is a rapidly developing area of
molecular biology. In this work, the genetic constructions appY_red and
appY_green, based on the plasmid pPF1 and containing a fragment of
Escherichia coli (E. coli) DNA with predicted promoter-like
regions, are considered complex dynamic systems in which local sites of double
helix unwinding, called open states, can arise and propagate. The purpose of the
article is to show the existence of a connection between the dynamics of open
states and the functioning of predicted promoters. Methods: We
experimentally verified the functionality of the predicted promoters using a
reporter vector. Using a reverse transcription reaction, transcription start
sites were identified indicating the presence of two divergent promoters, one on
each strand. In mathematical studies, a dynamic model was used that described
open states as one-soliton solutions (kinks) of a system of nonlinear partial
differential equations, and the influence of the torque M
Open states are formed in DNA as a result of local unwinding of the double-stranded helix and play an important role in the transcription process [1]. It is assumed that the dynamic properties of the DNA molecule, in general, and open states, in particular, can determine the basic regulation of transcription [2, 3, 4, 5].
One of the DNA dynamic properties is the formation of local or global
superspiralized states in the DNA molecule [6]. An important characteristic of
superspiralized states is the torsion moment M
Transcription initiation occurs upon binding of RNA polymerase to DNA promoter regions and depends on the strength of the promoter [1]. It is known that promoter strength depends on the base sequence of the promoter region and can affect transcription-coupled DNA supercoiling [10, 11]. However, the relationship between the dynamics of open states in DNA and the strength of promoters, which determines the efficiency of gene transcription and expression, has been poorly studied. This work is devoted to identifying this relationship by studying the dynamics of open states in the genetic constructions appY_red and appY_green (or Red and Green constructions for short) based on the pPF1 plasmid [12] with an integrated fragment of E. coli DNA (positions from -65 to -252 relative to the beginning of the gene, taken as +1), taken from the regulatory region of the appY gene. Interest in this fragment is caused by the fact that, according to computer prediction of promoters based on text analysis of known regulatory regions, this fragment contains multiple potential transcription starts [13].
One of the approaches to studying the dynamics of open states is mathematical
modeling [2, 5, 14, 15, 16]. We have previously applied this approach to study the
movement of transcription bubbles in the appY_red and
appY_green genetic constructions and predicted the preferential
direction of the bubble movement [17]. However, our modeling studies did not take
into account the torsion moment M
Thus, the main goal of the article, in addition to checking the functionality of the predicted promoters in the studied E. coli DNA fragment, is to identify the relationship between the promoters functioning and the dynamics of open states, taking into account the influence of torsion moment.
Polymerase chain reaction (PCR)-generated DNA fragment of appY upstream regulatory region (from position -260 up to position -60, respectively, to appY ATG codon) was inserted into the reporter vector pPF1 at the BglII restriction site. Oligonucleotides used for amplification:
appY_For _BglII 5
appY_Rev _BglII 5
PCR products were purified in 4.5% Polyacrylamide Gel (PAAG), pPF1 vector, and DNA fragments were
subjected to restriction using endonuclease BglII (NEB, Ipswich, MA, USA), separated in 1%
agarose and purified using Cleanup Standard kit (Evrogen, Moscow, Russia). T4 DNA ligase
(NEB) was used for ligation, the reaction was carried out according to
manufacturer protocol (0.1 pmol of DNA fragment and 0.05 pmol of linearized
plasmid were taken into reaction in total volume 20 µL). A ligation mixture
was used for the transformation of competent E.coli K12 MG1655 cells
prepared as described in [18]. Bacterial colonies after transformation were
selected by fluorescence of Egfp and mCherry. Primers used for
PCR assumed the probability of insertion in opposite orientations. The
orientation and quality of inserts were confirmed by sequencing the resulting
plasmids using primers specific for mCherry and Egfp genes
(mCherry 5
 Fig. 1.
Schematic representation of two genetic constructions. In the Red (A) and Green (B) constructions, the mCherry gene is shown in red, the Egfp gene in green, and the Kanamycin gene in blue. A fragment of Escherichia coli (E. coli) DNA located between the mCherry and the Egfp genes is shaded. Point S indicates the beginning of the numbering of the nucleotide sequence.
To determine transcription start sites within appY regulatory region
analyzed in this study primer extension reaction was carried out. E.coli
K12 MG1655 cells transformed by the derivatives of pPF1 plasmid were grown on Lysogeny broth (LB)
medium in the presence of kanamycin (40 µg/mL) and harvested at OD
Transcriptional activity was assessed by the level of fluorescence of
transformant colonies when grown on LB agar medium in the presence of 50
µg/mL kanamycin for 14 hours. Fluorescence of E. coli cell
colonies transformed with plasmid constructions was recorded using a Leica DM
6000B microscope (lot number 289896, Leica Microsystems, Wetzlar, Germany). Images were obtained in the “Fluorescence” mode, and the
choice of filters for emission excitation and radiation detection was set at
settings “Cubes”: “GFP” (excitation in the region 488
Image processing was carried out using the ImageJ program (ver. 153t, National
Institutes of Health, Bethesda, MD, USA) [19]. To perform this, we used the algorithm of
threshold selection of cell colonies (whole spots) in the image, followed by the
calculation of the average intensity of pixels in the selected areas. Sample
sizes were 16 spots for Egfp protein and 15 spots for mCherry.
To correctly estimate the amount of synthesized fluorescent proteins, we took
into account the difference in the brightness of the glow of red and green
proteins. Thus, according to the data of [20], the luminescence brightness of
Egfp proteins is 33.54, and that of mCherry proteins is 15.84.
Then the intensity of fluorescent luminescence can be expressed through the
number (N) of proteins and their brightness (
If we go to the new variables describing the amount of proteins in brightness
units as follows:
where
When conducting model studies, we took into account that the Red and Green
constructions contain three genes separated by three intermediate regions. There
are six regions in total. To model the internal mobility of each of these
regions, a modified Englander model [16] that was based on the assumption that
angular displacements of the nitrous bases make the main contribution to the
formation of DNA open states was used. The model neglects the contribution of
other internal movements involved in the formation of open states, such as
transverse and longitudinal movements of nucleotides. Unlike the model originally
proposed by Englander [21], the modified model took into account the angular
deviations of the bases in both the coding and complementary chains, and also
took into account the effects of dissipation and the action of constant torsion
moment M
Here
To simplify Eqns. 3,4, the coefficients of the equations were averaged inside the region under consideration:
where
Here
Assuming that the solutions of Eqns. 5,6 are sufficiently smooth functions, we rewrote Eqns. 5,6 in the continuum approximation as follows:
where a is the distance between the nearest base pairs.
Further, we took into account the features of the distribution of interactions within the DNA molecule: the presence of “weak” hydrogen bonds between nitrogenous bases within complementary pairs and “strong” valence interactions along the sugar-phosphate chains. This property of the DNA molecule made it possible, as a first approximation, to transform two coupled Eqns. 8,9 into two independent equations:
Thus, the original problem was divided into two independent problems. The first was related to Eqn. 10, which models the angular deviations of nitrogenous bases in the coding chain. The second problem was with Eqn. 11, which described the angular deviations of nitrogenous bases in the complementary chain.
In a particular case, when the effects of dissipation and the action of a
constant torsion moment are small (
One-soliton solutions of these equations—kinks—found by analytical methods have the following form:
Here,
The total energy and rest energy of the i-th kink are determined by the following formulas:
In the case of low velocities
where
Section 3.2.1 presents a preliminary analysis of the kink behavior based only on the analysis of the form of the energy profiles of the coding and complementary sequences of the Red or Green constructions.
In the general case
tfaX/appY intergenic interval represents one of 78 genomic loci of E.coli chromosome oversaturated by potential promoters predicted using PlatProm software (http://www.mathcell.ru/model6.php?l=en) [13] that assumes specific structural properties of this region and its intrinsic capacity to respond to DNA conformational rearrangements including transcription-coupled changes in superhelical state. In our previous work, we found that two primary promoters mapped in the regulatory region between positions -260 and -61 with respect to appY ATG are active [12], though only one orientation of the fragment of interest in the reporter vector was studied. Here, we compared transcription activity in two constructions representing the same genomic region placed in inverted positions relative to the same plasmid environment. In both genetic constructions obtained after the transformation of E.coli K12MG1655 cells, TSSs were mapped using primer extension reaction with oligonucleotides specific for EGFP and mCherry genes. Despite the orientation of the insert, the same TSSs are revealed in the direction of the appY gene at the position -81 relative to the initiation codon, as well as in the opposite antisense direction at the position -148 (Fig. 2). Thus, the capacity of the insert to initiate bidirectional transcription remains conserved and provided by two promoters located back-to-back in the region under study.
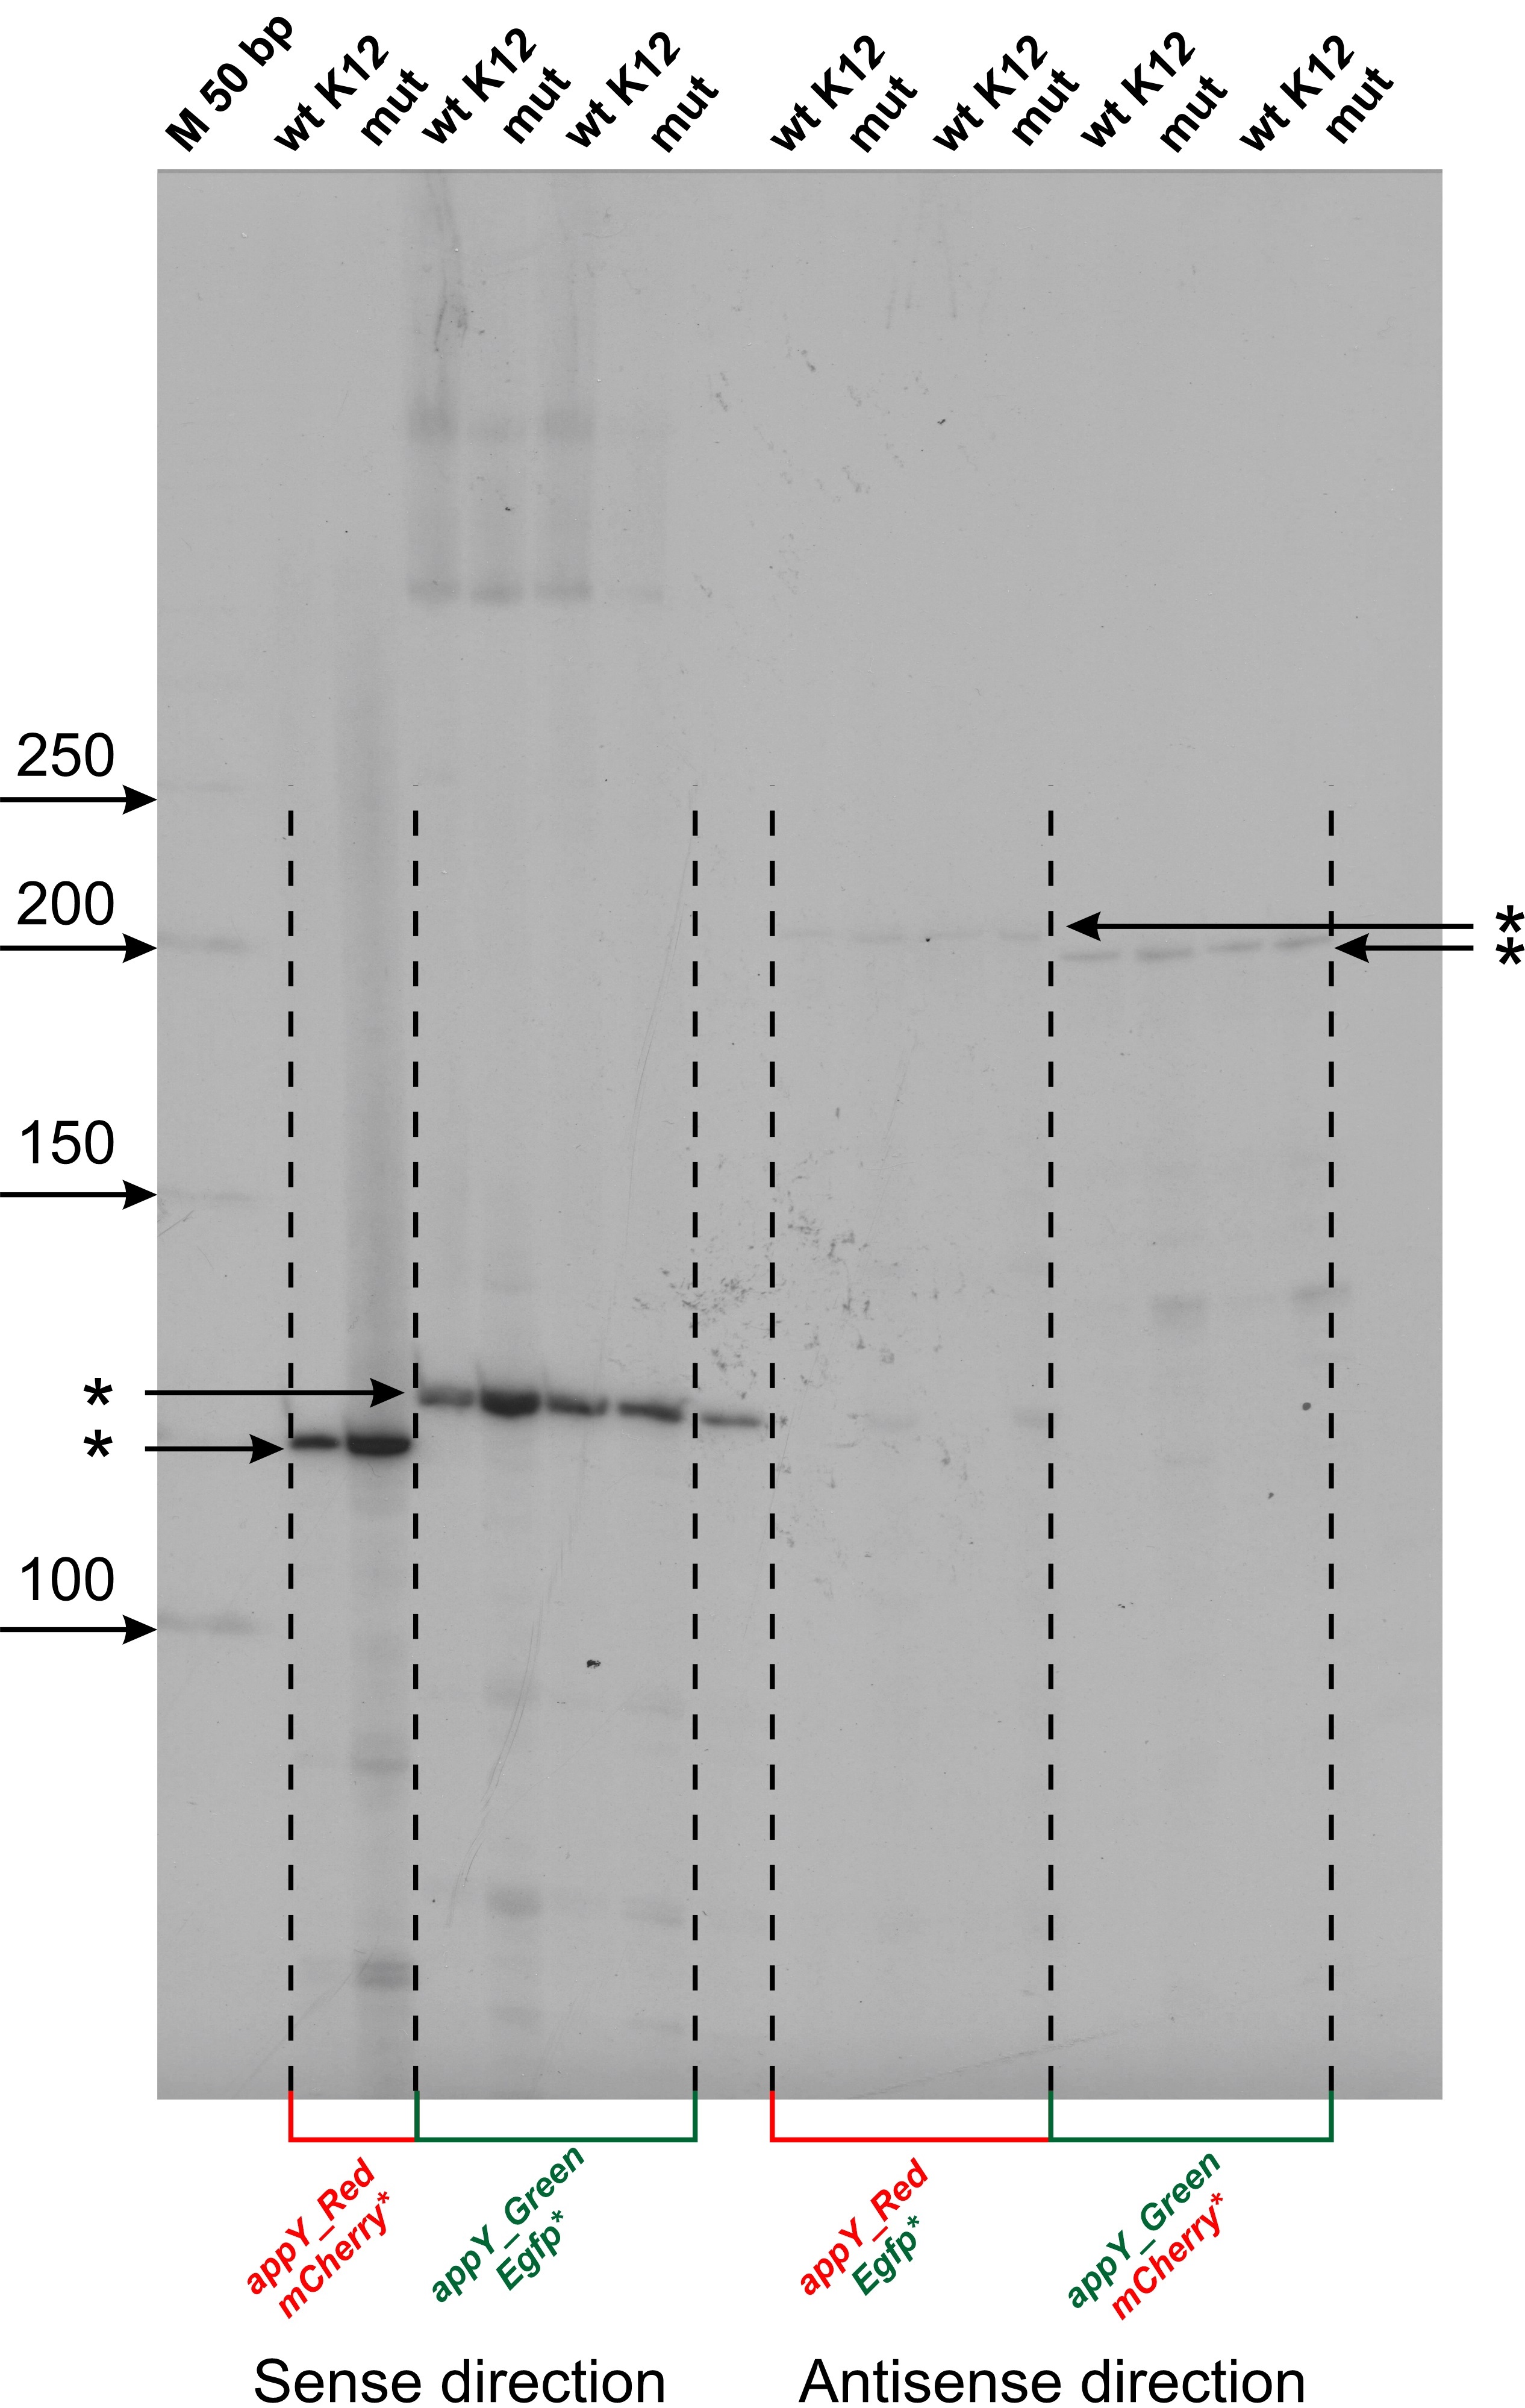 Fig. 2.
Mapping of transcription start sites (TSS) within cloned fragments of appY regulatory region. Reverse transcription reaction was carried out with radiolabeled oligonucleotide primers specific for mCherry and Egfp genes. Products were separated in 6% denaturating PAAG, 8M urea and radioautographed. Gels were calibrated by radiolabeled P32 50 bp DNA ladder (NEB) (M). The lengths of ladder fragments are indicated on the left by arrows. TSSs are marked by asterisks. “M” is marker lane, “wt K12” corresponds to the wild type E.coli MG1655 transformed by plasmids, “mut” corresponds to the host strain of E.coli DPB923 (E.coli Genetic Stock Center, CGST 7894).
The nucleotide sequences of the studied E. coli DNA fragments in the Red and Green constructions and reviled TSS are shown in Fig. 3A,B, respectively. It turned out that in the region under study, one main promoter on each of the strands works (Fig. 2). For the coding strand in Red and Green constructions, the start of RNA synthesis is at position -81 relative to the start of the appY gene (promoter P1 in Fig. 3C). This prevalent promoter is characterized by almost perfect -10 and -35 consensus hexamers (TATAAA and TTGCAA), though separated by non-optimal spacer 22 bp in length. On the complementary strand, transcription is initiated from position -148 (promoter P2 in Fig. 3C), having the context of -10 and -35 regions TTTAAG and TTGCAA, respectively, and separated by 16 bp. Promoter P2 possessing fewer conservative hexamers -10 and -35 exhibits low activity as compared to P1 (Fig. 2). When the orientation of the studied fragment is changed (Green construction), the promoters maintain their location in the sequence but move from one strand to the other (Fig. 3D).
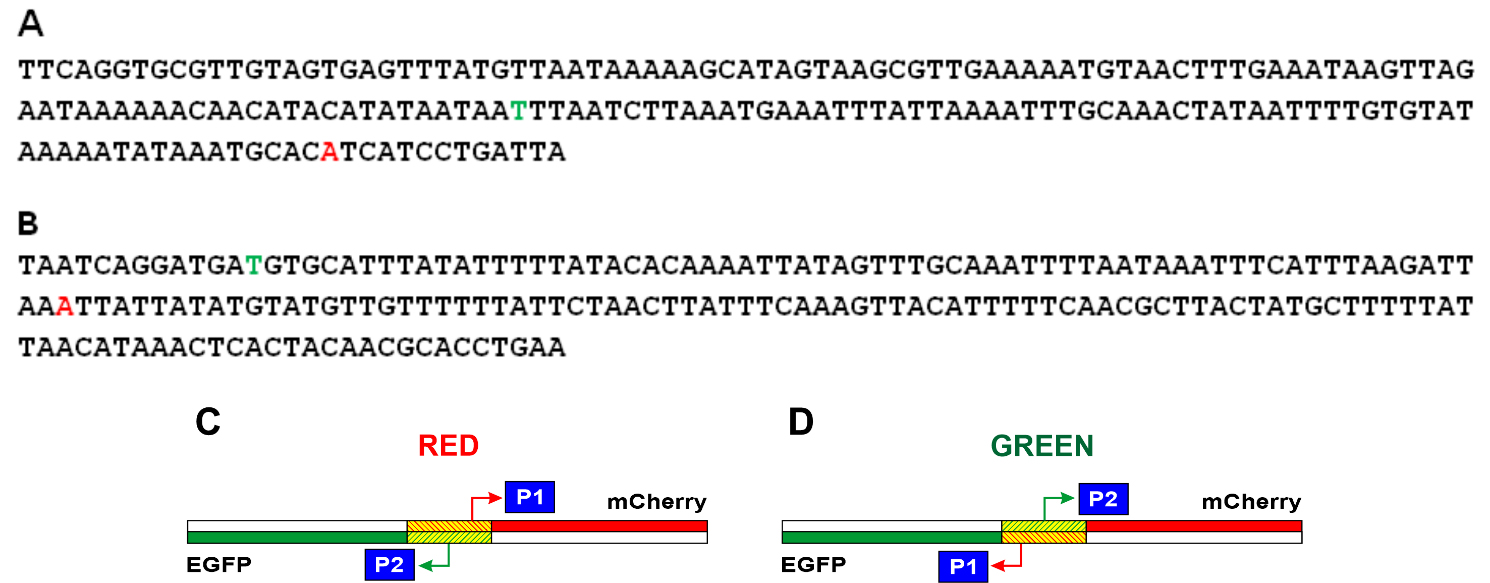 Fig. 3.
Nucleotide sequences of the studied fragments of E. coli and schematic representation of the location of the P1 and P2 promoters in the Red and Green constructions. In the Red (A) and Green (B) constructions, the start points located in the coding chain are shown in red letters, and the start points located in the complementary chain are shown in green letters. The complete nucleotide sequences of the Red and Green constructions are presented in Supplementary material. (C) Location of promoters in the Red construction. (D) Location of promoters in the Green construction. The mCherry gene is shown in red, the Egfp gene is in green, and the E. coli region between these two genes is shaded.
Transformant colonies and their fluorescence levels are shown in Fig. 4A,D. It
can be seen from these figures that in cells transformed with both variants of
the plasmid, synthesis of both the Egfp protein and mCherry is
observed. This suggests that transcription initiation is possible both on the
coding strand of the appY gene and on its complementary strand. In the
case of Red and Green, transcription is observed in both directions, but the
transcriptional activity in these two cases is different. From diagrams in Fig. 4B,E, it can be seen that in the case of Red, the brightness of the luminescence of
cells containing red proteins is significantly (p
 Fig. 4.
Fluorescent images of E. coli cell colonies and fluorescence
intensity diagrams obtained as a result of image processing using the ImageJ
program. (A) The images of cell colonies transformed with Red constructions. (D)
The images of cell colonies transformed with Green constructions. (B,E) The
fluorescence intensity (I) diagrams obtained in the case of Red (B) and
Green (E) constructions. (C,F) The fluorescence intensity diagrams that take into
account the difference in the brightness of the luminescence of cells with red
and green fluorescent proteins in the case of the Red (C) and Green (F)
constructions. The diagrams show the data as mean and tandard deviation (SD). * is significant
differences (Mann–Whitney test, p
From the diagrams presented in Fig. 4, it can be observed that in the case of
Red construction, the height of the red column in the diagram shown in Fig. 4C is
significantly (p
The energy profiles of the coding and complementary sequences are important characteristics that reflect the physical properties of DNA. An analysis of such profiles makes it possible to draw preliminary conclusions about the behavior of kinks.
In [17], using Eqn. 15, the energy profiles of the coding and complementary sequences of the Red and Green constructions were calculated. It was shown that in both cases, the deepest well corresponds to the region located between the red and green protein genes. This result allowed us to suggest that kinks are most likely to be activated in this region, which, in turn, suggests that promoters and, accordingly, transcription starts are located in this region. Further, we use this result to model the movement of the kink, placing the reference point in the middle of the region located between the red and green protein genes. We also limit our consideration to a small DNA fragment that includes only three regions, namely, the region denoted as r2 and located between the Egfp and mCherry genes, the region located to the left and denoted as r1, and the region located to the right and denoted as r3. Fig. 5A shows the results of the energy profile calculations obtained for the coding (red solid line) and complementary (green dotted line) sequences of the Red construction. Fig. 5B shows the energy profiles calculated for the Green construction.
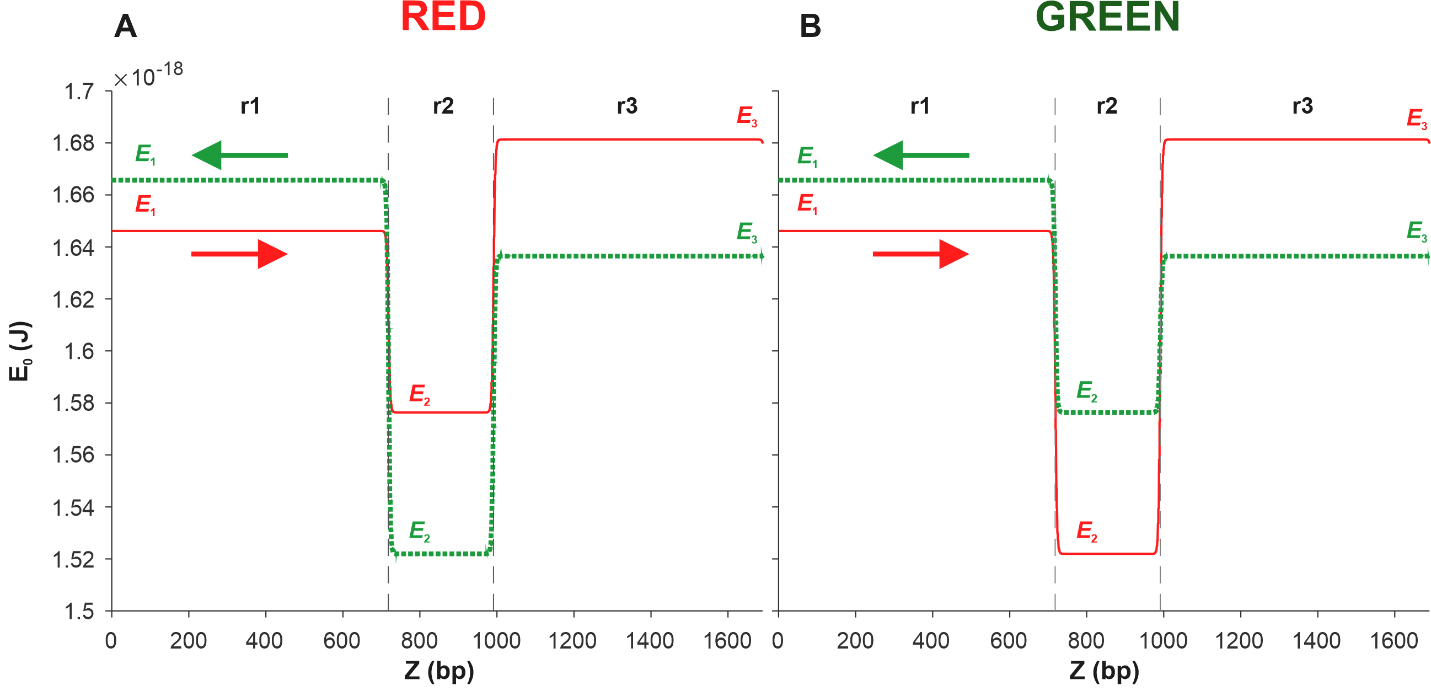 Fig. 5.
Energy profiles of the coding (red solid line) and complementary
(green dotted line) sequences of two DNA fragments. Each of the fragments
consists of three sections r1, r2, and r3 of the pPF1 plasmid, and the E. coli fragment is integrated into the r2 section in red (A) and green (B)
orientations. E1, E2, and E3 are the minimum energies required to form a kink in
the regions r1, r2, and r3, respectively. Arrows indicate the direction from the
3
From Fig. 5A, it can be seen that in the case of the Red construction, the depth of the well in the energy profile of the complementary sequence, shown by the green dotted line, is greater than that of the coding sequence profile, shown by the red solid line. This suggests that kink formation in the r2 region of the coding sequence is energetically more expensive than in the same region of the complementary sequence.
However, the kink formed in the r2 region of the coding sequence, moving in the
direction from the 3
We observe the opposite situation in the case of Green. Fig. 5B shows that in
the case of the complementary sequence (green dotted line), the barrier height in
the direction of the green protein gene is (E
Thus, summing up the analysis of energy profiles, it can be stated that the results of the modeling completely coincide with the results of our experiment, according to which, in the case of the Red construction, more red protein is produced, and in the case of the Green construction, more green protein is produced.
To clarify the role of the torsion moment M
In addition, we assumed that the points
where Z
The results of the calculations are presented in Figs. 6,7 in the form of kink
trajectories on the {z, t} plane where different trajectories relate to
different values of the torsion moment M
 Fig. 6.
Kink trajectories calculated in the case of Red construction.
(A) Trajectories of kinks propagating in the coding strand. (B) Trajectories of
kinks propagating in the complementary strand. Calculations were carried out for
the following values of the constant torsion moment M
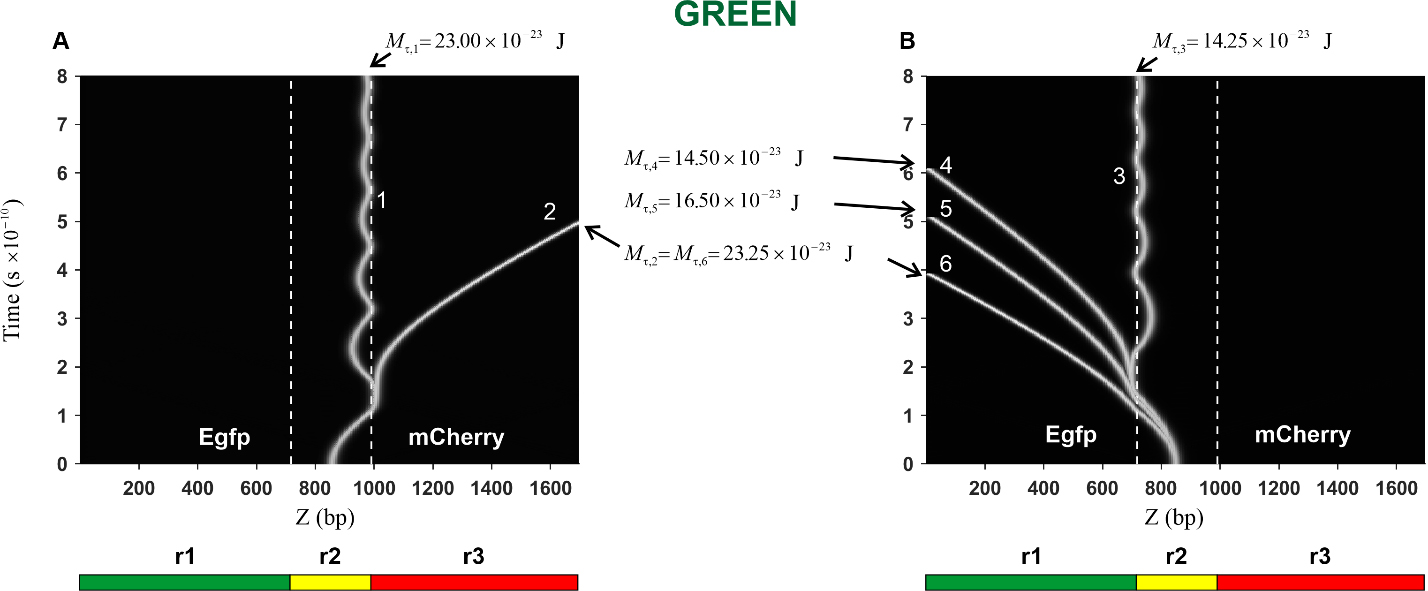 Fig. 7.
Kink trajectories calculated in the case of Green construction.
(A) Trajectories of kinks propagating in the coding strand. (B) Trajectories of
kinks propagating in the complementary strand. Calculations were carried out for
the following values of the constant torsion moment M
In the case of the Red construction, the calculated trajectories of the kink
movement in the direction of the mCherry gene (curves 1, 2, and 3) are
presented in Fig. 6A. It can be seen that with an increase in the torsion moment
from the value
The trajectories of the kink movement in the direction of the Egfp gene
(curves 4, 5, and 6) are shown in Fig. 6B. It can be seen that, as in the
previous case, the character of the kink motion changes: from damped oscillatory
motion of the kink near the left boundary of the region r2 (curve 4) to
translational motion (curves 5 and 6). Thus, it can be argued that in this case,
there is also a threshold value of the torsion moment, and only its value is
greater than in the previous case, namely it is located in the interval
The prethreshold and threshold values of the torsion moment, as well as data on the kink behavior at these values of the torsion moment, are collected in Table 1.
| RED | Toward mCherry gene | Toward Egfp gene |
| Prethreshold values | 16.25 × 10 |
21.00 × 10 |
| Threshold values | 16.50 × 10 |
21.25 × 10 |
From the data in Table 1, it follows:
(1) When the kink movement starts from the middle of the region r2 towards the red protein gene, the threshold value of the torsion moment is less than the threshold value when the kink moves from the same start point towards the green protein gene. It follows that it is the movement of the kink towards the red protein gene that will be preferable, which means that in the case of the Red construction, more red proteins will be produced. This conclusion agrees with the obtained experimental data, as well as with the predictions made in [17].
(2) Calculations showed that the minimum value of the torsion moment required to
produce red proteins is in the range
In the case of the Green construction, the calculated trajectories of the kink
movement in the direction of the mCherry gene (curves 1 and 2) are
presented in Fig. 7A. It can be seen that with an increase in the torsion moment
from the value
The trajectories of the kink movement in the direction of the Egfp gene
(curves 3, 4, 5, and 6) are shown in Fig. 7B. It can be seen that the character
of the kink motion dramatically changes: from damped oscillatory motion of the
kink (curve 3) to translational motion (curves 4, 5 and 6). Thus, it can be
argued that in this case, there is also a threshold value, only its value is less
and it is located in the interval
The prethreshold and threshold values of the torsion moment, as well as data on the kink behavior at these values of the torsion moment, are collected in Table 2.
| GREEN | Toward mCherry gene | Toward Egfp gene |
| Prethreshold values | 23.00 × 10 |
14.25 × 10 |
| Threshold values | 23.25 × 10 |
14.50 × 10 |
From the data in Table 2, it follows:
(1) When the kink moves towards the green protein gene, the threshold value of the torsion moment is less than the torsion. This conclusion agrees with the obtained experimental data, as well as with the prediction moment value when the kink moves towards the red protein gene. It follows that it is the movement of the kink towards the green protein gene that will be preferable, which means that in the case of the Green construction, more green proteins will be produced [17].
(2) Calculations showed that the minimum value of the torsion moment required to
produce green proteins lies in the range
In this work, the relationship between the dynamics of open states (kinks) and promoter functioning in the appY_red and appY_green genetic constructions was investigated by experimental and mathematical modeling methods.
Assessing the functionality of the promoters predicted in [13] using the pPF1 reporter vector revealed TSSs in the studied DNA fragment, indicating the presence of two functionally active divergent promoters, one on each strand. The efficiency of promoters was evaluated by fluorescent protein gene expression intensity in E. coli cell colonies transformed with plasmid constructions using fluorescence image and corresponding brightness diagram analysis. It was found that, in the case of the Red construction, mCherry expression is higher than expression of Egfp, indicating higher promoter efficiency on the coding strand compared to the promoter on the complementary strand (Fig. 4). On the contrary, in the case of the Green construction, when the E. coli fragment is rotated, the expression of Egfp is higher than mCherry, indicating higher promoter efficiency on the complementary strand than on the coding strand (Fig. 4). This showed that the P1 promoter was stronger than the P2 promoter. Since it has been shown that the promoter strength depends on the orientation of the DNA fragment under study in the plasmid, it can be concluded that the dynamic properties of DNA in general affect the strength of promoters. The presence of the relationship between the strength of promoters and the dynamic properties of DNA, in particular between the promoter strength and DNA supercoiling, was also shown by other authors [11].
From the energetic profiles calculated at the beginning in [17] and continued in this work, we found that the most favorable and preferred site for the formation of kinks in both constructions is the region r2 located between the red and green protein genes. This result is in good agreement with the data [13], according to which the r2 region containing a DNA fragment of E. coli, has multiple potential starts of transcription.
From the same energetic profiles, it was found also that in the case of the Red construction, the formation of a kink in the complementary sequence of this r2 region is less expensive. However, the height of the energy barrier that prevents the kink movement towards the red protein gene is less than the height of the energy barrier that prevents the kink movement towards the green protein gene. In the case of Green construction, the situation is exactly the opposite: the formation of a kink in the coding sequence of the region r2 is less expensive, but the energy barrier that the kink needs to overcome in order to move towards the red protein gene turned out to be higher than the energy barrier towards the green protein gene. These results are in good agreement with the above experimental data showing that in the case of the Red construction, mCherry expression is higher than Egfp expression, and in the case of the Green construction, Egfp expression is higher than mCherry expression. Indeed, the diagrams presented in Fig. 4 show that in the case of Red construction, the red diagram is higher than the green one (Fig. 4C), and in the case of Green construction, the opposite is true: the green diagram turned out to be higher than the red one (Fig. 4F). Thus, the assumption made in [17] that in the case of the Red construction, more red proteins will be produced, and in the case of the Green construction, on the contrary, more green proteins will be produced, was fully confirmed.
Taking into account the influence of the torsion moment, additional features of
the Red and Green internal dynamics are revealed. The existence is shown and
estimates of the threshold values of the torsion moment M
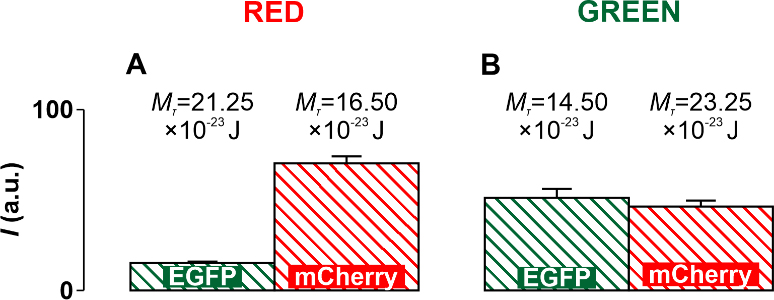 Fig. 8.
Diagrams obtained experimentally and supplemented with threshold
values of the torsion moment M
Thus, two divergent promoters, one on each strand, were identified for the Red and Green genetic constructions, and the dependence of promoter functionality on the orientation of the fragments was shown. A good correlation between the results of experiments and model calculations allows us to state that the mechanism of such dependence is determined by the dynamics of open states in the Red and Green constructions, which depends on the energy profile of the sequence and the magnitude of the torsional moment.
Using the dynamic model of DNA, it was possible to obtain numerical estimates of
the minimum values of the torsion moment required for protein synthesis. It has
been shown that in the case of the Red construction, the minimum value of the
torsion moment required for the synthesis of red proteins lies in the range
All datasets on which the conclusions of a manuscript depend are available to readers from the corresponding author.
IM performed experimental part of the research. AG and LY performed mathematical part of the research. All auhors contributed to the design of the research study, data analysis, and writing of the manuscript. All authors read and approved the final manuscript. All authors have participated sufficiently in the work and agreed to be accountable for all aspects of the work.
Not applicable.
We acknowledge the Institute of Cell Biophysics of the Russian Academy of Sciences for administrative and technical support.
This research received no external funding.
The authors declare no conflict of interest.
Publisher’s Note: IMR Press stays neutral with regard to jurisdictional claims in published maps and institutional affiliations.