
Attention is the ability to prioritize a set of information at expense of others and can be internally- or externally-oriented. Alpha and theta oscillations have been extensively implicated in attention. However, it is unclear how these oscillations operate when sensory distractors are presented continuously during task-relevant internal processes, in close-to-real-life conditions. Here, EEG signals from healthy participants were obtained at rest and in three attentional conditions, characterized by the execution of a mental math task (internal attention), presentation of pictures on a monitor (external attention), and task execution under the distracting action of picture presentation (internal-external competition). Alpha and theta power were investigated at scalp level and at some cortical regions of interest (ROIs); moreover, functional directed connectivity was estimated via spectral Granger Causality. Results show that frontal midline theta was distinctive of mental task execution and was more prominent during competition compared to internal attention alone, possibly reflecting higher executive control; anterior cingulate cortex appeared as mainly involved and causally connected to distant (temporal/occipital) regions. Alpha power in visual ROIs strongly decreased in external attention alone, while it assumed values close to rest during competition, reflecting reduced visual engagement against distractors; connectivity results suggested that bidirectional alpha influences between frontal and visual regions could contribute to reduce visual interference in internal attention. This study can help to understand how our brain copes with internal-external attention competition, a condition intrinsic in the human sensory-cognitive interplay, and to elucidate the relationships between brain oscillations and attentional functions/dysfunctions in daily tasks.
In our daily life, the ability to process relevant information and reduce the interfering effect of distracting information is essential to successfully complete any task at hand. This ability is accomplished via attentive processes; indeed, attention acts by prioritizing the processing of a subset of information at the expense of others [1, 2].
Attention can be categorized into external and internal attention. Externally-oriented attention is directed towards stimuli in the environment. External attention can be voluntarily driven by task demands in a top-down fashion, e.g. when we focus on a specific spatial location or feature of the sensory stimuli, being this location/feature goal-relevant. External attention can also be involuntarily captured by an object or event, in a bottom-up fashion, even if there is not any goal of attending them. Internally-oriented attention is directed away from external stimulation and towards internal representations and thoughts. Examples of internally directed cognition include episodic memory retrieval, working memory, planning, mental imagery, mental calculation [1].
The neural mechanisms underlying attention abilities have been the subject of extensive research in the last decades. In particular, electrophysiological research has provided massive support for a functional role of two brain oscillatory rhythms in attentional processes: theta (roughly between 4-8 Hz) and alpha (roughly between 8-14 Hz) rhythms. Indeed, strong associations have been observed between changes in the attentional state and modulations of the power of these oscillations in specific regions as well as modulations of inter-regional synchronization (measuring functional connectivity) within these frequency bands (for a review see [3]).
Regarding theta activity, prominent EEG theta increase has been consistently reported especially over the frontal-midline region (around Fz) in several cognitive tasks [3], with the increase being more pronounced in more demanding conditions. In particular, increase in frontal-midline theta is mostly observable in tasks requiring sustained internally-directed attention, such as working memory tasks [4, 5] and mental arithmetic tasks [6, 7, 8]; although heterogeneous, these tasks share the need of updating, organizing and holding online the information of multiple items, for their manipulation and retrieval. Besides local frontal theta enhancement, increase in inter-regional theta synchronization has been observed between frontal and temporal and posterior sites in these tasks. Previous investigations have localized the cortical generators of EEG frontal-midline theta in the anterior cingulate cortex (ACC) and adjacent medial prefrontal cortex [4, 6, 9]. These regions are strongly connected to other cortical areas and theta synchronization is considered as a mechanism through which a frontal supervisory attentional system masters the communication and coordination among the different brain areas involved in these complex tasks [5, 9]. An increase in theta activity in medial prefrontal cortex and in temporal and posterior regions was found also in prospective memory tasks (i.e. remembering to execute planned intentions when an appropriate external cue appears); this was associated to attention oriented internally towards the representation of intentions stored in memory and their appropriate retrieval [10].
Regarding alpha activity, much recent research has supplanted the traditional interpretation of alpha activity as just reflecting a cortical idle state, and it is now thought to play a pivotal role in attention, by implementing functional inhibition of task-irrelevant processes that may interfere with the task goals [2, 3, 11]. Specifically, decrease/increase in alpha power has been associated to cortical excitation/inhibition respectively, based on the adaptive alpha response to task demands. For example, in visual spatial cueing tasks when attention is covertly oriented to one visual hemifield, alpha band oscillations increase over the ipsilateral (unengaged) relatively to the contralateral (engaged) visual system, reflecting inhibition of task-irrelevant visual areas [12, 13, 14, 15]. Similarly, when attention is shifted to visual features processed in the ventral visual stream (such as color as opposed to motion), alpha power specifically increases in the task-irrelevant dorsal stream [16]. Furthermore, alpha power in visual areas increases when attention is oriented to other sensory modalities such as somatosensory [17] or auditory [18]. Again, when a prospective memory task is associated to high external attention to detect a difficult visual cue in the environment, alpha power decreases especially in bilateral occipital areas to enhance visual processing [10].
Besides alpha changes associated to externally-directed attention, many studies report intensification of the alpha rhythm in tasks that require internal attention. In visual working memory tasks, alpha typically increases posteriorly during the retention interval and was positively correlated with memory load (number of memorized items) and task difficulty [19, 20], suggesting that it acts to protect the maintenance of relevant information against potential external intrusion. Furthermore, when to-be-maintained items and to-be-ignored items (representing distractors) are simultaneously presented in separated hemifields during the encoding interval, in the retention interval alpha power increases in the hemisphere contralateral to the previously presented distractors [21, 22]. Yet, alpha power increases at posterior sites in anticipation of a predictable distractor presented during the retention interval [23]. EEG/MEG studies investigating cortical connectivity suggest that posterior inhibitory alpha modulations are driven by top-down signals from regions of the prefrontal cortex: indeed, long-range alpha influences from these anterior regions towards occipital cortex augment when visual interferences have to be avoided [12, 24].
All previous studies have provided huge contribution to the comprehension of the relationships between brain oscillations and attentional control. However, in our opinion there are some issues that have remained overlooked and that might provide further insights into the neural correlates and neuroelectrical manifestations of attention.
First, the role of alpha oscillations in distractors filtering has been mainly explored in conditions when the distractors were absent, i.e. they were no longer or not yet presented. That is, the effects on alpha were observed either during the anticipation period before any visual irrelevant/distracting stimulus was actually provided [12, 23], or during a retention interval, when all information presented during the previous encoding period was removed [21, 22]. Therefore, it is still unclear which is the online effect of visual distractors and how local alpha power and alpha connectivity are modulated while visible distractors are interfering with task-relevant cortical processing. Indeed, in this case, at variance with the previous ones, the mechanisms that work to inhibit the distracting input likely compete with an automatic, bottom-up capture of external attention induced by the visual distractors.
Second, most studies investigated either alpha or theta modulation in relation to attentional tasks and only a few have examined both rhythms simultaneously [10, 25]. A joint investigation would favor the emergence of possible reciprocal relationship between these two mechanisms. It can also be noted that theta modulations (mainly in frontal midline region) have been especially studied in condition of internally-directed attention, while modifications of theta oscillations inducible by external visual attention have been less explored.
Finally, most of the cited literature uses trial-based experimental paradigms and time-locked analysis of the signals, with analysis windows usually involving a very short period of hundreds of milliseconds. While this procedure may favor the separation of the investigated mechanism from spurious effects, it suffers from a less ecological validity and barely reflect real-life situations.
In order to contribute to the previous points, in this study EEG signals were recorded from healthy subjects in four different conditions with open eyes: i) 5 minutes of resting state, used as basal condition; ii) 5 minutes of external attention, consisting in the presentation of emotionally neutral pictures, with no associated task demand, so that bottom-up external attention is considered here; iii) 5 minutes of internally-directed attention consisting in a mental arithmetic task; iv) 5 minutes of competition between internally-directed attention and external attention, consisting in the mental arithmetic task performed while simultaneously presenting pictures that acted as distractors. By estimating also cortical activity from the EEG signals via eLORETA, we aim to address the following questions: What are the alpha and theta power modulations that play a role in these conditions of external (sensory) attention and internal (cognitive) attention respectively, and how are some key cortical regions involved? How is the directional flow of information in the two bands modified among these regions by these two states of attention? How do the previous mechanisms of external and internal attention interact when the two forms of attention are in competition?
Twenty-four healthy volunteers (13 females), aged 21-27 years, (mean
The experiment was performed in a controlled laboratory environment. The participants underwent four consecutive experimental sessions, each lasting 5 minutes and separated by a short interval during which the subject, while sitting, could slightly move and speak. The participants comfortably seated facing a computer monitor about 50 cm far; they were instructed to perform the four sessions with eyes open, reducing at minimum eye, head and body movements. First, a resting state (R) was recorded for 5 minutes, while the participants stayed relaxed in front of a grey screen displayed on the monitor. This was used as the basal condition. The other three sessions corresponded to the three conditions of attention. The internal attention session (IntAtt) consisted in executing a mental arithmetic task throughout the 5-minute period, while a uniform grey screen was displayed on the monitor. The task was a mental serial subtraction in steps of seventeen starting from a given number. This kind of task required intentional orientation of attention to internal processing, and did not rely on any information provided externally. Note that no distracting visual input was delivered during this session since only the grey screen was continuously presented to the participant. The external attention session (ExtAtt) consisted in presenting to the participant a series of pictures on the monitor during the 5-minute period. Specifically, thirty emotionally neutral pictures extracted from the IAPS (International Affective Picture System) database [26] were used. The pictures were displayed on the monitor one after the other every 10 seconds, in a random order. No specific task was associated to pictures viewing. Therefore, during this session visual external attention of participants was captured by the pictures in a bottom-up fashion, as it may occur in a real-life sensory rich environment. The session of internal-external attention competition (IntExtAtt) consisted in the combination of the previous two conditions: during this 5-minute session, participants were required to perform the mental arithmetic task as in the IntAtt condition, while pictures were displayed on the monitor as in the ExtAtt condition. Therefore, in this session, the pictures acted as visual distractors that competed and interfered with the execution of the mental math task. This session simulated a common realistic condition such as when we are engaged in internally-oriented tasks (e.g. problem solution in the classroom, office, etc.) and we need to isolate from the sensory-rich surrounding to avoid the intrusions of task-distracting inputs.
The order of the three attentional sessions was randomized across participants. The participants were provided with the instructions for the math task only immediately before the beginning of the corresponding sessions, so they remained unaware of the task until its onset. These instructions also communicated to the participant that he/she would be required to report the final number achieved at the end of the session. The starting number for the mental serial subtraction was 2500 in the first of the two math task sessions (IntAtt or IntExtAtt); the final number reached by the participant in this session was then used as the starting point for the serial subtraction in the subsequent session. Furthermore, participants were not informed in advance of pictures presentation either in case of the ExtAtt or IntExtAtt session. The same 30 pictures were randomly presented during both the two sessions. The selected pictures had normative level of pleasure between 4.5 and 5.5 points on a 9-point scale. Neutral pictures were used to avoid the involvement of emotional factors.
As in previous studies using covert mental arithmetic [6, 7, 25], it was not possible to control the actual execution of the task during the sessions. However, all participants were aware that not complying with the received instructions would have compromised the study. Furthermore, requiring the participants to report the final reached number likely further motivated them to engage in the task. We also asked each participant at the end of the sessions if he/she actually performed the serial subtractions (otherwise, the recording would have been discarded). A confirmation of task engagement was obtained from all participants; furthermore, all participants reported that performing the task under picture presentation was more demanding.
EEG signals were recorded through a Neurowave System (Khymeia, Italy, Brainbox® EEG-1166 amplifier, Braintronics) using an elastic cap with 32 Ag/AgCl scalp electrodes (Fp1, Fp2, AF3, AF4, F7, F3, Fz, F4, F8, FC5, FC1, FC2, FC6, T7, C3, Cz, C4, T8, CP5, CP1, CP2, CP6, P7, P3, Pz, P4, P8, PO3, POz, PO4, O1, O2). The reference electrode was placed on the left earlobe and the ground electrode was located on the forehead. The right earlobe electrode was acquired too, for offline re-referencing. During each experimental session, EEG data were digitized in continuous recording mode at a sample frequency of 128 Hz and 16-bit resolution, and with the inclusion of a hardware notch filter eliminating line noise at 50 Hz. Thus, for each participant, four 5-minutes recordings were acquired. Finally, for each participant and each recording, the thirty-two EEG signals (+ the right earlobe signal) were exported in Matlab (R2019b, The MathWorks Inc., Natick MA) for further analysis. Firstly, data were re-referenced with respect to the average of the two earlobe signals and high-pass filtered at 0.75 Hz to eliminate the DC offset and slow drifts. Then, for each participant the following processing steps were applied.
First, for each participant, the four EEG recordings were concatenated along the time dimension. Then, to identify and remove artefacts, Independent Component Analysis (ICA) was applied to the concatenated signals using the extended infomax algorithm implemented in the open source Matlab toolbox EEGLAB (https://sccn.ucsd.edu/eeglab/index.php) [27]. To speed up artefactual component identification, we took advantage of the recent EEGLAB plug-in named ‘IClabel’ that allows for automatic classification of the estimated independent components into ‘Brain’ ICs (if classified as originating from cortical patches), or artefactual ICs distinguishing between ‘Muscle’, ‘Eye’, ‘Heart’, ‘Line Noise’, ‘Channel Noise’, ‘Other’ ICs [28]. Outside EEGLAB toolbox, non-Brain IC components were removed based on the automatic classification results, except a few doubtful cases that were subjected to visual inspections (scalp map and time/spectral pattern) to ascertain the presence of artefactual activity before their removal. Overall, an average of 19.8 (SD = 4.5) ICs were removed across participants. Artifact-cleaned EEG signals were then reconstructed by back-projecting the remaining set of non-artefactual ICs. Finally, the so cleaned signals were separated back into four 5-min portions corresponding to the four sessions.
The application of ICA procedure to the concatenated EEG signals ensured that the same ICs were removed from each recorded session, avoiding that differences between the four conditions could emerge because of removal of different ICs.
In order to sharpen the precision of the spectral analyses, we estimated the Individual Alpha Window (IAW) of each participant, based on previous observations that the alpha band may vary considerably across individuals [29, 30]. This was also motivated by a preliminary visual inspection of the Power Spectral Density (PSD) of posterior EEG signals at rest (R): the standard alpha band (8-14 Hz) did not seem appropriate for all participants, in some cases extending beyond in others not completely including the alpha peak. An automatic and objective method for identifying the IAW for each participant was adopted, based on a Matlab algorithm (publicly available) recently proposed [31] and inspired by the manual procedure originally proposed by Klimesch et al. [30].
In agreement with the literature [29, 30], we grounded the estimation of the IAW
only on the signals acquired in the resting session (R). Briefly, the procedure
was as follows. For each participant, the PSD of all channels over the resting
session was obtained (Welch’s periodogram method, Hamming window of 5 seconds,
50% overlap, 10 s zeropadding) and given as input to the algorithm. For each
PSD, the algorithm applied a least-squares curve-fitting procedure (via the
Savitzky-Golay filter, sample window length set at 27 and polynomial order at 5)
in order to obtain a smoothed PSD function and to estimate its first derivative.
Based on the first derivative, only channels where a peak (or a split-peak
complex) was identified within a putative alpha bandwidth (set at 8-14 Hz) and
clearly distinguishable from the 1/f background noise, were kept for the
subsequent analysis. The latter consisted in identifying the nearest local minima
to the left and right of the peak complex, thus identifying the channel-wise
alpha bounds; these were then averaged across the retained channels to obtain the
IAW (
For each participant, the PSD of each channel over each session, R, IntAtt, ExtAtt, IntExtAtt, was obtained. For each session separately, the alpha power over the IAW and the theta power over the resulting theta band was computed for each channel and the values at the 32 channels were used to realize scalp maps of alpha and theta distribution in the four conditions. Furthermore, the power was computed at two scalp macro regions, by averaging the alpha and theta powers over frontal electrodes (Fp1, Fp2, AF3, AF4, F3, Fz, F4, FC1, FC2) and parieto-occipital electrodes (P3, Pz, P4, PO3, POz, PO4, O1, O2), obtaining anterior/posterior Theta and anterior/posterior Alpha in each condition. To evidence attentional-dependent changes, the alpha and theta power at regional level in each attentional condition was normalized to the corresponding regional value in the basal resting condition (R).
Besides an analysis at a scalp level, we were interested in an analysis at
cortical source level. To this aim, cortical source activity was reconstructed
starting from EEG signals. Specifically, we estimated the intracortical current
densities by using the approach eLORETA (exact Low Resolution Electromagnetic
Tomography [32]) for solving the inverse problem, as implemented in the
LORETA-KEY
For each participant, we reconstructed the three dimensional time series of the current densities at all voxels for each session. For each session separately, the alpha and theta power at each voxel was derived as follows. The PSDs of the three vector components were computed (using the same parameters as at scalp level) and the voxel power in the alpha-band and in the theta-band was taken as the sum of the three corresponding power values computed on the three PSDs. In this computation too, we took into account the individual alpha and theta band for each participant. The power values at the 6239 voxels were used to realize cortical maps of alpha and theta distribution in the four conditions, and for statistical voxel-wise analysis.
We selected some cortical regions of interest (ROIs) to focus both the power
analysis and connectivity analysis. The selection was mostly based on a priori
considerations about the brain conditions under investigation and on results of
previous literature; only in one case the selection was data-driven. These
choices are further commented in section Discussion. Two sets of ROIs were
selected for the theta-band and alpha-band analysis, with some ROIs common to the
two sets. Fig. 1 shows the ROIs used for the theta- and alpha-band analysis, in
the three-dimensional cortical source space adopted for the solution of the EEG
inverse problem (Section 2.3.4). The assignment of a voxel to a specific region
is based on information provided by the software
LORETA-KEY
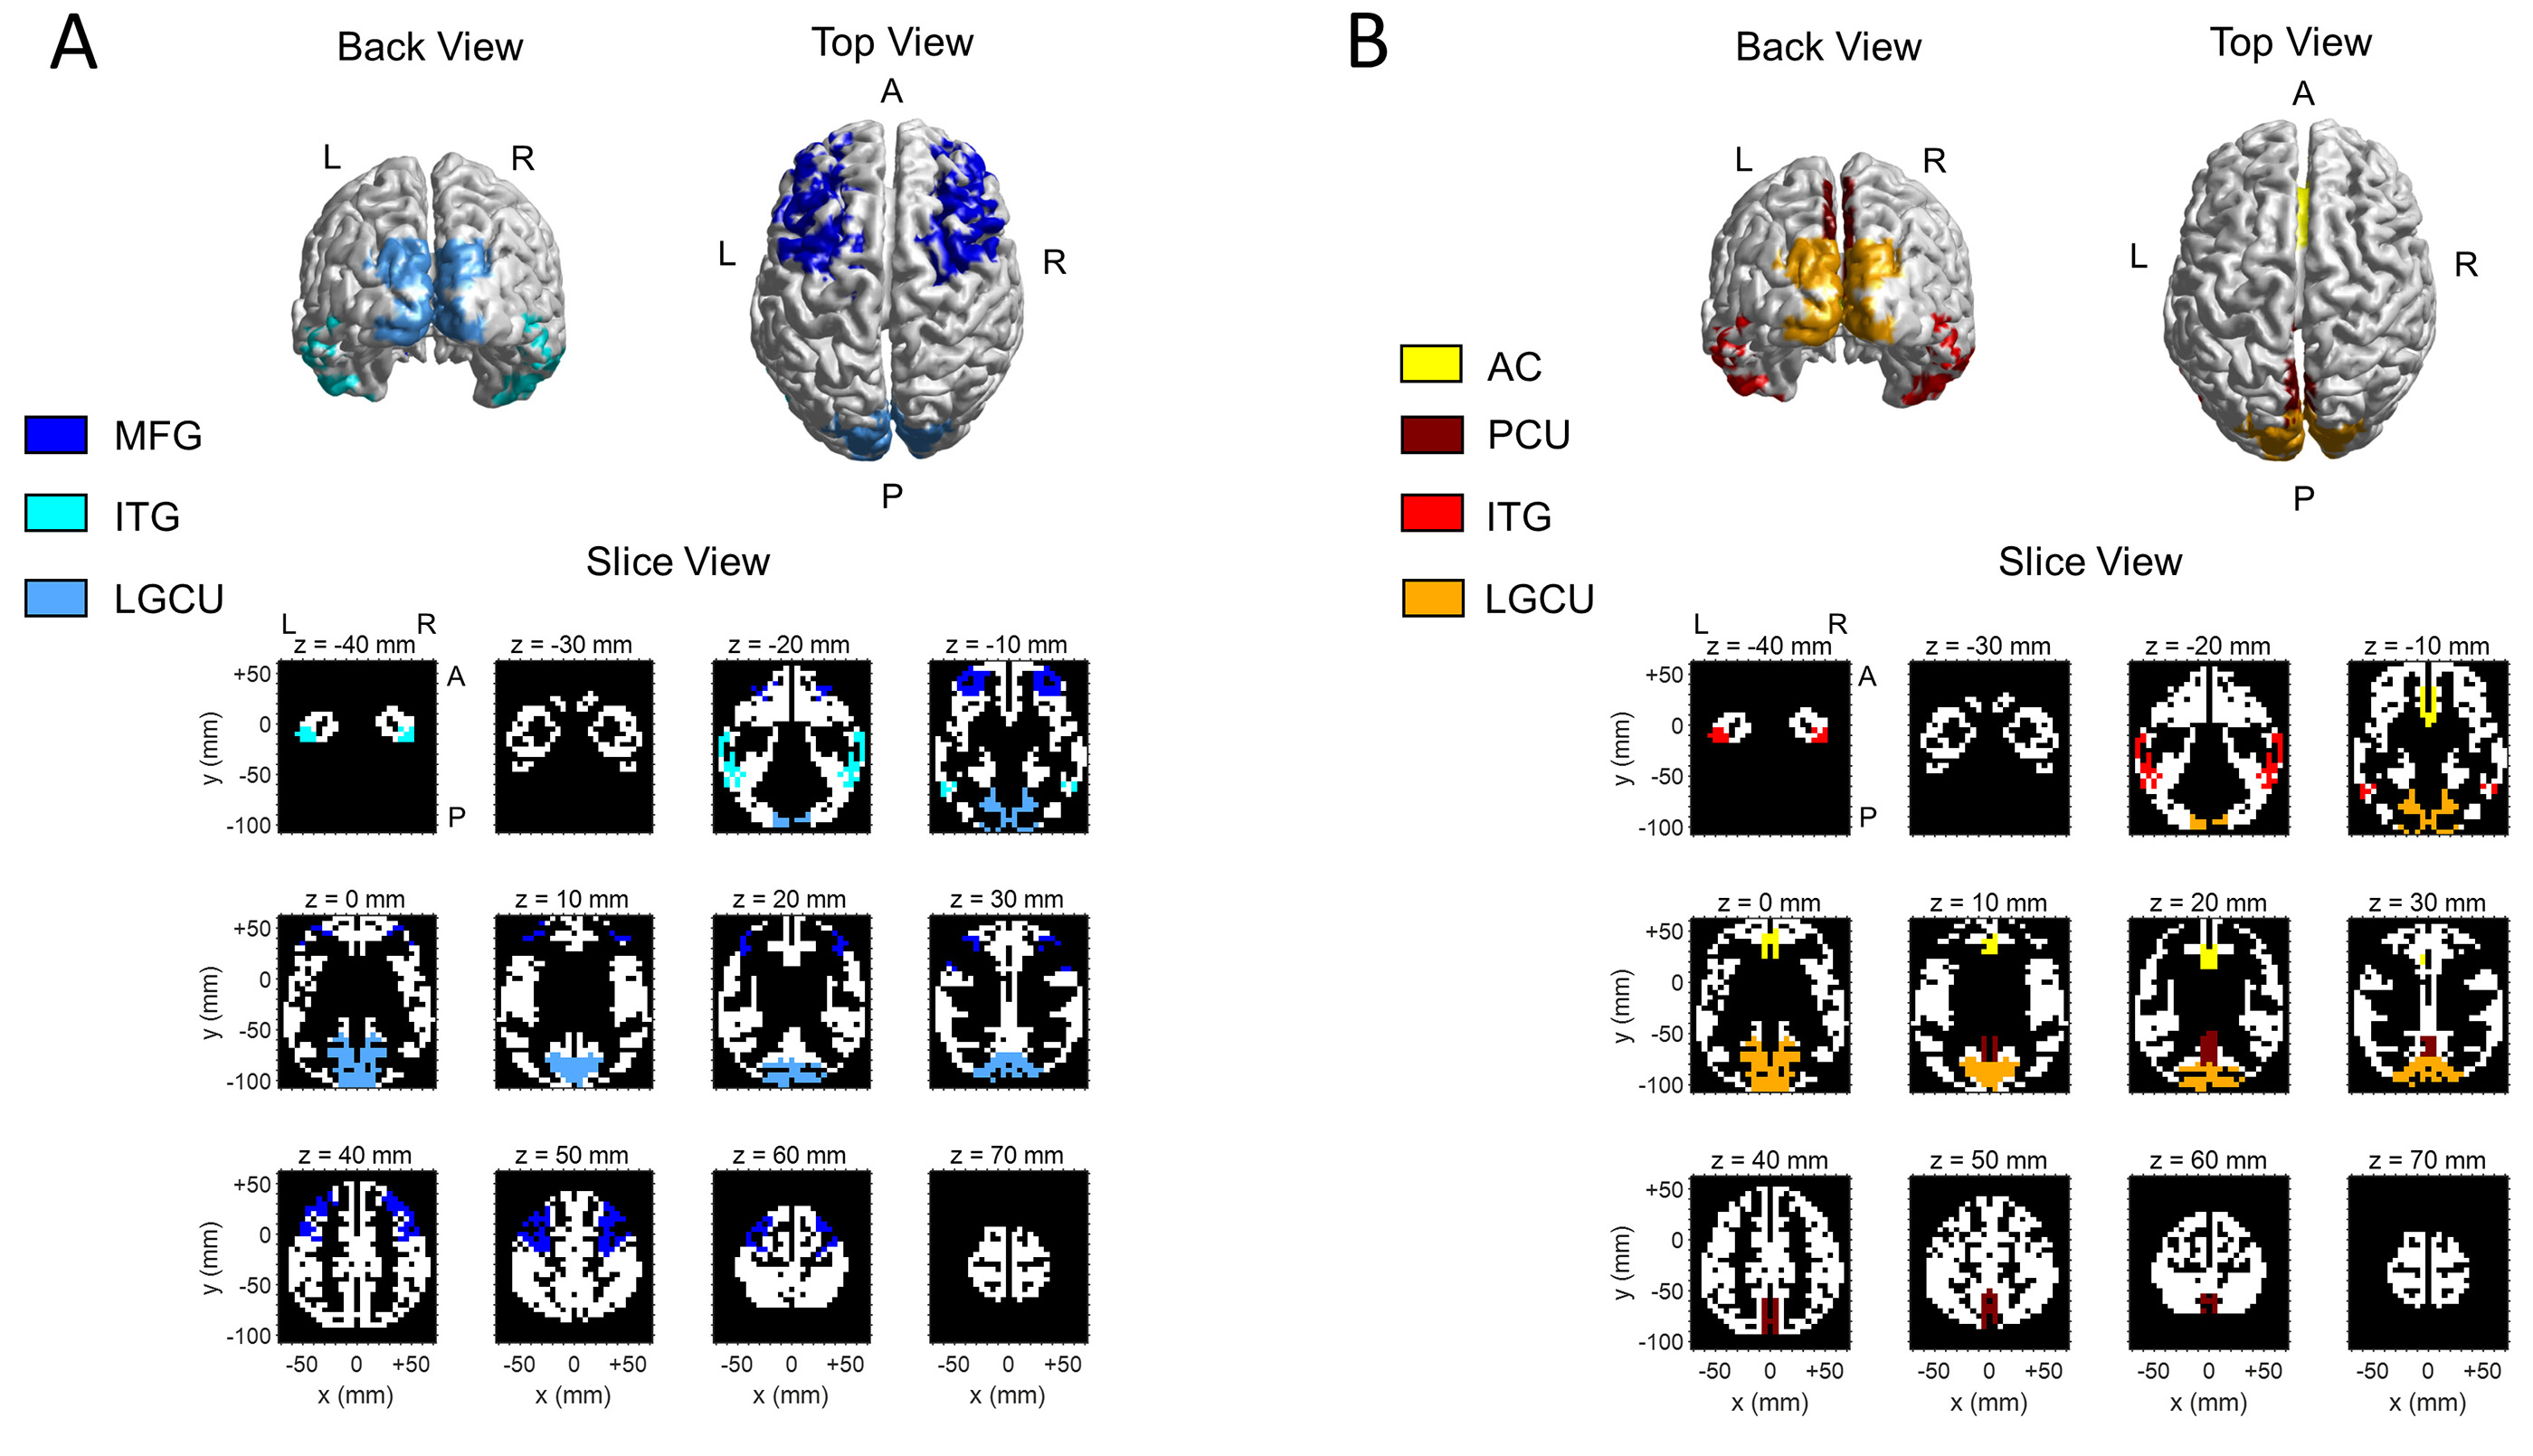 Fig. 1.
The regions of interest (ROIs) selected for the alpha-band analysis (Panel A) and theta-band analysis (Panel B) at the cortical level. The ROIs are depicted in the cortical source space used by the method (eLORETA) adopted for the solution of the EEG inverse problem. A realistic head model based on the MNI152 template was used, with the solution space restricted to the cortical gray matter and divided into 6239 voxels at 5 mm cubic spatial resolution. Both panels show the back view and top view of the surface of the cortical space and the view across transversal slices along the z axis. The x, y, z axes (MNI coordinates in mm) have orientation left to right (x), posterior to anterior (y) and bottom to top (z). The voxels depicted with the same color belong to the same region, as indicated by the legend: note that, for the sake of clarity, the same color was used for homologous regions in the two hemispheres (left and right) and, in case, for the medial portion too (e.g. LGCU). Some ROIs (ITG, LGCU) were analyzed in both bands, and for completeness, they are represented both in panel A and B (but with different colors).
Lingual Gyrus/Cuneus (LGCU) - These occipital regions are involved in
earlier stages of visual processing and perception. They were selected according
to previous evidence (see also Section 1. Introduction) of alpha
inhibition-disinhibition mechanisms operating in these regions, and of their
involvement in long-range alpha band synchronization during attentional tasks
[12, 24]. We took into account left, right and medial Lingual Gyrus/Cuneus
(LGCU
Inferior Temporal Gyrus (ITG) - This region is a high-level visual area
in the ventral visual stream, and recognized to be involved also in encoding
information about scenes [33] (the kind of pictures we used in the experiment).
We expected that both alpha power and alpha-band connectivity of this region
could be modulated depending on the attentional condition. Left and right ITG
(ITG
Middle Frontal Gyrus (MFG) - We included this region as a putative area
involved in top-down modulation of visual alpha activity. In particular, MFG has
been found to be functionally connected to occipital visual areas when internal
information has to be maintained, and this long-range interaction involved
alpha-band oscillations [24, 34, 35]. The left and right MFG (MFG
Lingual Gyrus/Cuneus (LGCU) and Inferior Temporal Gyrus (ITG) - These same 5 ROIs were considered, to investigate whether theta activity in visual areas may be modulated by attentional condition, and to highlight differences in alpha and theta modulation in these areas. This can be also of interest since theta entrainment in visual areas is less investigated than alpha-band modulation.
Anterior Cingulate Cortex (ACC) - This medial area of the frontal cortex was selected since previously identified as the main generator of EEG frontal-midline theta in attentional demand and cognitive monitoring; in particular, frontal theta associated to mental calculation has been localized in ACC [6, 7, 36].
Precuneus (PCU) - This area, laying on the medial surface of the posterior parietal lobe, was the only area not selected a prior; it was included in the analysis based on initial results at cortical level (see Section 3.2) showing that voxels in this area appeared especially involved in theta-band modulation under condition of ExtAtt. This area has been largely linked to memory processes and internally directed functions [37, 38]; however, it has been also related to visual functions [39, 40] (see also Section 4.2 for a critical discussion on this).
Each selected ROIs contains several cortical voxels (see Supplementary Material S1 and Supplementary Table 1). To perform the power analysis at the ROIs level, the powers of all voxels within each ROI were averaged, obtaining the theta power and alpha power of each ROI in each session. To evidence attentional-dependent changes, the alpha and theta power of each ROI in each attentional condition was normalized to the corresponding ROI value in the basal resting condition (R).
We used the spectrally resolved Granger Causality (GC) analysis to estimate the
directional influences, in the Granger sense of predictability [41], between each
pair of selected ROIs in the theta and alpha band and to assess their potential
modulation as a function of the attentional condition. Considering two time
series
The computation of the GC spectrum between two ROIs requires that each ROI is described by a single time series. To derive a single time series representative of each ROI activity, first for each voxel within the ROI, we computed the component of the current density vector perpendicular to the local cortical surface in the head model, and then these scalar components were averaged across all voxels within the ROI. This procedure may be justified considering that each estimated current density vector is mainly representative of the postsynaptic currents at pyramidal neurons dendrites inside a cortical macro-column, and these dendrites are oriented orthogonally to the local cortical surface [46]. Furthermore, in our previous work we used neural mass models to simulate activity of cortical ROIs and their interactions [47, 48, 49], where each ROI describes the average behavior over a large population of neurons: we showed that the causal connectivity established in the model between each pair of ROIs is reflected by (and can be estimated from) the postsynaptic activities of the two ROIs.
Based on the previous procedure, a time waveform for each ROI was derived for
each of the four sessions. We considered separately the set of 7 ROIs
selected for the alpha-band analysis (alpha set, MFG
Based on the previous procedures, the power values (at scalp and cortical level) and directed connectivity values were obtained for each of the 24 participants, in the two bands. Statistical comparisons were performed between each attentional condition and the baseline condition, both as to power and connectivity values. When the comparison of one attentional condition vs rest involved power maps (both at channel and voxel levels) and connectivity maps, we used the non parametric permutation test for functional neuroimaging [50] that readily deals with the multiple comparison problem of testing at all voxels/channels/connections. When the comparison concerned the variations at the level of an entire single ROI (e.g. the power of a ROI or the overall causal outflow from a ROI) in the attentional conditions vs rest, the non-parametric Wilcoxon signed rank test was used (with Bonferroni correction). The performed comparisons and the applied statistical methods are better specified below.
a) Channel-wise (scalp level) comparison of alpha power and theta power in attentional condition vs the baseline condition. For each band and each attentional condition, we statistically evaluated which scalp channel exhibited different power compared to baseline condition. A non-parametric, permutation-based t-test was used. To this aim, the distribution of the t statistic at each channel under the null hypothesis was empirically computed by performing 5000 random permutations of the observed values between the two conditions [50]. The uncorrected P-value at each channel was the proportion of the permutation distribution at least as extreme as the observed t statistic (computed on the non-permuted values). To obtain P-values corrected for multiple comparisons, the permutation distribution of the maximal t statistic was obtained (by collecting at each permutation the maximum of the channel t statistics) and the corrected P-value at each channel was the proportion of the distribution for the maximal statistic at least as extreme as the observed t statistic.
b) Regional-wise (scalp level) comparison of alpha power and theta power in attentional condition vs the baseline condition. For each band and each scalp region (anterior/posterior), we statistically evaluated whether the specific attentional condition modified the regional power compared to the baseline. A Wilcoxon signed rank test (the non-parametric equivalent of the parametric paired Student’s t-test) was applied to compare each attentional condition to the baseline condition. Correction for multiple comparisons was applied separately for each region and band: corrected P-values were obtained via the Bonferroni correction by multiplying the raw P-values by 3, since three comparisons were made for each region and for each band.
c) Voxel-wise (cortical level) comparison of alpha power and theta power in attentional condition vs the baseline condition. For each band and each attentional condition, we statistically evaluated which cortical voxel exhibited different power compared to baseline condition. The same method as in a) (non-parametric permutation-based t-test) was adopted at the voxel level.
d) ROI-wise (cortical level) comparison of alpha power and theta power in attentional condition vs the baseline condition. For each ROI and each band of interest related to the ROI, we statistically evaluated whether the specific attentional condition modified the ROI power compared to the baseline. The same method as in b) (Wilcoxon signed rank test) was adopted at the cortical ROI level.
e) Comparison of causal influences in the alpha and theta band in attentional condition vs the baseline condition. For each band and each attentional condition, we statistically evaluated which directed causal influences between the selected ROIs were modified compared to the baseline condition. In this case too, the nonparametric permutation-based t-test was used adopting the same procedure as in a) and in c). Furthermore, we summarized some connectivity aspects (e.g. overall flow from one ROI to a set of other ROIs), by averaging across the corresponding connectivity values and we tested whether the specific attentional condition modified this overall connectivity compared to the baseline by using the Wilcoxon signed rank test (same method as in b) and d)).
Fig. 2 shows the scalp maps of theta power in each session, the scalp maps of theta power difference between each attentional condition and rest, and the results of the corresponding channel-wise statistical analysis. Fig. 3 displays the same information as to alpha power. According to results in Fig. 2, engagement in the mental math task (IntAtt) was associated with frontal midline theta increase. Conversely, in ExtAtt, theta power increased only at parieto-occipital electrodes. In IntExtAtt condition, i.e. when the mental task had to be performed against task-irrelevant pictures, frontal-midline theta showed a strong increase, overcoming that observed in IntAtt condition; furthermore, theta increased at posterior electrodes too. As to alpha power (Fig. 3), the ExtAtt induced a dramatic decrease of alpha activity especially at parieto-occipital sites, an effect well expected due to visual stimulation. In IntAtt condition, alpha power tended to increase at the more posterior sites, although significance was not reached at any electrode. Finally, results obtained in IntExtAtt are especially interesting: indeed, the same visual stimuli as in ExtAtt applied during the math task were associated with a much smaller alpha power decrease at posterior sites, with no statistical significance.
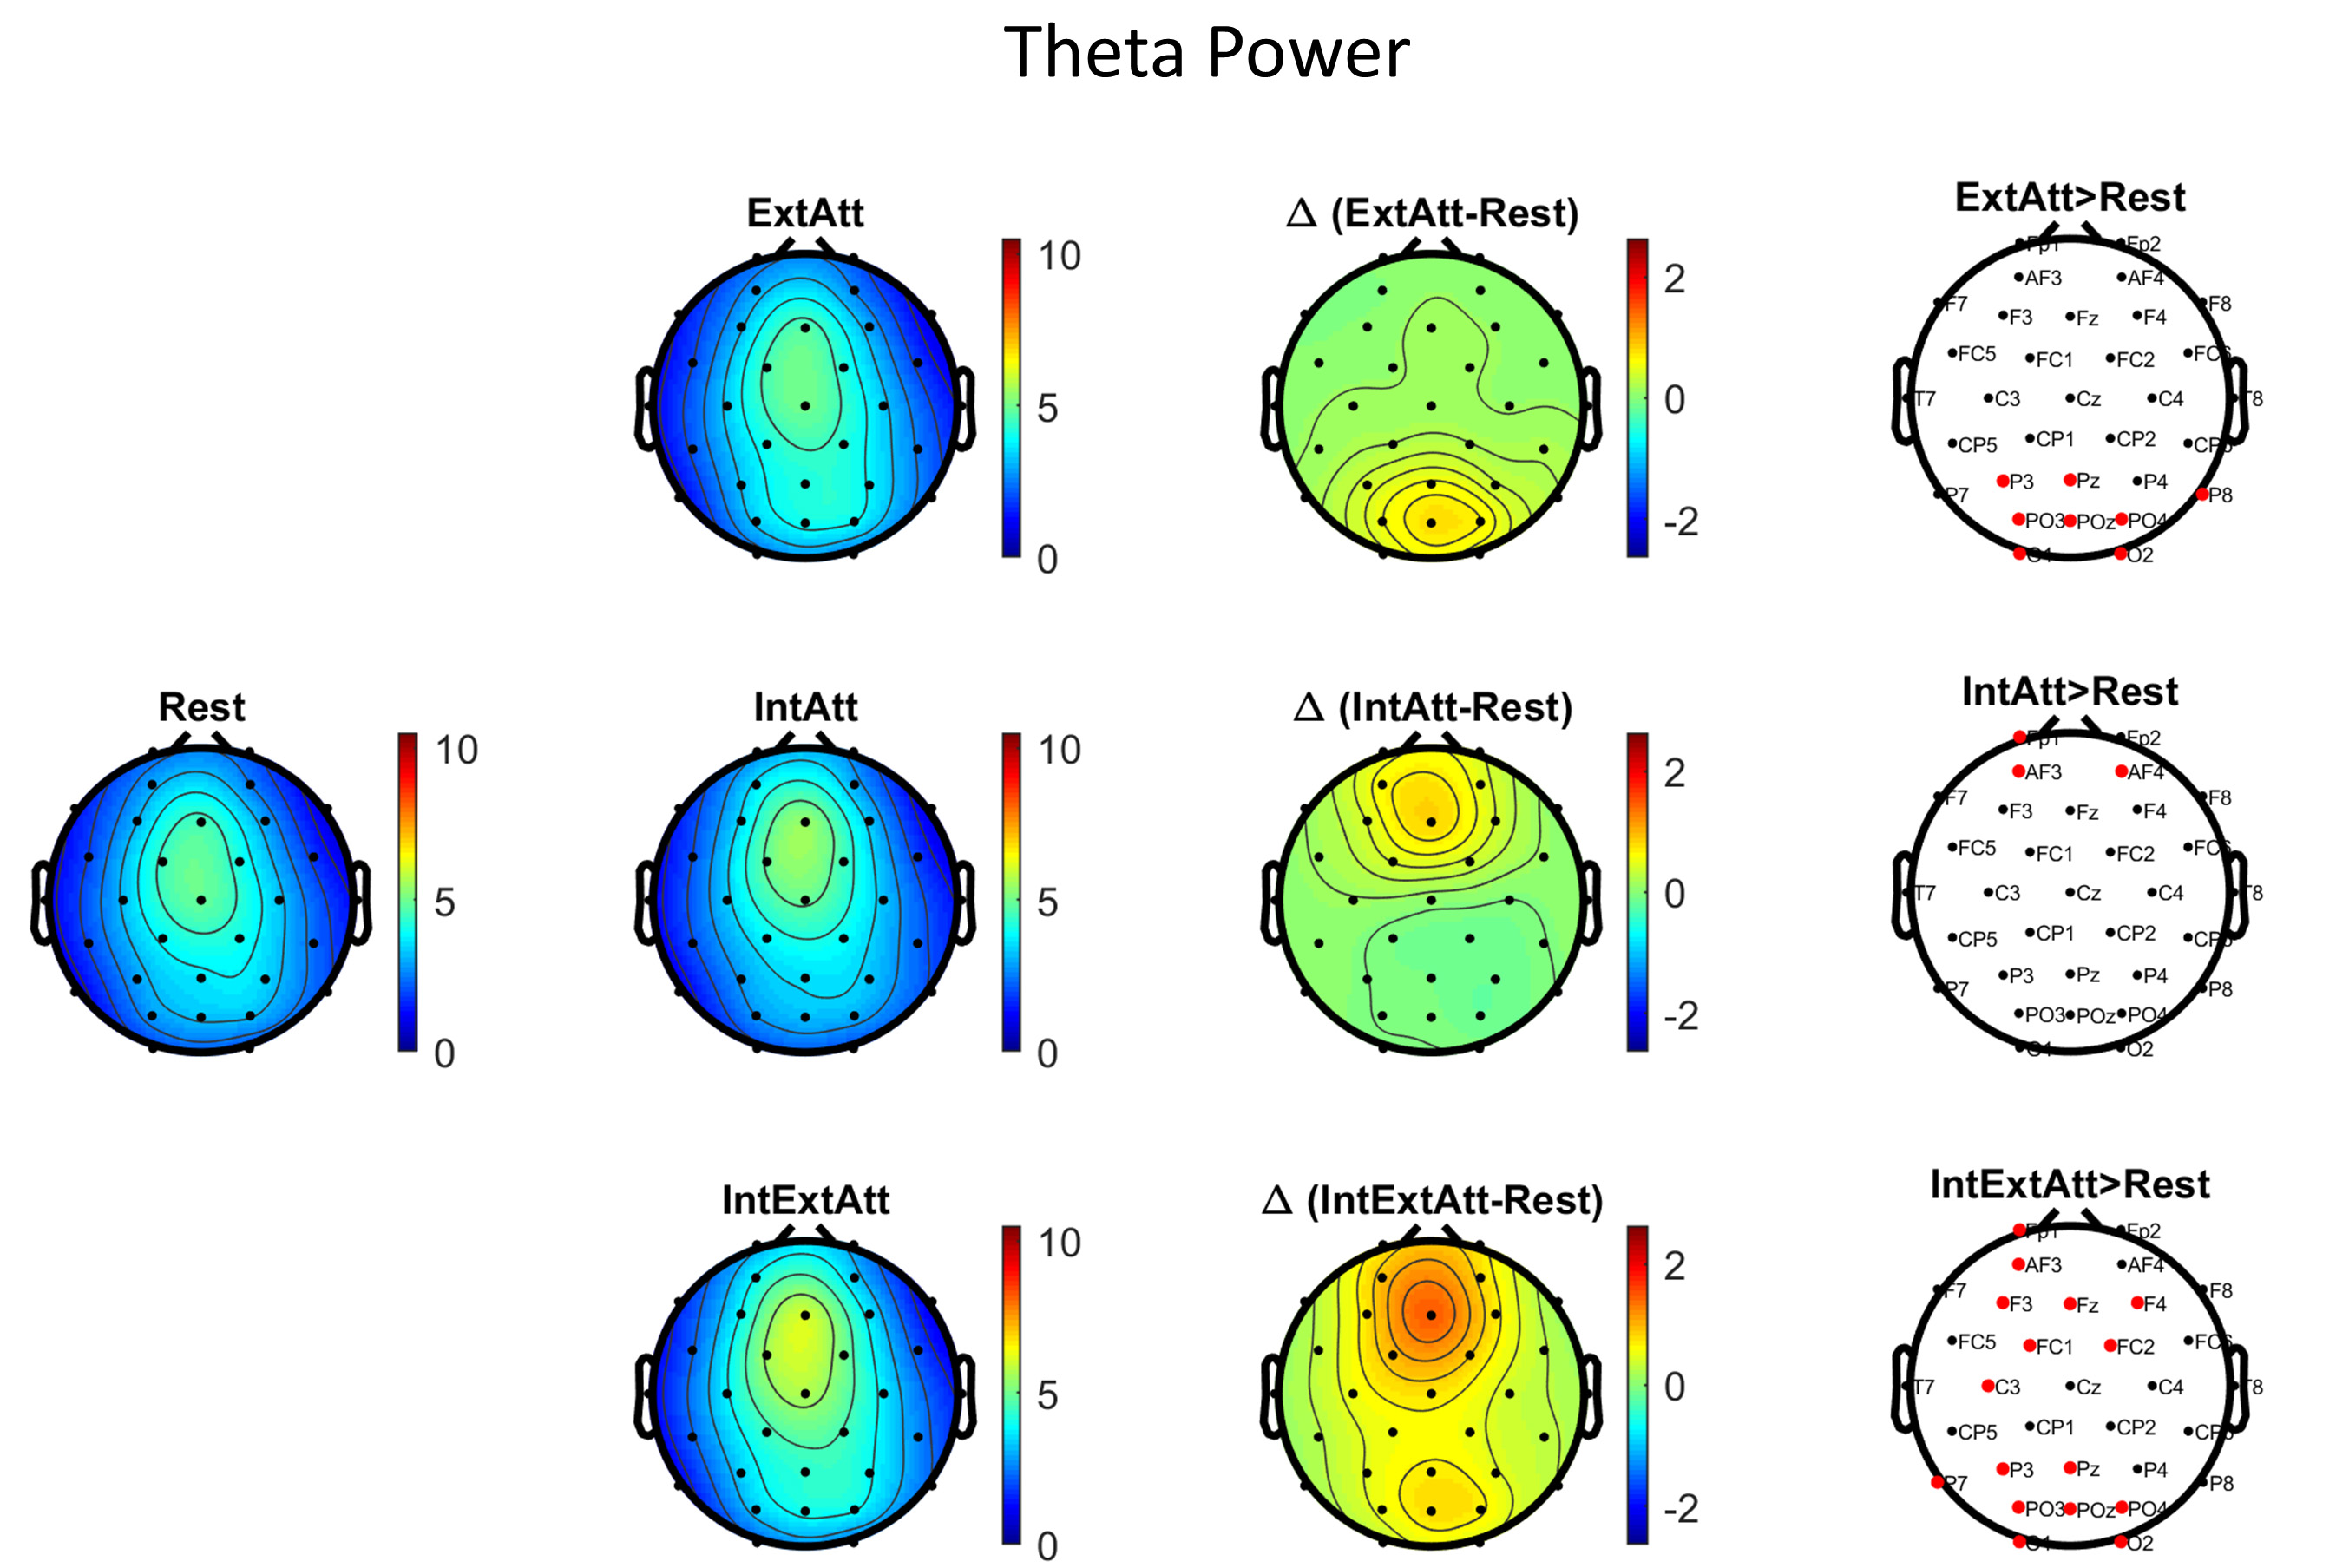 Fig. 2.
Scalp maps and channel-wise statistical analysis for theta
power. The maps in the first and second column represent the theta power
(
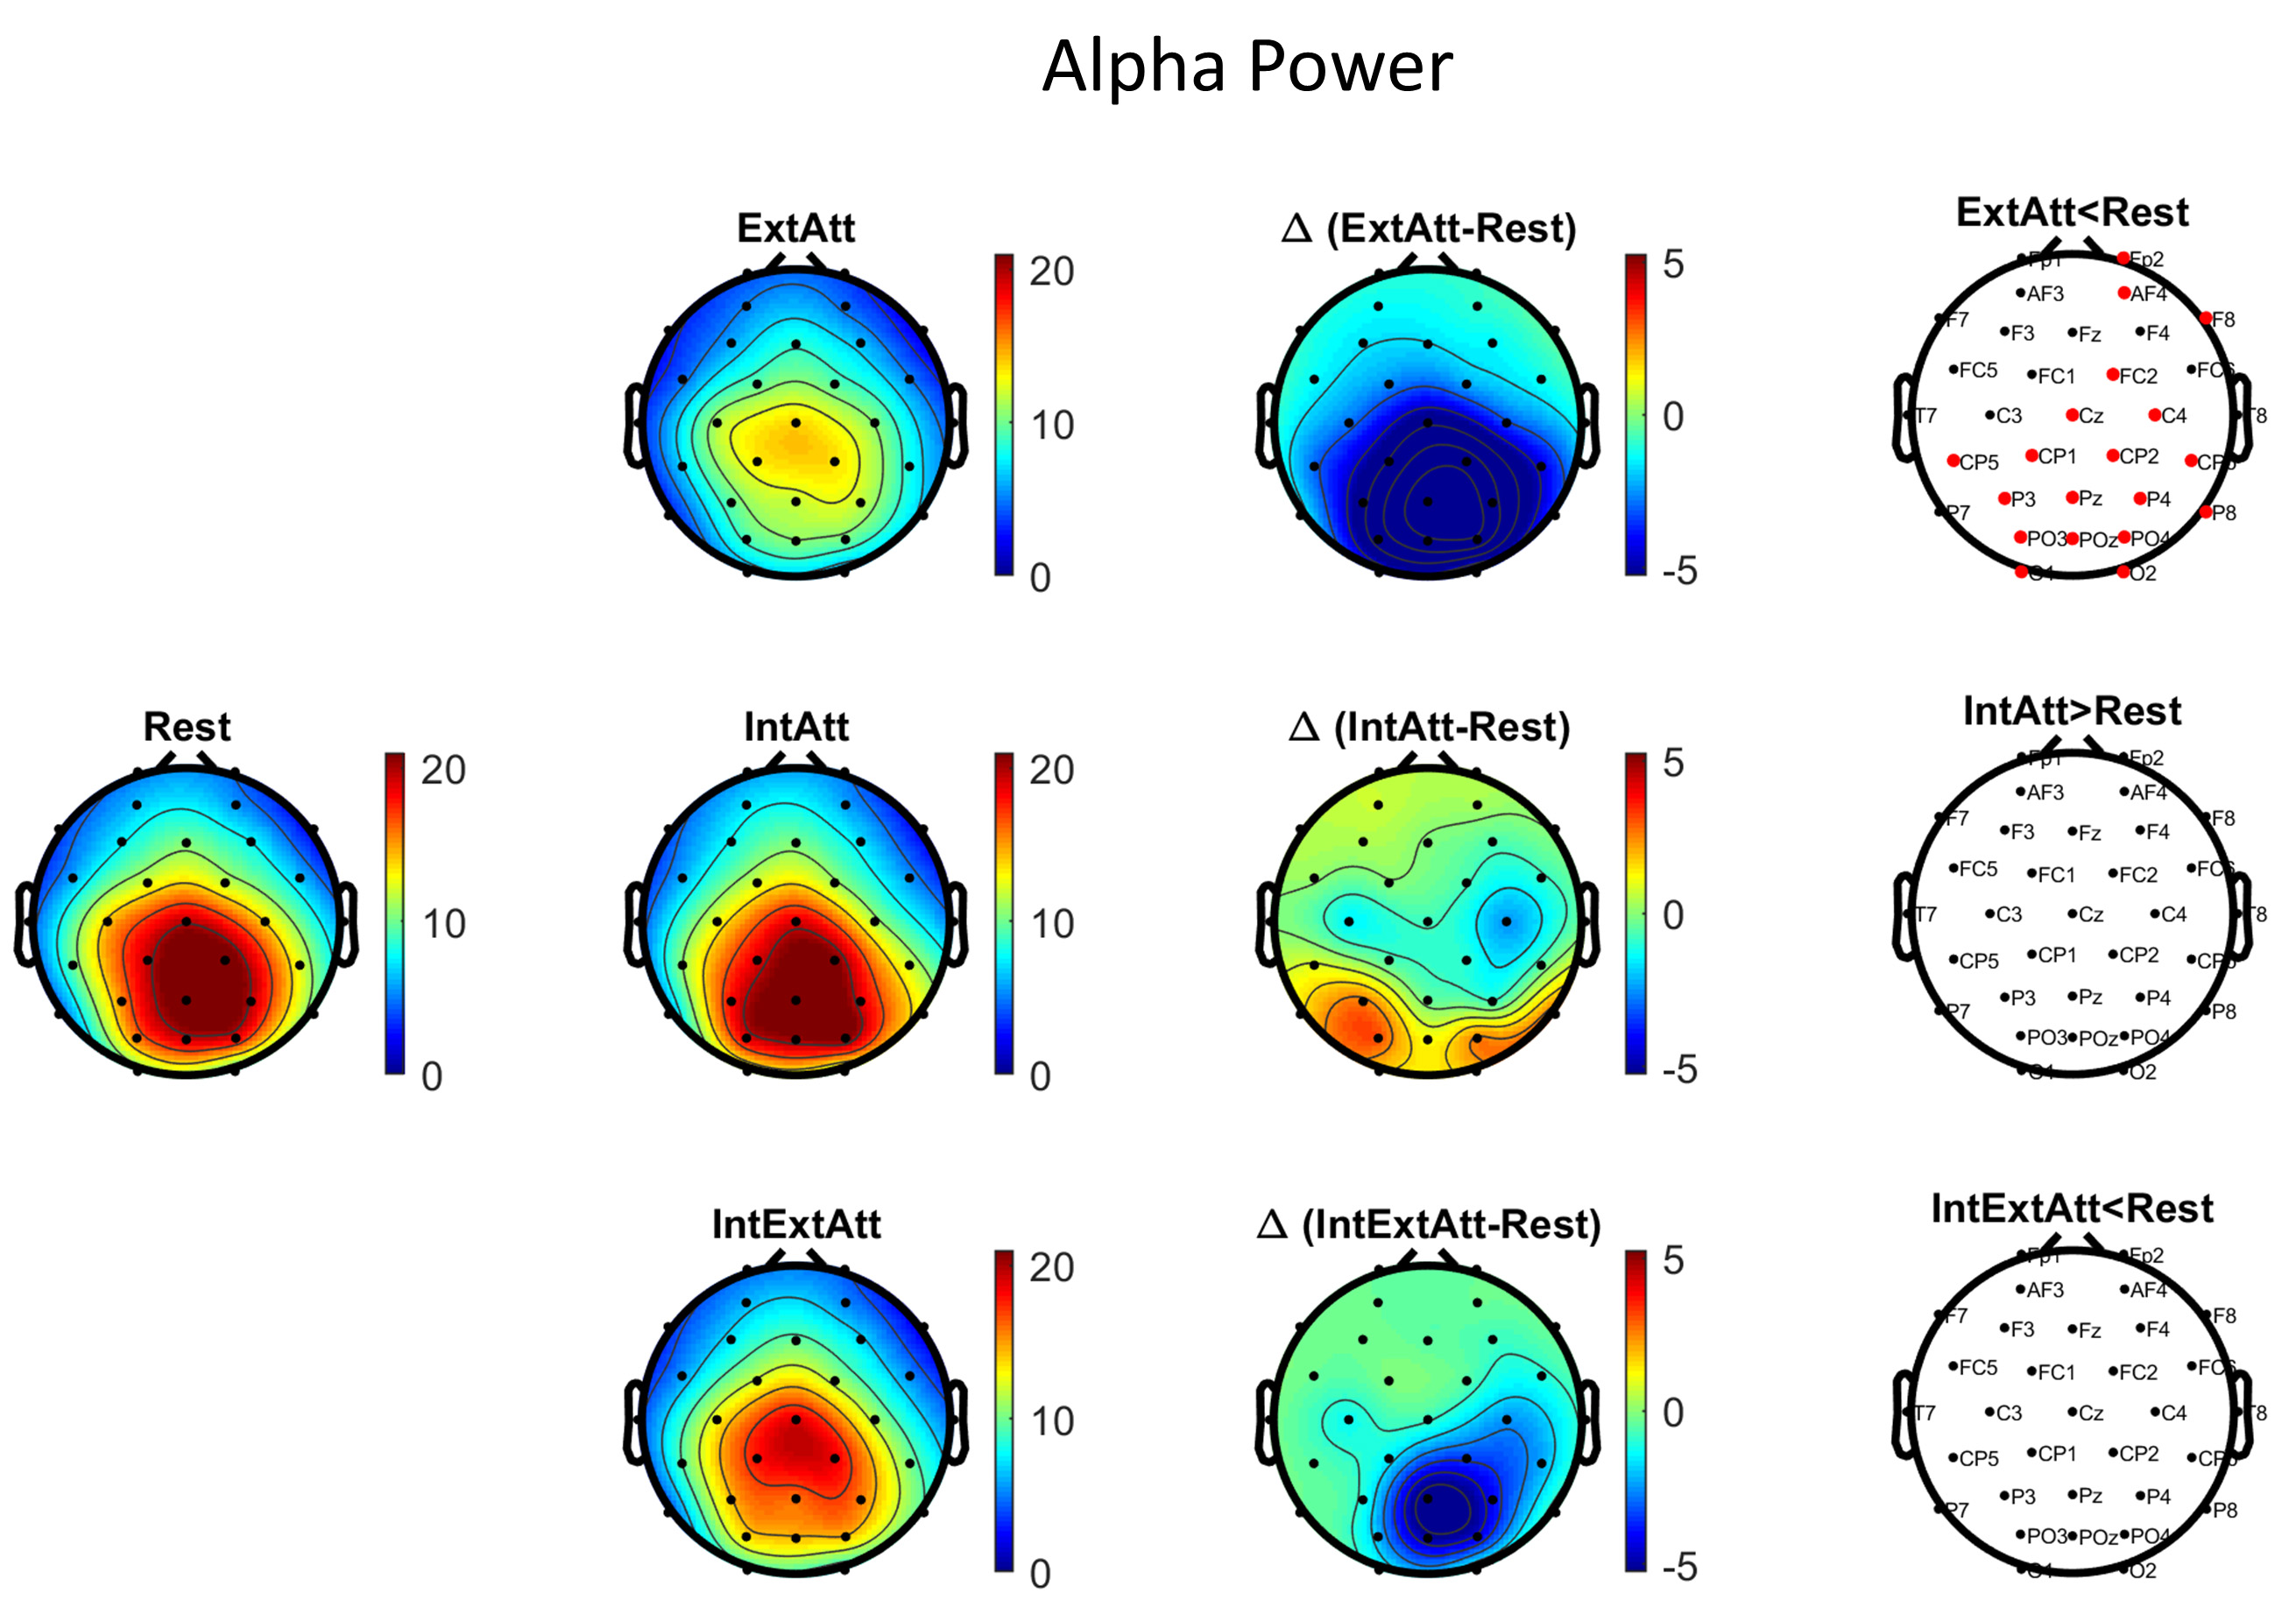 Fig. 3.
Scalp maps and channel-wise statistical analysis for alpha
power. The maps in the first and second column represent the alpha power
(
A summary of the previous results is represented in Fig. 4, which displays the theta and alpha power changes within the two scalp macro-regions (anterior and posterior, see Section 2.3.3), as a function of the attentional condition. The bar plots emphasized a different pattern of theta activity at the anterior and posterior region. Anterior theta activity exhibited the trend to progressively increase across the three conditions and reached the largest value in the IntExtAtt condition, in agreement with its relation with internal attention. Posteriorly, theta increase occurred to a similar extent in the two conditions involving picture presentation (ExtAtt and IntExtAtt) and was absent in IntAtt condition. Alpha power at the posterior region confirmed a significant decreased in ExtAtt but not in IntExtAtt condition, and a tendency to increase (but with high variability) in the IntAtt condition.
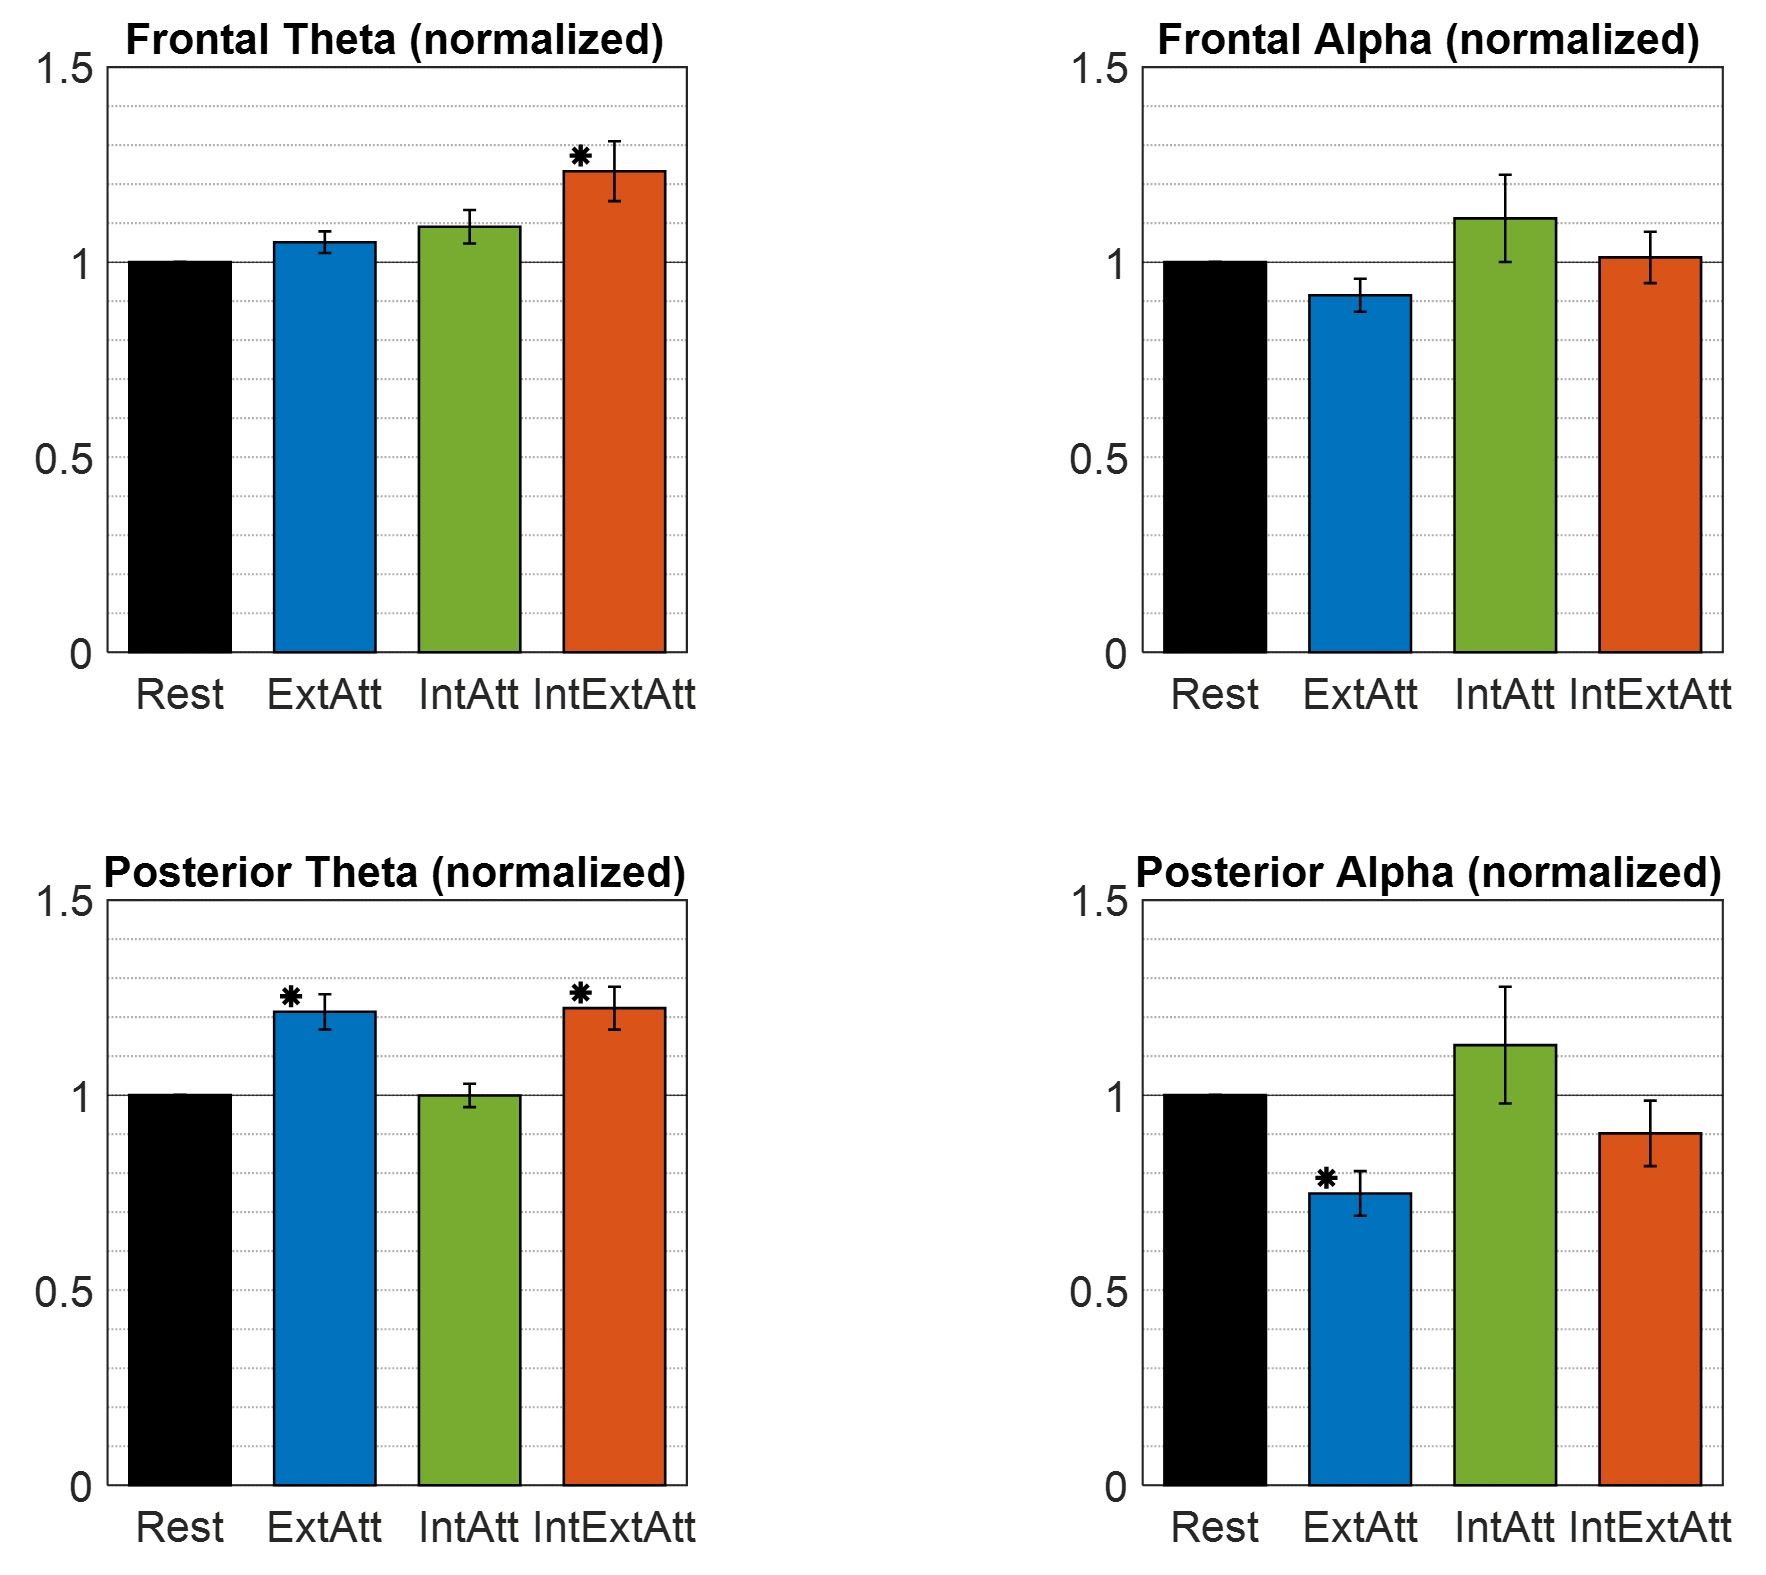 Fig. 4.
Theta power and alpha power computed at the two scalp
macro-regions (anterior and posterior) in each experimental condition, and
normalized to the rest condition. Powers at the anterior and posterior regions
were obtained via arithmetic average across frontal electrodes (Fp1, Fp2, AF3,
AF4, F3, Fz, F4, FC1, FC2) and parieto-occipital electrodes (P3, Pz, P4, PO3,
POz, PO4, O1, O2) respectively (see Section 2.3.3). Each bar represents the mean
The comparisons between each attentional condition and rest at the level of voxels are presented in Fig. 5 as to theta power and in Fig. 6 as to alpha power. For each comparison, the voxel-by-voxel power difference is represented, together with the results of the voxel-wise statistical analysis. Table 1 indicates, for each attentional condition, which of the selected ROIs were significantly implicated in power change on the basis of the voxel-wise statistical analysis (see Supplementary Material Section S3 and Supplementary Tables 2-6 for the list of all cortical voxels significantly involved).
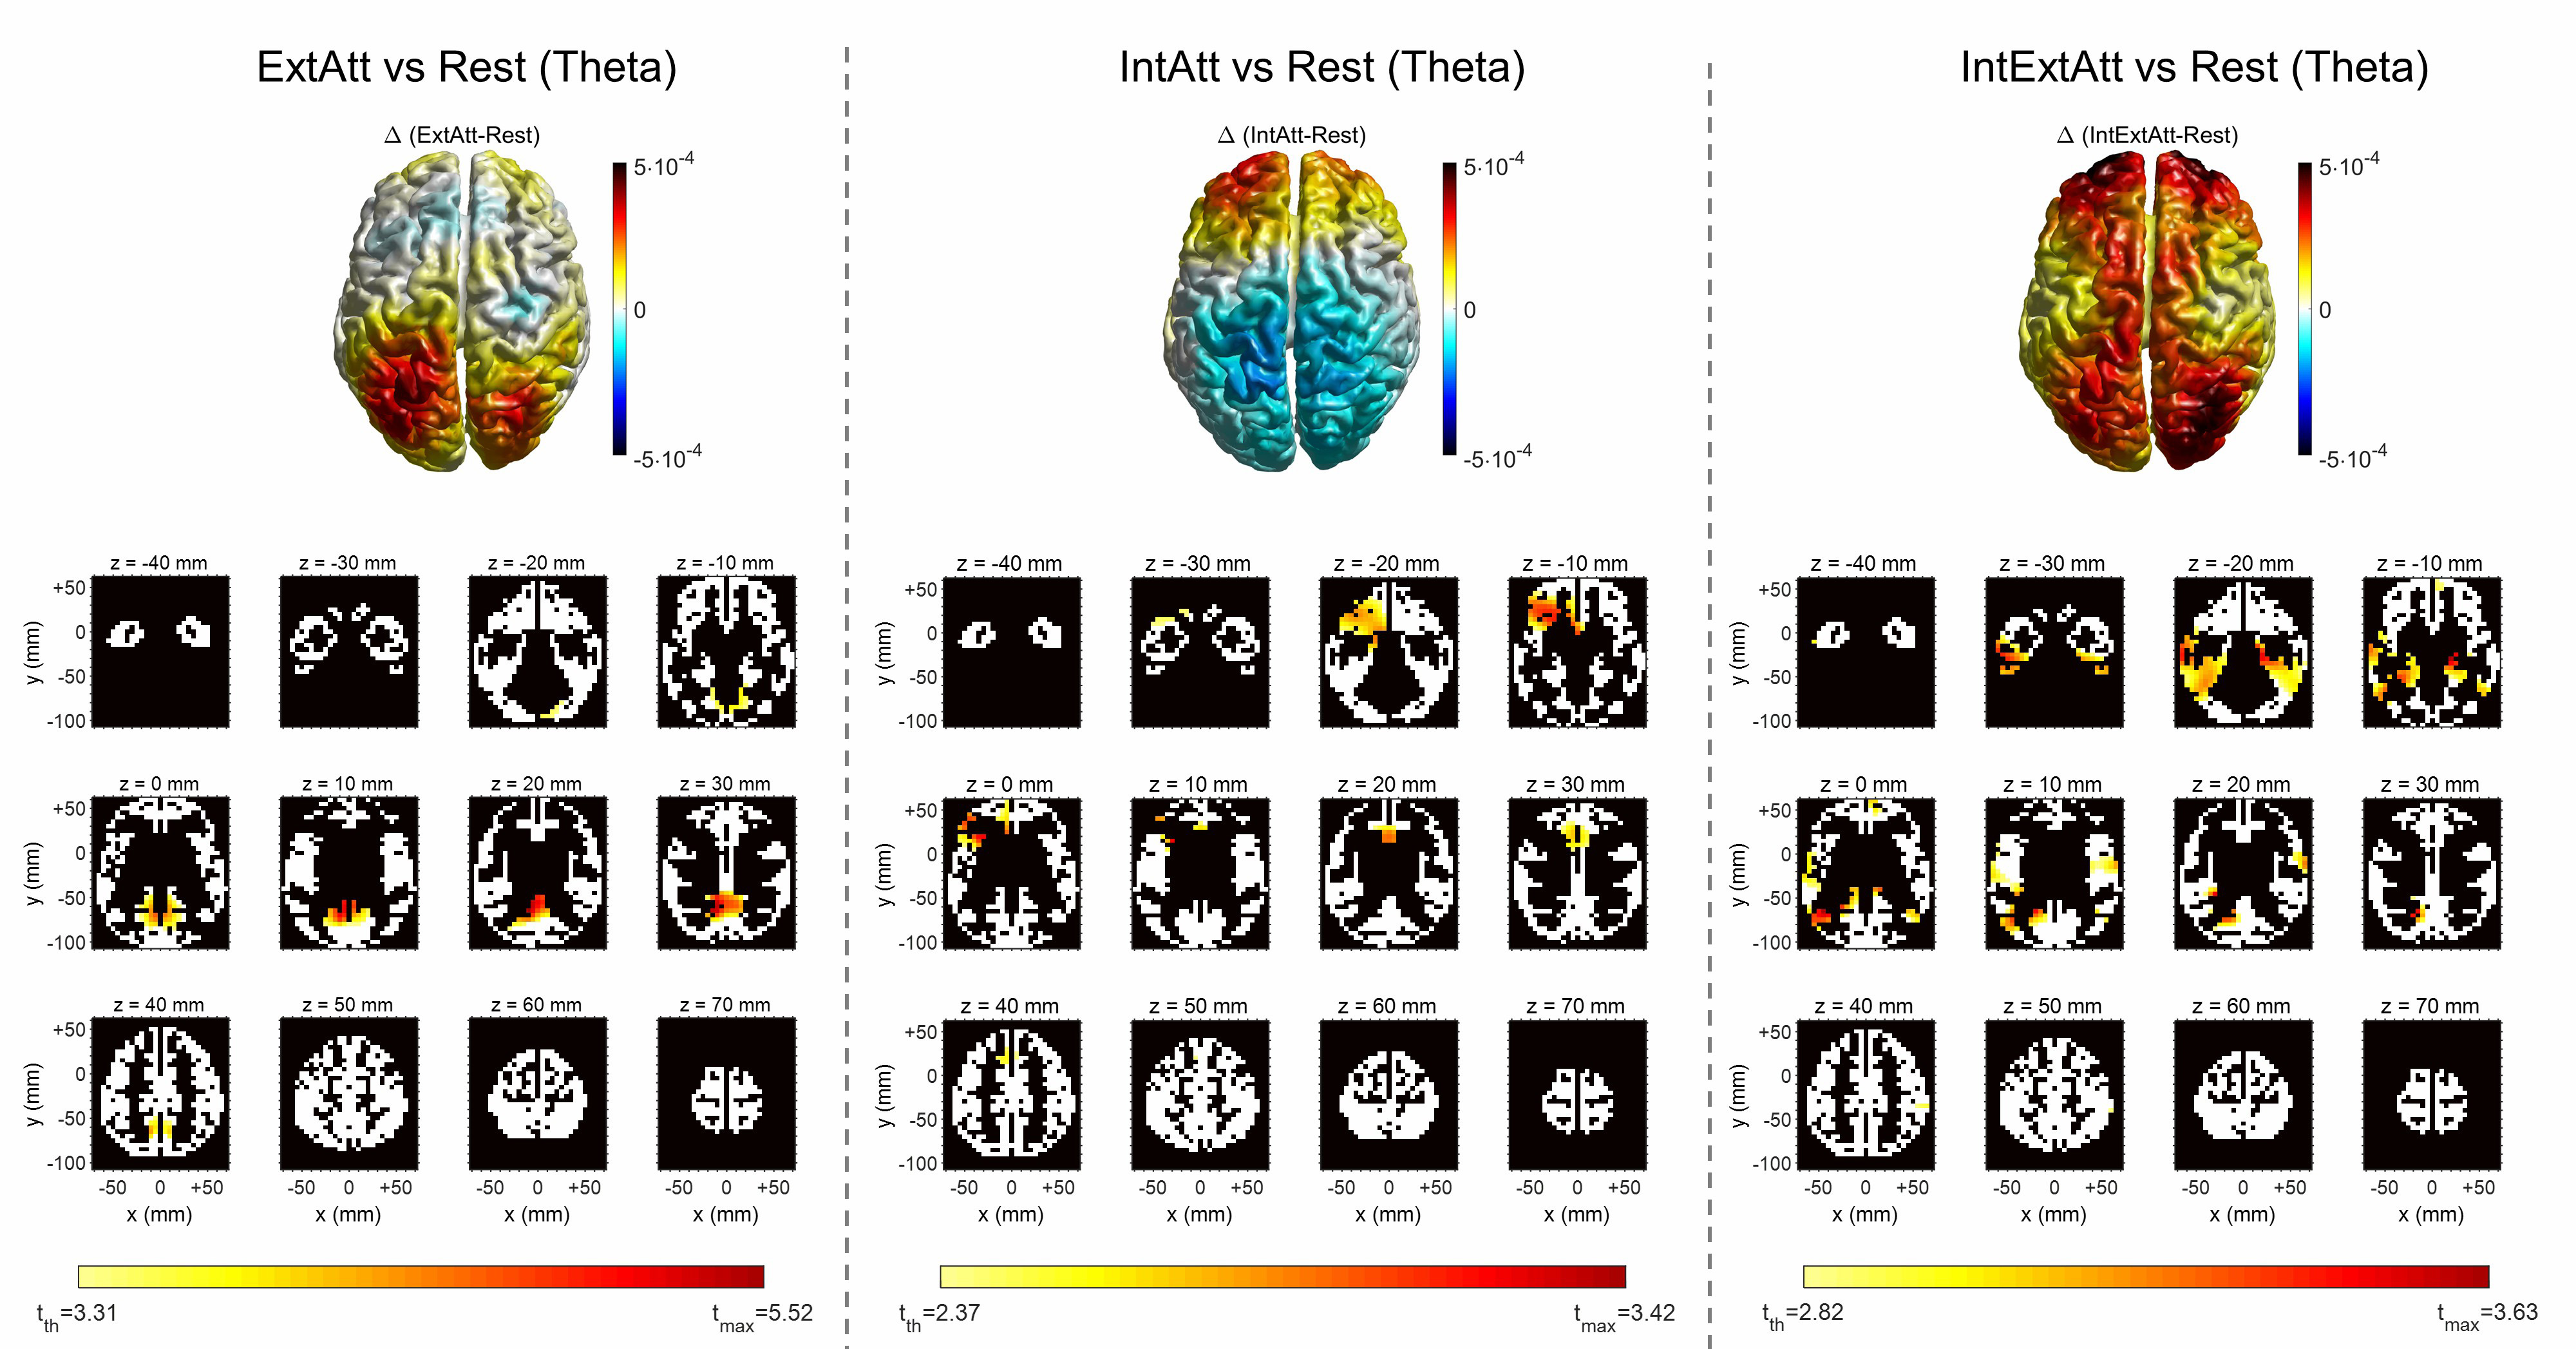 Fig. 5.
Voxel-wise comparison of theta power between each attentional
condition and rest. For each attentional condition, the 3D top view of the
cortex shows the theta power difference ((
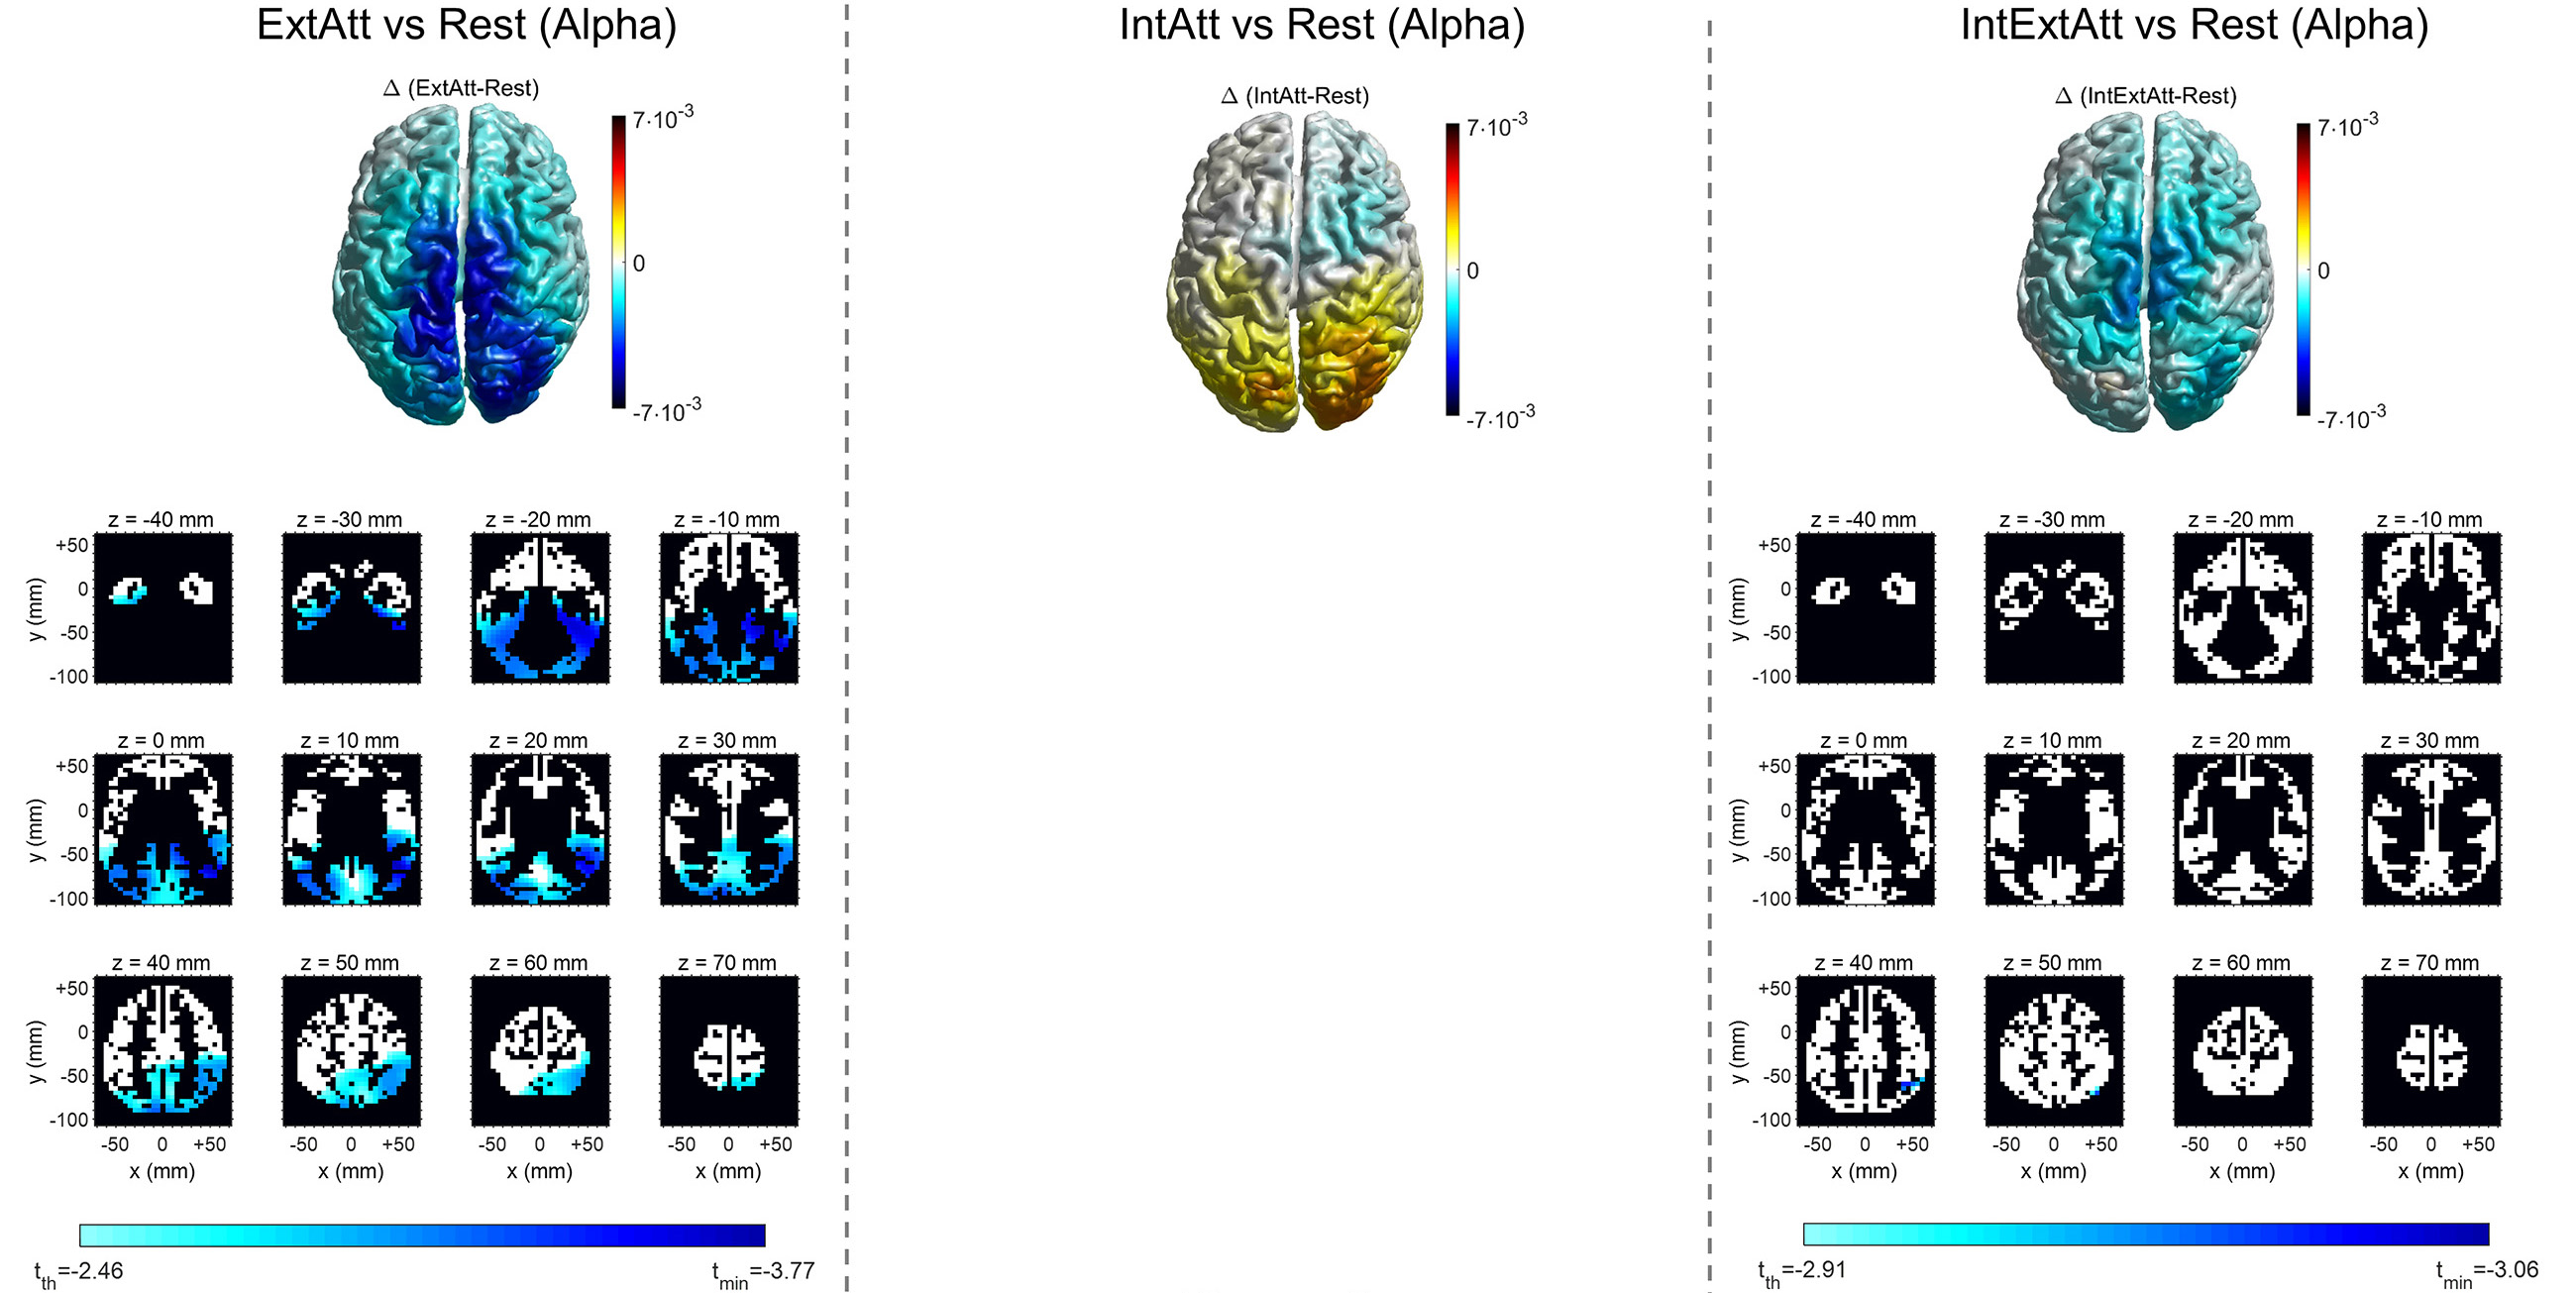 Fig. 6.
Voxel-wise comparison of alpha power between each attentional
condition and rest. For each attentional condition, the 3D top view of the
cortex shows the alpha power difference ((
| Theta-Band Analysis | ||||||
| ExtAtt |
IntAtt |
IntExtAtt | ||||
| ROI | n. voxels | t-value | n. voxels | t-value | n. voxels | t-value |
| ACC | - | - | 69 | 3.18 | 3 | 3.05 |
| ITG |
- | - | - | - | 61 | 3.44 |
| ITG |
- | - | - | - | 33 | 3.12 |
| PCU | 34 | 4.97 | - | - | 3 | 2.90 |
| LGCU |
42 | 4.72 | - | - | 19 | 3.25 |
| LGU |
29 | 4.82 | - | - | - | - |
| LGCU |
49 | 4.34 | - | - | - | - |
| Alpha-Band Analysis | ||||||
| ExtAtt |
IntAtt |
IntExtAtt | ||||
| ROI | n. voxels | t-value | n. voxels | t-value | n. voxels | t-value |
| MFG |
- | - | - | - | - | - |
| MFG |
- | - | - | - | - | - |
| ITG |
63 | -3.18 | - | - | - | - |
| ITG |
37 | -3.73 | - | - | - | - |
| LGCU |
157 | -3.33 | - | - | - | - |
| LGU |
130 | -3.33 | - | - | - | - |
| LGCU |
156 | -3.37 | - | - | - | - |
Theta power increase in ExtAtt and IntAtt was localized within a limited area of voxels in the posteromedial cortex and in the midline/left frontal cortex, respectively (Fig. 5). It is worth noticing that the cluster of statistically significant voxels in IntAtt include also the selected ACC ROI (Table 1). Furthermore, as anticipated in Section 2.3.5, the results in ExtAtt motivated the inclusion of the PCU ROI in our analysis. Indeed, the cluster exhibiting significant theta increase included also voxels belonging to this region (see Table 1 and Supplementary Table 2), and significant PCU theta increase was confirmed at the level of the entire ROI too (as shown later in Fig. 7 and discussed in Section 4.2). In IntExtAtt, significant theta increase exhibited a widespread distribution, mostly involving temporal regions (ITG too) and portion of the posteromedial cortex; a few ACC voxels were involved too. As to Alpha power (Fig. 6), the ExtAtt condition resulted in significant decrease in almost all voxels in the posterior-parietal, occipital and temporal lobes (including LGCU and ITG ROIs). In IntAtt, although alpha tended to increase at occipital regions, no significant difference was obtained at any voxel. However, the effect of internal attention on alpha power appeared evident when considering the IntExtAtt condition; at variance with ExtAtt condition, here only a small cortical cluster in the parietal cortex exhibited significant decrease.
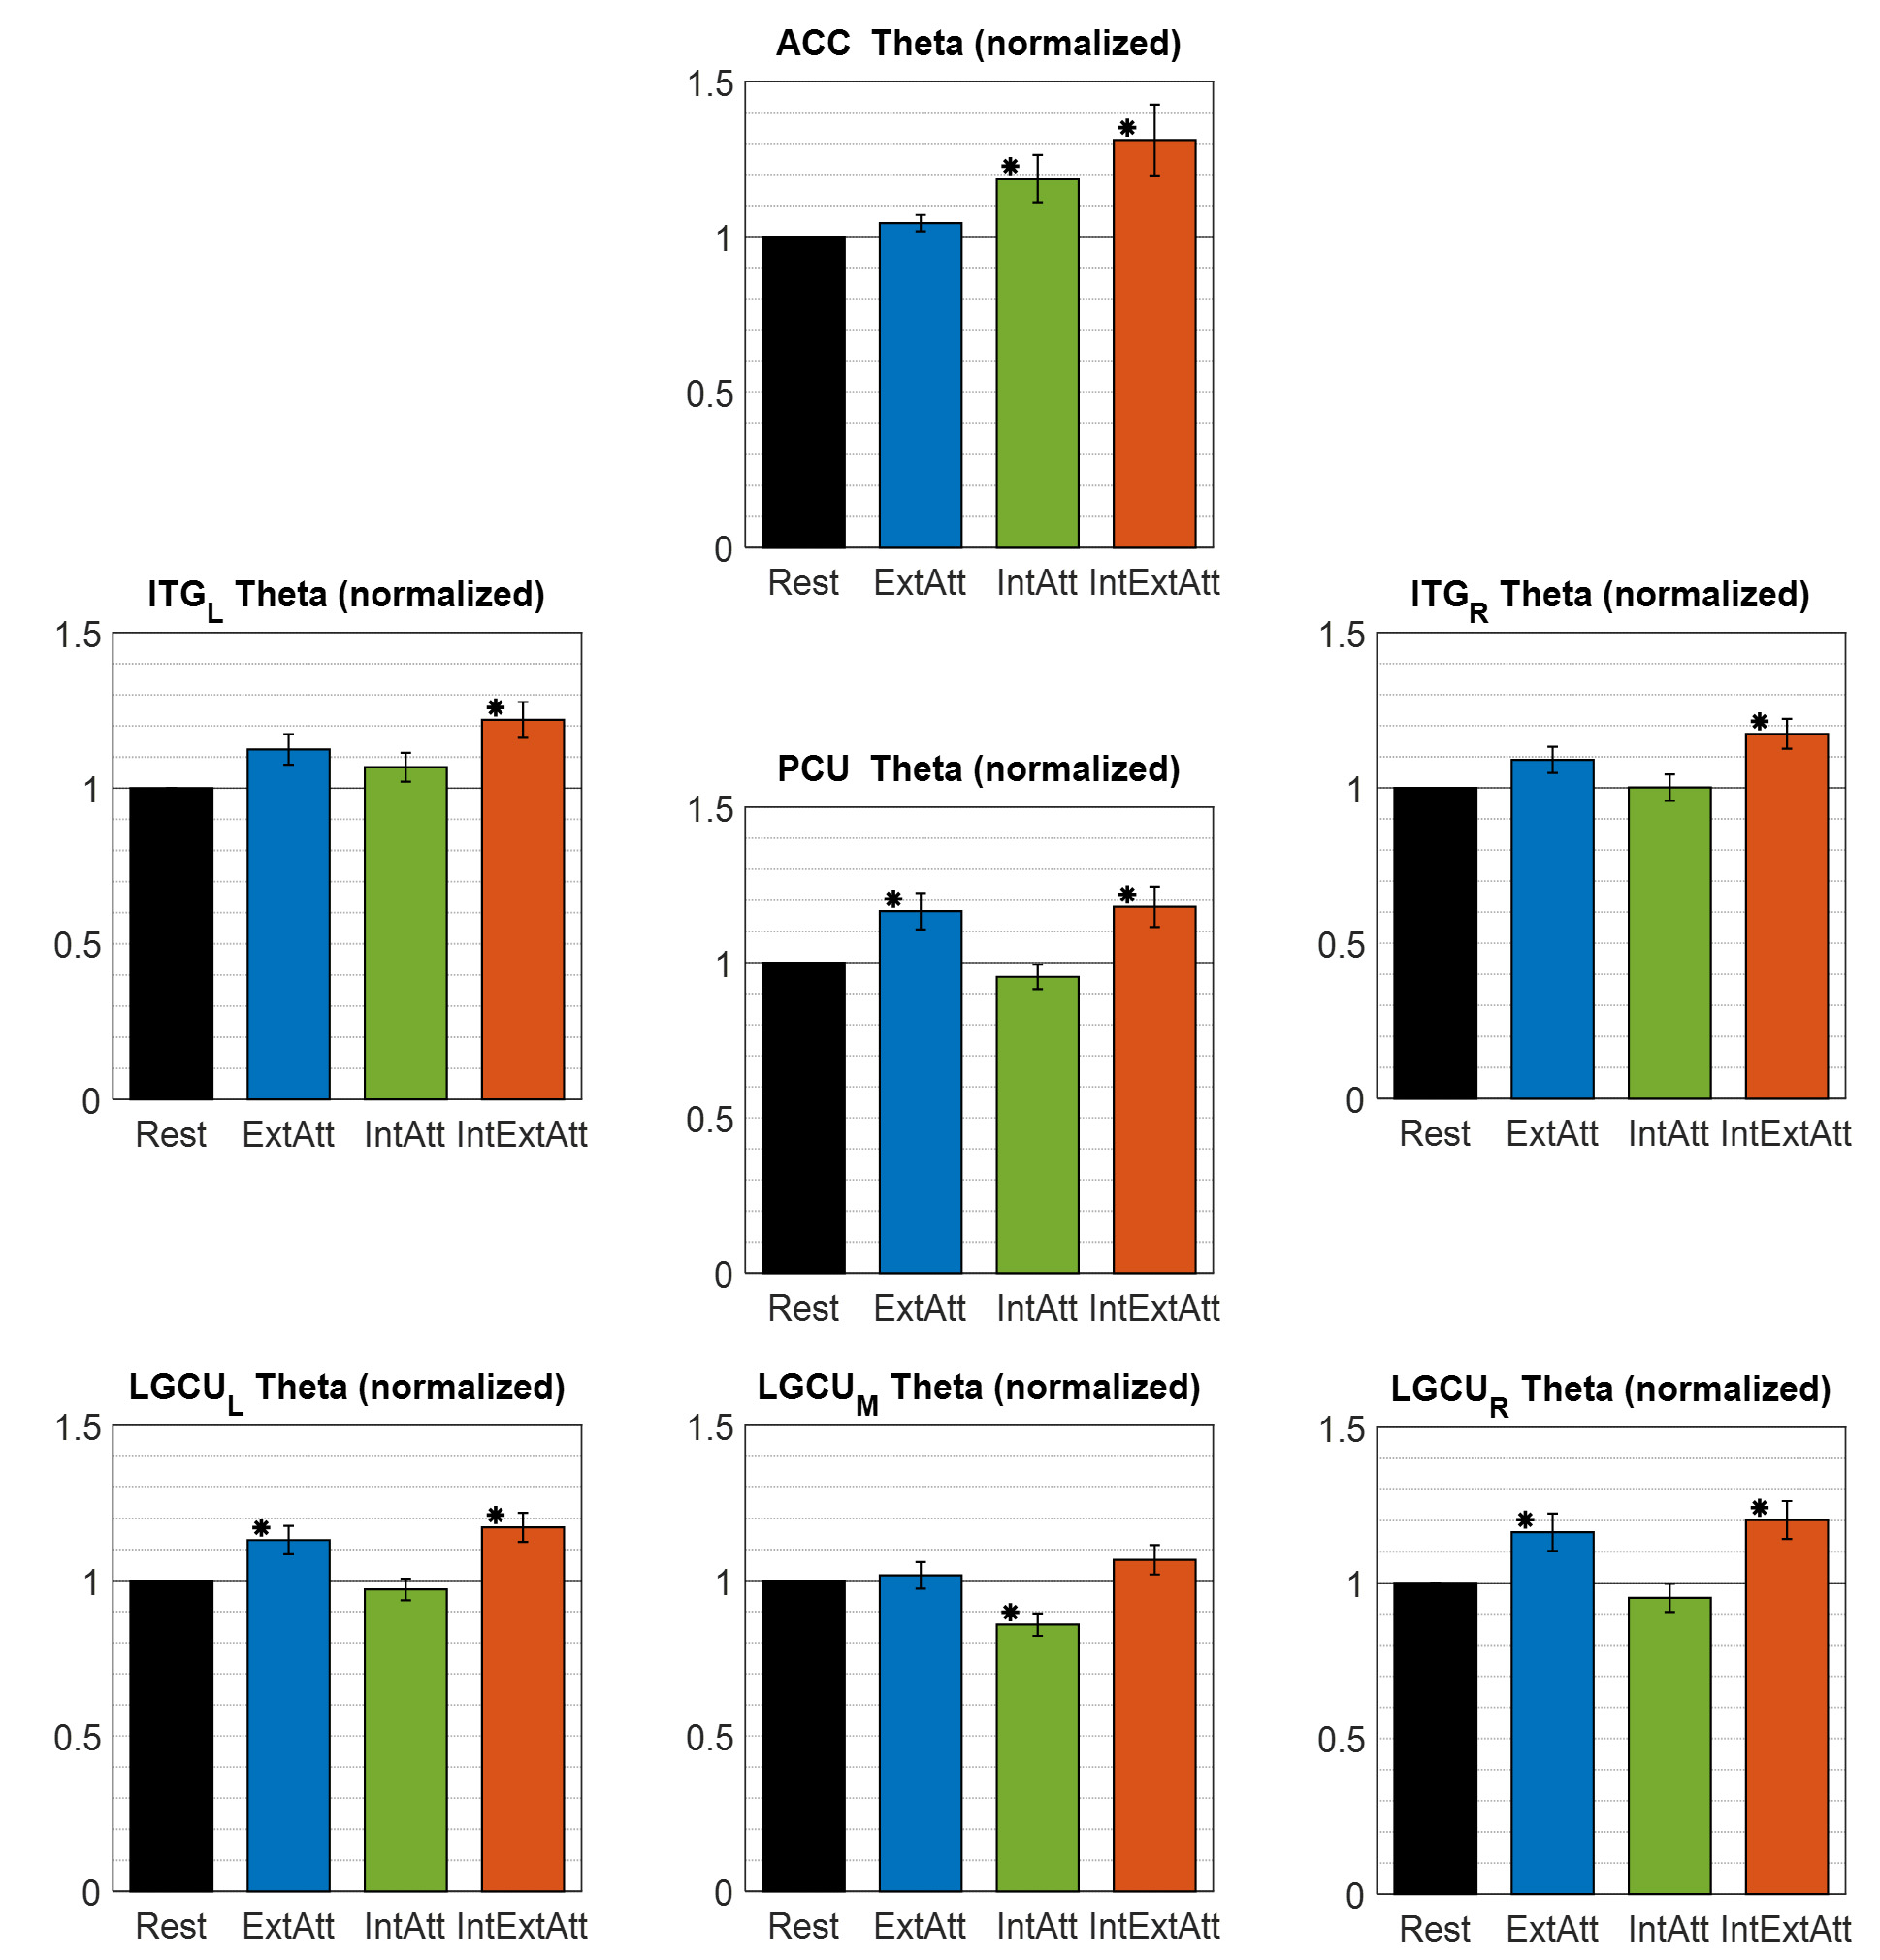 Fig. 7.
Overall theta power (obtained by averaging across all voxels
within the ROI) in each of the seven ROIs selected for the theta-band analysis,
computed in each experimental condition and normalized to the rest condition.
Each bar represents the mean
The previous analysis is useful to obtain a picture of the power changes in each
attentional condition at a fine-scale spatial resolution, and revealed that
voxels in most of the a priori selected ROIs were significantly implicated. In
order to assess the modifications of the overall power in each selected ROI
(rather than at single voxel level), Figs. 7 and 8 display the modulation of
the overall ROI power vs the attentional condition in the theta band and alpha
band, respectively. A significant increase of theta activity was seen in ACC in
the two conditions involving internal attention (IntAtt and IntExtAtt, Fig. 7),
larger when internal attention competed with the external one, identifying the
ACC as implicated in the frontal-midline theta increase observed at scalp level
in these cases (see Fig. 2). The other ROIs exhibited a different pattern of
modulation: theta increase was associated with conditions involving external
attention (ExtAtt and IntExtAtt), especially in posterior regions (except
LGCU
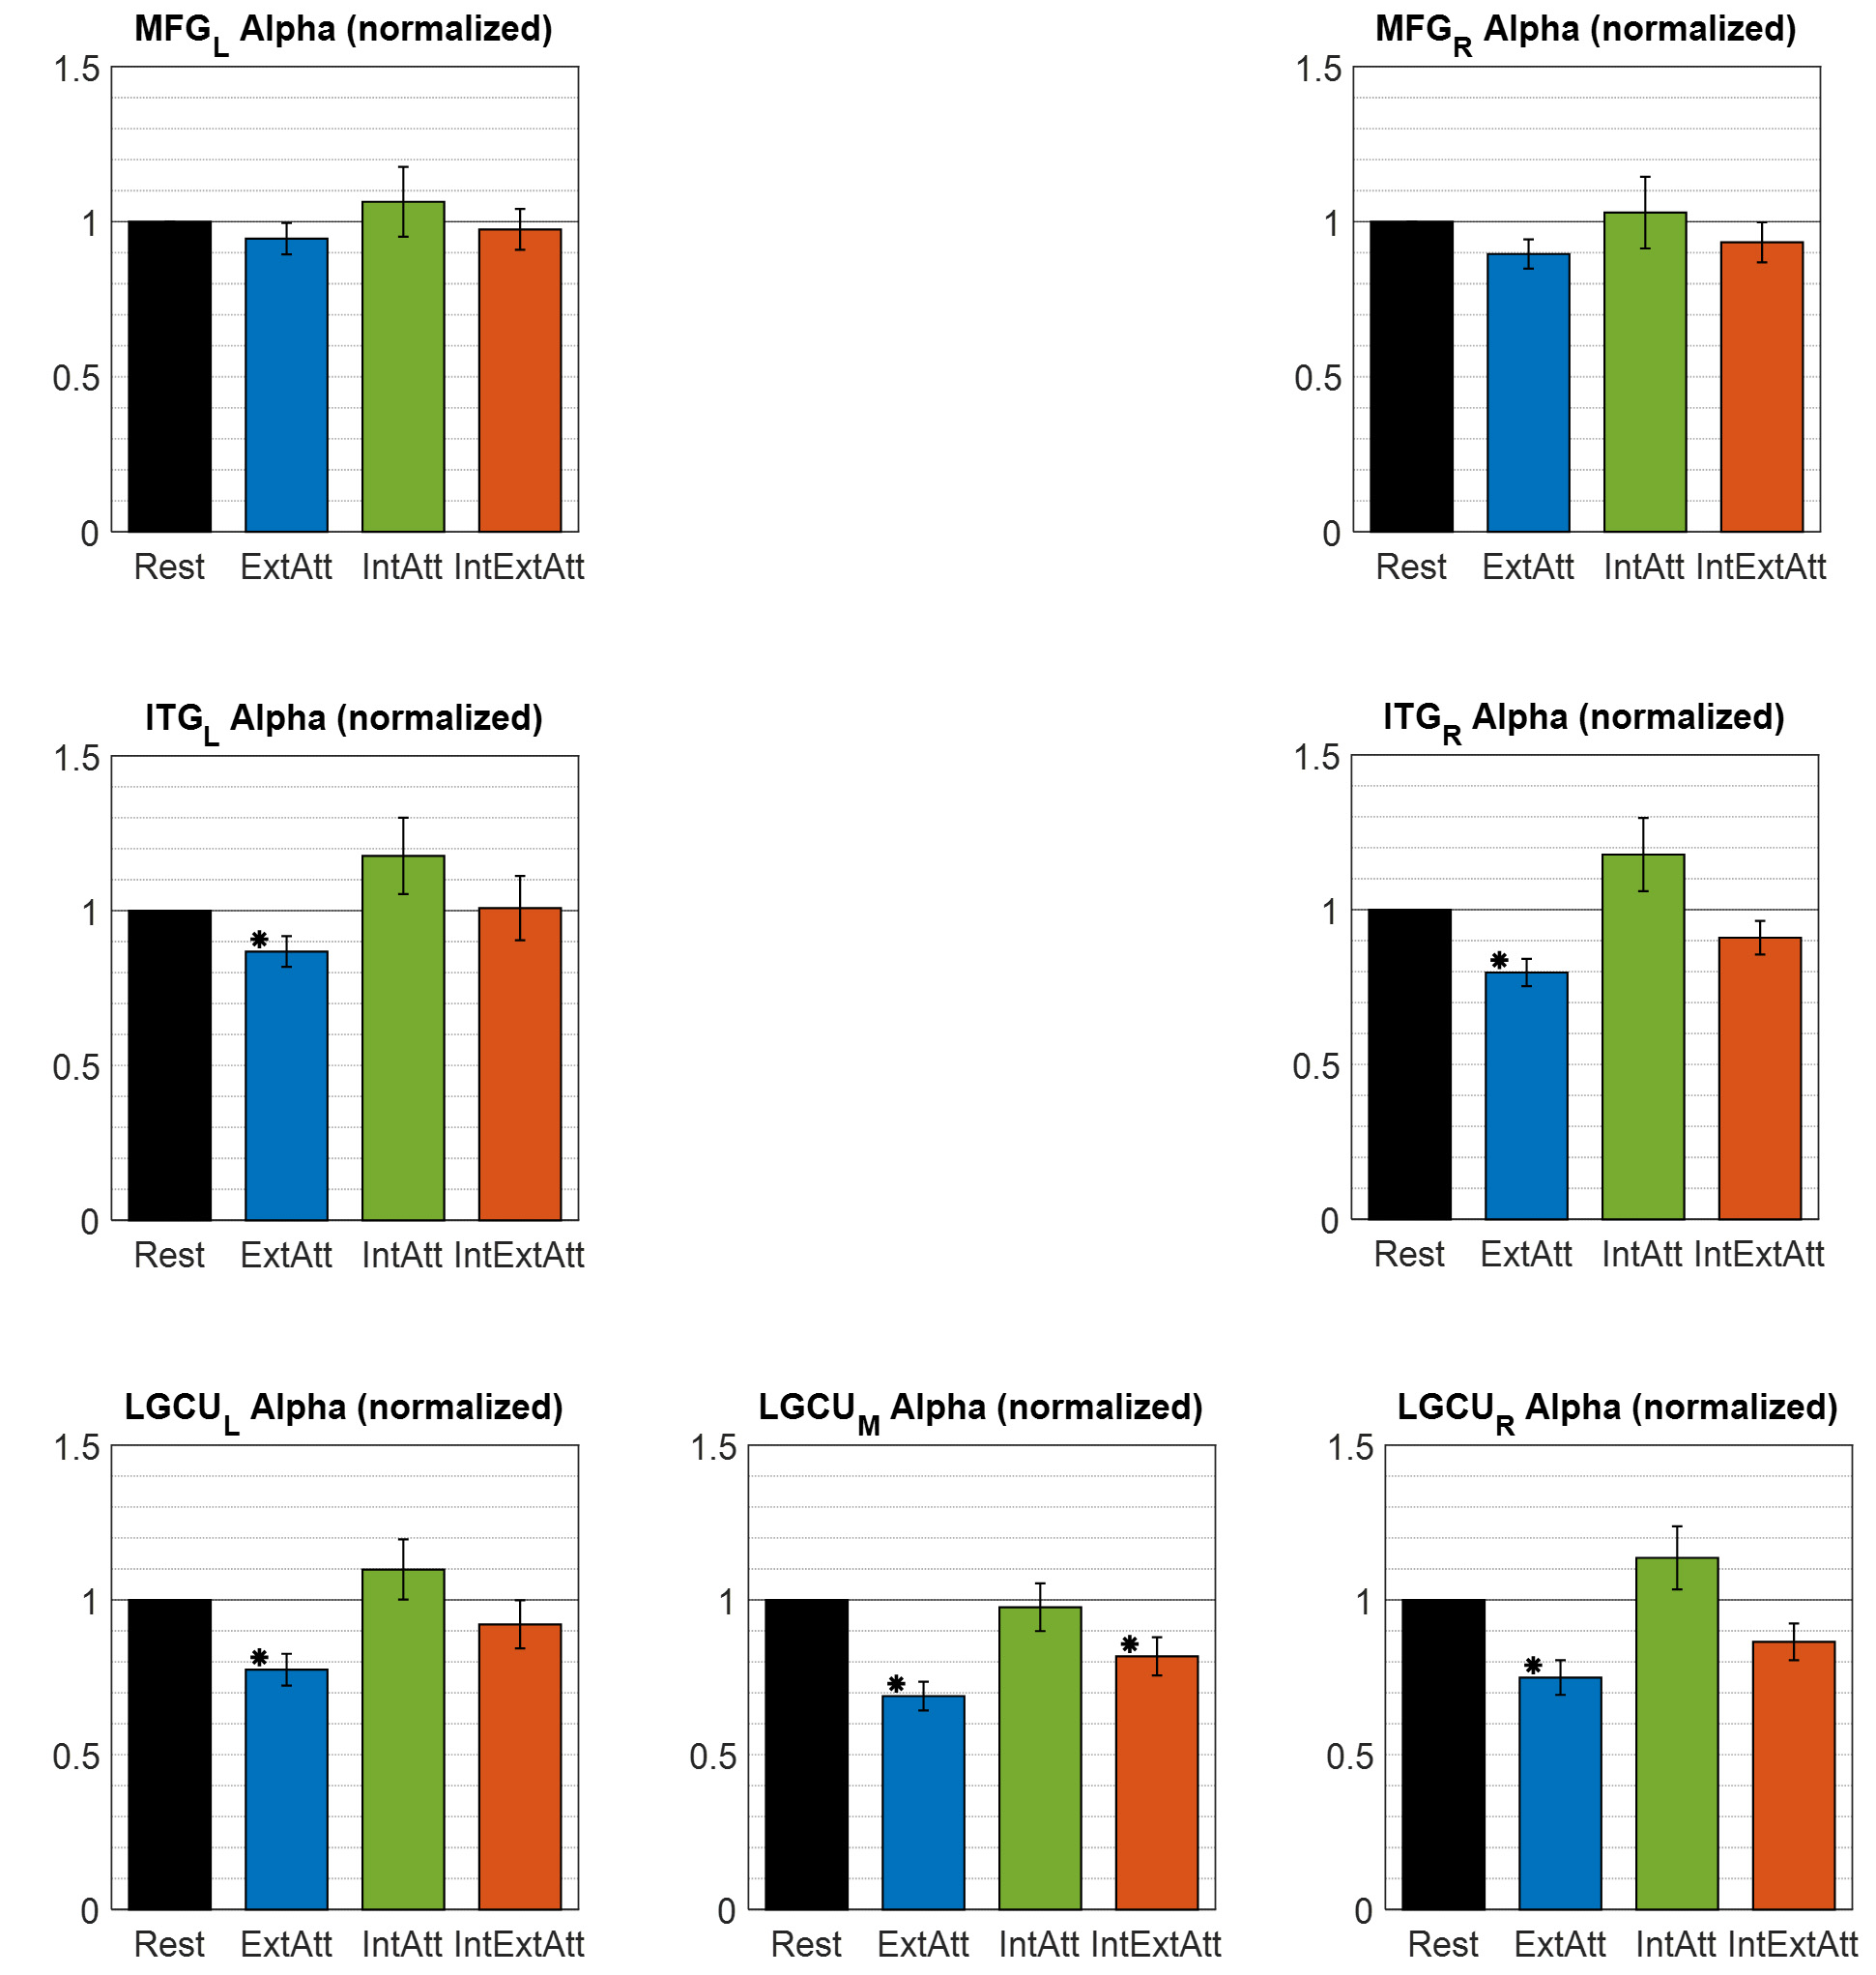 Fig. 8.
Overall alpha power (obtained by averaging across all voxels
within the ROI) in each of the seven ROIs selected for the alpha-band analysis,
computed in each experimental condition and normalized to the rest condition.
Each bar represents the mean
Figs. 9 and 10 show the results of the GC analysis for the selected ROIs in the
theta and alpha band. The colored arrows over the 3D cortical surfaces indicate
the single connections that significantly modified (P
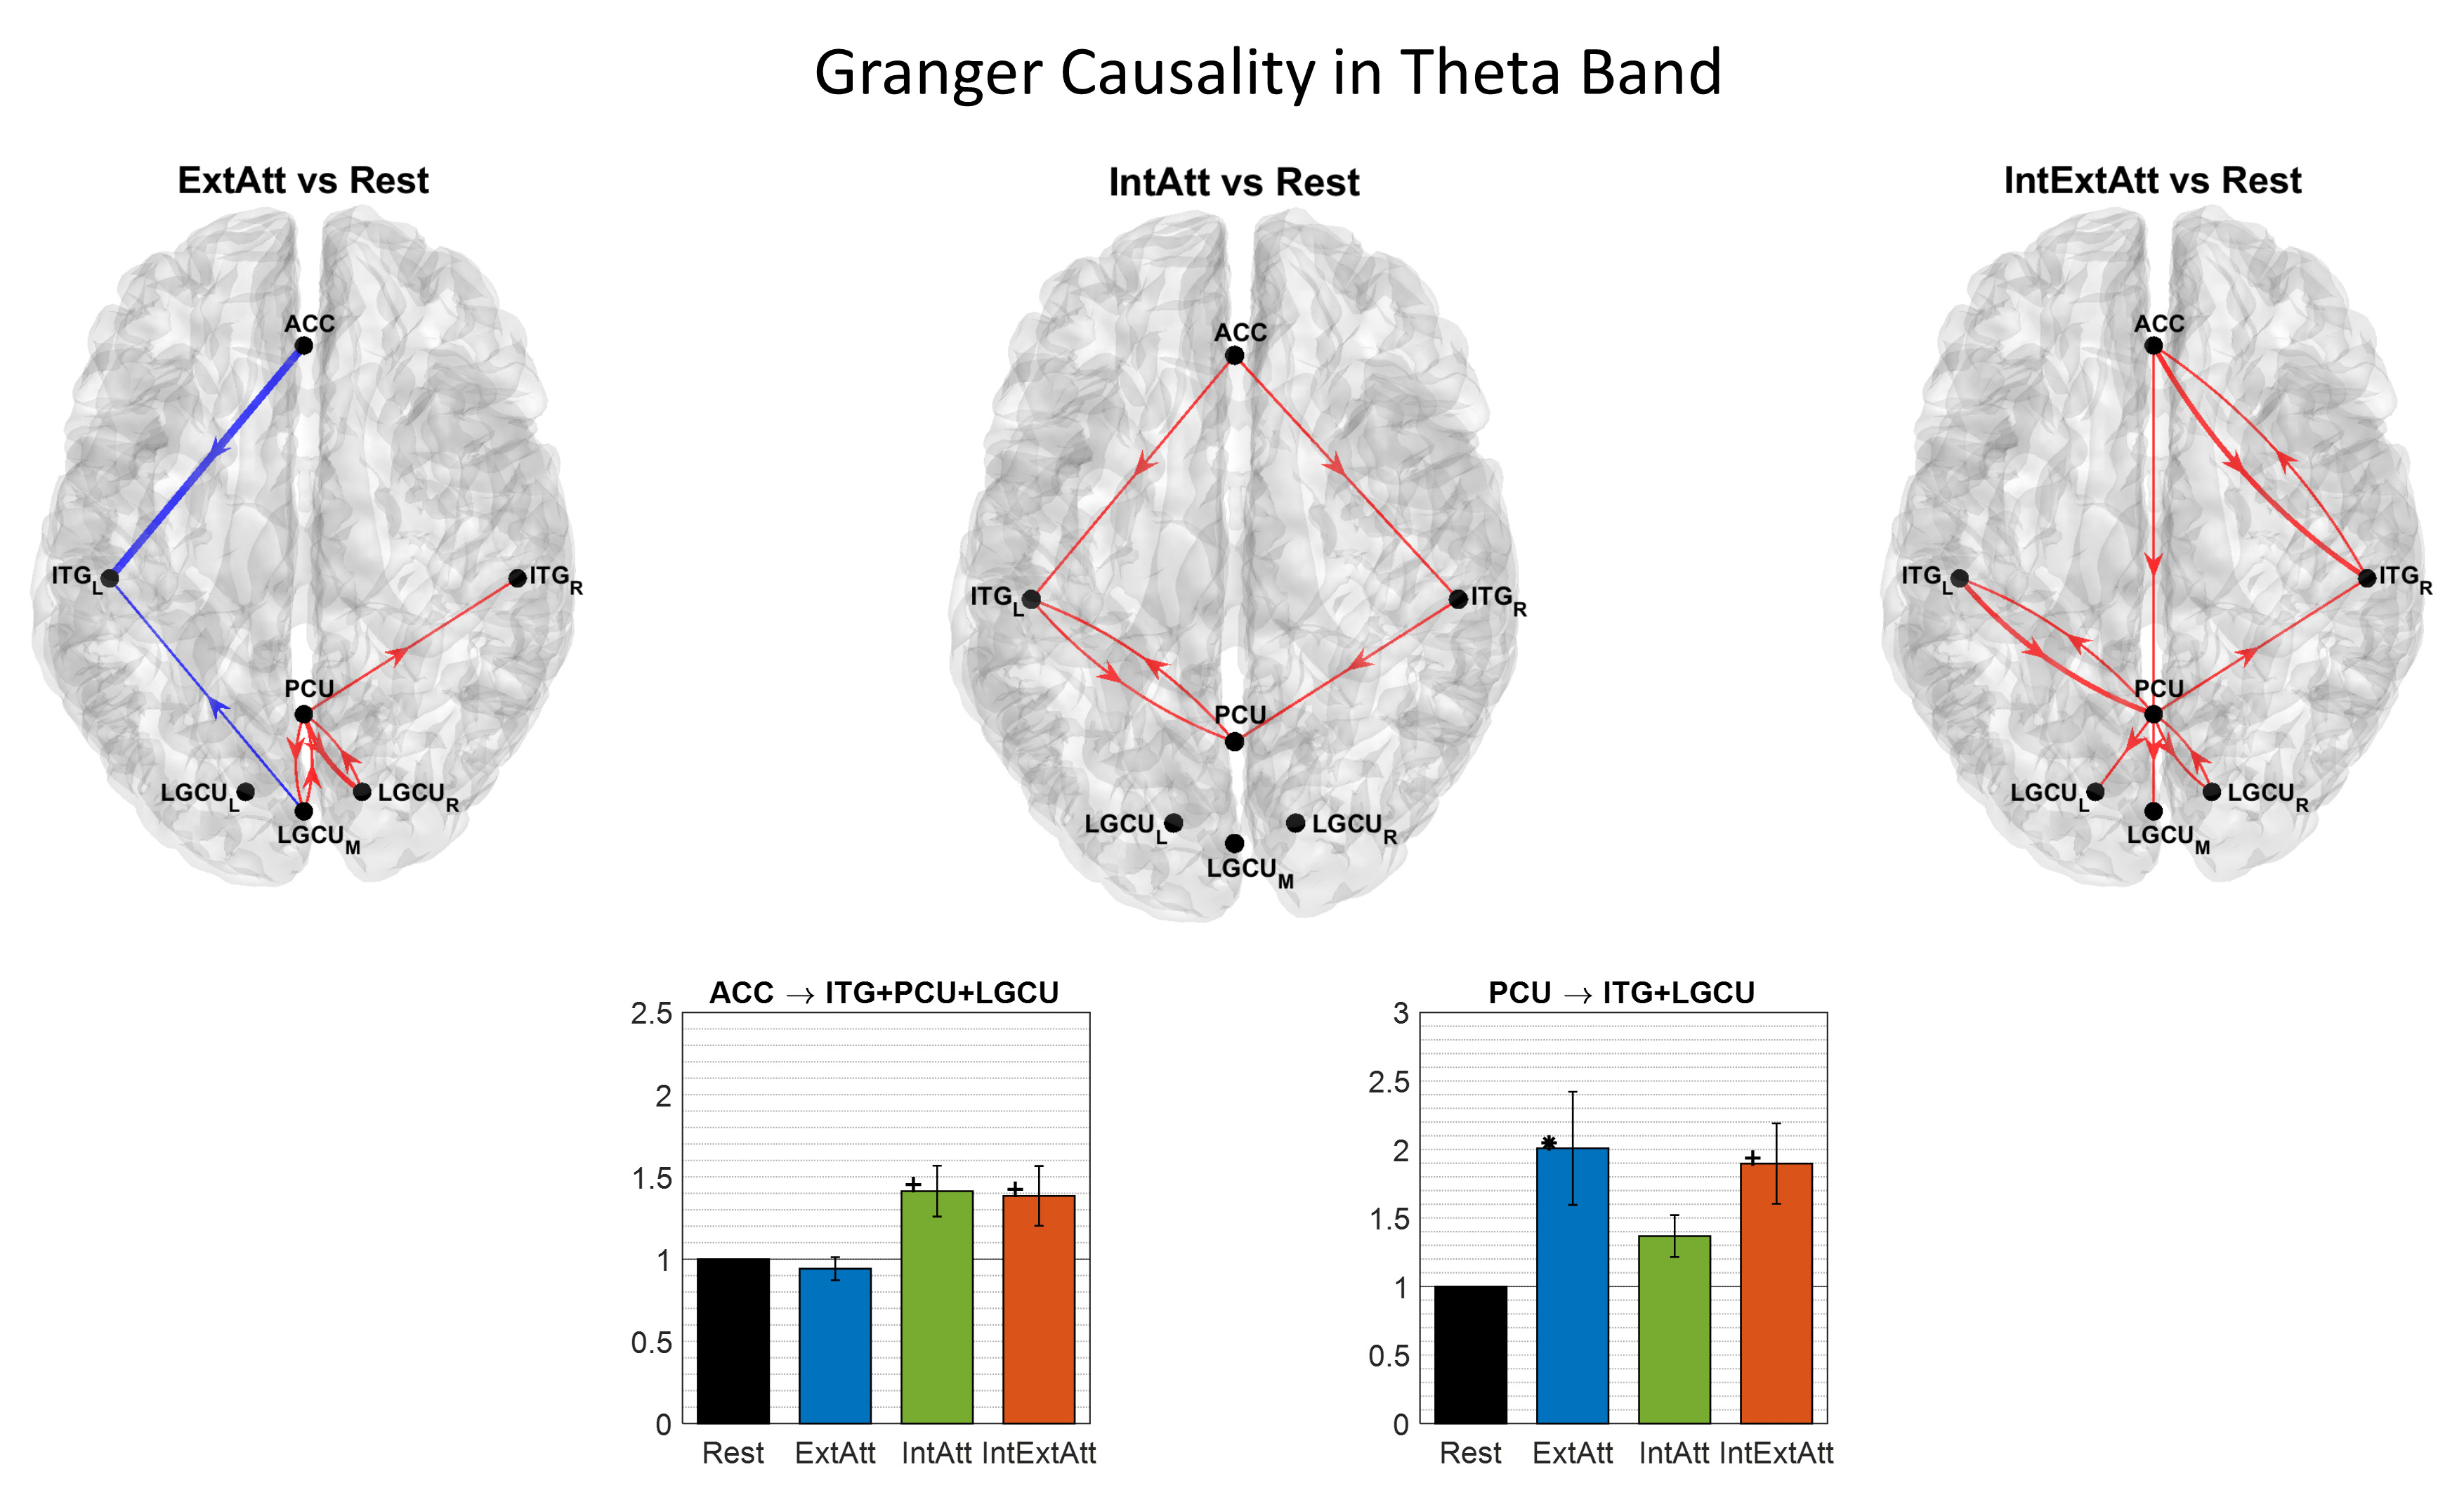 Fig. 9.
Results of the spectral Granger Causality in the theta band
between the selected ROIs. The arrows over the 3D cortical surfaces (top view of
the cortex) indicate the connections that increased (red) or decreased (blue) in
each attentional condition compared to rest. The displayed arrows correspond to
significant connectivity changes at P
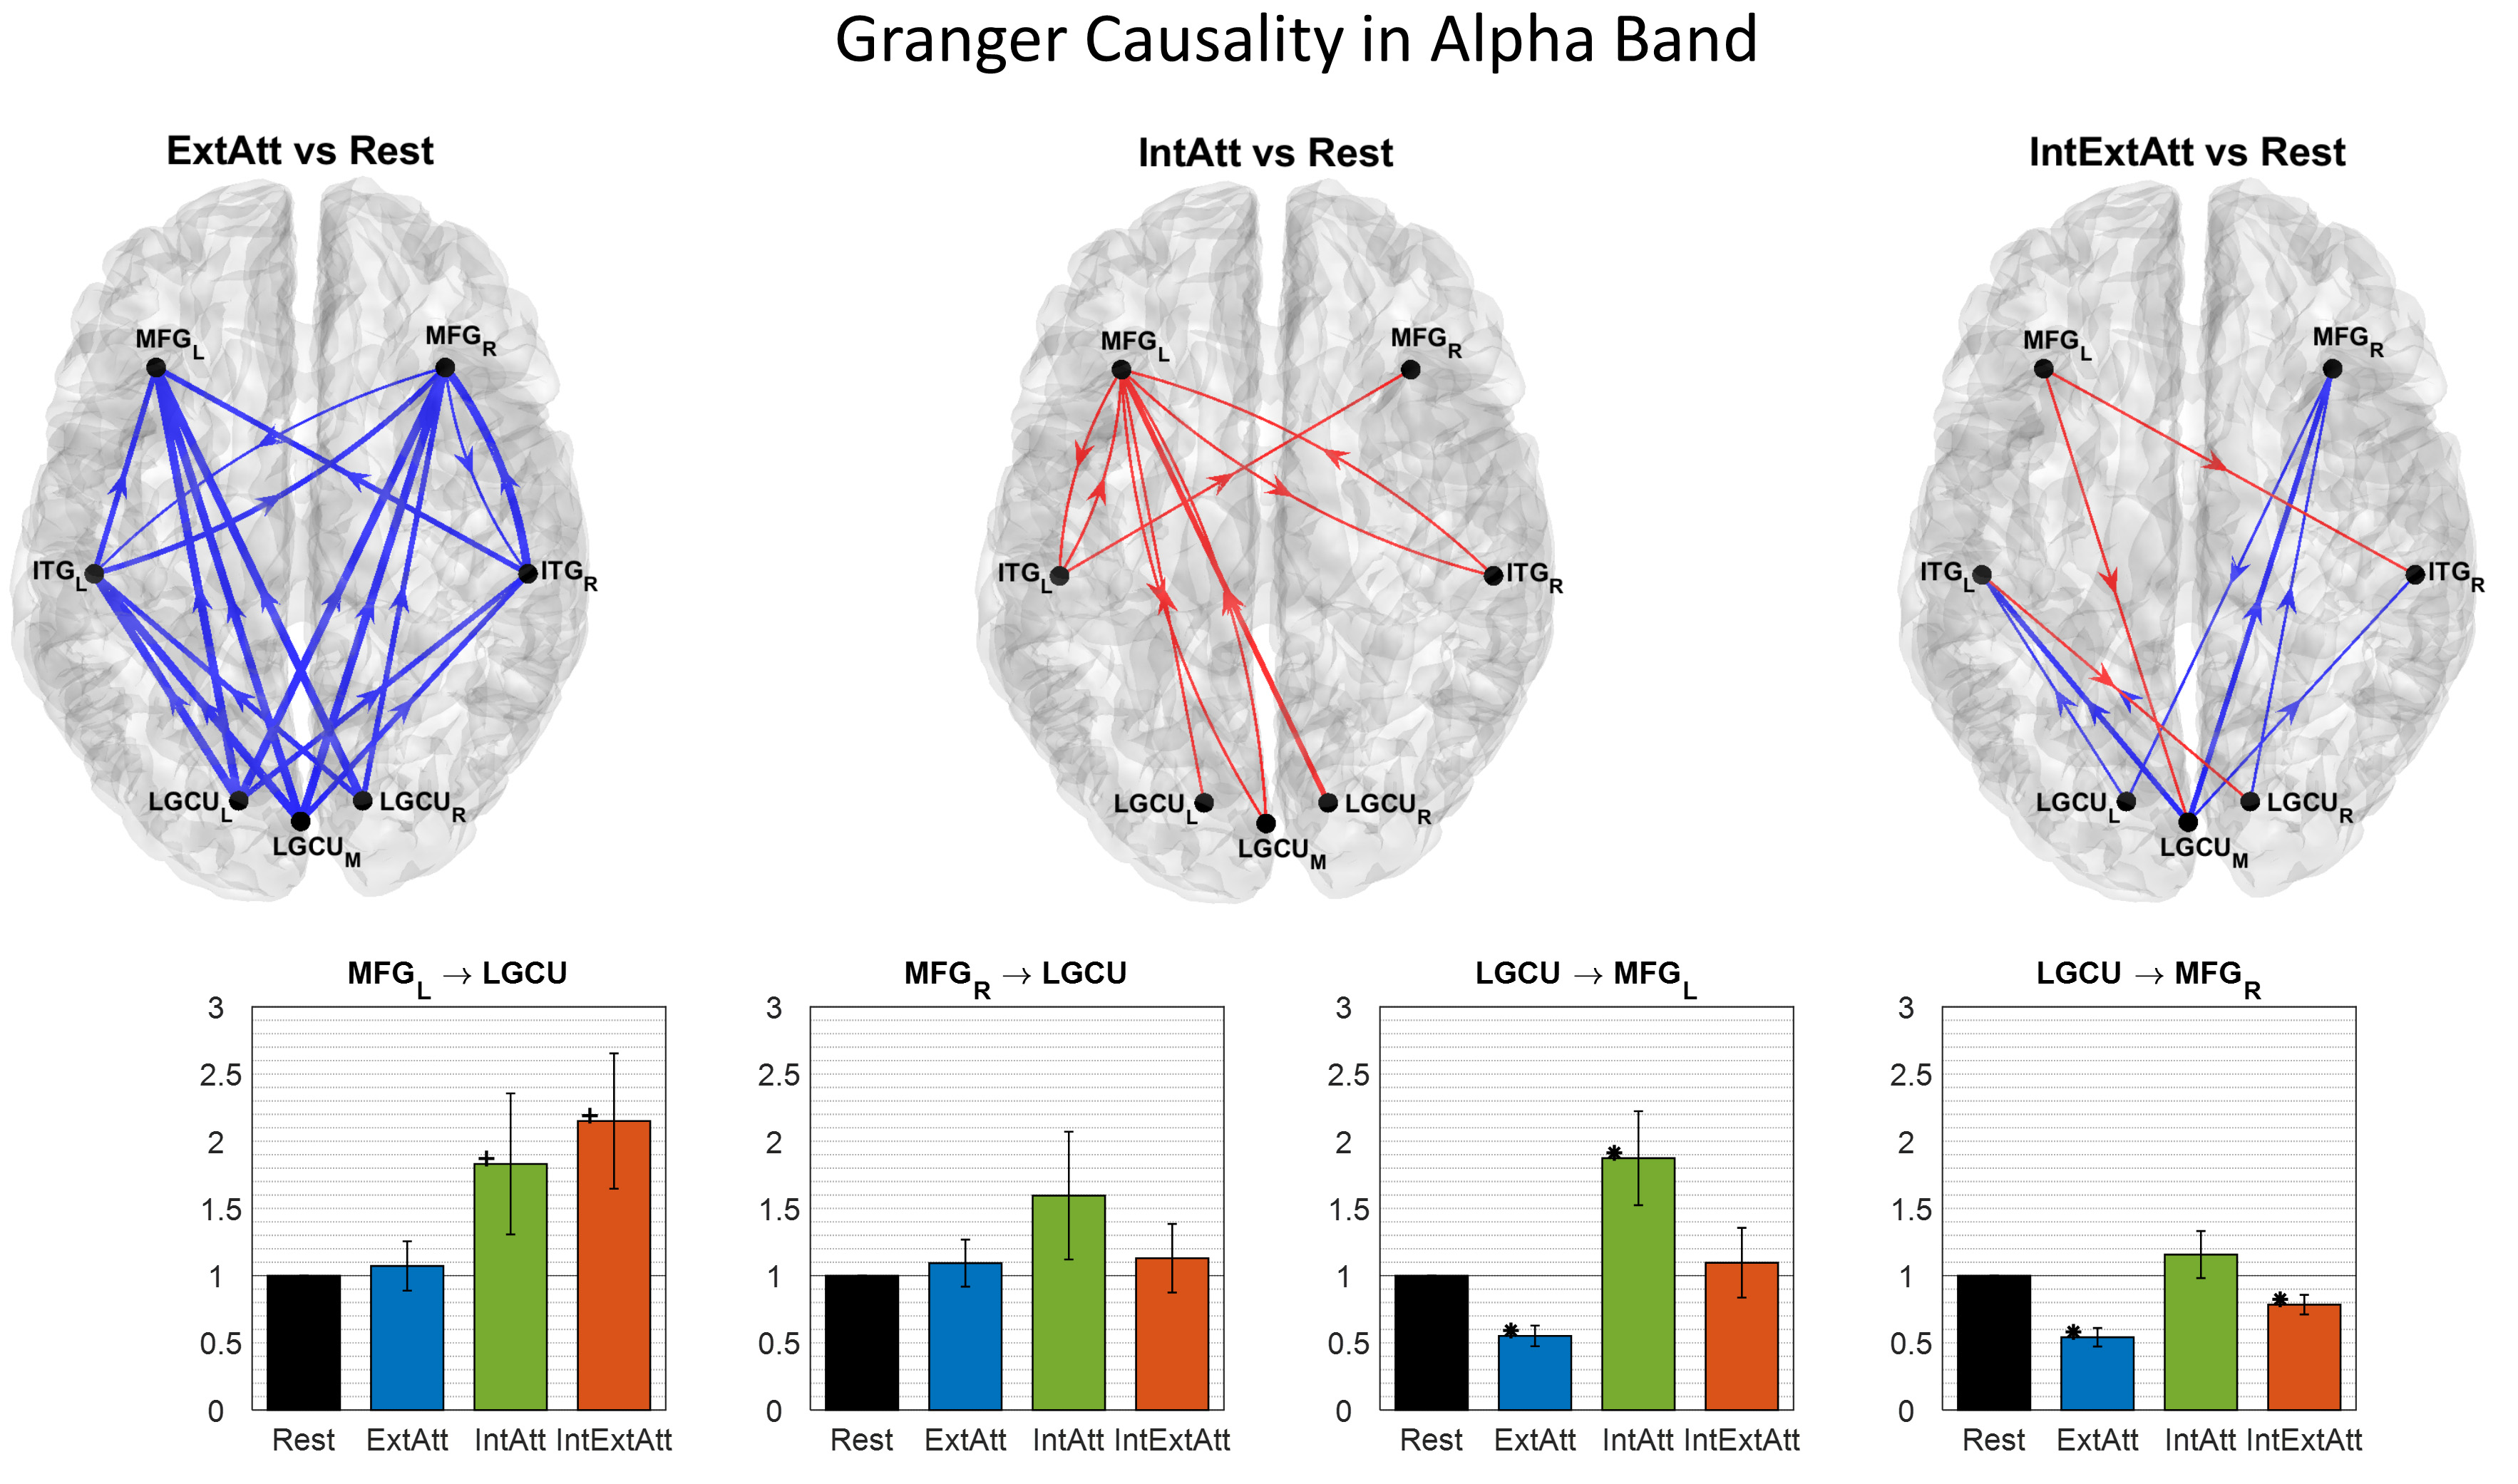 Fig. 10.
Results of the spectral Granger Causality in the alpha
band between the selected ROIs. The arrows over the 3D cortical surfaces (top
view of the cortex) indicate the connections that increased (red) or decreased
(blue) in each attentional condition compared to rest. The displayed arrows
correspond to connectivity changes at P
Theta-Band (Fig. 9) - In ExtAtt, increased theta-band connectivity was localized posteriorly, with the PCU exerting a significantly greater influence towards the visual ROIs compared to rest; no increased influence from ACC was observed. In IntAtt, increased connectivity from ACC emerged, while the influence from PCU exerted a minor role. In IntExtAtt, a sort of summation of the previous two effects occurred, with an overall increase in connectivity among the ROIs, and with ACC and PCU exerting each an overall influence on visual areas (LGCU and ITG) to a similar extent as in IntAtt and ExtAtt respectively (see the bar-plots).
Alpha-Band (Fig. 10) - The ExtAtt was characterized by an overall
dramatic decrease of causal influence, with a clear bottom-up arrangement. No
relevant modifications in top-down connections emerged (see in particular
MFG
This study investigated how EEG alpha and theta power and functional communication within these bands are implicated in different attentional conditions, involving bottom-up sensory attention only (visual stimulation), cognitive internal attention only (mental math task), and the competition between the two forms of attention. In particular, we were motivated by the following main question: Which are the alpha and theta effects of online distractors that are continuously presented during an internal cognition task, and act by capturing external attention?
The electroencephalographic modulations in theta and alpha band were investigated both at scalp and cortical level. It is worth noticing that we tuned alpha and theta rhythms individually by using an objective procedure that emulated the original influential attempt of Klimesh et al. [30] to characterize the individual alpha band. This way we took into account the interindividual variability, enhancing the precision of the analysis.
Some interesting main effects were obtained already at the scalp level (Figs. 2, 3, 4). An original result is that theta activity was modulated differently in the anterior and posterior sites by the attentional conditions. At frontal sites theta increase was mainly associated with internal attention, a result well in line with previous studies [5, 9]; in particular, increase in scalp frontal midline theta was previously observed during mental arithmetic tasks both similar and different from the one adopted here [6, 7, 36]. This result at scalp level (together with the source-level results indicating the main involvement of anterior cingulate cortex in frontal theta increase) can represent a posterior validation that the participants were engaged in the math task execution during the two corresponding sessions. Interestingly, frontal theta increase was larger when the math was performed with the presence of visual distractors. This result matches the general observation of higher frontal theta associated with increased task demands, usually implemented by increasing memory load in working memory tasks or by increasing task complexity [4, 51]. However, we are not aware of other studies that have investigated and revealed such an effect when the task demand is modulated by the absence vs presence of external distractors rather than by the intrinsic complexity of the internal task (which remained unchanged in IntAtt and IntExtAtt conditions). Here we found that although the internal task remained unchanged, the need to increase the protection of ongoing internal processing from external sensory interference was associated with higher frontal theta; this could reflect the allocation of greater internally-oriented attentional resources or increased error monitoring and conflict resolution.
Theta activity at scalp posterior sites did not follow the same pattern as frontally. Posterior theta increased in conditions involving external attention, i.e. in association with picture presentation. Studies investigating posterior theta in relation to visual attention and visual stimulation are sparser. Most of them reported scalp occipital theta enhancement following or during visual stimulus presentation [52, 53, 54, 55], in agreement with our results. Conversely, the effect of visual attention on posterior theta is unclear and controversial results have been reported [53, 55]. Our results provided similar levels of posterior theta increase in ExtAtt (when likely more attention was allocated towards visual stimuli) and in IntExtAtt (when likely less attention was directed towards visual stimuli); a speculative hypothesis is that this posterior theta might signal basic visual processing not affected by attention.
At variance with posterior theta, posterior alpha exhibited a clear different modulation in ExtAtt condition vs IntExtAtt condition. Picture presentation alone induced a strong posterior alpha decrease, indicating engagement of the sensory system and enhanced visual processing [11]. When pictures accompanied the mental task, alpha power exhibited a much lower decrease assuming values not statistically different from the rest; this indicates a resistance against the visual interfering information. This effect may result from a push-pull interaction between two opposing mechanisms: bottom-up visual engagement reducing alpha power (as it emerged in ExtAtt) and task-oriented visual inhibition increasing alpha power. Indeed, an average tendency of alpha power to increase occurred in IntAtt condition, although not significant. While this mechanism appeared weak when performing the internal task alone (against a grey screen), its operational role emerged more clearly in the presence of the visual distractors, being able to contrast alpha reduction. In our recent paper [56], which investigated alpha power modulations in a variety of conditions, we found that performing a similar mental task while immersed in a (highly stimulating) virtual reality environment increased alpha power to the same level as in rest condition, whereas the virtual reality immersion alone induced a strong decrease. Here, we confirmed the previous result and proved that even when using simpler and less motivating visual distractors (neutral pictures on a monitor vs virtual reality scenario) the need to isolate from visual engagement induced an increase in alpha oscillations. Our conclusion appears in contrast with a recent study [57] that questions the role of alpha oscillations in inhibition of online distractions. These authors observed that alpha did not increase compared to baseline during the retention interval of a working memory task, in the presence of visual distractors maintained throughout the retention period; furthermore, strong distractors (more similar to the memorized representation) produced larger alpha power decrease than weak distractors. Based on these results, the authors suggested that alpha oscillations were ineffective for inhibition of sustained distraction in the investigated condition. A possible reconciling interpretation may take into account that alpha power during internal vs external competition results from two antagonistic mechanisms, an increase to insulate internal processing and a decrease induced by external stimulation; the former may just reduce but not overcome the latter. This effect could occur in particular when the distractors contain features similar to the internal representation and thus may have strong attention influence.
Via the analysis at source level, we first investigated the involvement of some key cortical regions in theta and alpha power modulation and then we explored modifications in the pattern of functional connections. Here, source reconstruction was not based on a high-density electrode montage but on a limited number of electrodes (32). Therefore, the results obtained on source activity and connectivity merit additional studies to obtain a more robust validation (see also Section 4.4).
For the alpha-band analysis, we took into consideration both lower-level (lingual gyrus and cuneus) and higher-level (inferior temporal gyrus) visual regions, based on their functional roles and of previous results in literature (see Section 1. Introduction and Section 2.3.5). The lingual gyrus and cuneus were considered together (LGCU) in order to reduce the number of ROIs, especially in view of the connectivity analysis, and favor a more straightforward interpretation of the results.
The whole-brain statistical analysis reveals that almost all voxels in the posterior regions are implicated in alpha modulations (Fig. 6). More specifically, alpha power modulation in the selected ROIs (Fig. 8) paralleled that observed posteriorly at scalp level. In particular, ExtAtt condition was characterized by a significant alpha power decrease in all visual ROIs; notably, the decrease was larger in earlier (LGCU) than superior (ITG) visual ROIs. No significant modulation of the alpha power in the visual ROIs was found in IntExtAtt compared to baseline. Similarly to our results, a recent study [10] reconstructing source activity from magnetoencephalography, found a marked alpha reduction, especially in occipital bilateral regions, during a prospective memory task that required elevated external attention and low internal attention. Conversely, they did not find significant changes of cortical alpha in a task that required lower external monitoring and high internal attention. Again, we interpret the absence of alpha changes in that task as resulting from the balance between the alpha increase to protect the internal representations and the alpha decrease still induced by the external sensory inputs.
Besides the visual ROIs, we also included the middle frontal gyrus in alpha band analysis, since this region, although did not exhibit a significant alpha-power change neither at the voxel-level nor at the overall ROI level, may be implicated in top-down influences in the alpha-band toward the visual ROIs, especially in conditions involving internal attention. Indeed, there is a general agreement that prioritizing or suppressing sensory processing in a goal-oriented manner are controlled by top-down signals from higher-level frontal cortical areas [58, 59], although no consensus has emerged yet on the specific sources of these signals. However, implication of the middle frontal gyrus (including the dorsolateral prefrontal cortex) in attention-dependent modulation of visual activity is supported both by fMRI and ERP studies [60, 61], and other EEG studies [24, 34, 35].
For the theta-band analysis, we included not only the visual ROIs (LGCU, ITG) but also two additional ROIs, the Anterior Cingulate Cortex (ACC) and the Precuneus (PCU). The ACC was a priori included as one of the main source of frontal midline theta associated with internally focused attention and cognitively demanding task [4, 9], including mental arithmetic [6, 7, 36]. Our results suggest that the frontal theta increase in our math task originated mainly from the ACC, and from this hub it might potentially extend to other frontal regions (see indeed right top cortical surface in Fig. 5 showing higher and broader theta increase in frontal cortex, where significant voxels were found too). Conversely, the Precuneus was selected a posteriori based on the statistical voxel-wise results in ExtAtt condition, which showed a significant involvement of this region (Fig. 5 left slice-view maps and Table 1). Accordingly, the analysis at overall ROI level (Fig. 7) showed significant power modulation in PCU, suggesting that PCU could be implicated in theta power and that activity could spread from it to the close cingulate cortex (where significant voxels were found too). However, interpreting the involvement of PCU in ExtAtt is not straightforward and our explanation remains at a highly speculative level. Indeed, the precuneus has been widely associated to internally oriented functions and memory processes (e.g. visual imagery, episodic or semantic memory retrieval) [37, 38]. A preliminary interpretation, requiring further support, can be linked to a few studies suggesting that PCU has also visual functions [39, 40] and may be implicated in general monitoring of external environment [62]. We can tentatively speculate that, at least in the conditions investigated here, theta increase in PCU and in the other visual regions (especially bilateral LGCU) might represent a basic visual processing uninfluenced by the amount of allocated attention (see the similar level attained in ExtAtt and IntExtAtt in these ROIs, Fig. 7). However, this interpretation remains uncertain and definitely requires further inquiries.
When considering internal attention alone, causal theta influences increased from ACC towards temporal and then posterior (PCU) regions (Fig. 9), in agreement with previous results showing the importance of fronto-temporal-parietal theta networks in mental arithmetic [7, 36]. Conversely, in the ExtAtt condition theta connectivity appeared much more localized and confined posteriorly. Furthermore, the overall theta connectivity increased in IntExtAtt, condition, with the two previous mechanisms operating simultaneously, and apparently not influencing reciprocally.
Mechanisms of alpha-band causal influences seemed to operate in opposite direction in external and internal attention (Fig. 10). ExtAtt was dominated by a decrease in alpha-band connections in a bottom-up fashion. On the contrary, IntAtt was characterized by an increasing trend of alpha-band connections in both directions. A few considerations can be drawn. First, the selected frontal ROI (MFG, particularly in the left side) appeared implicated in top-down alpha influences during the internal task. Second, this mechanism was accompanied by a second one, i.e. an increase in bottom-up alpha influences (Fig. 10 central top panel). It is worth noting that, besides top-down, also posterior-to-anterior information flow in alpha band has been reported to be involved in internally oriented tasks and conditions [63, 64]. This is in line also with our results in IntExtAtt condition where an increase in top-down connectivity was accompanied by a reduced decrease of bottom-up connectivity compared with ExtAtt. Overall, these results might indicate that both top-down and bottom-up communication in alpha band possibly operate to favor insulation of internal processing from ongoing external interference.
Some limitations and ideas for further studies are presented.
In our experimental protocol, we used pictures changing every 10 seconds to induce visual attention. The significant and marked decrease of alpha activity in posterior visual regions during ExtAtt condition indicates that visual attention of participants was actually captured by the pictures. However, we cannot totally exclude that mind-wandering occasionally occurred, e.g. at some points between one picture and the next, reducing visual attention. Increasing the rate of picture presentation (e.g. every 5 seconds or less) or watching a video, might increase the effect of external attention capture, with possible impact on alpha power both in ExtAtt and IntExtAtt conditions. This could be explored in future studies. Another point is that the two examined conditions (performing mental arithmetic vs watching pictures) differ, besides the direction of attention, also as to other variables, such as voluntary vs automatic allocation of attention, requiring vs not requiring manipulation of information, demanding vs not demanding task. These variables might have partially contributed to the observed EEG differences in oscillatory activity and connectivity. However, our hypothesis is a posteriori validated by the observation that, according to the existing literature, the obtained changes in alpha and theta mechanisms are mainly modulated by the direction of attention, i.e. are specific of attention orientation rather than being task-specific or being associated to other variables (see the Introduction where we emphasized how similar alpha or theta mechanisms operate in tasks even very different but that share the same direction of attention).
Another important aspect concerns the investigation of other rhythms together with theta and alpha, e.g. gamma rhythm (30-100 Hz). Indeed, enhanced gamma oscillations have been observed during high-level (internally oriented) mental processing (reading, emotion, math task, memory) especially in task-relevant areas [5, 6, 65], and also increased gamma oscillations in sensory cortices have often been linked with increased sensory attention [3]. Furthermore, theta-gamma coupling, with gamma cycles nested within a theta cycle and phase-locked to it, is considered an efficient scheme for implementing the simultaneous representation and manipulation of multiple items. In relation to our results, adding the exploration of gamma oscillations may help to understand the functional role of the posterior theta in the investigated conditions.
We acknowledge that the accuracy of source reconstruction improves with increasing sensor density and using individualized head models from MRI, while we used 32 electrodes and a head model template (a limitation however common to a great body of literature and even severer in cases when just 19 electrodes are used). However, here we were not interested in an exact cortical localization, and we did not focus on single significant voxels; instead, we considered overall regions of interest, to characterize the average behavior of an area. Therefore, we expect that some blurring and inaccuracies in source reconstruction derived by the adopted techniques may have had a tolerable impact. Furthermore, some reassurances come from results at source level in concordance with the existing literature (as reported previously). Nevertheless, our source-level results, both as to power and connectivity, definitely deserve further studies using high-density electrode montage (e.g. 64 electrodes) and possibly a larger sample size (see also below) to achieve higher reliability. This may be of particular relevance to attest our provisional result showing involvement of theta activity in PCU during visual attention; this result indeed does not find clear interpretation within the existing literature and further validation is required.
Another weakness, that may benefit from a larger number of electrodes and of participants, concerns the low statistical significance of the Granger Causality effects that did not survive multiple comparison correction in most of cases (Figs. 9 and 10) and revealed a high inter-individual variability. A certain variability was already visible at power level (especially in alpha activity in IntAtt and IntExtAtt); it is possible that some participants adopted different strategies for keeping internal concentration or learned automatized procedure to perform the task (reducing the effort) or may even be particularly susceptible to external influences. In future studies we can further increase the number of participants to identify a clearer tendency and also perform an analysis at single-subject level to possibly disclose different adopted strategies. This kind of analysis could further benefit from controlling participants’ performances in the mental task and/or their arithmetic proficiency, which we did not systematically assess in this study.
In conclusion, we investigated the alpha and theta mechanisms that operate while performing an internal attention task against concurrent visual distractors inducing external attention, in relation to the mechanisms operating when considering each form of attention individually. While theta and alpha are extensively linked to attention, they are less often investigated together, and are scarcely examined in relation to online distractors and during ongoing conditions reflecting real life situations. We found that performing the internal task during external visual interferences was associated with distinctive patterns of power and connectivity in both bands. Frontal midline theta, implicating anterior cingulate cortex and peculiar of internal focus of attention, was further enhanced in presence of visual distractors and was associated with large-scale top-down connectivity. This anterior theta coexisted with posterior (occipital/midline-parietal) theta, which was characterized by localized connectivity and could reflect basic visual processing, although this interpretation remains highly uncertain. Alpha power in visual regions (both temporal and occipital), characterized by a significant decrease in conditions of visual stimulation alone, assumed values closed to rest in the competition state, indicating reduced engagement of the visual system to gate out visual distractors. This appears effected by a bidirectional increase in alpha connectivity between visual regions and frontal regions.
Despite some limitations, this study has made an attempt to provide a comprehensive framework of the alpha and theta oscillatory mechanisms that intervene in the competition internal-external attention, a condition pervasive of the sensory-cognitive interplay in our everyday activities. This attempt can also be of value to reconcile controversial results of attention interpreting them within this framework, and to help understanding the relationships between brain oscillations and attentional functions/dysfunctions in daily life tasks, especially in subject categories more susceptible of external intrusion during cognitive tasks, such as children, older, or subjects suffering from attention-deficit hyperactivity disorder (ADHD).
ACC, Anterior Cingulate Cortex; ExtAtt, external attention condition; IntAtt,
internal attention condition; IntExtAtt, condition of competition between
internal and external attention; ITG
E.M. conceived and designed the experiments; G.R. performed the experiments and collected the data; E.M. and G.R. designed the methodology; M.U. reviewed and validated the methodology; E.M., G.R., and M.U analyzed the results; E.M. wrote the original draft; M.U. and G.R. reviewed and edited the draft.
Data were obtained with the informed consent of all participants. The local bioethical committee of the University of Bologna approved the study (protocol number 29146; year 2019).
We thank two anonymous reviewers for their constructive suggestions.
None.
The authors declare no competing interests. Given their roles as Guest Editor or Editorial Board member, Prof. Elisa Magosso and Mauro Ursino had no involvement in the peer-review of this article and have no access to information regarding its peer-review.