
Serum creatinine and serum albumin levels were measured prior to surgery, and serum creatinine level was also measured at 72 hours following percutaneous coronary intervention in 819 (January 1st, 2015 and December 31th, 2018). According to whether patients developed contrast-induced acute kidney injury or not, they were assigned to either a contrast-induced acute kidney injury group (72 cases, 8.8%) or a non-contrast-induced acute kidney injury group (747 cases; control). Serum albumin was significantly lower in the contrast-induced acute kidney injury group than control (39.33 ± 5.09 g/l and 42.69 ± 5.19 g/l, respectively, P < 0.001). The results of a receiver-operating curve analysis indicated a serum albumin level of 40.5 g/L was the optimal cut-off value for prediction of contrast-induced acute kidney injury and according to a multivariate logistic regression analysis, serum albumin was an independent biomarker for prediction of (95% confidence interval: 0.836-0.935, odds ratio: 0.884, P < 0.001). Serum albumin, a low-cost and easily assessable laboratory protein, was independently related to a greater risk of contrast-induced acute kidney injury among patients that received percutaneous coronary intervention. It is proposed that under these circumstances SA is a potential biomarker for contrast-induced acute kidney injury.
Contrast-induced acute kidney injury (CIAKI) ranks 3rd among causes of hospital-acquired renal insufficiency in hospitalized patients and has been known to increase the morbidity and mortality, dialysis and transplantation, health care costs and length of hospitalization (Best et al. 2002; Mehta et al. 2015; Nash et al. 2002). Although the pathogenesis of CIAKI has not been fully described, previous studies have demonstrated that inflammation, thrombosis, renal parenchymal hypoxia and reactive oxidative stress (ROS) induced by oxygen species are all related to its occurrence (Barrett and Parfrey, 2006; Börekci et al., 2015; Heyman et al., 2008). Meanwhile, CIAKI development has been linked to increased early and late morbidity and mortality in patients who have undergone percutaneous coronary intervention (PCI) (Wi et al., 2011). Unfortunately, there are few definitively effective strategies for prevention or treatment of CIAKI (Weisbord and Palevsky, 2010). Therefore, it is important to find new, simple and inexpensive biomarkers of CIAKI that protect patients from PCI, especially for those at high risk.
The functions of human albumin for renal protection potentially include mitigating nephrotoxicity of medications, protecting against loss of glycocalyx, restoring balanced net fluid balance and maintaining glomerular filtration (Wiedermann and Joannidis, 2015). A low serum albumin (SA) level was found to be an indicator of acute kidney injury (AKI) (Lee et al., 2012, 2014), but little has been reported for SA and CIAKI following PCI. In China, the effect of SA on CIAKI development after PCI has not been studied. For this reason the value of SA for predicting CIAKI risk for Chinese patients receiving PCI was retrospectively studied.
The protocol of the current study was approved by the Medical Ethical Committee of the Huzhou First People's Hospital. Informed consent for patients was waived as the study was retrospective. All patients were anonymous. The study was designed in accordance with the ethical guidelines of the Declaration of Helsinki.
The clinical data for 908 patients that underwent PCI between January 1st, 2015 and December 31th, 2018 were retrospectively identified, and collected for analysis from the hospital’s electronic medical record system. Exclusion criteria: < 18 years old, hypotension (blood pressure < 90/60 mm Hg), hypertension (blood pressure > 180/110 mm Hg), contrast agent exposure within the previous 10 days, pregnant or breast feeding, coexisting autoimmune disorders, known malignant or chronic inflammatory disease, hematopathy, preprocedure estimated glomerular filtration rate (eGFR) under 15 ml/min (min 1.73 m²), serum creatinine (SC) > 3 mg/dl, missing SC value within 14 days before contrast agent procedures or within 72 h after procedures and missing more than 30% of the variables. According to these criteria, 89 cases were excluded [hypertension (n = 3), hypotension (n = 1), SC > 3 mg/dl (n = 18), hematopathy (n = 24), missing more than 30% of the variables (n = 22), and missing SC value within 72 h of procedures (n = 21)]. Finally, 819 cases met the criteria and were included in the study (Fig. 1).
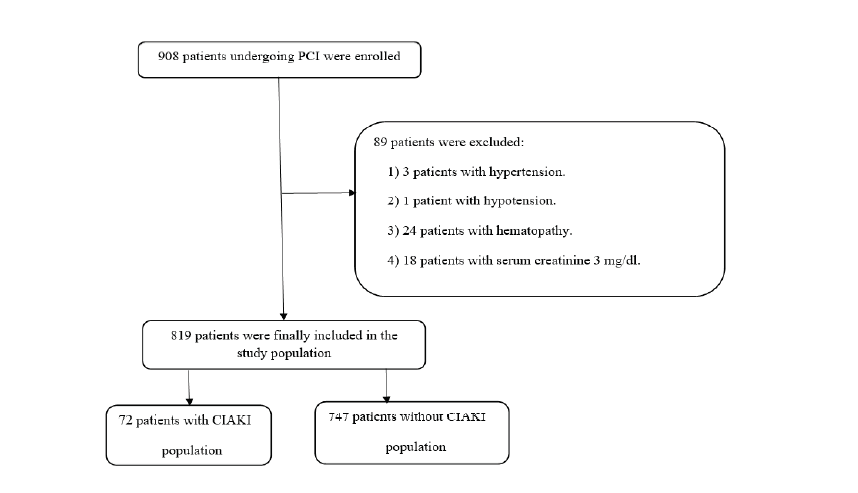 Figure 1.
Flowchart depicts exclusion of the patients. PCI indicates percutaneous coronary intervention; CIAKI indicates contrast-induced acute kidney injury
Sex, age, diabetes mellitus (DM), history of hypertension, current smoking status, medical history prior to admission, history of coronary artery disease and complete physical examination were recorded for all patients after assessessment of a detailed medical history. White blood cell, baseline hemoglobin, hemoglobinA1c, urea, creatinine, platelet, glucose, serum albumin, prothrombin time and lipid level were obtained from all patients. SA was measured automatically by a biochemical analyser (ARCHITECT c16000, tochigi, Japan). The SC level was measured 72 hours after contrast agent administration. The routine measurement of left ventricular ejection fraction (LVEF) for all patients was carried out by two-dimension echocardiography. Patients were routinely intravenously hydrated, and 0.9% normal saline was given at 1.0~1.5 mL/ (h· kg) 6h before and 12h after surgery, according to the heart function of the patients. The eGFR calculation obtained from SC was based on the Levey modified Modification of Diet in Renal Disease formula as 186 × SC-1.154 × age-0.203 × 0.742 (if female) (Foundation National Kidney, 2002). A systolic blood pressure > 140/ 90 mm Hg obtained by at least two separate measurements during hospitalization, a previously diagnosed hypertension or history of antihypertensive medications was regarded as hypertension (Mancia et al., 2007; Liakos et al., 2015), while DM was defined as either pre-existing diagnosed disease or at least two fasting blood glucose levels higher than 7.0 mmol/l or two-hour plasma glucose levels higher than 11.1 mmol/l by oral glucose tolerance test (Ryden et al., 2007). CIAKI referred to an absolute increase of 0.5 mg/dl (44.2 μmol/l) and/or a 25% increase in SC concentration from baseline value of contrast agent administration to 72 h in the absence of alternative explanation for acute kidney injury (AKI) (Silvain et al., 2014). Whether patients developed CIAKI or not determined which group they were assigned to, CIAKI group (72 cases) or non-CIAKI group (747 cases).
Standard protocols and guidelines were adopted for coronary angiography and PCI. Every eligible case was retreated with 300 mg aspirin and 600 mg clopidogrel, then received a continuous (at least 12 months) combined antiplatelet therapy (cuspidate 75 mg/d and aspirin 100 mg/d) after stent implantation. Nonionic and isosmotic agents were used as contrast agents in all primary procedures performed during the reviewed period. The operator determined the use of anticoagulants and inhibitors of glycoprotein IIb/IIia during surgery. The necessity of stent insertion was also determined by the operator. After stent implantation, the regression of thrombolysis in myocardial infarction blood flow to below 30% of infarct-related artery occlusion was considered a successful proceddure.
All statistical analysis was performed using SPSS software (IBM, version 23.0). The Kolmogorov-Smirnov test was adopted to test data normality and non-normal data were log transformed to obtain normality. Continuous variables were reported as mean ± standard deviation, the data were given as percentage and numeric value for categorical variables. The independent sample t-test was employed to compare statistical difference between paired groups of continuous variables that met normality conditions, whereas the Mann-Whitney U test was used for group analyses of non-normal continuous data sets. For categorical variables, the chi-square test with Yates’ correction was used as appropriate. The relationship between SA and laboratory features was quantified by the Pearson correlation coefficient. To test association between CIAKI and variables, univariate analysis was first performed, followed by multivariate logistic regression (MLR) analysis to evaluate predictive CIAKI factors. The cutoff value of SC in predicting CIAKI was calculated from ROC analysis. The value with the highest specificity and sensitivity was selected as the optimal cutoff value. A significant difference was assumed for P < 0.05.
A total of 819 patients who received PCI were recruited, average age 67.2 ± 10.3 years, of which 594 (72.5%)were male. Among all patients, 72 (8.8%) developed CIAKI. Their baseline clinical and demographic features are given in Table 1. Results showed patients who suffered from CIAKI were older, had an increased prevalence of diabetes, previous PCI and death in hospital and lower LVEF compared with those who did not. No significant differences in the proportion of males BMI, ACS, hypertension, cerebrovascular disease, systolic and diastolic pressure, aspirin or smoking and drinking history were detected between the two groups.
| Variables | CIAKI group | non-CIAKI group | P | ||||||
|---|---|---|---|---|---|---|---|---|---|
| n=72 | n = 747 | ||||||||
| Age, years (mean ± SD) | 71 (9.2) | 66.8 (10.4) | 0.001 | ||||||
| Gender, male (%) | 57 (79.2) | 537 (71.9) | 0.186 | ||||||
| BMI (mean ± SD) | 23.3 (3.8) | 22.8 (4.1) | 0.463 | ||||||
| ACS (%) | 12 (16.7) | 115 (15.4) | 0.442 | ||||||
| Hypertension (%) | 52 (72.2) | 525 (70.4) | 0.908 | ||||||
| DM (%) | 23 (31.9) | 162 (21.7) | 0.048 | ||||||
| Previous PCI (%) | 21 (29.2) | 138 (18.5) | 0.028 | ||||||
| Cerebrovascular disease (%) | 3 (4.1) | 35 (4.7) | 0.842 | ||||||
| Systolic pressure (mean ± SD) | 138.7 (25.4) | 136.6 (21.1) | 0.41 | ||||||
| Diastolic pressure (mean ± SD) | 83.3 (13) | 80.1 (13.7) | 0.058 | ||||||
| LVEF (%) | 58.4 (9.6) | 62.7 (7.6) | 0.001 | ||||||
| Aspirin (%) | 19 (26.4) | 178 (23.8) | 0.849 | ||||||
| Chronic nephrosis (%) | 2 (2.8) | 7 (0.9) | 0.153 | ||||||
| Smoking history (%) | 36 (5) | 369 (49.4) | 0.949 | ||||||
| Drinking history (%) | 21 (29.2) | 179 (24) | 0.329 | ||||||
| Length of stay (mean ± SD) | 10.3 (9.6) | 7.9 (3.8) | 0.035 | ||||||
| Death in hospital (%) | 3 (4.2) | 1 (0.1) | <0.001 | ||||||
BMI, Body Mass Index; ACS, acute coronary syndrome; DM, diabetes mellitus; Previous PCI, Previous percutaneous coronary intervention; LVEF, left ventricular ejection fraction.
Baseline laboratory findings are given in Table 2. Baseline SA was significantly lower in the CIAKI group compared to control (39.33 ± 5.09 g/l vs. 42.69 ± 5.19 g/l, P < 0.001). Patients who developed CIAKI had significantly higher fibrinogen, red blood cell distribution width (RDW), white blood cell (WBC), neutrophil, urea nitrogen, brain natriuretic peptide (BNP) but lower hemoglobin, red blood cell (RBC) and hematocrit, when compared with control.
| Variables | CIAKI group | non-CIAKI group | P | ||||||
|---|---|---|---|---|---|---|---|---|---|
| n=72 | n=747 | ||||||||
| INR (mean ± SD) | 1.02 (0.14) | 0.99 (0.20) | 0.337 | ||||||
| D-Dimer, μg/ml (mean ± SD) | 0.53 (1.20) | 0.27 (0.43) | 0.07 | ||||||
| Fibrinogen, g/L (mean ± SD) | 4.30 (1.35) | 3.84 (1.02) | 0.005 | ||||||
| Prothrombin time, s (mean ± SD) | 11.42 (1.63) | 11.27 (3.18) | 0.689 | ||||||
| RDW (mean ± SD) | 44.99 (3.66) | 43.72 (3.83) | 0.007 | ||||||
| WBC, 10 9/L (mean ± SD) | 8.07 (4.23) | 6.93 (2.53) | 0.028 | ||||||
| Hb, g/L (mean ± SD) | 130.21 (19.39) | 137.80 (17.01) | <0.001 | ||||||
| MCV, fl (mean ± SD) | 90.61 (11.57) | 91.14 (7.05) | 0.570 | ||||||
| Lymphocyte, 10 9/L (mean ± SD) | 1.65 (0.84) | 1.57 (0.71) | 0.393 | ||||||
| MPV, fl (mean ± SD) | 10.55 (1.42) | 10.76 (3.35) | 0.609 | ||||||
| CRP, mg/L (mean ± SD) | 15.25 (41.82) | 8.75 (23.09) | 0.257 | ||||||
| RBC, 10 12/L (mean ± SD) | 4.28 (0.62) | 4.49 (0.54) | 0.001 | ||||||
| Hematocrit (mean ± SD) | 0.39 (0.05) | 0.41 (0.05) | 0.001 | ||||||
| Platelet, 10~9/L (mean ± SD) | 184.79 (60.30) | 184.96 (51.16) | 0.978 | ||||||
| Neutrophil, 10~9/L (mean ± SD) | 5.93 (4.04) | 4.82 (2.36) | 0.026 | ||||||
| PDW,% (mean ± SD) | 15.66 (1.71) | 15.86 (1.77) | 0.343 | ||||||
| Kalium, mmol/L (mean ± SD) | 3.94 (0.51) | 3.95 (0.42) | 0.957 | ||||||
| Sodium, mmol/L (mean ± SD) | 141.64 (2.71) | 142.27 (3.06) | 0.09 | ||||||
| Triglyceride, mmol/L (mean ± SD) | 1.36 (1.03) | 1.63 (1.41) | 0.113 | ||||||
| SA, g/L (mean ± SD) | 39.33 (5.09) | 42.69 (5.19) | <0.001 | ||||||
| HDL-C, mmol/L (mean ± SD) | 1.12 (0.33) | 1.21 (0.70) | 0.294 | ||||||
| Cholesterol, mmol/L (mean ± SD) | 4.17 (1.15) | 4.42 (1.23) | 0.099 | ||||||
| Bilirubin, μmol/L (mean ± SD) | 14.32 (6.63) | 13.87 (6.69) | 0.591 | ||||||
| Glucose, mmol/L (mean ± SD) | 6.40 (2.30) | 6.40 (2.67) | 0.990 | ||||||
| Urea nitrogen (mean ± SD) | 7.75 (3.40) | 6.49 (3.67) | 0.004 | ||||||
| LDL-C, mmol/L (mean ± SD) | 2.20 (0.93) | 2.49 (3.73) | 0.52 | ||||||
| BNP (mean ± SD) | 577.51 (785.76) | 203.85 (424.61) | <0.001 | ||||||
| eGFR, mL/min/1.73m² (mean ± SD) | 80.5 (31.89) | 80.27(20.19) | 0.954 | ||||||
INR, international normalized ratio; RDW, red blood cell distribution width; WBC, white blood cell; Hb, hemoglobin; MCV, mean corpuscular volume; MPV, mean platelet volume; RBC, red blood cell; PDW, platelet distribution width; SA, serum albumin; HDL-C, high density lipoprotein cholesterol; LDL-C, low density lipoprotein cholesterin; eGRF, estimated glomerular filtration rate
Angiographic and procedural characteristics are given in Table 3. No significant differences in the number of infarct-related artery, diseased vessels, stent length and stent diameter between the two groups were observed. The value of SA in predicting CIAKI revealed by ROC curve analysis is shown in Fig. 2. The area of SA under the ROC curve was 0.675 (95% confidence interval: 0.642-0.708; P < 0.001). With an optimal cutoff value of 40.5, SA had a sensitivity of 67.61% and a specificity of 65.07% for CIAKI prediction. A significant correlation was found between SA and eGFR (P < 0.001, r = 0.14; Fig. 3).
 Figure 2.
Receiver-operating curve (ROC) analysis shows the optimal cutoff value of albumin for CIAKI. AUC indicates area under the curve; 95% CI, 95% confidence interval.
 Figure 3.
Scatterplot graph shows the correlation between albumin and eGFR. The central line represents the regression curve. r² indicates square of correlation coefficient. eGFR, estimated glomerular filtration rate.
| Variables | CIAKI group | non-CIAKI group | P | ||||||
|---|---|---|---|---|---|---|---|---|---|
| n=72 | n=747 | ||||||||
| Number of diseased vessels | |||||||||
| Infarct-related artery (mean ± SD) | 2.49 (0.73) | 2.42 (0.77) | 0.457 | ||||||
| LM(%) | 2(2.70) | 45(6) | 0.422 | ||||||
| LAD(%) | 7(9.70) | 63(8.40) | 0.661 | ||||||
| LC(%) | 19(26.40) | 242(32.40) | 0.354 | ||||||
| RCA(%) | 59(81.90) | 568(76) | 0.309 | ||||||
| Stent length, mm (mean ± SD) | 25.45 (9.23) | 24.83 (8.60) | 0.666 | ||||||
| Stent diameter, mm (mean ± SD) | 3.16 (0.53) | 3.08 (0.48) | 0.317 | ||||||
LM, left main stem; LAD, left anterior descending; LC, Left circumflex; RCA, right coronary artery.
The independent predictors of CIAKI were identified by univariate and multivariate logistic regression analysis as shown in Table 4. Age, DM, previous PCI, LVEF and SA were associated with CIAKI development. Furthermore, MLR analysis revealed that previous PCI, LVEF and SA were independent predictors of CIAKI.
| Variable | Univariate Analysis Odds Ratio (95% CI) | P | Multivariate Analysis Odds Ratio (95% CI) | P |
|---|---|---|---|---|
| Age | 1.045 (1.018-1.072) | 0.001 | ||
| Gender | 0.673 (0.373-1.215) | 0.189 | ||
| Hypertension | 1.016 (0.665-1.553) | 0.941 | ||
| DM | 1.692 (1.001-2.861) | 0.05 | ||
| Chronic nephropathy | 3.106 (0.615-14.798) | 0.174 | ||
| Previous PCI | 1.817 (1.058-3.121) | 0.03 | 2.473 (1.355-4.514) | 0.003 |
| Number of diseased vessels | ||||
| 1.130 (0.819-1.560) | 0.456 | |||
| BMI | 1.028 (0.955-1.107) | 0.459 | ||
| LVEF > 55 | 0.944 (0.917-0.971) | < 0.001 | 0.493 (0.259-0.940) | 0.032 |
| SA | 0.881 (0.839-0.926) | < 0.001 | 0.884 (0.836-0.935) | < 0.001 |
DM, Diabetes mellitus; IVEF, left ventricular ejection fraction; SA, serum albumin; eGRF, estimated glomerular filtration rate.
This study primarily revealed that SA was a predictive factor for CIKAI as revealed by MLR analysis. Besides SA, previous PCI and LVEF were also used to predict the development of CIAKI. To the authors knowledge, this is the first study to demonstrate the role of SA in predicting CIAKI among Chinese cases of PCI.
Common risk factors of CIAKI development include advanced age, chronic renal dysfunction, heart failure, concomitant administration of nephrotoxic drugs, decreased blood volume, LVEF and type and dose of contrast media (Barrett and Parfrey, 2006; Börekci et al., 2015; Heyman et al., 2008; Yin et al., 2017). Development of CIAKI is one of the most important problems following PCI (Mehran et al., 2003). It is known to lead to increased inpatient mortality, dialysis, and medical burden (Geenen et al., 2013). Çınar et al. reported that after the pramary PCI in patients with S-T segment elevation myocardial infarction, the hospitalization mortality was 11.5% (CIAKI group) and 2.4% (non-CIAKI group) (Çınar et al., 2019) . The study reported here confirms these findings by showing that in concordance with previous publications, patients with CIAKI exhibit a significantly higher mortality during hospitalization (4.2% versus 0.1%, P < 0.001) when compared to control. For this reason, early risk screening for CIAKI development is important and new predictors of CIAKI are required.
The pathophysiology of CIAKI has not been fully described, but oxidative stress, endothelial dysfunction and inflammation have been considered to be major mechanisms underlying its development (Murat et al., 2015). In this study, previous PCI was an independent predictor of CIAKI revealed by MLR analysis. The role of toxicity of contrast agents in renal endothelial and epithelial cells has previously been reported for animal models (Naziroglu et al., 2013). One proposed mechanism was based on an assumption that the interaction between iodine and amino acids in cell membrane proteins could damage them and lead to the loss of cell membrane integrity and direct toxic effects on renal tubules and vascular cells (Sadat, 2013). Additionally, it was found that LVEF is an independent predictor of CIAKI. A previous study has showed that for patients with acute reduced LVEF, many inflammatory cytokines were increased and that marker levels were restored with cardiac recovery (Boulogne et al., 2017). These cytokines, induced by systemic inflammation, may cause dysfunction of endothelium and subsequently result in renal hypoxia and injury elicited by disturbed renal medullary blood flow (Andrea and Alessandro, 2014).
The most important finding reported here is that SA is a predicting factor of CIAKI as revealed by MLR analysis. Previous studies have reported a correlation between SA and the renal complications (Boyle et al., 2006; Kim et al., 2015; Lee et al., 2012; Murat et al., 2015; Rich et al., 1989; Rich and Crecelius, 1990). Recently, Lee et al. found that 20% exogenous albumin administration before surgery led to increased urine production during surgery and a reduction in the AKI risk following surgery in cases where the preoperative SA level was < 4.0 g/l (Lee et al., 2016).
One possible mechanism is that albumin can improve endothelial cell integrity. The endothelial surface is formed by endothelial glycogen and natural plasma proteins, which play a key role in the vascular barrier by preventing unrestricted fluid and colloid flow into the interstitial space (Adamson et al., 2010; Jacob et al., 2007). Destruction of this structure can lead to tissue edema (Ryden et al., 2007), local inflammation and coagulation conditions (Pries and Kuebler, 2006; Rehm et al., 2004). It has been shown that human albumin significantly improves endothelial cell integrity by protecting the glycoprotein of endothelial cells (Jacob et al., 2009).
Another possible mechanism has been reported as improvement of renal perfusion and glomerular filtration by prolonging effective renal vasodilation caused by the reaction of SA with nitrogen oxides to form S-nitroso-albumin (Kaufmann et al., 1995). Albumin inhibits renal tubular cell apoptosis by scavenging ROS and carrying protective lysophosphatidic acid (Iglesias et al., 1999). In addition, albumin stimulates the proliferation of renal tubular cells by activating phosphatidylinositol 3-kinase (Lee et al., 2012). This suggests that albumin is important for the maintenance of the integrity and function of proximal tubules.
A previous meta-analysis examined the possibility of albumin as an inflammatory biomarker (Wiedermann et al., 2010). In one study, hypoalbuminemia was reported to be a risk factor for AKI, but not for systemic inflammatory response syndrome (Chawla et al., 2005). Another study reported that low serum albumin, but not white blood cell count, c-reactive protein or eosinophilic granulocytes, was an independent risk factor for AKI (Hung et al., 2009). Although the effects of low SA levels on AKI have been found consistently significant, a single potential impact does not fully explain the observed data considering the presence of heterogeneity. In the current study, no significant difference in baseline c-reactive protein levels among CIAKI patients was observed, which was not the case reported for previous studies (Murat et al., 2015).
This study found no significant difference in baseline eGFR between the control and CIAKI groups, which was not consistent with previous studies (Chen et al., 2013; Gao et al., 2014). However, a significant correlation was found between SA and eGFR. A possible reason for this is either the small sample size of this study or differences in population choice.
Although it was not possible to clarify the mechanism of a low SA level in CIAKI, the loss of protective effects of SA may be the cause of CIAKI after PCI. The results reported here suggest that monitoring SA levels may be helpful for the early detection and prevention of CIAKI.
This study has several limitations. Firstly, this is a small retrospective observational study undertaken in a single center. Due to the retrospective design of the analysis, some important data have been lacked, and confounding parameters may have introduced bias. Secondly, as only cases undergoing PCI were included, results may not apply to other forms of case. Despite these limitations, the findings provide insight into a putative association between level of SA and incidence of CIAKI. Large-scale, prospective and randomized trials are required to better demonstrate any causitive relationship between CIAKI development and SA levels.
The current study shows that the SA level is a risk predictor of CIAKI in cases receiving PCI. Additionally, SA measurements are relatively inexpensive and widely available. These findings are encouraging as low SA levels are relatively more easily modified than other known risk factors.
We thank reviewers for their critical reading. This study was supported by the Natural Science Foundation of Huzhou (No. 2016GY41 and No. 2016YZ04).
The authors declare no conflicts of interest statement.