
†These authors contributed equally.
The novel coronavirus disease (COVID-19) has spread all over the world in a
short time. Information about the differences between COVID-19 patients with and
without hypertension is limited. To explore the characteristics and outcomes
differences between COVID-19 patients with and without hypertension, the medical
records and cardiac biomarkers of 414 patients were analyzed. A total of 149
patients had a history of hypertension, while 265 patients did not have
hypertension, and the groups were compared based on their clinical
characteristics and laboratory findings as well as the hazard risk for composite
outcomes, including intensive care unit (ICU) admission, mechanical ventilation,
or death. The results are as follows. On admission, 22.1% of patients
in hypertension group had elevated high sensitivity troponin I (hs-TNI
Question: Are the characteristics and outcomes different between COVID-19 patients with and without hypertension. Could cardiac biomarkers equally predict COVID-19 outcomes in both hypertensive and nonhypertensive patients?
Findings: In our study, we found that COVID-19 patients with
hypertension had higher rates of adverse events and death than nonhypertensive
patients. However, the impact of hypertension on the prognosis was not
significant after adjusting for age and sex. For all patients, N-terminal pro-B
type natriuretic peptide (NT-proBNP) levels
Meaning: The COVID-19 patients with hypertension have poor prognosis as compared to those without hypertension, which may be due primary to the differences in clinical characteristics including age. Hypertension per se had a modest impact on the prognosis in COVID-19 patients. In COVID-19 patients with and without hypertension, NT-proBNP may be a better predictor of prognosis than hs-TNI.
In December 2019, an unknown pneumonia first occurred in Wuhan, China, and infected a large number of people, causing many deaths (Gong et al., 2010). Currently, it is rapidly spreading worldwide (Hurt and Zylka, 2012). This novel pneumonia, named coronavirus disease 2019 (COVID-19), is similar to diseases, such as Middle East Respiratory Syndrome (MERS), caused by other coronaviruses, and causes not only shock and acute respiratory distress syndrome (ARDS), but also cardiac injury and heart failure (Wu et al., 2020; H. Xu et al., 2020).
SARS-CoV-2, the pathogen of COVID-19, is a single, positive-stranded RNA virus enveloped by a lipid bilayer. The virus enters host cells through spike (S) proteins via the cell-entry receptor ACE2, which is broadly expressed in many tissues, including pulmonary, cardiac, renal, endothelial, and intestinal tissue (Zhang et al., 2020). Therefore, COVID-19 can affect extrapulmonary tissues and cause multiorgan dysfunction. In fact, evidence has reported that COVID-19 can cause heart injury, kidney injury and liver damage (Cheng et al., 2020; Fan et al., 2020; Wu et al., 2020). Wu et al. (2020) reported that indicators of heart injury are highly associated with mortality in COVID-19 patients (Lala et al., 2020; Wei et al., 2020). However, whether patients with COVID-19 with and without hypertension present similar clinical characteristics and outcomes is unknown. Troponin is part of a protein complex with tropomyosin in myocytes. TnI is ideal biomarkers for assessing myocyte injury because they are specific to cardiac muscle, which is released rapidly after myocardial injury within 3-6 hours and it remains elevated for 7-10 days (Riddell and Lenihan, 2018). NT-proBNP is produced primarily within the myocardium and secreted into the circulation in response to increased pressure and volume overload (Riddell and Lenihan, 2018). Both these biomarkers are negatively related to many cardiovascular disease (Bettencourt et al., 2004; Freda et al., 2003; McEvoy et al., 2015). Whether these cardiac biomarkers equally predict the outcomes of COVID-19 patients with and without hypertension is also unknown. Here, by collecting the data from 414 cases, we seek to provide evidence of different clinical characteristics and outcomes of patients with and without hypertension.
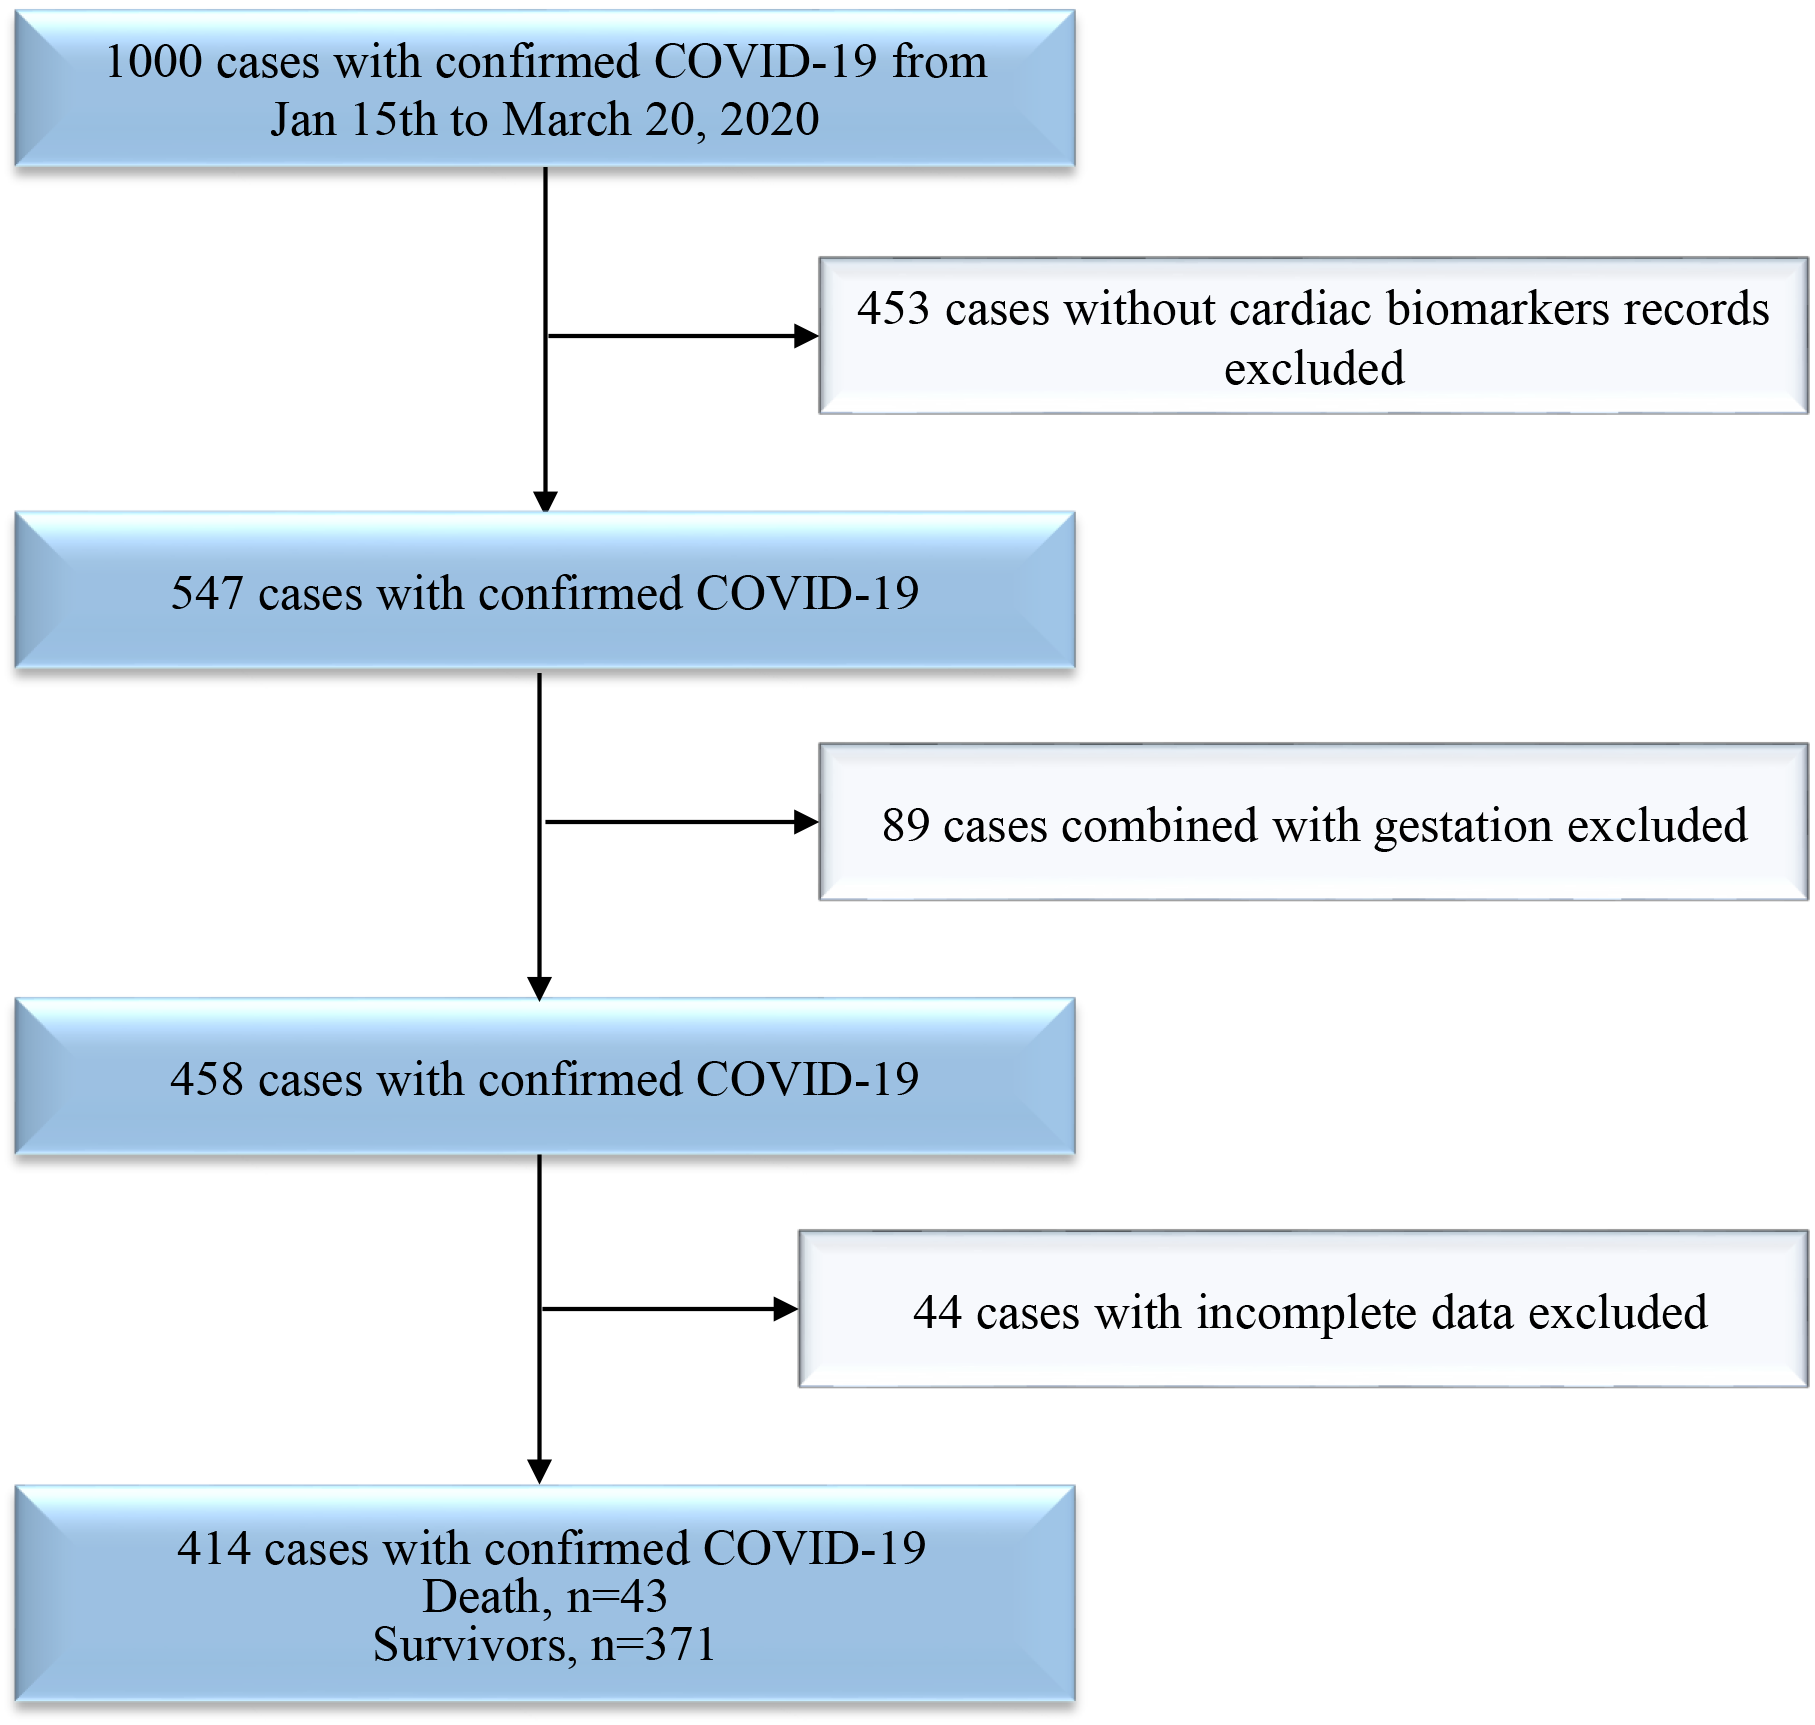 Fig. 1.
Flowchart of the inclusion-exclusion procedure for COVID-19 patients.
We selected COVID-19 patients admitted to Renmin Hospital of Wuhan University (Wuhan, Hubei, China) from Jan 15 to March 10, 2020. All enrolled patients were definitively diagnosed with COVID-19 pneumonia according to the World Health Organization interim guidelines (World Health Organization., 2020). Patients with positive result on high-throughput sequencing or real-time reverse-transcriptase-polymerase-chain-reaction (RT-PCR) assay of nasal and pharyngeal swab specimens were defined as a confirmed case of COVID-19. Patients with missing clinical information, age less than 18 years, or who were pregnant were excluded. Patients without data on cardiac biomarkers, including high-sensitivity troponin I (hs-TNI) and NT-proBNP, were excluded. Up to March 20, 2020, we screened 1000 cases of confirmed COVID-19 in Renmin Hospital of Wuhan University (Fig. 1). A total of 453 cases did not have cardiac biomarker records; 89 cases involved pregnant patients; 34 cases involved repeat hospitalization; and 44 cases had incomplete data. Follow-up was completed for 414 patients in the hospital. A total of 361 patients were cured and discharged, 43 patients died in the hospital, and 11 patients were still in the hospital at the end of the study period. All the research procedures followed the STROBE cohort reporting guidelines (von Elm et al., 2007). This research was approved by the Institutional Review Board of Renmin Hospital of Wuhan University (Wuhan, Hubei, China. Ethics approval number: WDRY2020-K108). The requirement for written informed consent was waived because this research was retrospective observation and anonymization.
Data were retrieved from electronic medical records. Demographic and clinical parameters included age, sex, exposure history, complications on admission, initial symptoms and signs, comorbidities, drug treatments, and outcomes. Data for cardiac biomarkers (hs-TNI, and NT-proBNP) upon admission and at days 3, 7, 10, 15, and 20 of hospitalization were also collected. Two investigators reviewed and extracted all data independently. Patients were divided into two groups: COVID-19 pneumonia combined with hypertension or COVID-19 pneumonia without hypertension.
Shock and acute respiratory distress syndrome (ARDS) were defined in accordance
with the WHO interim guidelines (WHO, 2020). Acute kidney injury was defined
based on the highest serum creatinine level and urine output according to the
KDIGO clinical practice guidelines (2012). The chronic kidney disease was defined
based on Chronic Kidney Disease Epidemiology Collaboration (CKD-EPI) (Levey et al., 2009). Chronic liver disease included hepatitis C, hepatitis B,
alcoholism, nonalcoholic fatty liver disease (NAFLD), autoimmune hepatitis, and
liver cirrhosis (Bashir et al., 2020). COPD was defined according to the most
recent Global initiative for chronic Obstructive Lung Disease (GOLD) strategy for
diagnosis (Mirza et al., 2018). The severity of disease was staged according
to the guidelines for the diagnosis and treatment of COVID-19 (sixth trial
edition) published by the Chinese National Health Commission on February 19,
2020. Normal cases were defined as patient with fever and respiratory symptoms,
imaging shows pneumonia. Severe cases were defined as either (i) respiratory rate
The diagnosis of hypertension at baseline was based on investigator responses to the relevant questions on the case report form. History of clinically significant hypertension, defined as systolic blood pressure of 140 mmHg or higher, diastolic blood pressure of 90 mmHg or higher, or both and was taking at least 1 antihypertensive medication at the time of admission.
The primary composite outcome was admission to the intensive care unit (ICU), mechanical ventilation, or death. We investigated the association between hs-TNI and NT-proBNP and the primary composite outcome and all deaths.
For categorical variables, proportions were used for continuous variables, and means with standard deviations or medians with quartiles were used to describe baseline characteristics. Differences in baseline characteristics between patients with and without hypertension were tested using Chi-square test for categorical variables and Kruskal-Wallis’s test for continuous variables. Kaplan-Meier curves for all deaths and cumulative incidence curves for the composite outcomes were estimated, and differences between groups were compared using the log-rank test. Cox proportional hazard models were used to compare the risk of the patients according to hypertension status for the primary endpoint, all deaths and six comorbidities. Cox proportional hazard models were also used to compare the risk of hs-TNI and NT-proBNP levels for all deaths. The Cox regression models were adjusted in five models.
Model 1: univariate analysis.
Model 2: age + sex.
Model 3 (to adjust difference in Laboratory examination and treatment): age + sex + alanine aminotransferase (ALT) + aspartate aminotransferase (AST) + blood urea nitrogen (BUN) + serum creatinine (sCR) + Glucocorticoid therapy + continuous kidney replacement therapy (CKRT) + Oxygen administration + Noninvasive ventilation (NIV) + invasive mechanical ventilation (IMV) + extracorporeal membrane oxygenation (ECMO).
Model 4 (to adjust difference in complications): age + sex + diabetes + chronic obstructive pulmonary disease (COPD) + chronic liver disease + chronic kidney disease + cerebrovascular disease + cardiovascular diseases.
Model 5 (to adjust difference in complications, blood pressure grade and angiotensin converting enzyme inhibitor/angiotensin receptor blocker (ACEI/ARB) drug used): age + sex + diabetes + COPD + chronic liver disease + chronic kidney disease + cerebrovascular disease + Blood pressure grade + ACEI/ARB.
The upper reference limit (URL) of hs-TNI, defined as the 99th percentile in healthy individuals, is 26 ng/L (26 pg/mL) (Jarolim, 2015). Thus, hs-TNI was dichotomized at or above/below the threshold, and NT-proBNP was also divided by tertiles (upper 75% in the hypertension group).
| Total (n = 414) | Non-hypertension (n = 265) | hypertension (n = 149) | P value | |
| Age median (IQR), year | 61 (19) | 58 (21) | 67 (18) | 0.000* |
| Sex- Male n (%) | 207 (50.1) | 124 (46.8) | 83 (55.7) | 0.051 |
| Comorbidities | ||||
| Diabetes n (%) | 60 (14.5) | 24 (9.1) | 36 (24.2) | 0.000* |
| Cardiovascular diseases | 47 (11.3) | 10 (3.8) | 37 (24.8) | 0.000* |
| (except hypertension) n (%) | ||||
| COPD n (%) | 7 (1.7) | 3 (1.1) | 4 (2.7) | 0.215 |
| Cerebrovascular disease n (%) | 14 (3.4) | 6 (2.3) | 8 (5.4) | 0.084 |
| Chronic kidney disease n (%) | 8 (1.9) | 2 (0.8) | 6 (4.0) | 0.221 |
| Chronic liver disease n (%) | 17 (3.9) | 7 (2.4) | 10 (6.7) | 0.027* |
| Hypertension duration, median (IQR), y | —— | —— | 10 (6-17) | —— |
| BP grade | 0.000* | |||
| A | 352 (85.0) | 265 (100) | 87 (58.4) | |
| B | 40 (9.7) | 0 (0) | 40 (26.8) | |
| C | 14 (3.4) | 0 (0) | 14 (9.4) | |
| D | 8 (1.9) | 0 (0) | 8 (5.4) | |
| Signs and symptoms | ||||
| Fever n (%) | 303 (73.2) | 111 (74.5) | 0.371 | |
| 192 (72.5) | ||||
| Cough n (%) | 196 (47.3) | 129 (48.7) | 67 (45.0) | 0.267 |
| Fatigue n (%) | 84 (20.3) | 52 (19.6) | 32 (21.5) | 0.371 |
| Chest tightness and shortness of breath n (%) | 75 (18.1) | 50 (18.9) | 25 (16.8) | 0.348 |
| Anorexia/ Nausea n (%) | 13 (3.1) | 2 (3.5) | 1 (2.0) | 0.469 |
| Dyspnea n (%) | 6 (5.6) | 17 (6.4) | 12 (8.1) | 0.333 |
| Pharyngalgia n (%) | 12 (2.9) | 6 (2.3) | 6 (4.0) | 0.232 |
| Diarrhea/ Abdominal pain n (%) | 43 (10.4) | 29 (10.9) | 14 (9.4) | 0.276 |
| Headache/ muscle ache n (%) | 24 (5.8) | 14 (5.3) | 10 (6.7) | 0.347 |
| Onset of symptom to Hospital admission, median (IQR), d | 10 (9.25) | 10 (8) | 12 (11) | 0.005* |
| Disease Severity n (%) | ||||
| Normal | 228 (55.1) | 148 (55.8) | 80 (53.7) | 0.002* |
| Severe type | 135 (32.6) | 95 (35.8) | 40 (26.8) | |
| Critical type | 51 (12.3) | 22 (8.3) | 29 (19.5) | |
| Implications n (%) | ||||
| Shock | 27 (6.5) | 11 (4.2) | 16 (10.7) | 0.009* |
| ARDS | 58 (14.0) | 27 (10.2) | 31 (20.8) | 0.003* |
| AKI | 12 (2.9) | 2 (0.8) | 10 (6.7) | 0.001* |
| Treatment n (%) | ||||
| Antiviral therapy | 383 (92.5) | 242 (91.7) | 140 (94) | 0.264 |
| ACEI/ARB | 22 (5.3) | 0 (0) | 22 (14.8) | 0.000* |
| Antibiotic therapy | 108 (26.1) | 67 (25.3) | 41 (27.5) | 0.350 |
| Vasopressors | 22 (5.3) | 9 (3.4) | 13 (8.7) | 0.020* |
| Severe type | 0 | 0 | 0 | - |
| Critical type | 22 (43.1) | 9 (40.9) | 13 (44.8) | 0.503 |
| Glucocorticoid therapy | 166 (40.1) | 104 (39.2) | 62 (41.6) | 0.356 |
| CKRT | 9 (2.2) | 7 (2.6) | 0.312 | |
| 2 (1.3) | ||||
| Oxygen administration | 216 (52.2) | 130 (49.1) | 86 (57.1) | 0.056 |
| NIV | 41 (9.9) | 20 (7.5) | 21 (14.1) | 0.026* |
| IMV | 22 (5.3) | 9 (3.4) | 13 (8.7) | 0.020* |
| ECMO | 1 (0.2) | 1 (0.4) | 0 | 0.64 |
| Death n (%) | 43 (10.4) | 18 (6.8) | 25 (16.8) | 0.001* |
| Abbreviations: AKI, acute kidney injury; ARDS, acute respiratory
distress syndrome; CKRT, continuous kidney replacement therapy; COPD, chronic
obstructive pulmonary disease; ECMO, extracorporeal membrane oxygenation; IQR,
Interquartile ranging; IMV, invasive mechanical ventilation; NIV, noninvasive
ventilation; BP grade, blood pressure grade: (A) BP | ||||
| Normal range | Non-hypertension (n = 265) | hypertension (n = 149) | P value | |
| Leukocyte count, × 10/L Median (IQR) | 3.5 |
5.72 (2.98) | 5.54 (2.86) | 0.978 |
| Lymphocyte count, × 10/L Median (IQR) | 1.1 |
1.12 (0.86) | 1.03 (0.91) | 0.392 |
| Hemoglobin, g/L mean (SD) | 130 |
126.59 |
123.44 |
0.049* |
| Platelet count, × 10/L Median (IQR) | 125 |
214 (93.5) | 205 (95) | 0.073 |
| Prothrombin time s Median (IQR) | 9 |
11.8 (1.3) | 11.9 (1.41) | 0.21 |
| Activated partial thromboplastin time s Median (IQR) | 25 |
27.6 (3.75) | 27.5 (4.68) | 0.894 |
| D-dimer mg/L Median (IQR) | 0 |
0.63 (1.24) | 0.81 (2.04) | 0.007* |
| Procalcitonin ng/mL | 109 (44.9) | 43 (30.7) | 0.004* | |
| Alanine aminotransferase, U/L Median (IQR) | 9 |
27 (29.5) | 24 (18) | 0.311 |
| Aspartate aminotransferase, U/L Median (IQR) | 15 |
26 (21) | 26 (19) | 0.995 |
| Total bilirubin, mmol/L Median (IQR) | 0 |
10.4 (5.4) | 11.1 (6.3) | 0.148 |
| Albumin g/L Median (IQR) | 40 |
38.1 (7.48) | 37 (6.2) | 0.173 |
| Blood urea nitrogen, mmol/L Median (IQR) | 3.1 |
4.69 (2.21) | 5.05 (2.82) | 0.000* |
| Serum creatinine, |
57 |
58.5 (21) | 64 (21) | 0.000* |
| Creatinine kinase, U/L Median (IQR) | 50 |
58 (59.5) | 65 (62) | |
| Lactose dehydrogenase, U/L Median (IQR) | 120 |
251 (143) | 249 (180) | 0.176 |
| CD3 T lymphocyte count (/uL) Median (IQR) | 723 |
638 (649) | 642 (677) | 0.461 |
| CD4 T lymphocyte count (/uL) Median (IQR) | 404 |
392 (421) | 415 (463) | 0.827 |
| CD8 T lymphocyte count (/uL) Median (IQR) | 220 |
220 (264) | 211 (225) | 0.173 |
| Abbreviations: IQR, Interquartile ranging; SD, standard
deviation. *P values indicate differences between hypertension and non-
hypertension patients. P | ||||
The study population included 414 hospitalized patients with confirmed COVID-19. The median age was 61 years (IQR 19), and 207 (50.1%) were men. Of these patients, 149 (36.0%) had hypertension (28 combined with chronic stable coronary heart disease, 1 with a history of myocardial infarction, 1 with a history of viral myocarditis, 2 with a history of dilated cardiomyopathy, and 5 with arrhythmia [2 with sick sinus syndrome and with pacemaker implantation; 1 with paroxysmal atrial fibrillation and 2 with bradycardia]). In non-hypertension group, 7 combined with chronic stable coronary heart disease, 3 combined with paroxysmal atrial fibrillation. Patients with hypertension were older and had a longer time from the onset of symptoms to hospital admission than those without hypertension. A larger proportion of patients with hypertension had a history of diabetes and chronic liver disease than those without hypertension. The sex ratio and the history of COPD, cerebrovascular disease, and chronic kidney disease were not different between the two groups (Table 1). The initial symptoms and signs were not significantly different between the two groups; fever, cough, fatigue, and chest tightness/shortness of breath were the most common symptoms, presenting in 73.2%, 47.3%, 20.3%, and 18.1%, respectively, of all patients. The distribution of disease severity differed significantly in patients with and without hypertension. Most patients had moderate disease, but critical disease was more common in individuals with hypertension. Patients with hypertension had a higher rate of complications, including shock, ARDS, and acute kidney injury (AKI) than patients without hypertension. NIV and IMV were more common in individuals with hypertension than in those without hypertension. Oxygen administration, antiviral therapy, glucocorticoid therapy, CKRT, antibiotic use, and ECMO use were not different between the two groups. Higher death rates, and vasopressor use was also observed in the hypertension group than in the nonhypertension group. Furthermore, vasopressor use differences mainly existed in critical type patients (Table 1).
On admission, patients with hypertension had a lower hemoglobin level and higher
D-dimer, blood urea nitrogen, and serum creatinine levels than those without
hypertension (Table 2). In addition, 243 nonhypertensive patients and 140
hypertensive patients had procalcitonin results. However, there were more cases
of procalcitonin
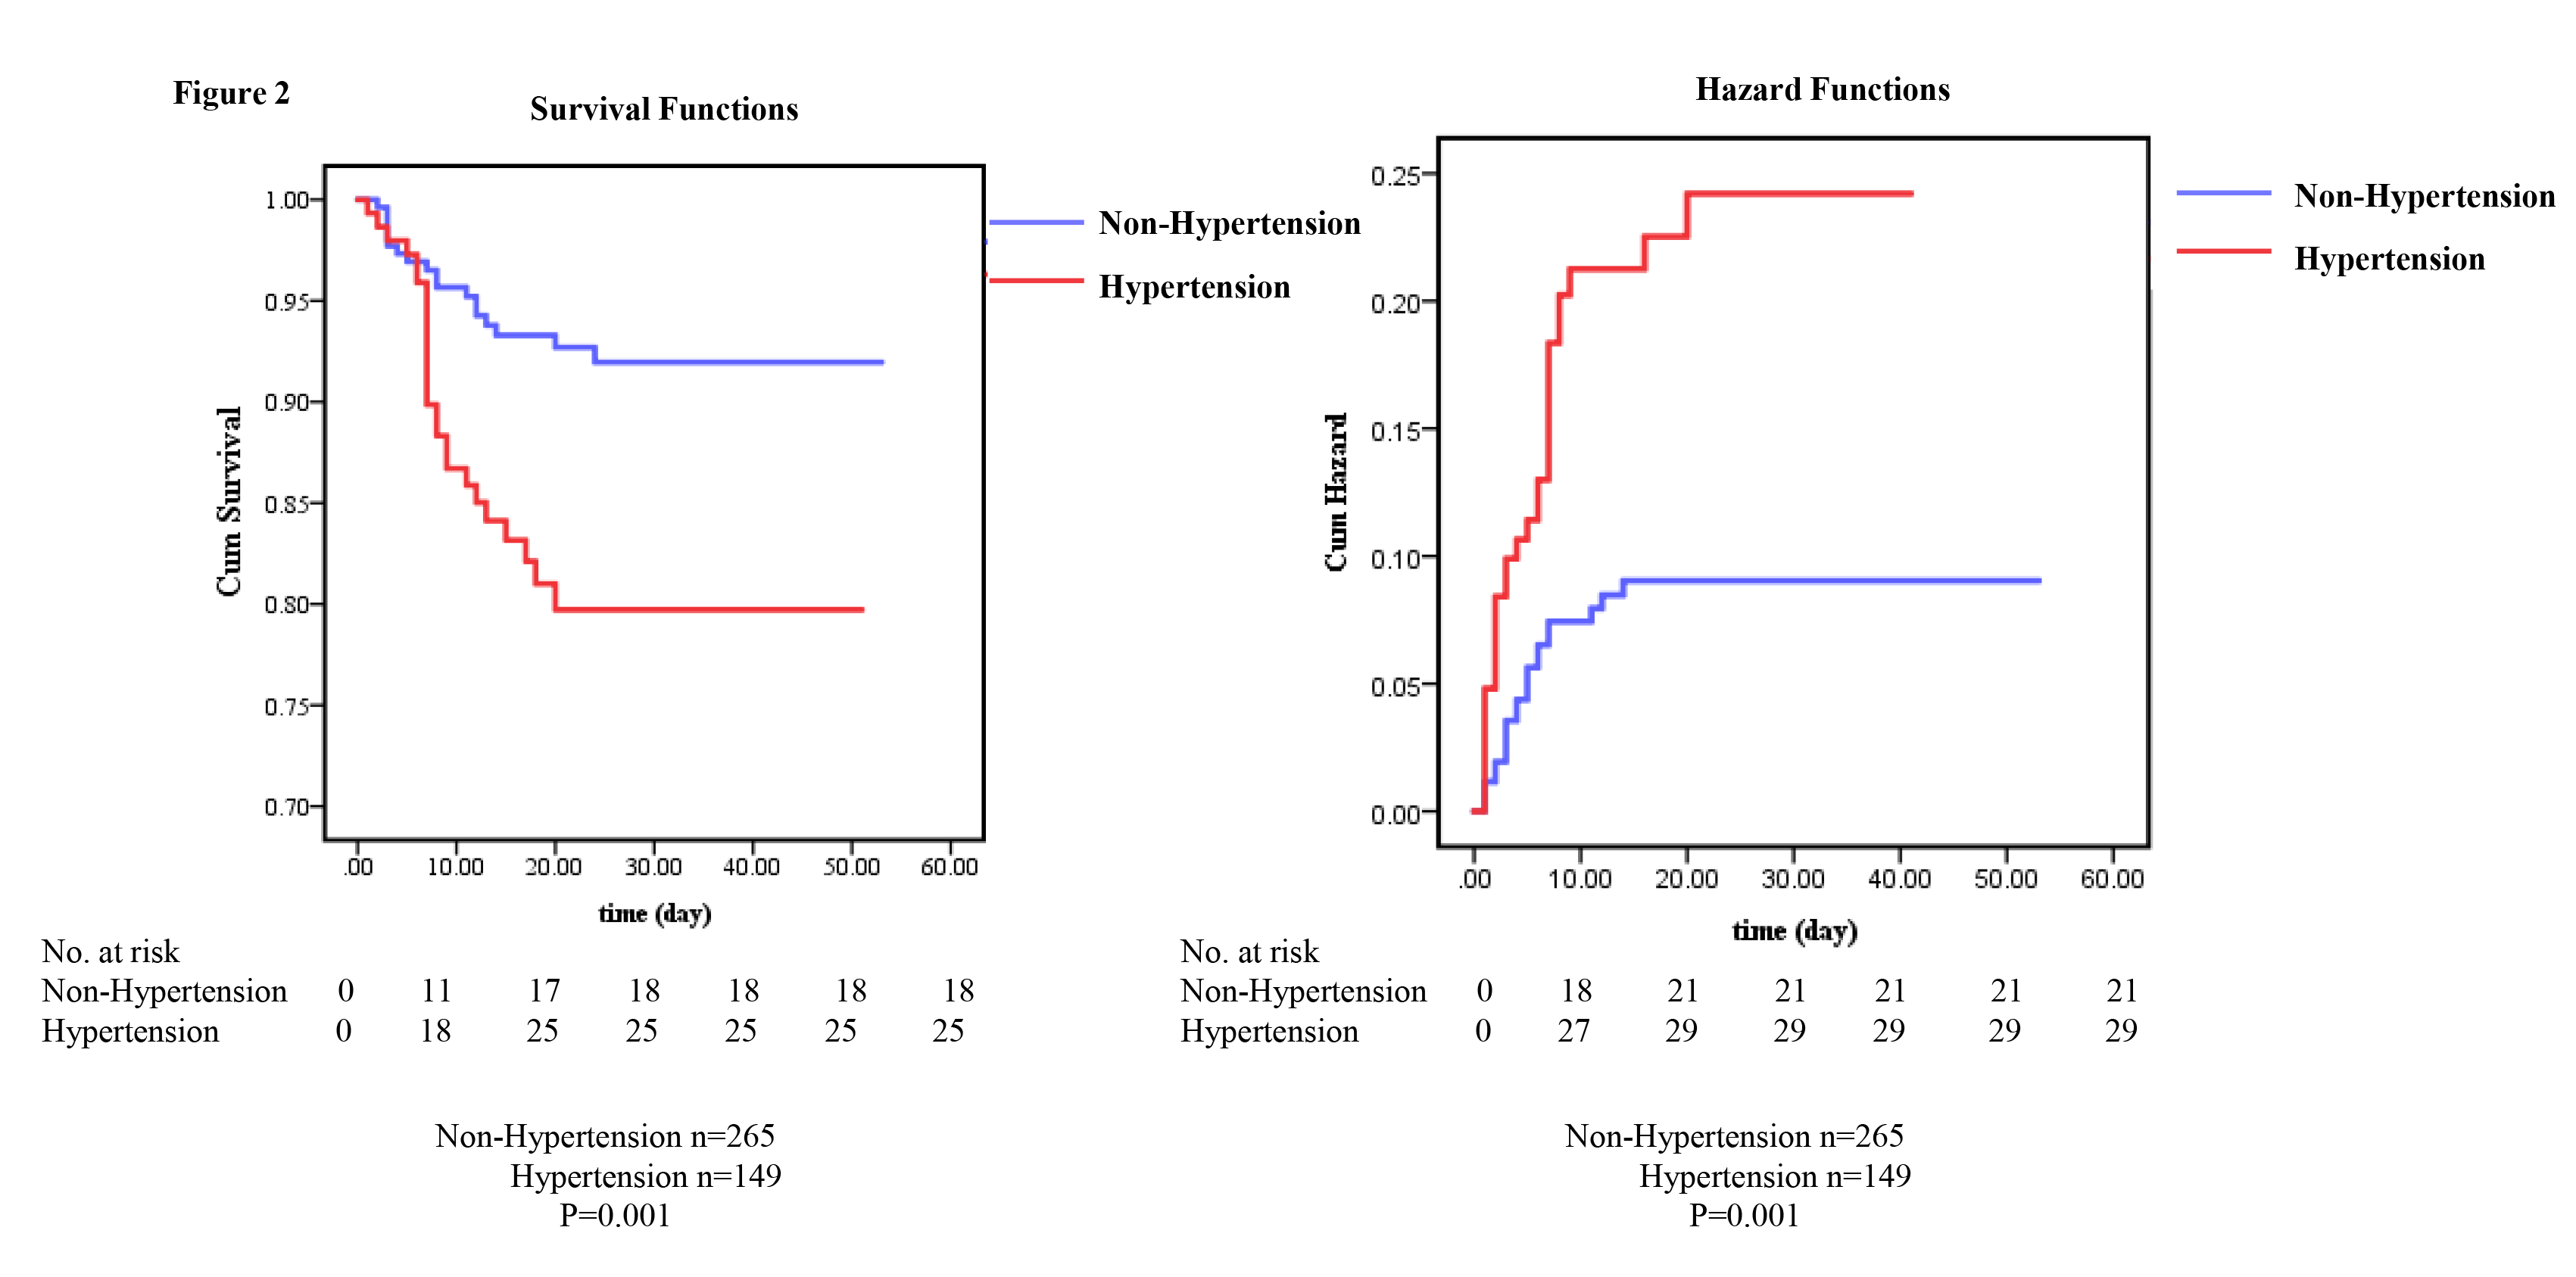 Fig. 2.
Mortality and cumulative incidence of composite outcomes in COVID-19 patients with and without hypertension. (A) Kaplan-Meier curves for all deaths in the hospital. (B) Kaplan-Meier curves for the cumulative incidence of the composite outcome (intensive care unit (ICU) admission, mechanical ventilation, or death).
Among the 414 patients, 361 patients were cured and discharged, 43 patients died in the hospital, and 11 patients were still in the hospital at the end of the study period. The percentage of patients admitted to the ICU requiring invasive ventilation and who eventually died was 19.5% (29) in patients with hypertension and 7.9% (21) in patients without hypertension (P = 0.001). The death rates in patients with and without hypertension were 16.8% and 6.8%, respectively (Table 1, P = 0.001). The Kaplan-Meier curves for all deaths and cumulative incidence curves are shown in Fig. 2.
The results of the univariate Cox regression risk model are shown in Table S1. Patients with hypertension had a significantly higher risk of all deaths than nonhypertension patients [HR: 2.68; 95% CI (1.46~4.91)]. Patients with cerebrovascular disease had a significantly higher risk of the all deaths than noncerebrovascular disease patients, even after adjusting for age and sex [HR: 4.98; 95% CI (2.079~11.942)]. Other comorbidities (diabetes, COPD, chronic liver disease, and chronic kidney disease) as well as BP grade did not seem to be high risk factors for death (Table S1). When we adjusted for age and sex, no difference was showed about the risk factor of all deaths between hypertension and nonhypertension patients [HR: 1.77; 95% CI (0.93~3.36)] (Table S1). In patients with hypertension, the use of ACEIs/ARBs was not a risk factor for all deaths (Table S2), even in the univariate Cox model.
| Number | Non-hypertension (n = 265) | hypertension (n = 149) | P value | |
| On admission | ||||
| hs-TNI |
16 (6.4) | 32 (22.1) | 0.000* | |
| NT-proBNP Median | 77.3 (30, 219) | 141.9 (50, 474) | 0.000* | |
| IQR- tertile 4, n (%) | 20 (8.6) | 35 (24.8) | 0.000* | |
| During hospital | ||||
| hs-TNI |
33 (12.6) | 45 (30.4) | 0.000* | |
| NT-pro BNP IQR- tertile 4, n (%) | 34 (14.2) | 48 (33.3) | 0.000* | |
| On admission | ||||
| disease_severity | ||||
| hs-TNI |
A | 3 (1.1) | 9 (6.0) | 0.005 |
| B | 8 (3.0) | 11 (7.4) | 0.007 | |
| C | 5 (1.9) | 12 (8.1) | 0.173 | |
| NT-proBNP IQR- tertile 4, n (%) | A | 6 (2.3) | 11 (7.4) | 0.014 |
| B | 7 (2.6) | 9 (6.0) | 0.028 | |
| C | 7 (2.6) | 15 (10.1) | 0.140 | |
| hs-TNI, high sensitivity troponin I; IQR- tertile 4, the upper 75 percentage of hypertension group; NT-proBNP, N-terminal pro B-type natriuretic peptide; disease severity: (A) Normal; (B) Severe type; (C) Critical type. *P values indicate differences between hypertension and non- hypertension patients. | ||||
Fifteen patients in the nonhypertension group and 4 patients in the hypertension
group did not have hs-TNI admission data. A total of 22.1% of patients with
hypertension had an hs-TNI value
Thirty-three patients in the nonhypertension group and 8 patients in the
hypertension group did not have NT-proBNP admission data. Patients with
hypertension had higher median levels of NT-proBNP at baseline than patients
without hypertension [141.9 pg/mL, IQR (50~474) vs. 77.3 pg/mL,
IQR (30~219); P = 0.000]. Approximately 13.3% of all
patients had a NT-proBNP value in the top tertile (
| HR (95% CI) | ||
| Non-hypertension | hypertension | |
| Model 1 | ||
| hs-TNI |
6.76 (2.35 |
3.50 (1.57 |
| Per Log 10 increase | 2.17 (1.61 |
1.60 (1.28 |
| NT-proBNP IQR- tertile 4 | 8.66 (3.22 |
5.87 (2.49 |
| Per Log10 increase | 1.71 (1.36 |
1.75 (1.35 |
| Model 2 | ||
| hs-TNI |
6.75 (2.35 |
3.49 (1.56 |
| Per Log10 increase | 2.18 (1.61 |
1.60 (1.28 |
| NT-proBNP IQR- tertile 4 | 8.66 (2.22 |
5.87 (2.48 |
| Per Log10 increase | 1.71 (1.36 |
1.75 (1.35 |
| Model 3 | ||
| hs-TNI |
4.15 (1.26 |
1.14 (0.34 |
| NT-proBNP IQR- tertile 4 | 0.50 (0.10 |
3.80 (1.44 |
| Model 4 | ||
| hs-TNI |
3.52 (0.97 |
2.38 (0.91 |
| NT-proBNP IQR- tertile 4 | 7.14 (2.00 |
5.38 (1.84 |
| Model 5 | ||
| hs-TNI |
- | 2.74 (0.99 |
| NT-proBNP IQR- tertile 4 | - | 6.28 (2.15 |
| ALT, alanine aminotransferase; AST, aspartate aminotransferase;
BUN, Blood urea nitrogen; CR, Serum creatinine; CKRT, continuous kidney
replacement therapy; CI, confidence interval; ECMO, extracorporeal membrane
oxygenation; HR, hazard ratio; hs-TNI, high sensitivity troponin I; IQR- tertile
4, the upper 75 percentage of hypertension group; IMV, invasive mechanical
ventilation; NT-proBNP, N-terminal pro B-type natriuretic peptide; NIV,
noninvasive ventilation; COPD, chronic obstructive pulmonary diseases.
*P | ||
During follow-up, patients with hs-TNI
Patients with NT-proBNP in the highest tertile had a significantly higher risk
of death irrespective of hypertension status (Fig. S2C and S2D). In the Cox
regression models incorporating NT-proBNP as tertiles or as a continuous variable
(per log
This study has two key findings. First, The COVID-19 patients with hypertension have poor prognosis as compared to those without hypertension, which may be due primary to the differences in clinical characteristics including age. Hypertension per se had a modest impact on the prognosis in COVID-19 patients. Second, in COVID-19 patients with and without hypertension, NT-proBNP, a marker of cardiac wall stress due to volume and pressure overload, may be a better predictor of prognosis than hs-TNI, a marker of myocardial injury.
A previous study performed a meta-analysis on six studies with 1527 patients and
found that the incidence of patients with previous cardiovascular metabolic
diseases was higher in ICU/severe cases than in their non-ICU/severe counterparts
(Li et al., 2020). Our study provided further evidence of basic
characteristics between COVID-19 patients with and without hypertension.
Interestingly, male patients were clearly not the majority of COVID-19 patients,
but patients with hypertension were older, and they had more often history of
diabetes and chronic liver disease. But the history of COPD, cerebrovascular
disease or chronic kidney disease showed no difference. A greater proportion of
critical illness as well as complications including shock, ARDS, and AKI were
observed in patients with hypertension. Patients with hypertension had higher
rates of NIV and IMV therapy. The rates of antiviral therapy and glucocorticoid
therapy were the same in patients with and without hypertension. The all deaths
rates in patients with hypertension were 2.5-fold higher than those in
nonhypertensive patients. The risk of composite outcomes in patients with
hypertension was 2.6-fold higher than those in nonhypertensive patients (Table
S1). In our study, the higher risk of both death and composite outcomes in
patients with hypertension than in nonhypertensive patients was abolished when we
used an adjusted Cox regression model (age and sex in Table S1). This suggests
that hypertension per se had a modest impact on the prognosis in COVID-19
patients. Inconsistent with our results, a study analyzed 6560 patients from 30
studies and found that hypertension was associated with increased composite poor
outcomes, including mortality, severe COVID-19, ARDS, ICU care, and disease
progression (Pranata et al., 2020). These results may be due to the large age
gap between patients with and without hypertension. Lian et al. (2020)
reported that older COVID-19 patients had more coexisting diseases and higher
rates of severe and critical types. In addition, these findings may be influenced
by the RASS system, but the activity of the RASS system in COVID-19 patients has
not been tested clinically. ACEI and ARB are associated with ACE-2 upregulation.
But in our study, we did not observe a positive correlation of the use of
ACEIs/ARBs and increased risk factor for all deaths (Table S2), even in the
univariate Cox model. Recent study reported the use of ACEI/ARBs was associated
with reduced risk of inpatient death in those
Importantly, the laboratory findings of patients with hypertension were quite
different from those of patients without hypertension. Lower levels of
hemoglobin, higher D-dimer and higher blood urea nitrogen and serum creatinine
were found in patients with hypertension than in those without hypertension.
These could explain the higher rates of NIV and IMV treatment and the higher rate
of complications in patients with hypertension. Of note, the positive association
between blood pressure and elevated D-dimer may cause the high prevalence of
hypertension (Lammertyn et al., 2014). Consistently, we also found a higher
D-dimer level in patients with hypertension, which may leads to increase risk of
thrombosis as reported (Monfardini et al., 2020). Interestingly, we observed
a lower rate of high procalcitonin (
A few prior studies have reported that COVID-19 patients with cardiac injury
have higher death rates than those without cardiac injury (Shi et al., 2020).
Of note, Han et al. analyzed data from our hospital and found that higher
concentrations of creatine kinase isoenzyme-MB (CK-MB), myoglobin (MYO), cardiac
troponin I (ultra-TNI), and NT-proBNP in venous blood were associated with the
severity and case fatality rate of COVID-19 (Han et al., 2020). In accordance
with this, we found the same median levels of hs-TNI in COVID-19 patients with
hypertension and without hypertension. However, when we used the 99th percentile
prognostication threshold of hs-TNI in normal individuals of
Evaluated levels of BNP have been reported in critically ill COVID-19 patients (Peng et al., 2020). Acute myocarditis caused by MERS-CoV was also found to have high levels of NT-proBNP (Alhogbani, 2016). Based on our study and these prior findings, we can conclude that patients in the hypertension group have a higher level of baseline NT-proBNP. During the follow-up period, the NT-proBNP was consistently higher than that in the nonhypertension group at the corresponding time point. Moreover, NT-proBNP is an independent predictor of adverse outcomes in patients with and without hypertension (model 4 and model 5). NT-proBNP is the most powerful predictor of prognosis in heart failure (Bettencourt et al., 2004). This highlights the considerable contribution of NT-proBNP to the hazard risk in COVID-19 patients both with and without hypertension. Thus NT-proBNP may be a better predictor of prognosis than hs-TNI. As noted, during the 20 days’ follow-up, we found that hypertensive patients seemed to have longer and higher NT-proBNP and hs-TNI than nonhypertensive patients. This reflects more severe illness in hypertension patients. However, due to the limited sample size, more evaluation should be performed.
Some important clinical data were missing, such as echocardiography, and electrocardiogram data, due to the lack of medical staff to perform the procedures. Continuous monitoring of the variation of these biomarkers is only available in patients with persisting symptoms. The data of these patients were significantly different from those of the other patients who improved quickly. Hypertension status was defined according to medical records. A degree of misclassification will have occurred as some patients have undiagnosed hypertension. However, all the data and event rates in our study were accurately categorized. In addition, population selection bias exists, since clinical doctors tend to perform repeat measurements of parameters in patients with high risk. Moreover, patients with existing hypertension tend to have cardiac biomarkers measured more readily than nonhypertensive patients. And doctors were more tend to request cardiac troponin and NT-proBNP test on admission in patients presenting some signs of cardiac dysfunction. These causes case selection bias. In addition, both troponin and BNP (and related markers) are also inherently increased in hypertensive patients (McEvoy et al., 2015). And serum NT-proBNP level is inversely associated with hemoglobin level and obese status (Desai et al., 2007; Krauser et al., 2005). Thus, further studies are still needed to eliminate the influence of these bias. The number of follow-up data points after admission is rare in both the CVD and non-CVD groups. Thus, more data about the dynamic changes of cardiac biomarkers in COVID-19 patients need to be collected. Despite the limitations, the findings presented here highlight the needs to consider all the complications not hypertension per se in COVID-19 management.
The COVID-19 patients with hypertension have poor prognosis as compared to those without hypertension, which may be due primary to the differences in clinical characteristics including age. Hypertension per se had a modest impact on the prognosis in COVID-19 patients. In COVID-19 patients with and without hypertension, NT-proBNP, a marker of cardiac wall stress due to volume and pressure overload, may be a better predictor of prognosis than hs-TNI, a marker of myocardial injury.
Qing-Qing Wu contributed to the conception and design of the study; Qi Yao, Jian Ni, Tong-Tong Hu collected data; Zhu-Lan Cai, Jin-Hua Zhao, Qing-Wen Xie and Chen Liu analysed the data; Qing-Qing Wu, Qi Yao and Jian Ni wrote and revised the manuscript.
The datasets used and/or analyzed in the current study are available from the corresponding author upon reasonable request.
We thank professor Gaokun Qiu (Department of Occupational and Environmental Health and Department of Epidemiology and Biostatistics, Tongji Medical College, Huazhong University of Science and Technology, Wuhan, China) helping us with the statistical analysis.
The authors declare no conflicts of interest.