
Artificial Intelligence (AI), in general, refers to the machines (or computers) that mimic “cognitive” functions that we associate with our mind, such as “learning” and “solving problem”. New biomarkers derived from medical imaging are being discovered and are then fused with non-imaging biomarkers (such as office, laboratory, physiological, genetic, epidemiological, and clinical-based biomarkers) in a big data framework, to develop AI systems. These systems can support risk prediction and monitoring. This perspective narrative shows the powerful methods of AI for tracking cardiovascular risks. We conclude that AI could potentially become an integral part of the COVID-19 disease management system. Countries, large and small, should join hands with the WHO in building biobanks for scientists around the world to build AI-based platforms for tracking the cardiovascular risk assessment during COVID-19 times and long-term follow-up of the survivors.
The SARS-CoV-2 is a single-stranded ribonucleic acid (RNA) virus belongs to the
corona family of viruses, which can lead to several pulmonary and extrapulmonary
complications such as viral pneumonia, acute respiratory distress syndrome
(ARDS), cardiovascular disease, cerebrovascular disease, or even systemic
hyper-inflammation syndrome that leading to a multiorgan failure (WHO, 2020).
The first case of SARS-CoV-2 is diagnosed in Wuhan, the capital city of the Hubei
province in the People’s Republic of China (Eder, 2020; Edmonds, 2020). It was
suspected that the SARS-CoV-2 was by horseshoe bats, mutating into pangolin as
intermittent hosts, and then made their way into humans (Bale, 2020). The
SARS-CoV-2 is believed to be transmitted from human-to-human mainly through
virus-laden droplets (generated by coughing, sneezing, or talking), and through
close contacts with infected persons or through touching surfaces or objects with
the virus on it (Tan and Aboulhosn, 2020). It has a spread function of three
(R
 Fig. 1.
Left: World map showing the COVID-19 (Courtesy: https://ourworldindata.org). Right: SARS-binding to ACE2 receptor by the spike protein (S protein) to gain intracellular entry (Courtesy AtheroPoint™, Roseville, CA, USA).
The pathophysiology of the SARS-CoV-2 is not yet fully established. Recent studies have shown that the virus gains entry into the cells through the angiotensin-converting enzyme 2 (ACE2) receptors that clamp the S-protein on the surface of SARS-CoV-2 (see Fig. 1, right) (Hoffmann et al., 2020). The ACE 2 receptors are human homologs that are widely expressed in the cells of the heart, lungs, kidney, and intestine (Turner et al., 2004). The ACE2 plays a counterbalancing role in the renin angiotensin-converting system (RAS) (Akhmerov and Marbán, 2020; Zou et al., 2020) and is a carboxypeptidase that converts angiotensin II (Ang II) into angiotensin (1-7) (Ang 1-7) (Donoghue et al., 2000).
Reports from admitted patients in various hospitals in Wuhan suggest serious cardiac injury in at least 12%-26% of admitted patients (L. Chen et al., 2020; C. Huang et al., 2020; S. Shi et al., 2020; Zheng et al., 2020). The cardiac injury is thought to be due to the presence of mural cells (pericytes) in the heart, having a high expression of ACE2 (L. Chen et al., 2020). The recent article by Libby (2020) also showed that the release of cytokines during the infection could affect the intramural coronary vessels of the patients without any pre-existing cardiovascular disease (CVD). It has been seen that patients who had SARS showed tissue fibrosis and microangiopathy, and thus needed their heart to be monitored (Ferreira et al., 2018; Inciardi et al., 2020b; Wu and McGoogan, 2020). Wu et al. (2017) had recently emphasized the role of studying the long-term effects of clinical treatments in SARS patients. The authors compared SARS survivors against healthy controls and showed that there were significant differences in the serum metabolomes and thus there is a need for special monitoring of patients with SARS. The patients with cardiovascular disorders have a high vulnerability to SARS-CoV-2 (S. Shi et al., 2020) that can lead to complications such as myocardial injury, systemic inflammation, which further leads to cardiac failure, plaque rupture, arrhythmias, venous thromboembolism, and coronary thrombosis (Bansal, 2020; Driggin et al., 2020). The SARS-CoV-2 may predispose patients to thrombotic disease due to excessive inflammation, platelet activation, endothelial dysfunction, and stasis (Bikdeli et al., 2020). Therefore, it is of prime importance to address the issues like, how do we monitor patients (a) who are asymptomatic or mildly symptomatic, (b) have moderate to severe symptoms of COVID-19 perhaps requiring hospitalization, (c) have recovered from COVID-19 in an early pandemic, (d) who can get re-infected after recovery, and (e) what happens to the patients who have the acute CVD due to hospital overloading (Huet et al., 2020). Should we have a risk assessment system in place, which can study and regularly monitor cardiac conditions? The complete management requires more than just temporary check-ups of patients, but a global tracking scheme that can prepare us for further pandemics. It is thus essential to understand the pathways for heart injury, and further to understand what kinds of tools and techniques one can use to track pandemics like COVID-19, thereby preventing its spread. This can further help in the development of the drug-delivery systems.
Artificial Intelligence (AI) (Flach, 2001; James et al., 2013) techniques such as machine learning (ML) and deep learning (DL) in medicine refers to the cognitive functions by machines in understanding trends, generating warnings, diagnosis, prognosis, and treatment of patients (Naudé, 2020). It is already deeply embedded in several fields of medicine, such as medical imaging (Biswas et al., 2019; Saba et al., 2019), drug-delivery design (Hassanzadeh et al., 2019), and computational biology (Angermueller et al., 2016; Libbrecht and Noble, 2015). The advancements in Internet-of-Things (IoT) technologies have made a significant effort towards “call-to-action for telemedicine” (Ohannessian et al., 2020; Thomas et al., 2020) that would strengthen tele-consultation, remote patient monitoring, and disease management protocols (Portnoy et al., 2020; Wang and Bhatt, 2020), and computer-aided diagnosis in general (Acharya et al., 2008; El-Baz and Suri, 2011). Evidence suggests that telemedicine (TM) (Ganasegeran and Abdulrahman, 2020), in combination with AI has the potential to locate, diagnose, and treat the patients in times of epidemics such as the Zika pandemic in 2007-17 (Daughton and Paul, 2019) and Influenza A H1N1 Pandemic in 2009-11 (Signorini et al., 2011). Thus, the AI-based telemedicine technologies have the potential to provide ideal solutions in non-invasive patient care systems, which is suitable for the current and long-term tracking of COVID-19 patients. This perspective is mainly geared towards the tools and techniques for COVID-19 patient management using AI-based solutions in a big data framework for pandemic management and provides recommendations for future pandemic prevention.
This paper is illustrated in 7 sections, which are as follows. Section 1 covers introduction (already explained above) and Section 2 covers the basics of four pathways leading to cardiac injury. The motivation and role of AI for risk assessment of CVD is presented in Section 3. Section 4 shows the applications of imaging and non-imaging-based applications of AI in medicine. Section 5 presents the tracking of surrogate markers for CVD during COVID times and beyond. Section 6 presents the recommendations and preparedness for handling current and future pandemics. The conclusion of this review is presented in Section 7.
Several studies have found that SARS-CoV-2 uses the ACE2 receptor for entering into the cell (de Wit et al., 2016; Hoffmann et al., 2020; Wu et al., 2012) (see Fig. 1), right where the SARS-CoV-2 is labeled as A and the ACE2 as well as the gray color cell, labeled B). ACE2 is a carboxypeptidase that converts angiotensin II (Ang II) into angiotensin (1-7) (Ang 1-7) and is homologous to angiotensin-converting enzyme 1 (ACE1). ACE2 is key enzyme in the renin angiotensin-converting system (RAS) (Bernstein, 2002; Donoghue et al., 2000; Turner et al., 2004). ACE1 and ACE2 are widely expressed in cardiomyocytes, cardiac fibroblasts, coronary endothelial, mural cells (in the heart), type 2 pneumocytes (in the lungs), and enterocytes (in the intestine) (Williams and Scholey, 2018; Zou et al., 2020).
Several published studies have shown that SARS-CoV-2 can cause both pulmonary and extrapulmonary complications like cardiovascular (CV) complications (Geng et al., 2020; Xiong et al., 2020). Another solid evidence by Zunyou, Wu et al. (Wu and McGoogan, 2020), and Kevin J et al. (Clerkin et al., 2020) submitted a summary of the report to the Chinese center for disease control and prevention indicating 1023 deaths in 44672 confirmed cases with COVID-19, i.e. a case-fatality rate (CFR) of 2.3, and stating that patients with underlying cardiovascular disease or hypertension had a higher CFR compared with people without comorbidities. Thus, it is a wake-up call to understand the nature of COVID-19, how it causes organ failure, especially heart and how we can monitor these patients before, during, or long-term follow-up of the survivors after COVID-19 times using smart, accurate, and affordable systems. Additionally another interesting Chinese cohort study by Shi et al. (S. Shi et al., 2020) found that COVID patients with cardiac injury had high mortality compared with those without cardiac abnormality 51.2% vs 4.5% in 416 hospitalized patients between January 2020-February 2020. The following are the common mechanisms responsible for CV complications in COVID-19, these include (i) myocardial oxygen demand mismatch, (ii) dysregulation of the RAAS after SARS-CoV-2, (iii) systemic inflammatory response, and (iv) myocarditis.
Pathway (I) Myocardial oxygen demand mismatch (shown in Fig. 2): This pathway triggers by entering of SARS-CoV-2 through the respiratory pathway and binds to the ACE2 receptor on the surface of alveolar type 2 (AT2) cells in the pulmonary epithelium (Filardi and Morano, 2020; Zheng et al., 2020). These results in exaggerated neutrophil accumulation cause enhance in vascular permeability of subendothelial space which leads to the formation of alveolar exudates (C. Huang et al., 2020; Wang et al., 2019). Further, it leads to pulmonary edema resulting in an alveolar gas exchange disorder known as “acute respiratory distress syndrome” (ARDS), which results in depletion of oxygen levels causing hypoxia (Barnes et al., 2020; Fadini et al., 2020). Supporting evidence by Kwenandar et al. (2020) has shown that COVID-19 patients had up to 33% prevalence of cardiovascular manifestations like myocardial injury (MI), sudden cardiac arrest, heart failure, and coagulation abnormality. Additionally, S. Shi et al. (2020) has shown that SARS-CoV can infect pulmonary and myocardial cells through the ACE2 pathway, thereby causing lung edema, ARDS, and myocardial injury.
 Fig. 2.
The four pathways (I, II, III-A, and III-B) showing how COVID-19 causes cardiac injury (Courtesy AtheroPoint™, Roseville, CA, USA).
Pathway (II)Dysregulation of the RAAS after SARS-CoV-2 (shown in Fig. 2): This pathway gets initiated due to intracellular host cell entry of SARS-CoV-2. Resulting in the loss of ACE2, which in turn leads to (a) a decrease in levels of cardioprotective Ang (1-7) (shown in a panel of green color) and (b) an increase in levels of Ang II (shown in a panel of pink color). Hence, the increase of Ang II promotes endothelial dysfunction and inflammations, accelerating the process of atherosclerosis (Dong et al., 2008; Lovren et al., 2008; Sahara et al., 2014; Tikoo et al., 2015; Yousif et al., 2012; Zhang et al., 2010). SARS-CoV-2 entry causes the downregulation of ACE2 levels and the activation of RAAS (Oudit et al., 2009). Generally, in RAAS, Ang-I is converted to Ang-II by ACE1. Ang-II is associated with several processes and is thought to promote vasoconstriction, proinflammation, profibrotic, prothrombosis, and proliferation of cells that are harmful to the human body. Hence Ang (1-7) is generated from degradation of Ang II by ACE2 as a counter-regulatory mechanism (Zhang and Baker, 2018), causing the opposite effects of Ang II. Ang (1-7), therefore, results in vasodilatation, antiapoptotic, antifibrotic, antithrombotic, and antiproliferative effects that are cardioprotective. During SARS-CoV-2 infection, reduction in ACE2 results in the (a) down-regulation of processes associated with Ang (1-7) and (b) activation of all the processes related to Ang II, has a detrimental effect on the blood vessels, thereby leading to endothelial cell damage, which leads to atherosclerotic cardiovascular events.
Pathway (III-A) Systemic inflammatory response (shown in Fig. 2): An increase in Ang II promotes inflammatory cytokines that exaggerate an inflammatory response causing a cytokine storm. It represents an advanced stage of severe illness characterized by multiple organ failure (Siddiqi and Mehra, 2020). The rise in these inflammatory cytokines includes interleukin (IL)-6, IL-7, IL-22, CXCL-10, which results in a decrease in plaque stability that favors the plaque rupture causes micro thrombosis and cardiac injury (Y. Huang et al., 2020; Schoenhagen et al., 2002; Xiong et al., 2020). As supporting evidence by Ruan et al. (2020) presented a study with 150 COVID-19 patients from Wuhan that higher levels of inflammatory cytokines patients have high mortality. Additionally, Guo et al. (2020) have shown that COVID-19 patients had elevated inflammatory cytokines and troponin (TnT) suggestive of cardiac injury and an increase in mortality.
Pathway (III-B)Myocarditis and SARS-CoV-2 (shown in Fig. 2): Myocarditis is an inflammatory response of cardiac myocytes which may be results due to SARS-CoV-2 infection (Siripanthong et al., 2020), The association between myocarditis and coronavirus is well-known from the times of Middle East respiratory syndrome coronavirus (MERS-CoV) infection, but still the evident link between SARS-CoV-2 and myocarditis is not yet well established. We hypothesized that viral infection can reaches heart via intravascular circulation and activates immune response, aimed to clearing the virus. These causes in increasing of cytokines and immune cell infiltration in the myocardium (Blauwet and Cooper, 2010). As a consequence these results in direct virus related cardiac injury (virus directly infects and damages cadiac cells) due to autoimmunity (through the mechanisim of molecular mimicry the activated immune system also attacks the cardiac cells). Further it was noticed that the patients with history of myocarditis does not subsides but persist long time which can lead to dilated cardiomyopathy (Blauwet and Cooper, 2010) and increases the risk of mortality (Alhogbani, 2016; Hinojar et al., 2016).
Acute cardiac injury is a commonly observed phenomenon among COVID-19 patients. In such patients, viral involvement of cardiomyocytes and systemic inflammation are common mechanisms for cardiac injury Bansal (2020). The understanding of interrelationship of COVID-19 and CVD is important for optimal management of such patients Bansal (2020). Recently, both Lin et al. (2012) and Gasso et al. (2020) in their independents work, showed a case study where the patient with multivessel spontaneous coronary artery dissection (SCAD) having SARS-CoV-2 led to myocardial infarction. Tan et al. (Tan and Aboulhosn, 2020) concluded that COVID-19 causes severe injury to the pulmonary and cardiovascular system, even leading to death. The authors shared that patients having congenital heart disease (CHD) are suspect to COVID-19, leading to comorbidities. Lippi et al. (2020) showed that the 14 days quarantine period requires physical activities for the prevention of metabolic and cardiovascular loss; otherwise, it will lead to impairing aerobic capability and increasing hypertension. The authors categorized this period as a preventive cardiological framework. South et al. (2020) was the first one to question the potential consequence of the renin-angiotensin-aldosterone system (RAAS) blockade to COVID-19 patients having respiratory disease, thereby posing a question about the blockage of ACE2 and its viability to attenuate the COVID-19. Further, this study suggested the role of monitoring COVID-19 patients over time based on the COVID-19 severity. Fang et al. (2020) investigated the role of diabetes mellitus and hypertension in the augmented risk of COVID-19. The authors reported that ACE2 receptors are found in epithelial cells of the lung, blood vessels, kidney, and intestine. Furthermore, the authors also indicated that the upregulation of ACE2 receptors is seen in patients with hypertension and type 1 or type 2 diabetes mellitus which were treated with ACE inhibitors and angiotensin II type I receptor blockers (ARBs) (Wan et al., 2020). Since atherosclerosis accelerates in diabetes patients (Banchhor, 2017b; Kotsis et al., 2018; Puvvula et al., 2020; Viswanathan et al., 2020d), it is, therefore, vital to monitor these blood vessels of patients who got infected by COVID-19. Due to the ACE2 polymorphism, it is even essential to monitor the organ systems of COVID-19 patients. Cai (2020) showed that the smokers have ACE2 gene expression higher than the non-smokers. Since the CVD is highly related to smoking (Hejjaji et al., 2020) and smoking also severely affects the current atherosclerotic disease and increases the 10-year CVD risk (Kelishadi et al., 2004), patients who have predisposed diseases with smoking conditions are highly vulnerable to COVID-19. This requirement needs special monitoring of the blood vessels in these patients.
AI has played a vital role in disease classification and risk stratification. Two categories of AI technologies, i.e., ML and DL have long been active in CVD risk management (Díaz, 2020). The ML (Bishop, 2006; Díaz, 2020) refers to the broad class of probabilistic, distance, and rule-based models used in the characterization of diseases and risk stratification, whereas, the DL (Krizhevsky et al., 2012; LeCun et al., 2015) refers to multiple layers of brain-mimicking neural networks employed for the same. ML-based solutions have been adapted for risk stratification in different applications such as stroke (Acharya et al., 2013b; Cuadrado-Godia et al., 2018a; Jamthikar et al., 2020a, b; Martis et al., 2013). Recently, Dong et al. (2020) reviewed several image-based characteristics and the AI-based models for accurate diagnosis and better treatment and management of COVID-19 patients. The authors reviewed the imaging characteristics from computed tomography (CT), positron emission tomography (PET), chest ultrasound, and MRI. The AI-based models were used for image analysis of COVID-19 patients and reported a median AUC of 0.89 (0.78 to 0.98) and a median accuracy of 95% (88% to 95%). Jamthikar et al. (2020a, 2019, b, d) recently showed the role of ML for CVD/stroke risk assessment by combining image-based phenotypes and standard risk factors in a big data framework. The same team developed recently methods using ML-based risk stratification for binary class (Jamthikar et al., 2020e) or multiclass frameworks (Jamthikar et al., 2020f), demonstrating superior ML-based systems (XGBoost, RF, and SVM) compared to conventional models such as Systematic Coronary Risk Evaluation score (SCORE), Framingham risk score (FRS), and Atherosclerotic CVD (ASCVD).
In a special report, the authors discussed the need of a system of preventive cardiovascular framework for coronary artery disease (CAD) management in the AI and big data framework (Jamthikar et al., 2020b). Similarly, an AI-based algorithm has also been used for CVD risk assessment in several other areas (Boi et al., 2018; Jamthikar et al., 2020g; Khanna et al., 2019a). The beauty of AI methods is that the memory parameters of ML model can be trained and such trained models can be used for prediction of disease severity in patients who are asymptomatic. Within a short period, several ML-based techniques used the power of AI in COVID-19 management (Alimadadi et al., 2020; Vaishya et al., 2020). More about the role of AI in imaging/non-imaging framework will be covered in the next section.
AI has dominated both in imaging and non-imaging fields of medicine with over 10,000 publications in the last few years. Since DL was predominantly image-based, to begin with (Krizhevsky et al., 2012; LeCun et al., 2015), it has now vigorously penetrated the imaging field (Acharya et al., 2008, 2013b; El-Baz and Suri, 2011; Liu et al., 2005; Sanches et al., 2012). On the contrary, ML has been active before DL in imaging and non-imaging paradigms. Few recent reviews have been published in the area of AI applications in cardiology (Jiang et al., 2017; Xu et al., 2020) and radiology (Biswas et al., 2019; Saba et al., 2019). We have presented and summarized a few key landmark studies.
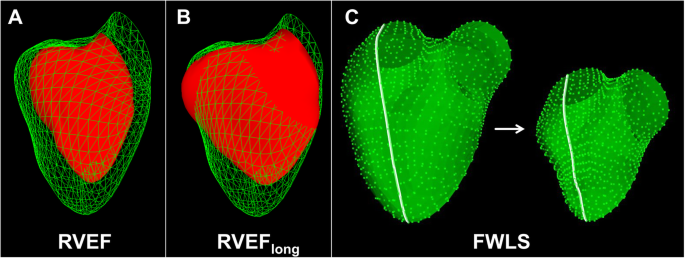
Medical images of internal organs are generally captured using CT, MRI and ultrasound modalities. DL and ML strategies have been applied to these modalities to segment the organs of interest (Suri, 2000; Suri et al., 2002). Recently a review was presented on the role of AI for data retrieval, segmentation of medical organs, and diagnosis for COVID-19 (Boi et al., 2018; F. Shi et al., 2020a). AI has also penetrated the field of cardiology for the segmentation of the heart (Avendi et al., 2016; Genovese et al., 2019) or tracking the heart over time (Carneiro and Nascimento, 2013). A shape model estimation of the entire heart using AI (Wang and Smedby, 2018) has been done. One such 3D model of heart that can be developed is shown in (Fig. 3). A recent book by El-Baz and Suri talks about several techniques on AI applications to cardiovascular imaging (El-Baz, 2018). This is a powerful solution to understand the severity of heart injury during and after pandemics.
Characterization of the diseased tissue against normal or risk stratification of the disease severity is well embraced by AI-based models, for example, ML-based strategies were adapted for benign vs. malignant prostate cancer (McClure et al., 2014; Pareek et al., 2013), ovarian cancer (Acharya et al., 2015, 2013c), liver cancer (Biswas et al., 2018; Kuppili et al., 2017), brain cancer (Tandel et al., 2020), plaque tissue for risk stratification, coronary artery risk stratification (Acharya et al., 2013a; Khanna et al., 2019a; Saba et al., 2017; Skandha et al., 2020) are some to say.
Also, closely knitted areas to CVD are genetics and microscopy. Genetics can be used to tackle the COVID-19 pandemic by tracking its origin (Cui et al., 2019; Jiang et al., 2020; Li et al., 2020a; Phan, 2020; J. Zhang et al., 2020a), finding reasons for the outbreak (Zhao and Yuan, 2020), and developing new vaccines (Álvarez-Machancoses et al., 2020; Hampel et al., 2020; Li et al., 2020c; Peng et al., 2020; Yan et al., 2020b; Yassine and Shah, 2020). Similarly, microscopy imaging is a very important part of AI-based COVID research for live-cell visualization to understand the behavior of SARS-CoV-2 (Lugagne et al., 2020; van Valen et al., 2016).
Patients with cancer, especially lung cancer, show an elevated risk of COVID-19 infection (L. Zhang et al., 2020b). Such patients need vigorous screening to first detect cancer using the imaging modality and segment such tumors. AI plays a vital role in tumor segmentation (Alakwaa et al., 2017; Jiang et al., 2018; Kamnitsas et al., 2017; Pereira et al., 2016; Prastawa et al., 2004; Skourt et al., 2018) and the classification of cancers (Tandel et al., 2019; Zlochower et al., 2020). Accurate detection of cancers can help in deciding the treatment plans and can further be useful in the management of COVID-19 infection.
There are strong evidences suggesting microbial infection due to COVID-19 leads
to myocarditis resulting in cardiac injury and inflammation (Cau et al., 2020; Siripanthong et al., 2020; Tavazzi et al., 2020; Woudstra et al., 2018).
The abnormalities of heart shape can be easily visualized through different
imaging modalities (Biswas et al., 2019; Suri, 2000).
Nicol et al. (2020) showed the role of cardiac MRI with T2-weighted
mapping sequences in identification of focal lateral subepicardial late
gadolinium enhancement and myocardial inflammation. Another study by Zhao et al.
(Zhao and Yuan, 2020) also showed the role of CMRI for computing the left
ventricle (LV) function using 4-D imaging on myocarditis patients. In relation to
myocarditis imaging in the COVID-19 era, there are many cases of AI-usage. A case
controlled research was performed on 21 patients for early gadolinium enhancement
(EGE) study. The patients were divided into positive and negative EGE groups to
study LV parameters which were accurately detected through the AI (Yuan et al., 2019). Four examples of MR images studied for a patient admitted to Cagliari
Hospital are shown in (Fig. 4). Attia et al. (2020) showed the role of AI-based ECG where the authors computed the
probability of ejection fraction (EF)
 Fig. 4.
A patient (27 years old) was admitted to Cagliari University Hospital, Italy with fever and chest pain, without any significant past medical history. The onset of symptomatology dated back about one week. His initial investigation showed elevated troponin levels at laboratory tests. Electrocardiography displayed ST-segment elevation. Echocardiography was normal. A cardiac magnetic performance was performed. T2 STIR (panel a) showed an increased signal in mid-basal inferior and inferior-lateral segments.T2 mapping values (panel b) showed an increased signal in mid-basal inferolateral segment The analysis of T1 mapping (panel c) showed an increase in signal at the same segments. In the sequences acquired later after contrast, an area of sub-epicardial LGE in mid-basal inferior and infero-lateral segments was observed with a concomitant involvement of the adjacent pericardium (panel d) (Courtesy of Luca Saba, AOU, Italy).
The extent of myocarditis damage to the heart can also be measured through
echocardiographic quantification of the left ventricular ejection fraction in
automated way through AI. There are several AI models for detecting these
abnormalities automatically (Biswas et al., 2019). This is possible through
automated border delineation of endocardial boundaries and then computation of
the end-systolic and diastolic volumes. In this regard, DL has been used in
several studies with varying degree of success. Hubel and Wiesel (1962) performed LV segmentation using DL with performance parameters
Jaccard distance (JD) at 0.83, average error (AV) at 0.91, mean absolute distance
(MAD) at 0.95 and average perpendicular error (AVP) at 0.83. An ML-based method
for estimation of LV ejection fraction was developed with sensitivity and
specificity at 0.90 and 0.92, respectively for detection of EF (Asch et al., 2019). Further, any variation of normal behavior can also be detected using the
AI modules. With regards to this, in one study (Ghorbani et al., 2020) a
DL network was able to accurately identified the pacemaker, enlarged left atrium,
left ventricular hypertrophy with an of AUC of 0.89, 0.86 and 0.75, respectively.
The performance of detection of left ventricular end systolic and diastolic
volumes (R
Since the risk of CVD is best predicted by taking the atherosclerotic burden via an imaging modality, it is preferred to use non-invasive scanning and risk assessments. This can be applied to all categories of patients, such as asymptomatic, mildly symptomatic, or severely symptomatic for COVID-19. Since the genetic makeup of the carotid artery is the same as the coronary artery (Sugiyama et al., 2001), one can choose surrogate biomarkers for risk assessment. It has been well established that one can also measure the 10-year CVD by fusing the laboratory-based blood biomarkers (LBBM) with image-based phenotypes. Thus, a five or 10-year CVD risk can also be determined while the patient with cardiac injury has a laboratory test and noninvasive carotid ultrasound scans (Johri et al., 2013; Khanna et al., 2019b; Saba et al., 2012b).
We have to look for ways and means for CVD risk assessment, which is safe, reliable, and cost-effective for patients during the COVID-19 pandemic. AtheroEdge™ is an automated software tool (Molinari et al., 2014, 2011, 2010), which can be used for monitoring the plaque build-up in carotid and coronary arteries, which can be affected due to coronavirus. AtheroPoint™ has developed a commercial-grade, completely patented, and 510(K) FDA approved software package called-AtheroEdge™ 1.0 (Cuadrado-Godia et al., 2019, 2018b; Khanna et al., 2019c; Molinari et al., 2014, 2011, 2010; Saba et al., 2012a, c) that can jointly estimate the carotid plaque and wall thickness in carotid ultrasound (CUS) scans. AtheroEdge™ 1.0 automatically computes the five imaging biomarkers, called carotid ultrasound image phenotypes (CUSIP) (Khanna et al., 2019d, b; Molinari et al., 2014). These measurements are used to compute the composite baseline risk of patients called AtheroEdge Composite Risk Score 1.0 (AECRS1.0) (Khanna et al., 2019d, b; Viswanathan et al., 2020b). The AtheroEdge™ 1.0 is a well-validated package against the gold standards such as manual measurements and cross imaging modalities such as MRI and CT (Molinari et al., 2014, 2011; Saba et al., 2018a, b, 2016, 2012c). AtheroEdge™ 1.0 showed a precision of 98.7% (Krishna Kumar et al., 2017; Saba et al., 2018a). Currently, AtheroEdge™ 1.0 is being used at multiple diagnostic centers around the world for the collection of patient data and more sophisticated CVD/stroke preventive screening development (Liu et al., 2005; Molinari et al., 2014). An epidemiological study of 885 patients in collaboration with the London School of Hygiene and Tropical Medicine (LSHTE), London, UK, was conducted by AtheroPoint™ LLC to validate the performance of AtheroEdge™ 1.0 software (Ikeda et al., 2013; Molinari et al., 2014). This study showed a 94.7% agreement between the automated and manual measurements, even in the presence of low-contrast/low-resolution carotid ultrasound scans (shown in Fig. 5). Furthermore, AtheroEdge™ 1.0 also showed higher accuracy and reproducibility on the low-resolution images (Ikeda et al., 2013).
 Fig. 5.
(a) Carotid artery used as a surrogate of coronary artery disease. (b) Carotid artery scanning (Courtesy of AtheroPoint™, CA, USA).
AtheroPoint™ showed a strong association between the CUSIP measured using AtheroEdge™ 1.0 and (a) SYNTAX score and (b) Ankle Brachial Index (ABI) (Ikeda et al., 2014, 2013), which are the relevant biomarkers of CVD. Very recently, AtheroEdge™ 1.0 was used to detect the total plaque area (TPA) morphology and geometrical TPA, which are the essential phenotypes of CVD/stroke events (Khanna et al., 2019c; Lucatelli et al., 2016). All these studies projected the use of AECRS1.0 for CUSIP measurements from the common carotid artery. Another study was conducted to show the relationship between the degree of leukoaraiosis (LA), measured as a hemispheric LA volume, in brain MRI and CUSIP measured using AtheroEdge™ 1.0 (Lucatelli et al., 2016).
The AtheroEdge™ 1.0 software package computed the automated CUSIP from the given CUS scans. Multiple studies have reported the effect of conventional cardiovascular risk factors (CCVRF) on the annual progression of cIMT and plaque area (PA) (Banchhor et al., 2017a; Johri et al., 2013; Osondu et al., 2018; Rosvall et al., 2015; Viswanathan et al., 2020a, d). Based on this concept, AtheroPoint™ LLC, USA, had developed an integrated (office-based biomarkers + laboratory-based biomarkers + carotid ultrasound image-based phenotypes) 10-year image-based CVD/stroke risk statistical calculator called AtheroEdge™ 2.0, that computes the AtheroEdge Composite Risk Score 2.0 (AECRS2.0) (Biswas et al., 2020; Johri et al., 2013; Khanna et al., 2019d, b; Saba and Suri, 2013; Suri et al., 2010; Viswanathan et al., 2020b, c) (shown in Fig. 6) for 10-year risk, while AECRS1.0 was for the current risk (without CCVRF). This AECRS2.0 (Johri et al., 2013; Khanna et al., 2019d, b; Suri et al., 2019) has been shown to be stronger than conventional cardiovascular risk calculators (CCVRC) (Conroy, 2003; Goff et al., 2014; Hippisley-Cox et al., 2017; Kothari et al., 2002; D’Agostino et al., 2008; Ridker et al., 2007; Stevens et al., 2001) because AtheroEdge™ 2.0 produced a larger area-under-the-curve (AUC) in comparison to all of the CCRVC. This is due to the integration of laboratory-based biomarkers and office-based biomarkers with current CUSIP. AtheroPoint™ recently showed that AtheroEdge™ 2.0 could do a better 10-year CVD/stroke risk estimation when the carotid bulb segment is considered compared to the common carotid artery (Saba et al., 2019). The cumulative ranking of the ten CCVRC demonstrated that QRISK3 was the closest calculator to AtheroEdge™ 2.0. Additionally, in a study by ranking cardiovascular risk factors, the AECRS 2.0 values ranked at the topmost positions with higher odds ratios compared to the CCVRF (Saba et al., 2019). Since the epithelial dysfunction, which leads to plaque rupture, can be due to SARS-CoV-2 (pathway III-B, Fig. 2), therefore, such calculators can be valuable to track the composite risk on patients who are infected by COVID-19. Note that, although there is no concrete evidence of relationship between myocarditis and atherosclerosis, though the former may lead to CVDs, the risk calculators developed are limited to coronary/carotid imaging biomarkers only. In the future new risk calculator needs to be developed based on vasopasm, myocarditis as well as coronary/carotid imaging.
 Fig. 6.
AECRS system for composite risk score computation. Left: Renal biomarker “eGFR” has the largest contribution to the CVD risk on the left common carotid. Right: Due to plaque, atherosclerosis phenotypes show the highest contribution in the CVD risk on the right common carotid artery (Courtesy AtheroPoint™, Roseville, CA, USA).
In monitoring, several telemedicine-based approaches have been adapted in
support of COVID-19 consultations (Smith et al., 2020; Vidal-Alaball et al., 2020). Telemedicine has been beneficial to authorities in controlling the
epidemic situation in India during cholera (Smith et al., 2020), and visceral
leishmaniasis (Bhunia et al., 2012) epidemics. In advanced economies,
telemedicine, in combination with AI, has used data from social media (Thamman et al., 2020) for successful disease tracking, quantifying disease dynamics,
projecting the pandemic curve in high-risk cluster zones, and regulating it from
further spread (Bodnar, 2015). For example, the data stream during the Zika
epidemic (Daughton and Paul, 2019), Influenza A H1N1 pandemic (Signorini et al., 2011), and Chikungunya epidemic (Mahroum et al., 2018) showed a
correlation between the volume of the data streaming using telemedicine and
pandemic curve. A similar pattern was also noticed during the current COVID-19
pandemic in China (Li et al., 2020b). A linear regression model was developed
to estimate the correlation between a dataset of 115,299 Weibo posts (like
Facebook of China) extracted using keywords such as “coronavirus”,
“epidemic”, “Wuhan coronavirus”, etc. and the number of active cases in Wuhan
and Mainland China. This model showed ten coronavirus cases per 40 posts (R
 Fig. 7.
Linear regression analysis for the COVID-19 pandemic relating to the number of Weibo posts against the actual growth of pandemic (daily coronavirus cases) (Li et al., 2020b).
Therefore, the application of AI-based telemedicine can help in building an epidemic model to control pandemics in future smart cities (Wong et al., 2019). Mann et al. (2020) showed that between 2nd march to 14th April 2020 the telemedicine visits increased from 369.1 to 866.8 per day for urgent care and 94.7 daily to 4209.3 (4345% increase) in non-urgent care. Gadzinski et al. (2020) showed the role of telemedicine for COVID-19. The US government has encouraged video visits from any originating location, including their homes, as part of telemedicine-based care (Newsroom, 2020). There is a standard CPT code (99213 in the USA) that can be used for reimbursements. In a world where social distancing is the norm, telemedicine combined with AI in the form of chatbots, wearable devices, etc. can act as a preventive measure for COVID-19 (Wang and Bhatt, 2020).
Fig. 8 shows the AI/TM application for tracking patients. There are two major components for COVID19 screening: (i) primary and (ii) secondary. Primary screening: Primary screening is conducted with the help of the robot and AI/TM by questioning basic symptoms while keeping social distance rules. This is already in place in several hospitals around the world. If the COVID-19 symptoms are positive, the patient needs to be quarantined (Q1) or sent home if the patient is uninfected (G1).
 Fig. 8.
Role of user-interactive AI, telemedicine, and smart cities on the pandemic (Courtesy of AtheroPoint™, CA, USA).
The quarantined patient is monitored (M1) continuously using AI/TM system and evaluating the CVD risk (shown in RED color). If the COVID-19 tests (T2) are again positive, the patient must be isolated (I) in ICU, and the patient’s deteriorating condition must be monitored (M2) using AI/TM system. At this point, the patient would need ventilation and, if worsened, showing the loss of life/death. Secondary screening: If it turns out to be negative, over time, the patient should undergo “secondary screening” using the AI/TM system. COVID-19 test is conducted (T3), and if it turns out to be positive, the feedback loop triggers again (shown as RED dotted line). The secondary infection can be also triggered if the patient is admitted to the hospital (Pacis et al., 2018).
COVID-19 outbreak has led to a flurry of research and development activities in AI-based computer-assistance tools (Suri et al., 2020). The maximum of the research has been directed towards tracking and prediction, diagnosis and prognosis, treatment, and social control. In tracking and prediction, AI models such as the epidemiological SIR model were used to develop containment strategies to reduce the spread rate (Maier and Brockmann, 2020; Song et al., 2020). AI research has led to the development of cheaper and scalable computer aided-tools for diagnosis in the area of medical imaging. A majority of this research has been performed in the area of characterization of COVID-19 infected lung scans (Butt et al., 2020; Harmon et al., 2020; Ilyas et al., 2020; Inciardi et al., 2020a; Jamshidi et al., 2020; Ozsahin et al., 2020; F. Shi et al., 2020a) and mortality risk of patients (Jiang et al., 2020; Yan et al., 2020a). AI has also the potential of new drug discovery for COVID-19 as shown by recent works (Beck et al., 2020; Stebbing et al., 2020). Applications have been shown to control crowds and implementing social distancing by collecting heat signatures through infrared cameras in public places (Chun, 2020), and information update about medical conditions (Hense et al., 2020).
The following are the recommendations of this universal voice on the role of artificial intelligence in cardiovascular risk assessment during COVID times and beyond.
Patients with a specific disease (say diabetes, hypertension, cancer, ARDS, and neurological disorder) must be tracked to obtain biomarkers of a specific disease for training AI platforms specific to the “type of disease”. The management of different diseases comes from different medical departments. Therefore, the risk stratification for different disease points can be based on different AI-platforms. For patients who are having multiple diseases, we will need classification methods that can handle multiple diseases, and such AI-platform will be a fused AI-platform that can accept patients having multiple diseases. This is since AI (especially deep learning) will be able to handle the nonlinear variations dynamically. All the above requires validation using multimodality imaging utilizing registration models (Guo et al., 2006; Narayanan et al., 2009; Suri et al., 2005).
A large cohort needs to be built for these patient databases specific to the disease. This can be a global endeavor for future tracking, diagnosis, and prognosis of the pandemic. Although DL requires a large cohort for training, in some cases, where enough training data may not be available for classifying specific diseases (Gajardo et al., 2020), AI programmers use techniques such as data augmentation (DA) (Mikolajczyk and Grochowski, 2018; Shorten and Khoshgoftaar, 2019) and transfer learning (TL) (Huynh et al., 2016; Tan et al., 2018). In DA, the main aim is at building artificial data by transforming existing data samples to help the model train from large intraclass variances. In TL, the knowledge in the form of trained AI model parameters on relatable diseases is used to characterize the specific ones.
The advent of big data for medical health records and patient information has given a promising expectation for a faster and accurate diagnosis and treatment (Dilsizian and Siegel, 2014; Gruson et al., 2020; Kagiyama et al., 2019; Krittanawong et al., 2020). AI-models are therefore required to “mine” exact information from this data volume to assist clinicians in performing real time diagnostic and therapeutic recommendations. Hence it is not uncommon that AI-based studies performing diagnostic and even therapeutic services for cardiovascular diseases. In a recent work, an AI-based study segmented the plaque volume from the carotid artery ultrasound scans and estimated the CVD risk by measuring the cIMT (Biswas et al., 2018). In another work by the same group, the AI model was used to compute the stenosis and estimate the CVD risk in the same cohort (Saba et al., 2019b). Another example of personalized approach to heart care is shown in Fig. 9(Badano, 2020). The AI-based approaches can help in four-out-of-five stages i.e, segmentation, post-processing, interpretation and risk estimation and prognosis with each stage using a separate model. Overall, it is projected that AI-based diagnosis and treatment will lead to effective precision care and better monitoring outcomes.
 Fig. 9.
(a) Echocardiographic scan taken, (b) AI-based LV segmentation, (c) post-processing, (d) clinical interpretation, and (e) risk estimation and prognosis (Courtesy of (Badano, 2020)).
There is a clear need to build universal biobanks that can be shared with genuine institutions involved in AI platform developments. There needs to be a trail of documents involved in obtaining such biobanks for research and commercial developments for the benefit of humanity. Blockchain models can be adapted to improve data sharing.
Advanced telemedicine applications with “embed A” would be more beneficial for patient monitoring.
The input data can be fed in AI-based solutions for better clinical oriented results via remote access.
With advanced AI developments and Blockchain technologies, cities can opt for joining the model for smart city developments using to avoid the worsening of catastrophes. A representative diagram of pandemic risk management using AI, telemedicine, and smart cities is shown in Fig. 7.
This perspective presented the role of AI in medicine and specifically throwing light on the area of diagnosis and monitoring strategies for heart injury due to COVID-19. Imaging and non-imaging biomarkers can be used for machine learning and deep learning models. Non-invasive cardiovascular surrogate markers may be useful for early diagnosis of acute cardiovascular and thromboembolic complications, as well as for monitoring and management of heart disease in such patients during COVID-19 times or beyond, such as five or ten-year risk assessment systems which will be increasingly important for the growing number of COVID-19 survivors. The study also presents recommendations for efficiently utilizing the AI models during the current and future pandemics.
(I) Conception and design: Jasjit S. Suri, Anudeep Puvvala, Misha Majhail, Mainak Biswas, Ankush Jamthikar, (II) Administrative support: Jasjit S. Suri,Luca Saba, Inder M Singh, Ronald Oberleitner, (III) Manuscript writing: Jasjit S. Suri, Anudeep Puvvala, Misha Majhail, Mainak Biswas, Ankush Jamthikar, Amer M. Johri, Saurabh Srivastava, George D Kitas, (IV) Proofreading: All authors, (V) Final approval of manuscript: All authors.
We would like to express my gratitude to all those who helped me during the writing of this manuscript.
Dr. Jasjit Suri is affiliated to AtheroPoint™, focused in the area of stroke and cardiovascular imaging.
Dr. Vijay Nambi discloses the following relationships - (i) site PI study sponsored by Merck (complete), Amgen (to start); (ii) provisional patent along with Roche and Baylor College of Medicine for the use of biomarkers in prediction of heart failure; (iii) Dr. Nambi is supported by VA MERIT grant.
Dr. Deepak L. Bhatt discloses the following relationships - Advisory Board: Cardax, CellProthera, Cereno Scientific, Elsevier Practice Update Cardiology, Level Ex, Medscape Cardiology, MyoKardia, PhaseBio, PLx Pharma, Regado Biosciences; Board of Directors: Boston VA Research Institute, Society of Cardiovascular Patient Care, TobeSoft; Chair: American Heart Association Quality Oversight Committee; Data Monitoring Committees: Baim Institute for Clinical Research (formerly Harvard Clinical Research Institute, for the PORTICO trial, funded by St. Jude Medical, now Abbott), Cleveland Clinic (including for the ExCEED trial, funded by Edwards), Contego Medical (Chair, PERFORMANCE 2), Duke Clinical Research Institute, Mayo Clinic, Mount Sinai School of Medicine (for the ENVISAGE trial, funded by Daiichi Sankyo), Population Health Research Institute; Honoraria: American College of Cardiology (Senior Associate Editor, Clinical Trials and News, ACC.org; Vice-Chair, ACC Accreditation Committee), Baim Institute for Clinical Research (formerly Harvard Clinical Research Institute; RE-DUAL PCI clinical trial steering committee funded by Boehringer Ingelheim; AEGIS-II executive committee funded by CSL Behring), Belvoir Publications (Editor in Chief, Harvard Heart Letter), Canadian Medical and Surgical Knowledge Translation Research Group (clinical trial steering committees), Duke Clinical Research Institute (clinical trial steering committees, including for the PRONOUNCE trial, funded by Ferring Pharmaceuticals), HMP Global (Editor in Chief, Journal of Invasive Cardiology), Journal of the American College of Cardiology (Guest Editor; Associate Editor), K2P (Co-Chair, interdisciplinary curriculum), Level Ex, Medtelligence/ReachMD (CME steering committees), MJH Life Sciences, Population Health Research Institute (for the COMPASS operations committee, publications committee, steering committee, and USA national co-leader, funded by Bayer), Slack Publications (Chief Medical Editor, Cardiology Today’s Intervention), Society of Cardiovascular Patient Care (Secretary/Treasurer), WebMD (CME steering committees); Other: Clinical Cardiology (Deputy Editor), NCDR-ACTION Registry Steering Committee (Chair), VA CART Research and Publications Committee (Chair); Research Funding: Abbott, Afimmune, Amarin, Amgen, AstraZeneca, Bayer, Boehringer Ingelheim, Bristol-Myers Squibb, Cardax, Chiesi, CSL Behring, Eisai, Ethicon, Ferring Pharmaceuticals, Forest Laboratories, Fractyl, Idorsia, Ironwood, Ischemix, Lexicon, Lilly, Medtronic, MyoKardia, Pfizer, PhaseBio, PLx Pharma, Regeneron, Roche, Sanofi, Synaptic, The Medicines Company; Royalties: Elsevier (Editor, Cardiovascular Intervention: A Companion to Braunwald’s Heart Disease); Site Co-Investigator: Biotronik, Boston Scientific, CSI, St. Jude Medical (now Abbott), Svelte; Trustee: American College of Cardiology; Unfunded Research: FlowCo, Merck, Novo Nordisk, Takeda.