
Academic Editor: Peter A. McCullough
Intradialytic hypotension (IDH) is a sudden and often serious complication of
chronic hemodialysis (HD). In this prospective study, we aimed at evaluating the
clinical predictors of IDH in a homogeneous cohort of chronic HD patients, with a
particular focus on marinobufagenin (MBG), an endogenous cardiotonic steroid
which alterations have previously been involved in various cardiovascular
disorders. MBG levels in HD patients were significantly higher than in controls
(p = 0.03), remained unchanged throughout a single HD session and were
not correlated with the absolute or partial fluid loss achieved. During a 30-day
follow-up, 19 patients (65.5%) experienced at least one IDH (73 total episodes).
An inverse correlation was found between baseline MBG and the number of IDH (R =
–0.55; p = 0.001). HD patients experiencing IDH presented remarkably
lower baseline MBG as compared to others (p = 0.008) with a
statistically significant trend during HD (p = 0.02). At Kaplan-Meier
analyses, HD patients with lower MBG manifested a four-to-six fold increased risk
of IDH during follow-up (crude Hazard Ratio ranging from 4.37 to 6.68). At Cox
regression analyses, MBG measurement at different time points resulted the
strongest time-dependent predictors of IDH among all the variables considered (HR
ranging from 0.068 to 0.155; p: 0.002 to
Severe symptomatic intradialytic hypotension (IDH) complicates approximately 20 to 30% of hemodialysis (HD) sessions with a significant impact on the morbidity and mortality of chronic HD patients [1]. IDH is often the consequence of an impaired vascular refilling capacity, that is the ability to mobilize fluids from the interstitial into the intravascular space during HD, or when a large volume of water is removed in short time. In some individuals, IDH might also depend from an excessive absolute fluid removal due to an incorrect estimation of the target (dry) weight, which is usually set empirically by trial and error as the value below which intolerable symptoms, such as cramping, nausea, vomiting or hypotension, manifest [2]. Further mechanisms contributing to IDH include an impaired sympathetic nerve response to volume loss, an inadequate peripheral arterial vasoconstriction or undiagnosed arrhythmias [3]. As a result, predicting the risk of harmful hypotensive episodes in HD patients remains, in some cases, extremely challenging.
Marinobufagenin (MBG) is a cardiotonic steroid produced and released from adrenocortical glands in response to a wide spectrum of stimuli [4]. MBG inhibits Na/K-ATPase activity and plays an active role in regulating sodium and volume balance in conditions of high-salt loading or plasma volume expansion [5]. In addition, MBG displays remarkable vasoconstrictive effects, by directly acting at the vascular level and by amplifying the effect of sympathetic nervous system activity on vascular tone [6].
Predictably, deranged MBG levels have been found in a large spectrum of cardiovascular diseases, such as myocardial infarction, decompensated heart failure and arterial hypertension [7], particularly if salt-sensitive [8]. In pregnant women, early alterations in MBG levels may predict the onset of gestational hypertension or even overt pre-eclampsia, indicating that this steroid may have an active role in the angiogenic imbalance which characterizes such conditions but also a strong prognostic capacity [9, 10]. Patients with progressive chronic kidney disease (CKD) also show deranged MBG levels [11], particularly those on chronic HD treatment [12, 13, 14]. In these latter individuals, MBG levels were also found to be predictive of cardiovascular mortality [14].
Nevertheless, despite MBG is an acknowledged modulator of water balance and peripheral vascular reactivity, no studies have so far placed this hormone in the context of the altered hemodynamic responses that may trigger IDH.
With this background in mind, we have therefore conducted a pilot, prospective study in chronic HD patients to evaluate clinical predictors of IDH and the potential diagnostic and prognostic role of MBG with respect to this dangerous complication.
We designed an observational, prospective, proof-of-concept study. Anthropometric, clinical, laboratory and instrumental measurements, together with MBG evaluation, were performed at baseline before starting a mid-week HD session. MBG was then measured at established time-points during this session, in relationship with the absolute and hourly weight loss achieved. Patients then entered a prospective phase in which IDH episodes were systematically recorded during the following fourteen HD sessions (30-day follow-up).
All patients undergoing chronic HD treatment at the Dialysis Unit of the
University Hospital of Catanzaro, Italy were screened for eligibility. Inclusion
criteria were a regular HD treatment with a rhythm of 3.30 to 4 h sessions/thrice
a week, a stable dry-weight and an unchanged therapeutic scheme for at least 3
months before enrolment. Exclusion criteria were dialysis vintage
The dialyzer employed was a Flexya dialysis monitor (Bellco®,
Mirandola, Italy) with a standard bicarbonate buffer, standard sodium
concentration set at 140 meq/L and dialysate temperature maintained at 36.5
Common biochemical data were measured following the standard methods used in the routine clinical laboratory. Adequacy of dialysis was assessed using Kt/V, calculated as the natural logarithm of the ratio between initial and final urea concentration.
Human MBG was measured in the blood using an enzyme linked immunosorbent assay (ELISA) commercially available kit (BlueGene Biotech, Shanghai, China), according to the manufacturer’s instructions. The enzymatic reactions were quantified in an automatic microplate photometer and centralized in the same laboratory (Clinical pathology lab, “Mater-Domini” University Hospital-Catanzaro, Catanzaro, Italy). MBG measurements were made immediately before starting the treatment, after the first hour, after the second hour and at immediately before patient’s disconnection from the circuit (dialysis end). All tests were made blind and in duplicate and levels were expressed as nmol/L. MBG was also measured in a small group of 10 healthy matched subjects.
Blood pressure (BP) was monitored using an automated sphygmomanometer integrated in the dialysis machine. Pre-dialysis blood pressure was measured in the non-access arm at the beginning of HD, after 10-minutes rest with the patient seated in the dialysis chair before placement of a dialysis needle. Further BP measurements were automatically performed every 10 minutes or upon patient’s request in case of symptoms suggestive of hypotension.
Volume status was clinically appraised by lung auscultation and evaluation of peripheral oedema [15]. Lung auscultation was performed anteriorly and posteriorly in each hemithorax in the seated position. To evaluate crackles, the following scale was used: (1) no crackles; (2) uncertainness about the presence of fine crackles; (3) definite fine crackles at lung bases; (4) moderate crackles; and (5) bilateral, diffuse crackles. For clinical oedema, the following scale was used: (1) no clinical edema; (2) slight pitting (2-mm depth) with no visible distortion; (3) somewhat deeper pit (4 mm) with no readily detectable distortion; (4) noticeably deep pit (6 mm) with the dependent extremity full and swollen; and (5) very deep pit (8 mm) with the dependent extremity grossly distorted.
In addition to clinical evaluation, volume status was also estimated instrumentally by bioimpedance analyses, by echocardiography and by ultrasound evaluation of lung US-B lines and inferior vena cava diameter.
A bioimpedance analysis was performed by employing a BCM - Body Composition Monitor (Fresenius Medical Care, St. Wendel, Germany). Measurements included assessment of Overhydration (OH), Lean tissue index (LTI), Fat tissue index (FTI), Total body water (TBW), Extracellular water (ECW), Intracellular water (ICW), Lean tissue mass (LTM), Fat mass (ATM) and Body Cell Mass (BCM) according to the manufacturer’s instruction.
US-B lines, also known as “ultrasound lung comets”, are echogenic artifacts originating from water-thickened interlobular septa and fanning out from the lung surface, indicating extravascular lung accumulation [16]. Pre-dialysis US-B lines assessment was made by a convex probe (LogiQ C5 premium, GE Medical Systems, Wuxi, China), scanning the patient in supine position from the second to the fourth (on the right side to the fifth) intercostal space at parasternal to midaxillary lines both sides of the chest, as described elsewhere [17]. US-B lines, defined as hyperechoic US bundle going from the transducer to the limit of the screen, were summed to produce an absolute number (score) reflecting the entity of lung water accumulation [17]. Inferior Vena Cava Diameter (IVCD) was measured using 2-dimensional echographic sector (GE Healthcare, Chicago, IL, USA) on M-mode at the confluence of suprahepatic veins approximately 3 cm from the right atrium in the supine position during normal expiration and inspiration [18].
A comprehensive echocardiographic examination was performed using a GE Vivid E95 (General Electric Healthcare, Chicago, Illinois, USA), with electrocardiographic monitoring during the exam. Left ventricular (LV) function was measured as LV ejection fraction (EF) and fractional shortening (FS). Moreover, LV diastolic and systolic diameters, volumes and LV mass were calculated, as recommended [19]. Right ventricular function was measured as the tricuspid annular plane systolic excursion (TAPSE). Dimension and collapsibility of the inferior vena cava has been used to estimate right atrial pressure [20].
Diastolic function was assessed through the mitral valve inflow evaluation using
pulsed wave doppler in apical four-chamber at the level of mitral leaflet tips.
Peak early filling (E wave), late diastolic filling (A) and their ratio (E/A)
were calculated. Moreover, early diastolic septal and lateral annular velocities
(e’) and E/e’ ratio were measured at the mitral plane level. Moreover, peak
velocity of tricuspid regurgitation (TR) by continuous-wave (CW) Doppler and Left
Atrial Volume Indexed (LAVi) were used to further classify patients with
borderline mitral inflow parameters, as recommended [21]. A cut-off value of 34
mL/m
After the baseline assessment, patients were prospectively followed up to 30 days and any IDH episode occurred during the following fourteen dialysis sessions was recorded.
IDH episodes were defined as a systolic blood pressure drop greater than 20 mmHg or a decrease in mean arterial pressure of 10 mm Hg during dialysis with symptoms such as dizziness, headache, confusion, nausea or sweating requiring nurse intervention [3].
Statistical analyses were performed using the SPSS package (version 24.0; IBM corporation, Chicago, IL, USA), the MedCalc Statistical Software (version 14.8.1; MedCalc Software bvba, Ostend, Belgium) and the GraphPad prism software (version 8.4.2, GraphPad Software, San Diego, CA, USA).
Data were presented as mean
The source population consisted of 40 chronic HD patients. After the eligibility screening 11 patients were excluded because refused to participate, showed an unstable dry weight over the last 3 months, had too short dialysis vintage or were not on a regular HD regimen.
The final study cohort included 29 prevalent HD patients. The majority of them
were male (72.4%) and 27.5% were diabetics. Mean age was 65.4
Echocardiography data indicated the presence of a mildly increased left ventricular (LV) mass with normal LV chamber dimensions. Systolic LV and right ventricular (RV) functions were preserved, while we observed a mild impairment in LV diastolic dysfunction, along with a mild increase in systolic pulmonary artery systolic pressure.
MBG levels in HD patients were significantly higher than those measured in
healthy controls (0.75
 Fig. 1.
MBG levels in healthy controls, in the whole cohort of
HD patients and in subgroups of HD patients with or without IDH episodes during
follow-up. * p = 0.03 vs. controls; ** p = 0.0008 vs.
hypotensive HD patients;
| All | No-Hypotension | Hypotension | p | |
| N = 29 | N = 10 | N = 19 | ||
| Age (years) | 65.4 |
65.8 |
65.1 |
0.77 |
| Gender (% Male) | 72.4 | 90 | 63.1 | 0.12 |
| Diabetes (%) | 27.5 | 30 | 26.3 | 0.58 |
| Dry weight (kg) | 69.1 |
70.9 |
68.2 |
0.70 |
| BMI (Kg/m) | 25.3 |
24.6 |
25.7 |
0.63 |
| Waist-Hip-ratio (cm) | 0.94 |
0.95 |
0.94 |
0.73 |
| Kt/V | 1.45 |
1.45 |
1.45 |
0.99 |
| ACEi use (%) | 17.2 | 20 | 15.8 | 0.77 |
| ARBs use (%) | 34.5 | 30 | 36.8 | 0.71 |
| CCBs use (%) | 62 | 60 | 63.1 | 0.86 |
| Beta-blockers use (%) | 62 | 70 | 57.9 | 0.52 |
| Dialysis vintage (months) | 31 [18–55] | 40 [29–48] | 31 [14–56.7] | 0.40 |
| Systolic blood pressure (mmHg) | 141.7 |
137.7 |
143.8 |
0.56 |
| Diastolic blood pressure (mmHg) | 72.4 |
72.4 |
72.5 |
0.98 |
| Serum phosphate (mg/dL) | 4.6 |
4.08 |
4.87 |
0.04 |
| Serum calcium (mg/dL) | 9.02 |
8.9 |
9 |
0.76 |
| Serum potassium (mg/dL) | 5.19 |
4.99 |
5.3 |
0.04 |
| Serum magnesium (mg/dL) | 2.14 |
2.06 |
2.18 |
0.64 |
| Serum sodium (mg/dL) | 138 |
137.7 |
138.3 |
0.58 |
| Parathormone (pg/mL) | 346.8 [184.6–492.4] | 366.5 [296–487.7] | 314 [166.8–495.3] | 0.68 |
| Albumin (g/dL) | 3.94 |
3.96 |
3.94 |
0.90 |
| LDL cholesterol (mg/dL) | 79 [54.5–110] | 61 [48–88] | 83 [66.2–117.2] | 0.04 |
| Total cholesterol (mg/dL) | 142.4 |
123.5 |
152.4 |
0.03 |
| Triglycerides (mg/dL) | 125 [82.5–177] | 115 [88–169] | 125 [81.2–179.5] | 0.99 |
| Creatinine (mg/dL) | 7.66 |
8.2 |
7.3 |
0.30 |
| Alkaline phosphatase (IU/L) | 88 [73.7–106.2] | 97.5 [75–112] | 85 [73.2–103.5] | 0.55 |
| Hematocrit (%) | 33.4 |
34 |
33.1 |
0.55 |
| Hemoglobin (g/dL) | 10.6 |
11 |
10.3 |
0.11 |
| Red blood cells (n |
3.70 |
3.55 |
3.78 |
0.62 |
| White blood cells (n |
6.61 |
6.7 |
6.6 |
0.88 |
| Platelets (n |
212 [135–294] | 199.5 [134–309] | 216 [155.5–285.5] | 0.78 |
| Uric acid (mg/dL) | 5.73 |
5.73 |
5.74 |
0.98 |
| C-reactive protein (mg/L) | 4.2 [3.23–8.75] | 3.71 [3.23–7.50] | 4.6 [3.23–9.17] | 0.81 |
| Ferritin (mg/dL) | 272.5 [122.5–392.5] | 283 [191–443] | 222 [121.2–301.5] | 0.43 |
| Serum iron (mg/dL) | 61.27 |
67.6 |
57.9 |
0.32 |
| Urea (mg/dL) | 132.8 |
127 |
135.9 |
0.51 |
| Fibrinogen (mg/dL) | 429 |
384 |
448.8 |
0.07 |
| ESR (mm/h) | 20 [6–32] | 5.95 [5–21] | 29 [18.2–39.2] | 0.01 |
| MBG pre-dialysis (nmol/L) | 0.75 |
0.94 |
0.65 |
0.008 |
| MBG 1 h (nmol/L) | 0.89 [0.59–0.98] | 0.92[0.89–0.98] | 0.72 [0.56–1.00] | 0.21 |
| MBG 2 h (nmol/L) | 0.71 |
0.95 |
0.57 |
0.001 |
| MBG HD-end (nmol/L) | 0.90 [0.35–0.96] | 0.96 [0.94–0.98] | 0.45 [0.24–0.95] | 0.002 |
| Legend: ACEi, ace-inhibitors; ARBs, Angiotensin-receptor
blockers; BMI, Body mass index; CCBs, calcium-channel blockers; LDL,
low-density lipoprotein cholesterol; ESR, erythrocyte sedimentation rate; MBG,
marinobufagenin; MBG 1 h, marinobufagenin measured 1 h after dialysis start; MBG
2 h, marinobufagenin measured 2 h after dialysis start; MBG HD-end,
marinobufagenin measured at the end of the dialysis session. Data are presented
as mean ( | ||||
| All | No-Hypotension | Hypotension | p | ||
| N = 29 | N = 10 | N = 19 | |||
| Bioimpedance | |||||
| OH (L) | 2.3 [0.7–3.7] | 3.95 [1.6–4.3] | 2 [0.52–2.7] | 0.04 | |
| LTI (kg/m |
15.5 ± 3.6 | 14.8 ± 2.5 | 15.9 ± 4.1 | 0.43 | |
| FTI (kg/m |
7.3 [5–13.9] | 7.35 [5.3–10.9] | 8.1 [4.9–15.2] | 0.81 | |
| TBW (L) | 38.8 ± 7.5 | 39.8 ± 7.9 | 38.2 ± 7.5 | 0.59 | |
| ECW (L) | 18.5 ± 3.5 | 19.5 ± 4.2 | 17.9 ± 3 | 0.25 | |
| ICW (L) | 20.3 ± 4.6 | 20.3 ± 4.6 | 20.3 ± 4.8 | 0.98 | |
| LTM (kg) | 43.5 ± 11.1 | 43.3 ± 10.3 | 43.6 ± 11.8 | 0.94 | |
| ATM (kg) | 22.8 [14.5–38.4] | 20.8 [15.2–33.3] | 25.3 [14.4–41] | 0.88 | |
| FTM (kg) | 17 [11.2–28.6] | 14 [10.6–18.9] | 21.5 [12.3–34.6] | 0.20 | |
| BCM (kg) | 24.8 ± 7.6 | 24.2 ± 6.3 | 25.1 ± 8.3 | 0.75 | |
| Clinical | |||||
| US-B lines (n) | 2 [0–5] | 3 [1–7] | 1.5 [0–5] | 0.04 | |
| Pulmonary crackles (score) | 1.79 ± 0.9 | 2.4 ± 0.9 | 1.4 ± 0.7 | 0.04 | |
| Oedema (score) | 1.41 ± 0.68 | 1.7 ± 0.8 | 1.2 ± 0.5 | 0.10 | |
| Nt-ProBNP (pg/mL) | 3455 [1433–20048] | 2890 [685–12493] | 4641 [2603–20048] | 0.35 | |
| IVC-EI (mm) | 0.75 [0.48–1.16] | 1.12 [0.54–1.23] | 0.75 [0.12–0.98] | 0.16 | |
| IVC-EE (mm) | 1.5 [1.01–1.84] | 1.53 [1.23–1.77] | 1.36 [0.97–1.92] | 0.65 | |
| Average weight loss (Kg) | 2.45 ± 0.33 | 2.32 ± 0.50 | 2.66 ± 0.86 | 0.23 | |
| UFR (L/h) | 0.50 ± 0.18 | 0.49 ± 0.19 | 0.56 ± 0.20 | 0.20 | |
| Echocardiography | |||||
| LAVi (mL/m |
32 [23–46] | 30 [27–45] | 35 [23–55.5] | 0.73 | |
| LVMi (g/m |
126.8 ± 37.2 | 124.1 ± 46.9 | 127.9 ± 34.1 | 0.82 | |
| LVEDVi (mL/m |
53 ± 19.6 | 55.7 ± 17.9 | 51.7 ± 20.9 | 0.67 | |
| Ejection fraction (%) | 55.8 ± 5.2 | 57.5 ± 3.4 | 55 ± 5.7 | 0.27 | |
| ePAPs (mmHg) | 28.1 [21.2–35] | 25.3 [18.8–29.3] | 29.1 [23.4–41.9] | 0.29 | |
| TAPSE (mm) | 20 ± 4.8 | 22.1 ± 3.1 | 19.1 ± 5.1 | 0.17 | |
| E/e’ | 9.9 ± 3.4 | 8.25 ± 2.81 | 10.45 ± 3.43 | 0.05 | |
| Fractional shortening (%) | 35.2 ± 5.1 | 34.8 ± 3.7 | 35.4 ± 5.7 | 0.82 | |
| RAVi (mL/m |
24 [16.7–31.2] | 24 [17.7–25] | 24 [17.2–35] | 0.57 | |
| Legend: OH, overhydration; LTI, lean tissue index; FTI, normally
hydrated fat tissue index, TBW, total body water; ECW, extracellular body water;
ICW, intracellular body water; LTM, lean tissue mass; ATM, adipose tissue mass;
FTM, normally hydrated fat tissue mass; BCM, metabolically active body cell mass;
US-B, lung comets; Nt-proBNP, n terminal pro b-type natriuretic peptide; IVC-EI,
inferior vena cava diameter end inspiration; IVC-EE, inferior vena cava diameter
end expiration; UFR, ultrafiltration rate (average of hourly measurements); LAVi,
left atrial volume index; LVMi, left ventricular mass index; ePAPs, estimated
systolic pulmonary artery pressure; TAPSE, tricuspid annular plane excursion;
E/e’, early diastolic peak left ventricular inflow velocity (E)/early diastolic
peak lateral mitral annular velocity (e’) ratio; RAVi, right atrial volume index;
LVEDVi, left-ventricular end diastolic volume index. Data are presented as mean
( | |||||
During the 30-day follow-up, 19 patients (65.5%) experienced at least one IDH
with a total of 73 episodes recorded altogether (mean number of IDH per patient
3.47
MBG levels at baseline were markedly reduced in HD patients experiencing IDH
during follow-up as compared to others (0.65
In the whole cohort, significant, inverse correlations were found between the absolute number of IDH episodes per person and, respectively pre-dialysis MBG (R –0.55; p = 0.001), 2 h MBG (–0.50; p = 0.007) and HD-end MBG (–0.59; p = 0.001).
Tables 1,2 summarize the main characteristics of the two study subgroups. Fig. 1 illustrates MBG levels in HD patients categorized according to IDH occurrence during follow-up.
MBG levels at the end of the HD session were comparable to those measured at
baseline (0.90 [0.35–0.96] nmol/L vs. 0.75
MBG variations were then analyzed in HD patients who experienced IDH during
follow-up and who did not. The average weight loss achieved at the end of this HD
session was not different between the two subgroups (2.32
MBG levels remained roughly unchanged in HD patients with no documented IDH
episodes during follow-up (baseline MBG vs. HD-end: 0.94
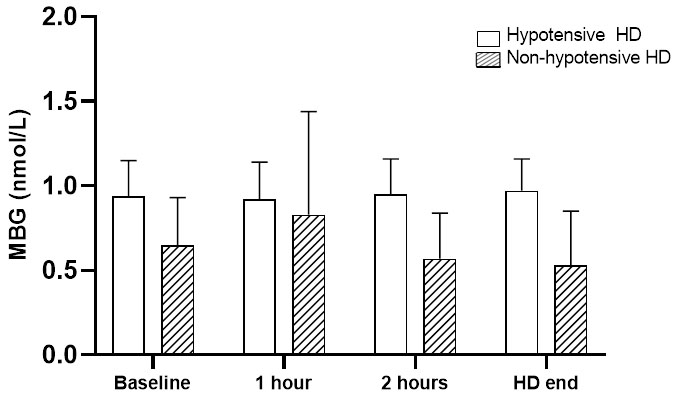 Fig. 2.
Changes in MBG levels throughout a single HD session in patients with or without IDH episodes during follow-up.p for trend in non-hypotensive HD = 0.26; p for trend in hypotensive HD = 0.02; p for comparison between trends = 0.004.
The diagnostic capacity of MBG to identify HD patients experiencing IDH episodes was assessed for each time-point measurement by separate ROC analyses (Fig. 3 and Table 3).
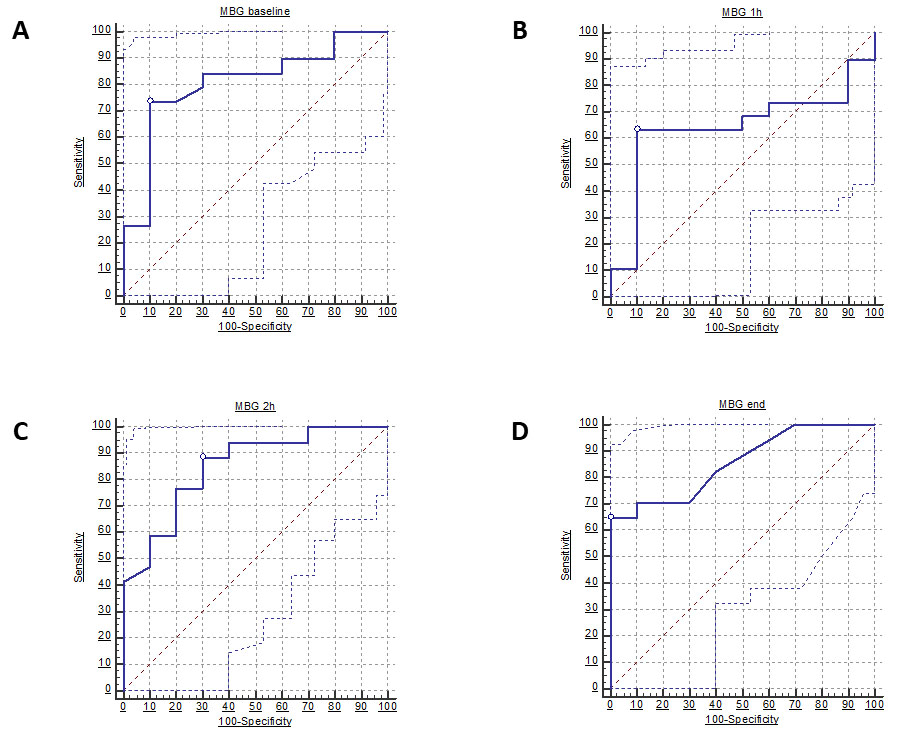 Fig. 3.
ROC curves of MBG levels measured prior to dialysis start (A), 1 h after dialysis start (B), 2 h after dialysis start (C) and at the end of dialysis session (D) to detect patients experiencing IDH episodes. White dots indicate the best cut-off value (Youden Index).
| AUC [95% CI] | p | Best cut-off | Sensitivity % | Specificity % | |
| MBG (pre-dialysis) | 0.808 [0.634 to 0.982] | 0.0005 | ≤0.82 nmol/L | 73.7 [48.8–90.9] | 90.0 [55.5–99.7] |
| MBG 1 h | 0.642 [0.426 to 0.858] | 0.19 | ≤0.77 nmol/L | 63.1 [38.4–83.7] | 90.0 [55.5–99.7] |
| MBG 2 h | 0.850 [0.699 to 1.000] | ≤0.92 nmol/L | 88.2 [63.6–98.5] | 70.0 [34.8–93.3] | |
| MBG HD-end | 0.856 [0.718 to 0.994] | ≤0.55 nmol/L | 64.7 [38.3–85.8] | 100 [69.2–100] | |
| Legend: MBG, marinobufagenin; MBG 1 h, marinobufagenin measured 1 h after dialysis start; MBG 2 h, marinobufagenin measured 2 h after dialysis start; MBG HD-end, marinobufagenin measured at the end of the dialysis session. | |||||
Baseline MBG levels displayed a remarkable diagnostic capacity to discriminate
such individuals with an AUC of 0.808 [95% CI 0.634 to 0.982; p =
0.0005] and a best cut-off of
Kaplan-Meier survival curves of IDH-free patients were then generated for individuals categorized according to the optimal, ROC-derived MBG thresholds at each time-point measurement (Fig. 4). 1 h MBG levels were excluded from this analysis as apparently not discriminant.
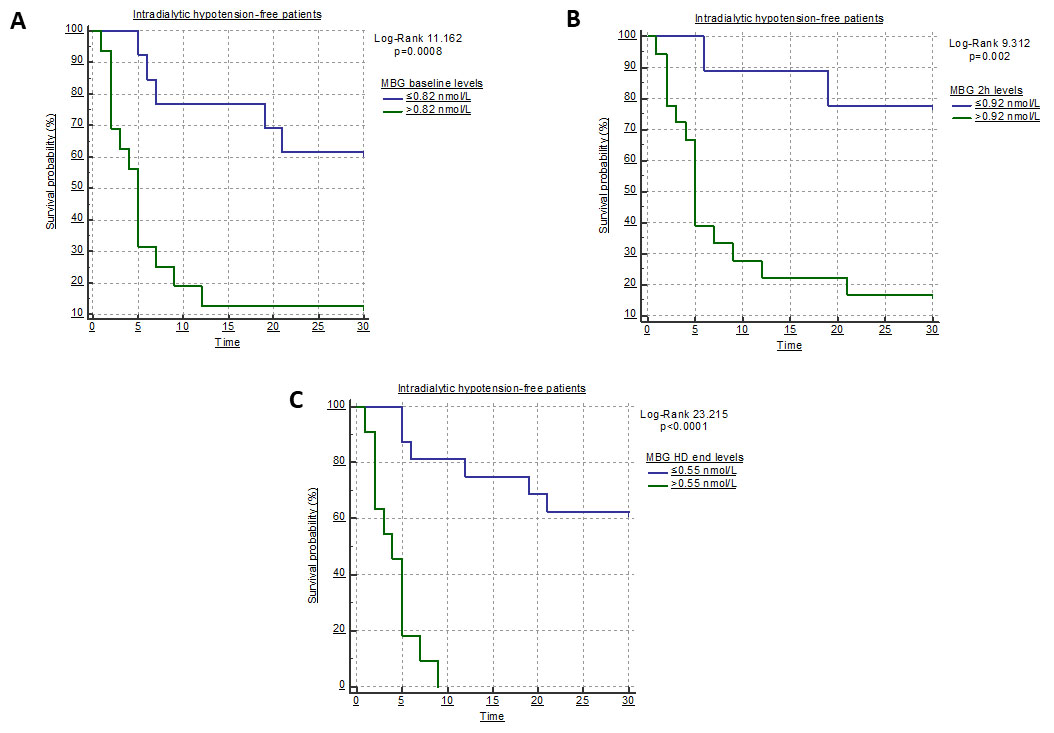 Fig. 4.
Kaplan-Meier survival curves of IDH-free patients according to the optimal ROC-derived cut-off for MBG measured prior to dialysis start (A), 2 h after HD start (B) and at the end of the HD session (C).
Lower baseline MBG resulted strongly associated with a higher risk of IDH
throughout the follow-up period (Log-rank 11.162; p = 0.0008) with a
crude HR of 4.37 [95% CI 1.73 to 10.99]. Similarly, reduced MBG levels at 2 h
(Log-rank 9.312; p = 0.02) and, more markedly, at HD end (Log-rank
23.215; p
Parameters that were different at baseline between subgroups of HD patients with
or without IDH episodes during follow-up (Tables 1,2) were tested in a
Cox-regression analysis to evaluate time-dependent associations with the outcome
of interest. As summarized in Table 4, in this analysis serum phosphate (HR
1.665; 95% CI 1.077 to 2.571; p = 0.02), LDL cholesterol (HR 1.016;
95% CI 1.001 to 1.031; p = 0.03), total cholesterol (HR 1.014; 95% CI
1.001 to 1.027; p = 0.03), E/e’ (HR 1.137; 95% CI 1.000 to 1.416;
p = 0.05) and, above all, pre-dialysis MBG (HR 0.155; 95% CI 0.040 to
0.598; p
| Variable | Units of Increase | HR | 95% CI | X |
p |
| Serum phosphate | 1 mg/dL | 1.665 | 1.077 to 2.571 | 5.04 | 0.02 |
| Serum potassium | 1 mg/dL | 1.637 | 0.706 to 3.791 | 1.26 | 0.20 |
| LDL cholesterol | 1 mg/dL | 1.016 | 1.001 to 1.031 | 4.71 | 0.03 |
| Total cholesterol | 1 mg/dL | 1.014 | 1.001 to 1.027 | 4.53 | 0.03 |
| ESR | 1 mm/h | 1.010 | 0.996 to 1.024 | 1.81 | 0.17 |
| OH | 1 L | 0.877 | 0.730 to 1.054 | 1.96 | 0.16 |
| US-B lines | 1 U | 1.002 | 0.955 to 1.051 | 0.08 | 0.92 |
| Pulmonary crackles | 1 U | 0.491 | 0.260 to 1.018 | 2.81 | 0.07 |
| E/e’ | 1 U | 1.137 | 1.000 to 1.416 | 3.09 | 0.05 |
| MBG (pre-dialysis) | 1 nmol/L | 0.155 | 0.040 to 0.598 | 6.66 | |
| MBG 2 h | 1 nmol/L | 0.099 | 0.021 to 0.454 | 8.97 | 0.002 |
| MBG HD-end | 1 nmol/L | 0.068 | 0.014 to 0.322 | 12.58 | 0.0004 |
| Legend: LDL, low-density lipoprotein; ESR, erythrocyte sedimentation rate; OH, overhydration (bioimpedance); US-B: lung comets; E/e’, early diastolic peak left ventricular inflow velocity (E)/early diastolic peak lateral mitral annular velocity (e’) ratio; MBG, marinobufagenin; MBG 2 h, marinobufagenin measured 2 h after dialysis start; MBG HD-end, marinobufagenin measured at the end of the dialysis session. | |||||
IDH remains a dangerous complication which is estimated to occur in about one third of individuals undergoing chronic HD treatment [23, 24, 25, 26]. The pathogenesis of IDH is acknowledged to be complex and multifactorial, as it may depend either from a too much aggressive fluid removal with HD but also from deranged neurohormonal and peripheral responses to circulating volume reduction [3].
In our study, we have worked on characterizing possible predictors of IDH in a homogeneous cohort of HD patients, with a particular focus on the possible role of marinobufagenin, an endogenous cardiotonic steroid which has previously been involved in pathological body fluid volume expansion or deranged peripheral vasoconstriction [27].
In our HD patients, in line with previous evidence [12, 13, 14, 28], we have found increased MBG values with respect to healthy subjects. Beyond this simple observation, however, some key-findings in our study corroborate the hypothesis that this hormone might also be related with IDH.
First, we have found significantly reduced baseline MBG values in HD patients who experienced IDH during follow-up. Of note, such values were even as low as those measured in healthy controls. Furthermore, although MBG levels remained stable in the whole study population during a single dialysis session, different fluctuation patterns were described at stratified analyses.
In fact, in HD patients prone to develop IDH an early significant increase in circulating MBG was followed by a progressive decrease until the end of the HD session. Conversely, patients not experiencing IDH showed higher and stable MBG levels throughout the whole time-treatment. Interestingly, no differences in the hourly and absolute weight loss were reported between the two subpopulations and no significant correlations were found between MBG levels and the absolute or partial weight loss achieved, either among all patients and within the two subgroups. These observations would exclude, in principle, that the relationship between MBG and IDH could be influenced by the entity of fluid loss achieved during HD. On the contrary, the higher MBG values generally found in HD patients and, in particular, in the subgroup not experiencing IDH episodes, could be interpreted as a compensatory mechanism, which failure due to an insufficient MBG production or release would translate into a maladaptive hemodynamic response to plasma volume reduction, eventually leading to recurrent IDH episodes.
In line with this hypothesis, a strong inverse relationship was also noticed between baseline MBG values and the absolute number of IDH episodes per patient recorded during follow-up.
Of note, this interpretation would recall previous evidence pointing at the altered MBG levels in CKD patients as a reactive phenomenon to the deranged sympathetic activation and cardiac remodelling which usually characterize these individuals [29].
Indeed, the observational nature of our study, the small sample size and the homogeneity of the cohort prevented us to clarify whether the altered MBG levels are a true causal factor or a mere epiphenomenon of IDH. Similarly, a potential selection bias, the effect of residual confounding, possible circadian variations in MBG levels and a still marginal impact of volume removal by the dialysis treatment on MBG variations cannot be fully ruled out.
Nevertheless, beyond its exact role in the pathogenesis of IDH, results from our study indicate that MBG holds an important prognostic capacity with respect to IDH.
In fact, serial MBG measurements performed during a single dialysis session showed a remarkable diagnostic ability in identifying individuals with IDH during follow-up. This predictive capacity was further confirmed at survival analyses, demonstrating that HD patients with lower MBG levels manifested a four-to-six fold increased crude risk of IDH during follow-up (HR ranging from 4.37–6.68). Interestingly, IDH patients were apparently not different at baseline from others with respect to clinical and instrumental parameters of fluid status, with the exception of a slightly lower overhydration at bioimpedance, lower scores of lung congestion (namely, pulmonary crackles and US-B lines) and evidence of diastolic dysfunction at echocardiography (increased E/e’). Nevertheless, none of these parameters, with the only exception of E/e’, resulted significantly associated to IDH when tested at Cox regression analyses.
The association found between LV diastolic function and the propensity to develop IDH, as shown by the higher median E/e’ value along with a higher prevalence of left atrial enlargement is particularly interesting. The impairment in LV diastolic function in HD patients is known to be related at least in part with the increase in LV mass [30], an alteration which resulted exceedingly prevalent also in this study cohort. In this regard, the association between an impairment in LV diastolic function does not come as a surprise, as it interferes with LV loading, hence impacting on cardiac output and systemic pressure. In addition, the development of pulmonary hypertension in HD patients might have exerted a further negative impact on LV loading. In this context, our observation of higher ePAPs values in IDH patients, although not statistically significant, is worth noting.
As previously alluded to before, we acknowledge again the small sample size as a key-limitation of our study which prevented the employment of multivariate models to ascertain independent relationships. Nevertheless, at such univariate analyses, MBG resulted the strongest time-dependent predictor of IDH among all the variables considered, therefore confirming its prognostic potential with respect to this complication. In addition, our findings would support the general idea that a combined clinical-instrumental multiple approach to improve dry-weight estimation, although useful in refining the overall cardiovascular prognosis, is sometimes not effective in fully capturing the individual risk of hypotensive complications [31].
In conclusion, we found deranged circulating levels of MBG in a small cohort of chronic HD patients which could represent, at least in part, the expression of a compensatory mechanism to the sustained vascular and hemodynamic stress characterizing chronic renal replacement therapy. Maladaptation or failure in such a response may translate into a difficulty to compensate acute hemodynamic changes occurring during a dialysis session, eventually leading to recurrent, potentially dangerous IDH episodes.
Mechanistic studies are needed to confirm this pathological interpretation and to clarify the exact role of this hormone in uremic patients. No less important, larger clinical studies on more heterogeneous HD cohorts are advocated to ascertain whether MBG may represent a reliable and quick biomarker to stratify the risk of dangerous hypotensive episodes in this particular population setting.
Research idea—DB, GCo, MA, CI, SDR. Data collection and analysis—PP, GCr, NC, RA, AC, JS, IL, DPF, FD, DB. Laboratory and instrumental measurement—MG, JS, NC, PP, IL, RA, AC, AS, DPF, SDR, FD, GCr. Manuscript preparation and revision—DB, GCo, PP, MA, CI, SDR. All authors contributed to editorial changes in the manuscript. All authors read and approved the final manuscript.
Not applicable.
We would like to thank all the peer reviewers for sharing important suggestions to improve the quality of our paper.
This research received no external funding.
The authors declare no conflict of interest. Davide Bolignano is serving as one of the Editorial Board members of this journal. We declare that Davide Bolignano had no involvement in the peer review of this article and has no access to information regarding its peer review. Full responsibility for the editorial process for this article was delegated to Peter A. McCullough.