
Academic Editor: Graham Pawelec
Background: Lipocalin belongs to the calcyin family, and its sequence length is generally between 165 and 200 residues. They are mainly stable and multifunctional extracellular proteins. Lipocalin plays an important role in several stress responses and allergic inflammations. Because the accurate identification of lipocalins could provide significant evidences for the study of their function, it is necessary to develop a machine learning-based model to recognize lipocalin. Methods: In this study, we constructed a prediction model to identify lipocalin. Their sequences were encoded by six types of features, namely amino acid composition (AAC), composition of k-spaced amino acid pairs (CKSAAP), pseudo amino acid composition (PseAAC), Geary correlation (GD), normalized Moreau-Broto autocorrelation (NMBroto) and composition/transition/distribution (CTD). Subsequently, these features were optimized by using feature selection techniques. A classifier based on random forest was trained according to the optimal features. Results: The results of 10-fold cross-validation showed that our computational model would classify lipocalins with accuracy of 95.03% and area under the curve of 0.987. On the independent dataset, our computational model could produce the accuracy of 89.90% which was 4.17% higher than the existing model. Conclusions: In this work, we developed an advanced computational model to discriminate lipocalin proteins from non-lipocalin proteins. In the proposed model, protein sequences were encoded by six descriptors. Then, feature selection was performed to pick out the best features which could produce the maximum accuracy. On the basis of the best feature subset, the RF-based classifier can obtained the best prediction results.
Lipocalin belongs to the calcyin family and is usually composed of 165–200 residues. It is mainly a stable and multifunctional extracellular protein. Lipocalin proteins can carry aquaphobic molecules such as lipids, steroids and retinoids [1, 2, 3]. Lipocalins have important applications in several stress responses, homeostasis, candidate markers of renal functions and allergic inflammations [4, 5, 6]. The biological role of lipocalin in human body is shown in Fig. 1.
 Fig. 1.
The biological role of lipocalin in human body.
After the Human Genome Project (HGP), biological sequence data increased significantly [7, 8, 9]. The traditional research technology based on biochemistry is time-consuming, expensive and inefficient. Therefore, it is necessary to develop computational methods that can accurately recognize biomolecular functions in a short time [10, 11, 12]. Existing computating tools, such as FASTA [13], HAlign [14, 15] and BLAST [16], can search sequences with the help of known protein databases. However, these tools cannot correctly distinguish lipocalins when there is no homologous sequence in benchmark dataset. Therefore, it is urgent to establish a machine learning-based model to identify lipocalins. In previous methods, a model called lipocalin-pred [17] was established to recognize lipocalins by using amino acid composition (AAC), reduced AAC [18, 19], di-peptide composition (DPC), secondary structure composition (SSC) and position-specific scoring method (PSSM). It could yield an accuracy of 90.72%. Pugalenthi et al. [20] proposed a predictor based on support vector machine (SVM). Several features, such as AAC, SSC and physiochemical properties, were used. As a result, they achieved an accuracy of 84.37%. Although the two models can produce encouraging outcomes, there is still room for further improvement.
To further improve the prediction accuracy, we proposed a random forest (RF)-based model to recognize lipocalins. The flowchart of the proposed model was shown in Fig. 2. Initially, the sequences were encoded by six types of features, namely AAC, CKSAAP, GD [21], NMBroto [22], CTD [23] and PseAAC [24]. Subsequently, these features were optimized by using analysis of variance (ANOVA) [25], Maximum Relevance Maximum Distance (MRMD) [26] and minimum Redundancy Maximum Relevance (mRMR) [27] with incremental feature selection (IFS) [28]. The RF-based model was trained using the optimal features. The performance of the proposed model was evaluated by 10-fold cross-validation.
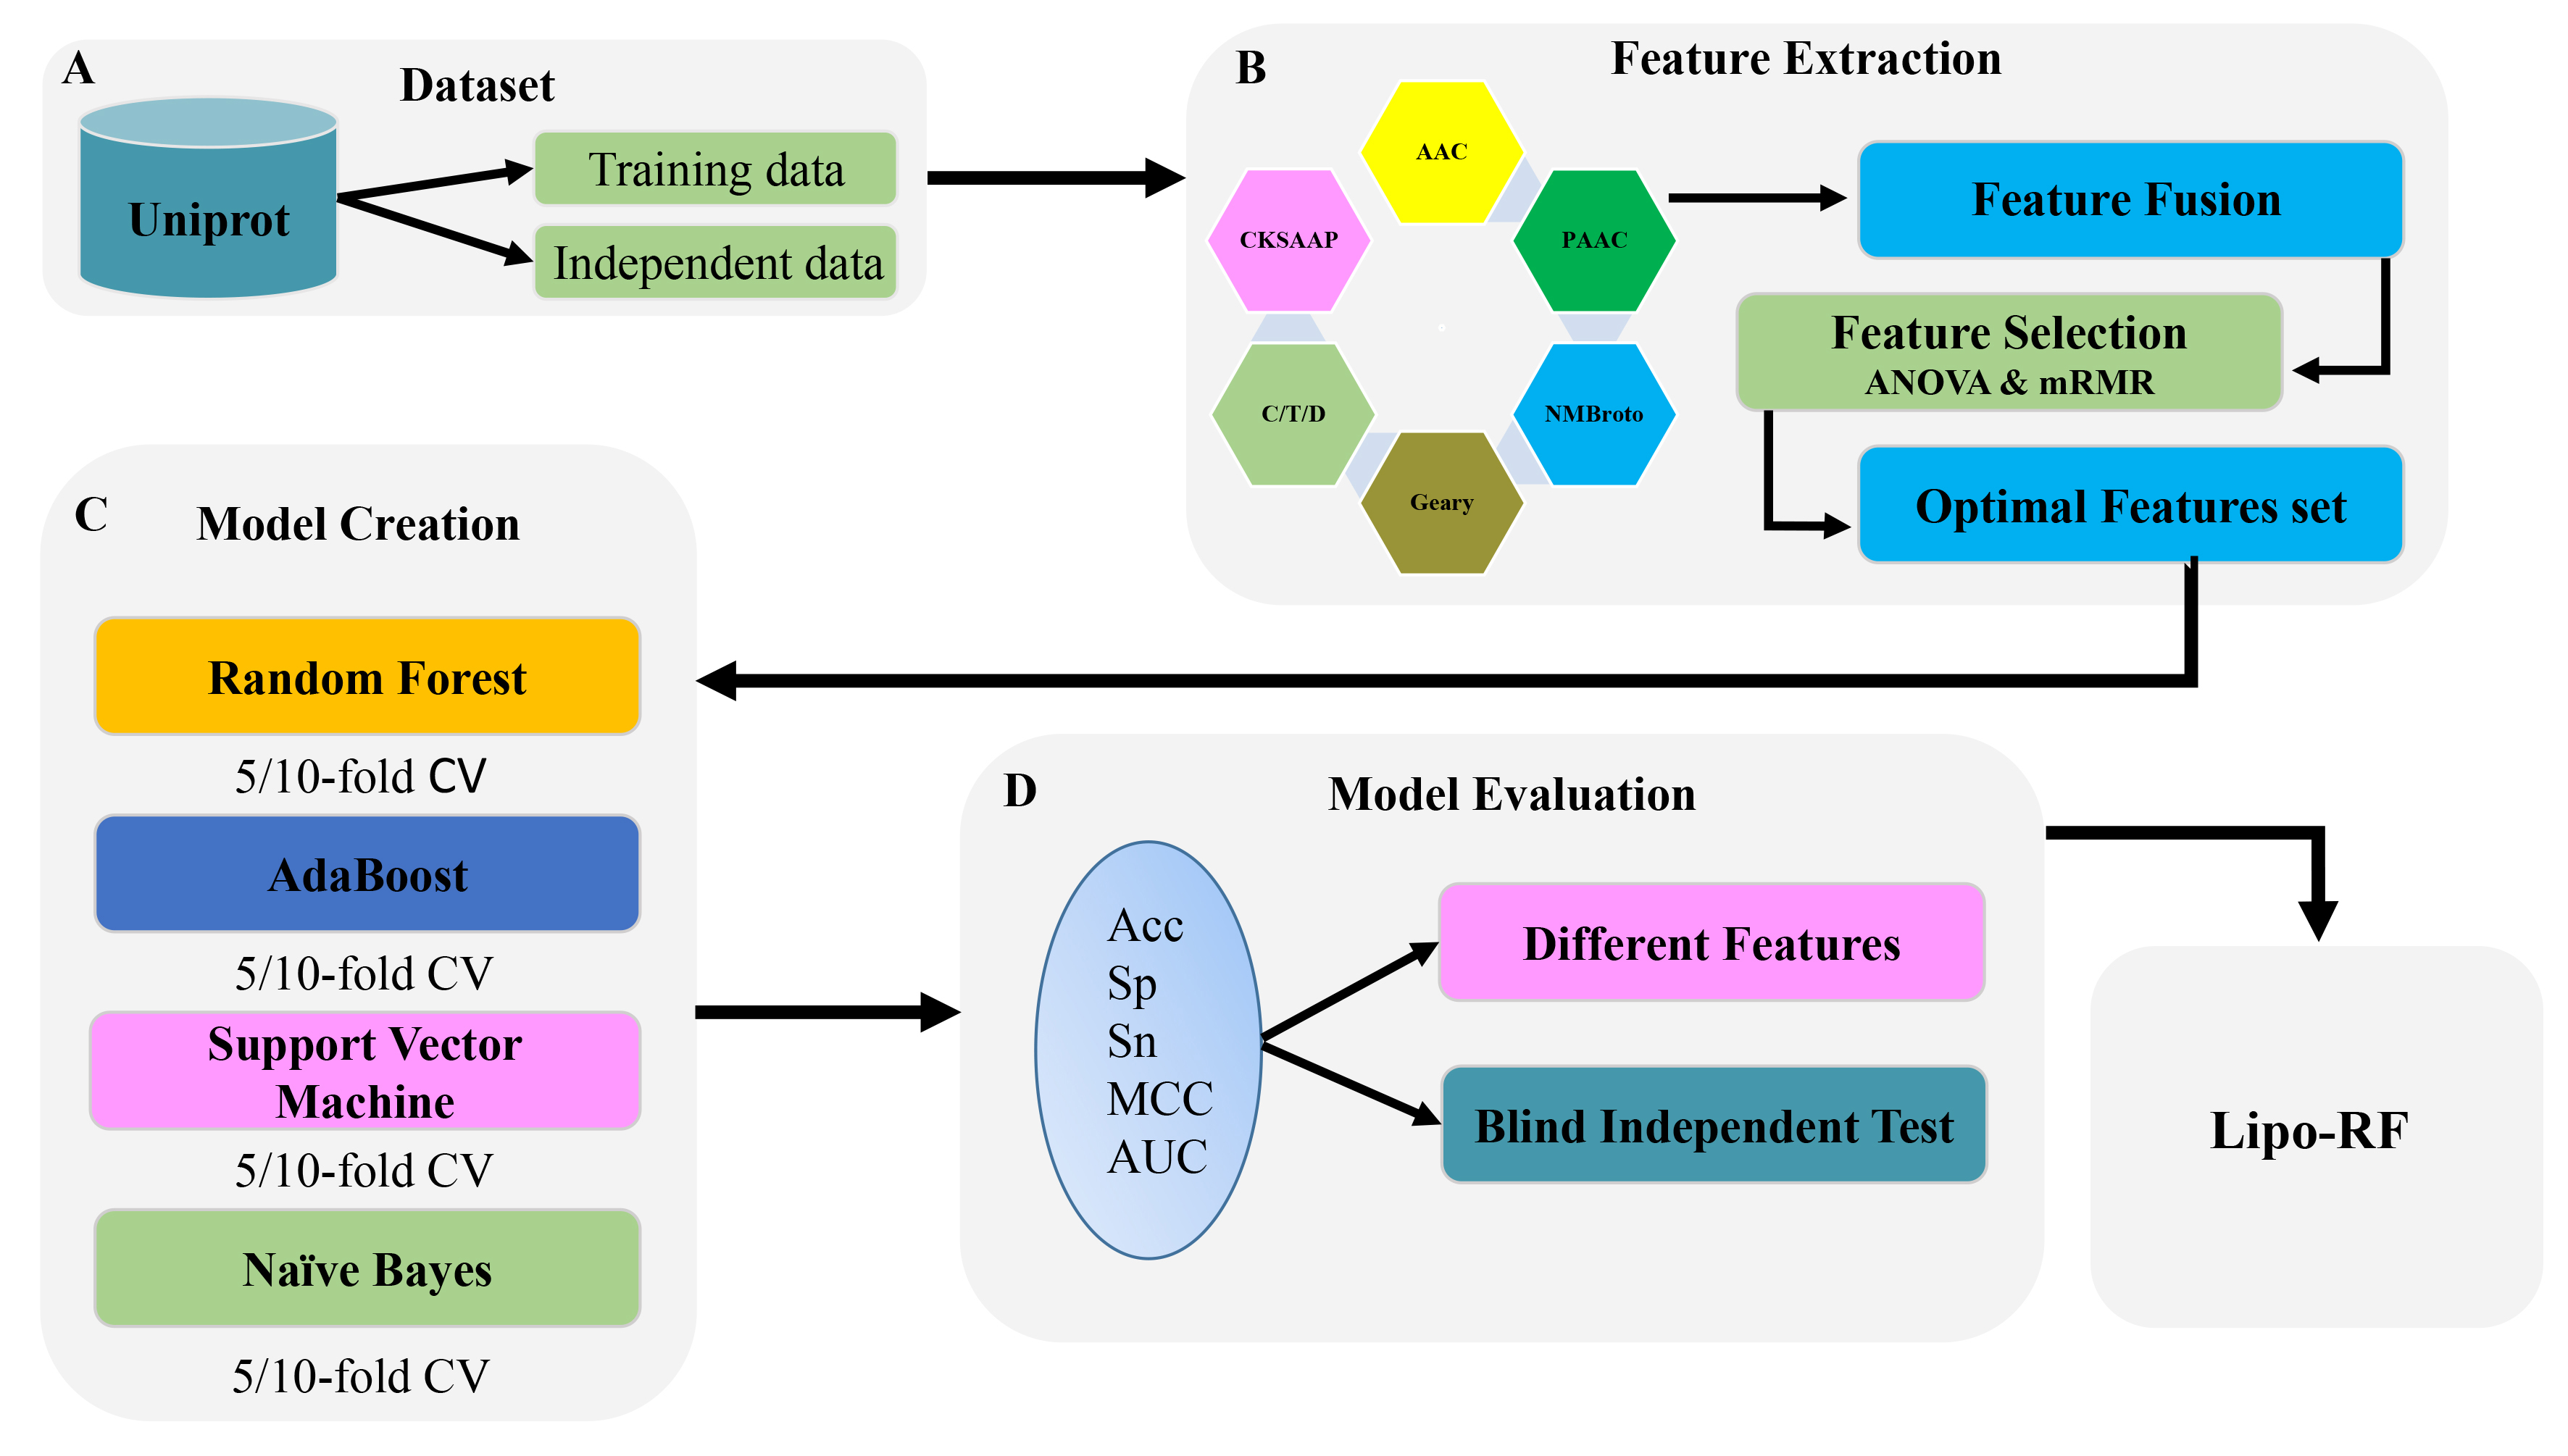 Fig. 2.
The flowchart of the whole study. (A) Dataset was constructed and then divided it in to training and testing data. (B) Extracted features by utilizing six types of feature descriptors and then optimized the features by using ANOVA and mRMR. (C) Constructed the models by utilizing different classifiers on 5/10-fold CV. (D) Evaluated the models on independent dataset on the basis of accuracy, specificity, sensitivity, MCC and AUC.
Reliable and accurate dataset is essential for the establishment of prediction model [29, 30, 31, 32, 33, 34]. Therefore, we firstly collected 307 positive and 307 negative samples from the open-source database UniProt, and then excluded highly similar sequences using CD-HIT with the cutoff of 40% [35]. Finally, we obtained 211 lipocalins and 211 non-lipocalin proteins. In addition, we also built an independent dataset, including 42 lipocalin protein sequences and 42 non-lipocalin protein sequences, to test the prediction model.
Choosing informative and autonomous feature is a significant step in generating machine learning-based models [36, 37, 38, 39, 40, 41]. Formulating sequence with mathematical expression is also a crucial step in protein function prediction [42, 43, 44, 45, 46, 47, 48, 49]. Hence, six types of features were utilized to describe the residues sequences of proteins.
AAC is the frequency of amino acid residues in a protein sequence [50, 51, 52, 53, 54]. The
frequencies
where
CKSAAP describes the occurrence of amino acid pairs disengaged by any K
amino acid (K = 0, 1, 2, 3, 4, 5). It [50] is demarcated as
k-spaced residual pairs
where
It contains the occurrence frequency of amino acids and the correlation of
physiochemical properties between two amino acid residues [55]. It comprises of
where
CTD describes the composition, transition and distribution of AAC in a protein sequence [56]. Amino acids are separated into three different classes on the basis of their physiochemical properties [18, 57, 58]. It is calculated as follows:
where
It is a type of association descriptor and has an extreme resemblance with
M-descriptor [59]. The mathematical manifestation is shown as
where
It is a kind of autocorrelation function [22] and has a resemblance with Moran-descriptor. The mathematical manifestation is shown as
where
Redundancy and noise in feature set may lead to disappointing performance of prediction model [60, 61, 62]. Thus, feature selection is a key step to eliminate unimportant features and improve efficiency of prediction model [63, 64, 65, 66]. There are several feature selection techniques, such as ANOVA [25], F-score [67], mRMR [27], chi-square [68] and LGBM [69, 70]. A feature set with high dimension may produce redundancy, overfitting and yield low accuracy in cross-validation prediction. Hence, ANOVA is a good choice to deal with these problems, because it takes less time and produce effective outcomes. The fusion of feature does not mean that good results can be achieved. These features may be highly correlated, which will lead to the emergence of redundant information in the feature set. Therefore, mRMR is an ideal choice to overcome these problems, because it is able to find the correlation between features. In this work, ANOVA and mRMR [27] were used to rank features. By combining with IFS [67], the optimal feature subset could be obtained. The details about ANOVA, mRMR and IFS can be found in our previous study [24]. The comparison with other different kind of feature selection techniques and the contribution of feature descriptors have been shown in Fig. 3A–D.
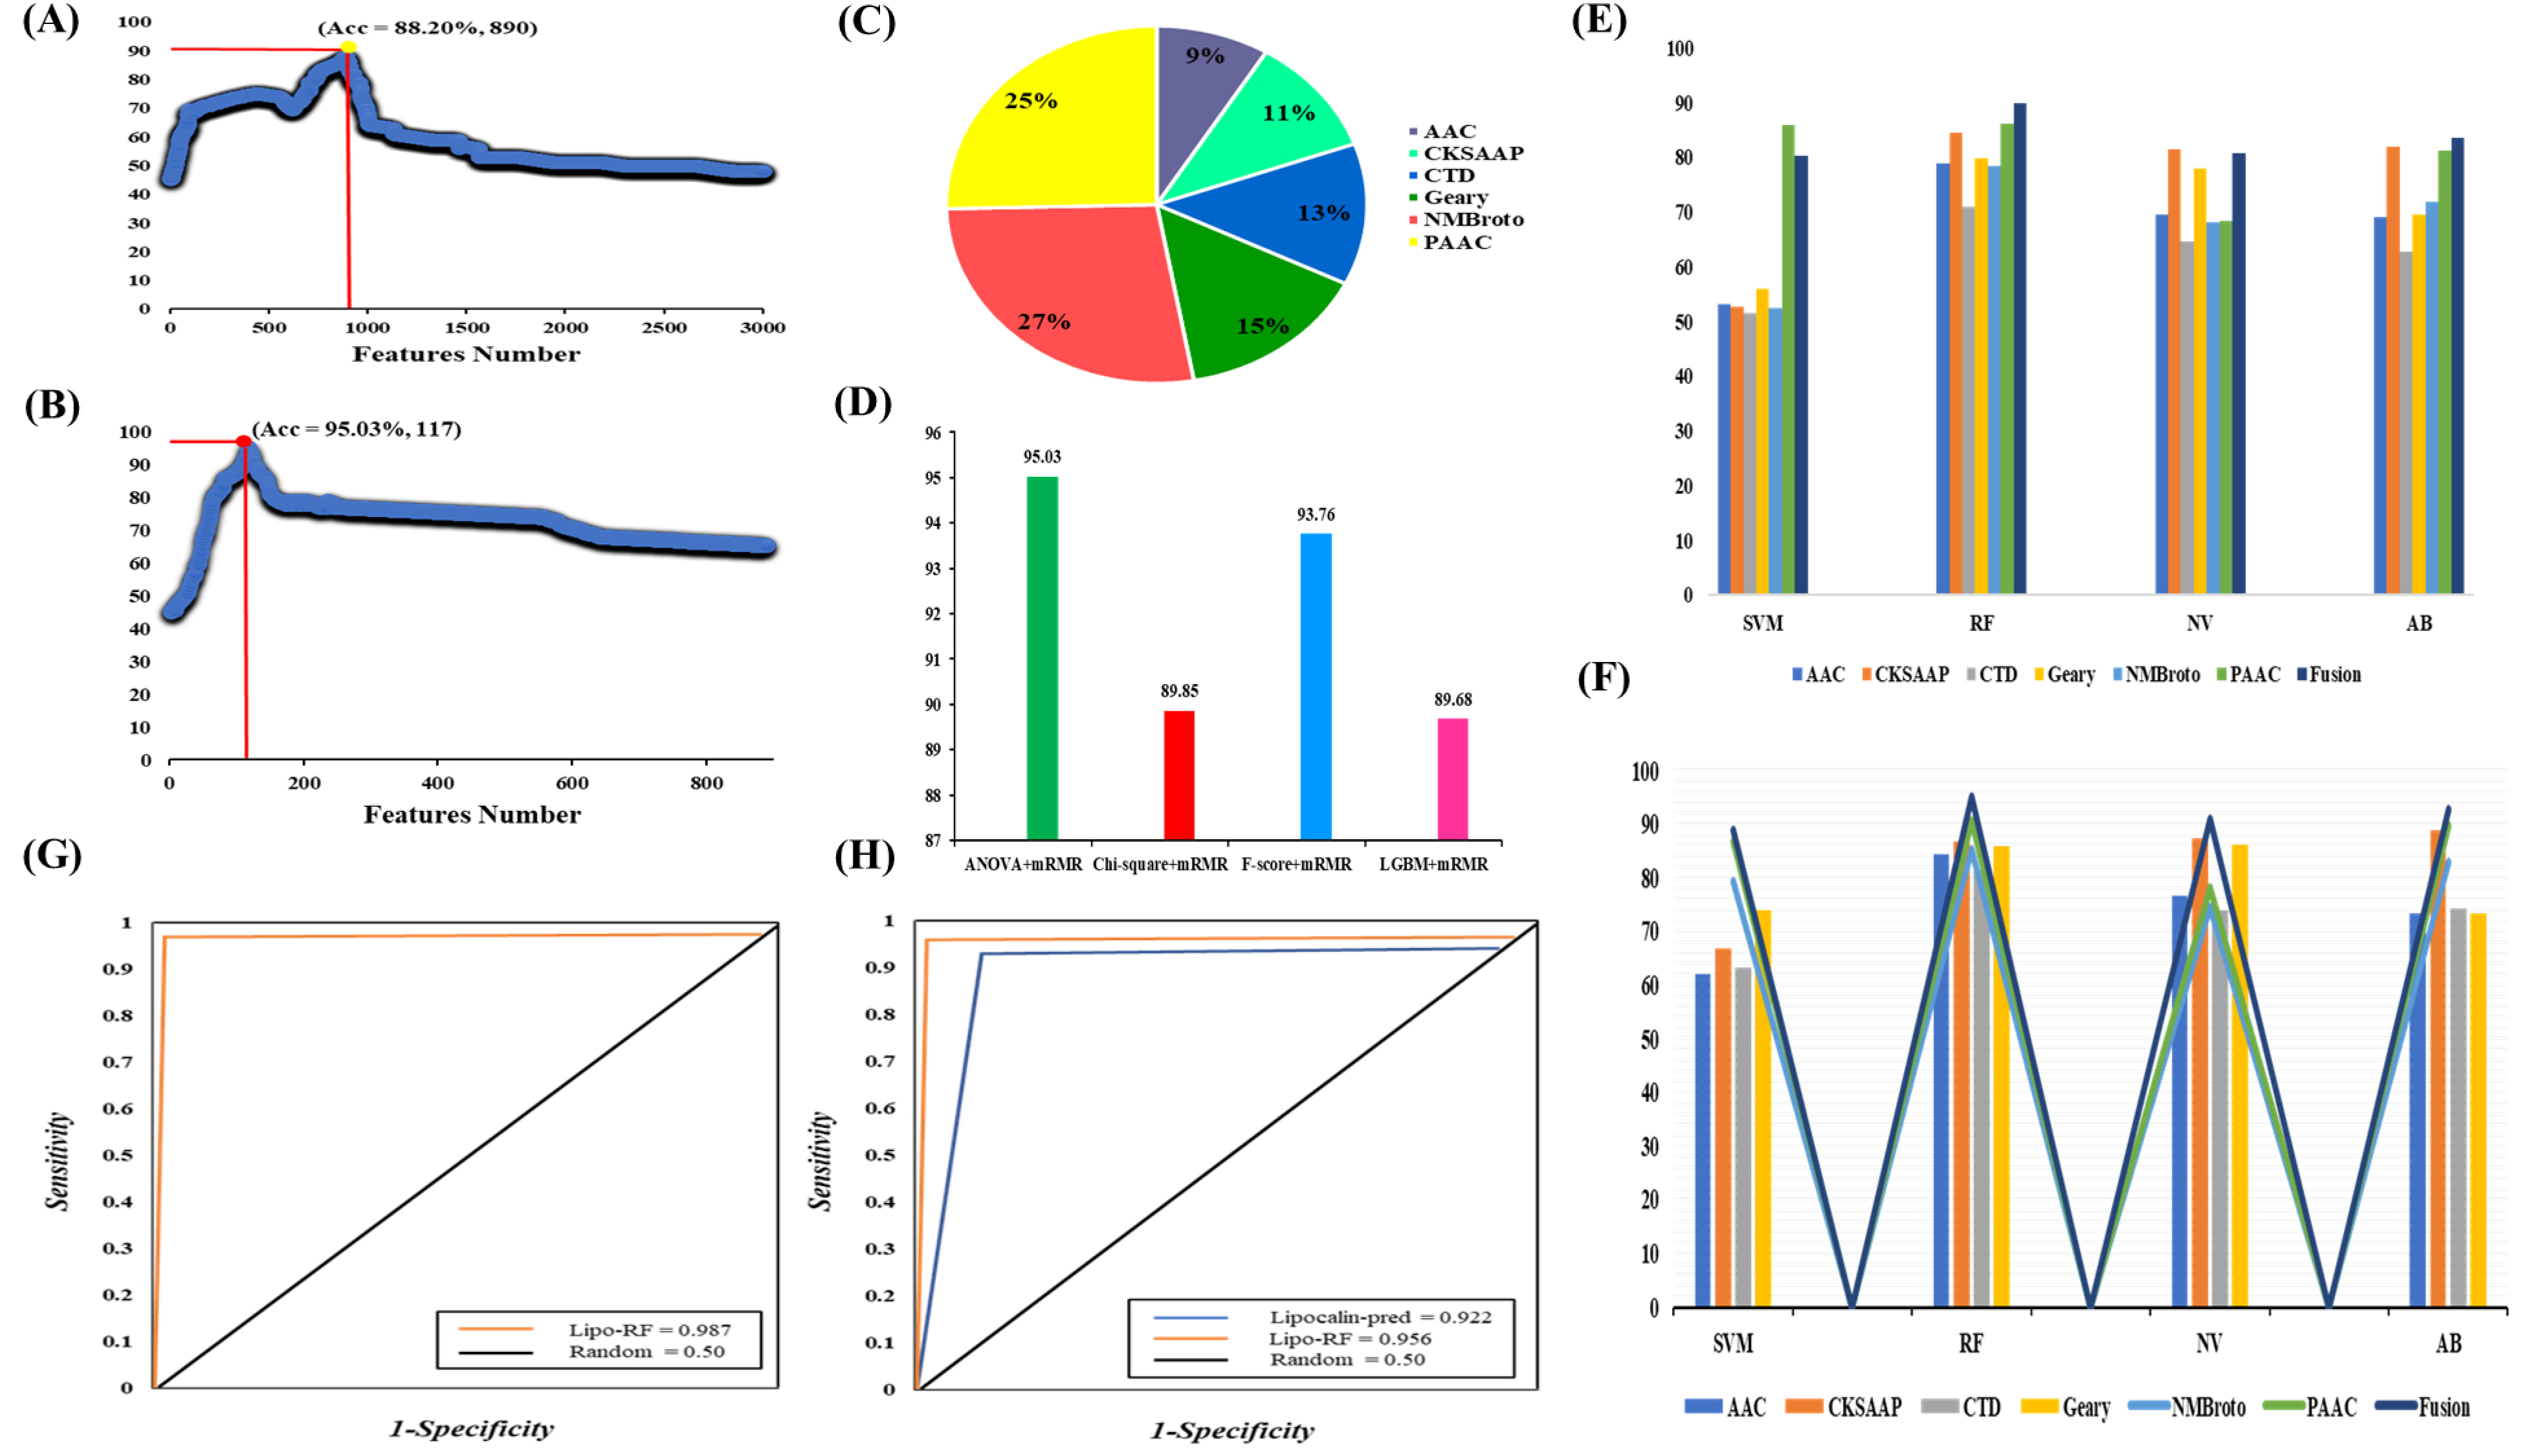 Fig. 3.
Plot showing the IFS procedure for identifying lipocalins in 10-fold cross-validation. (A) Firstly, 890 features were selected from a total of 2990 features by ANOVA. (B) 117 optimal features were further obtained from 890 features by mRMR. The accuracy increases from 88.20% to 95.03%. (C) The contribution of different feature descriptors in the model based on fusion features. (D) Compare different feature selection algorithms. (E) The performance of single-encoded features and their fusion on different classifiers before feature selection. (F) The performance of optimal single-encoded features and their fusion on different classifiers. (G) AUC value of Lipo-RF on 10-fold cross validation. (H) Comparison of proposed model with Lipocalin-pred on independent dataset.
Classification is a form of supervised learning and plays an important role in decision making [60, 71, 72, 73, 74, 75, 76, 77, 78, 79, 80]. In this work, we chose RF to establish a model for recognizing lipocalin. Three machine learning methods namely Naïve Bayes (NB), support vector machine (SVM) [81, 82], and Ada boost (AB) [83, 84] were compared. RF is a comprehensive knowledge technology, which has been widely used in bioinformatics [85, 86, 87]. The principle is to combine multiple weak classifiers and get the results through the voting process, so that the results of the prediction model have the greatest improvement and generalization. The complete procedure has been clearly described in reference [88]. Weka version 3.8.4 (University of Waikato, Hamilton, New Zealand) [89] was utilized to implement the RF-based classifiers. The best parameters were shown in Table 1.
| Best Parameters | |
| ‘N-estimators’ | 100 |
| ‘Learning-rate’ | 0.001 |
| ‘Mean absolute error’ | 0.143 |
| ‘Kappa statistics’ | 0.900 |
| ‘Mean square error’ | 0.220 |
Accuracy (Acc), sensitivity (Sn), Matthews correlation coefficient (MCC) and specificity (Sp) [90, 91] were utilized to measure the performance of proposed model, which is expressed by the following formula:
where true positive indicates lipocalin, and false positive indicates the non-lipocalin classified as lipocalin. On the other hand, true negative represents non-lipocalin, and false negative represents lipocalin classified as non-lipocalin. The receiver operating characteristic (ROC) curve and the area under the curve (AUC) were used to measure the effectiveness of the prediction model. AUC of perfect classifier is 1 and AUC of random behavior is 0.5.
Firstly, six different feature descriptors were used to transform the training data into feature vectors. Then, through 10-fold cross-validation, RF-based classifier was used to evaluate each feature descriptor. Subsequently, in order to improve the prediction accuracy, ANOVA and mRMR combined with IFS were used to select the optimal feature subset. Fig. 3A,B show the incremental feature selection curves. Fig. 3E,F show the AUC difference of single-encodings and their fusion on different ML-based classifiers before and after the feature selection. Table 2 shows the effectiveness of the improved prediction models based on single-encoding and feature fusion on several ML-based methods. The results of the model based on single-encoding and their fusion on several ML-based classifiers before feature selection have been shown in Supplementary Table 1 in Supplementary file 1. Supplementary Fig. 1 in Supplementary file 1 and Fig. 4 show the feature distribution of single-encoding features and fusion features before and after feature screening using t-SNE (t-distributed stochastic neighbor embedding) technique. The AUCs of single-encoding models are 0.928, 0.938, 0.886, 0.889, 0.876 and 0.939 for AAC, CKSAAP, CTD, GD, NMBroto and PseAAC, respectively. The AUC of PseAAC is 0.1%–6.3% higher than that of other encoding schemes. On the other hand, the Acc, Sp, Sn, MCC, and AUC of the feature fusion-based model are 95.03%, 94.00%, 96.20%, 0.901% and 0.987, respectively. The Acc, Sp, Sn, MCC, and AUC on independent data set are 89.90%, 92.66%, 91.73%, 0.868% and 0.956. The AUCs of the feature fusion-based model on training and independent datasets have been shown in Fig. 3G,H.
| Classifiers | Support Vector Machine | Random Forest | Naïve Bayes | Ada Boost | ||||||||||||||||
| Method | Acc | Sp | Sn | MCC | AUC | Acc | Sp | Sn | MCC | AUC | Acc | Sp | Sn | MCC | AUC | Acc | Sp | Sn | MCC | AUC |
| AAC | 62.11 | 74.70 | 79.60 | 0.520 | 0.827 | 84.25 | 84.68 | 87.36 | 0.703 | 0.928 | 76.54 | 77.00 | 74.10 | 0.681 | 0.894 | 73.43 | 74.70 | 79.60 | 0.672 | 0.871 |
| CKSAAP | 66.77 | 65.56 | 84.55 | 0.245 | 0.743 | 86.79 | 84.82 | 90.77 | 0.723 | 0.938 | 87.46 | 88.11 | 89.55 | 0.743 | 0.922 | 88.73 | 89.20 | 90.30 | 0.867 | 0.948 |
| CTD | 63.13 | 78.10 | 74.55 | 0.541 | 0.778 | 81.32 | 77.55 | 88.78 | 0.712 | 0.886 | 73.87 | 68.00 | 83.80 | 0.587 | 0.843 | 74.14 | 73.50 | 79.50 | 0.611 | 0.873 |
| Geary | 74.02 | 77.30 | 81.40 | 0.576 | 0.854 | 85.93 | 83.14 | 88.28 | 0.745 | 0.889 | 86.09 | 84.52 | 89.33 | 0.756 | 0.889 | 73.49 | 70.10 | 68.90 | 0.573 | 0.791 |
| NMBroto | 79.38 | 80.60 | 82.00 | 0.623 | 0.890 | 85.38 | 80.50 | 76.60 | 0.735 | 0.876 | 74.48 | 81.60 | 77.20 | 0.600 | 0.877 | 82.81 | 80.20 | 79.88 | 0.705 | 0.862 |
| PseAAC | 86.81 | 83.70 | 88.88 | 0.725 | 0.862 | 88.90 | 83.10 | 91.80 | 0.741 | 0.939 | 78.12 | 78.20 | 88.00 | 0.621 | 0.884 | 89.64 | 84.55 | 87.11 | 0.762 | 0.905 |
| Fusion | 88.71 | 94.00 | 92.00 | 0.862 | 0.971 | 95.03 | 94.00 | 96.20 | 0.901 | 0.987 | 90.85 | 88.90 | 89.70 | 0.772 | 0.936 | 92.78 | 90.10 | 90.50 | 0.873 | 0.968 |
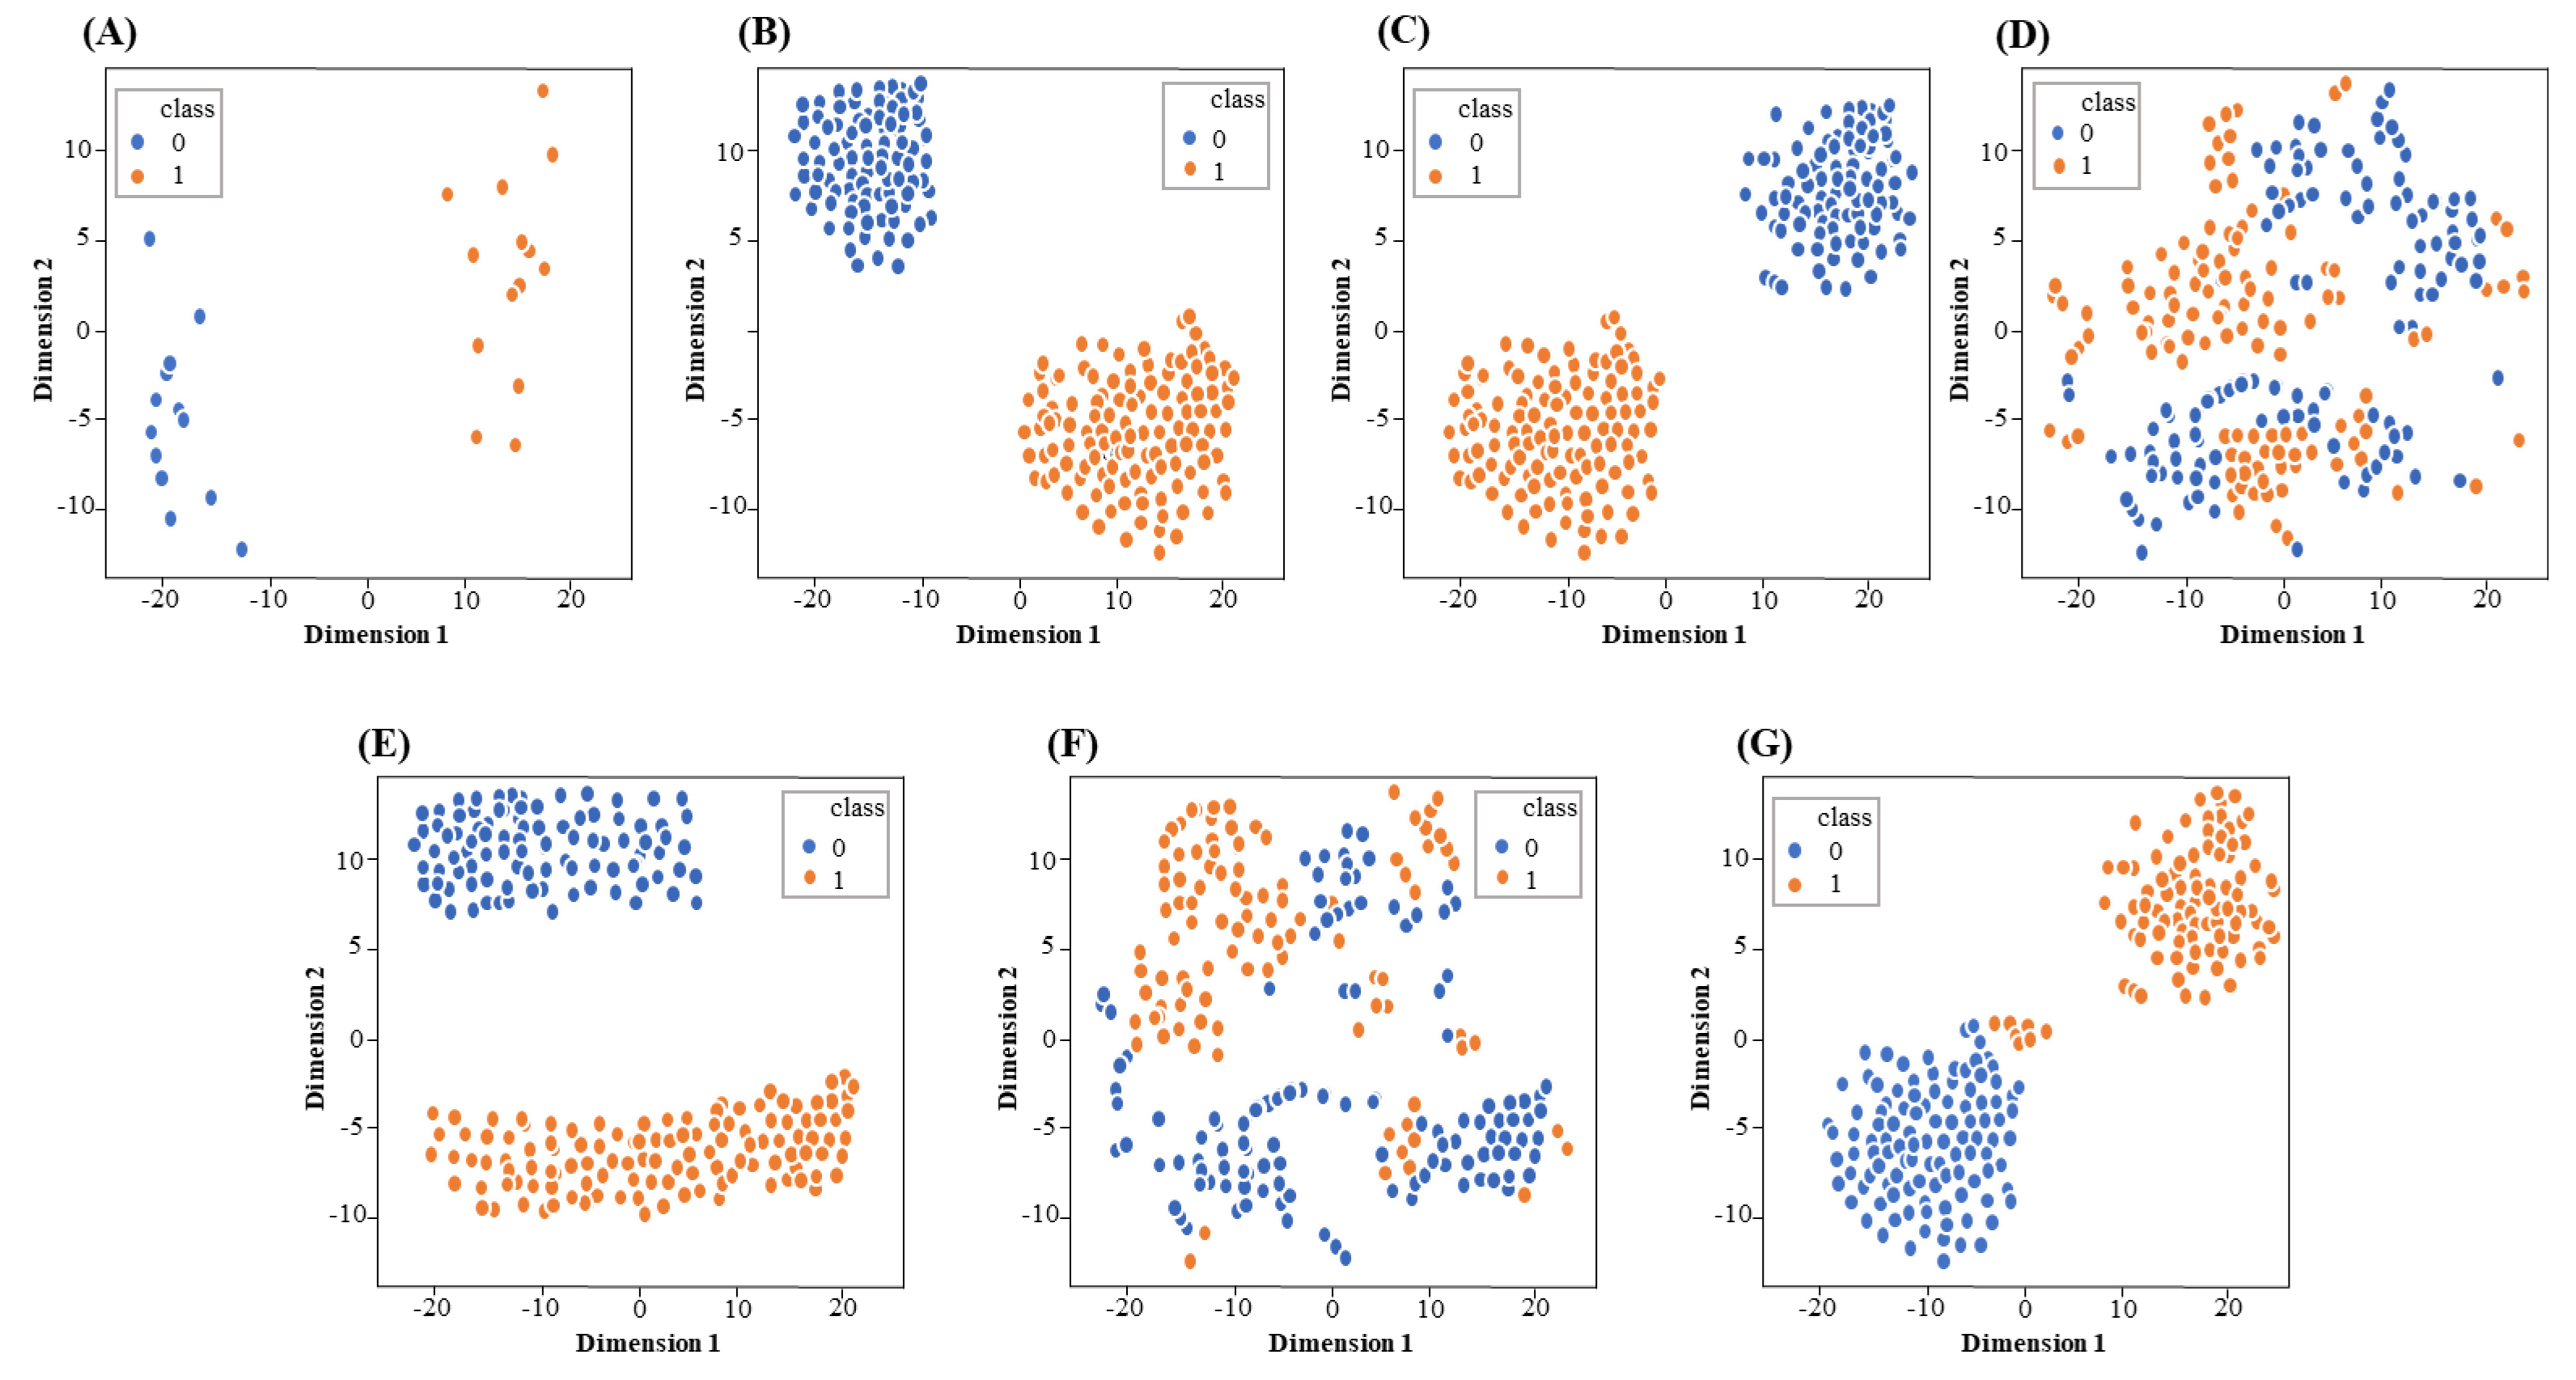 Fig. 4.
The visualization of single encoding features and fusion feature through t-SNE. (A) AAC, (B) CKSAAP, (C) PseAAC, (D) CTD, (E) GD, (F) NMBroto and (G) fusion feature. Orange and blue represent lipocalins and non-lipocalins, respectively.
In order to compare a variety of machine learning models, we input single-encoding features and their fusion into other machine learning methods, such as AB, NB and SVM. The 10-fold cross-validation test was used to estimate the efficiency of these models. The comparison results have been shown in Table 2. We noticed that the accuracies of feature-fusion models were higher than those of single-encoding models, demonstrating that a large amount of information can achieve better results. Fig. 3C shows the contribution of the feature descriptors in RF-based fusion model. The model based on the optimal fusion features consists of 117 features from six descriptors, AAC, CKSAAP, CTD, GD, NMBroto and PseAAC, contributed 9 %, 11%, 13%, 15% and 27% in the final optimized-fusion model, respectively. Fig. 3F displays that the RF-based prediction model performs best among all classifiers. The AUC of the RF-based model is 1.6%–5.1% higher than that of other classifiers, demonstrating that the RF-based model is suitable for lipocalin proteins prediction.
We also compared our model with the existing model on independent dataset to examine the efficiency and performance of the models. The results on independent dataset show that our model outperformed the existing model by 4.17%. The comparison between our model and the existed model has been shown in Table 3 (Ref. [17]).
| Method | Acc | MCC | Sn | Sp | AUC | Reference |
| Lipocalin-Pred | 85.73 | 0.776 | 88.41 | 90.11 | 0.922 | [17] |
| Lipo-RF | 89.90 | 0.868 | 91.73 | 92.66 | 0.956 | Our Study |
Lipocalin are responsible for transporting small hydrophobic molecules such as steroids, retinoids, and lipids. They have sequence homology region and common tertiary structure [92, 93]. Lipocalins have been applied in several fields, such as stress responses, homeostasis, candidate markers for kidney functions and allergic infections. So for, some models have been developed to identify lipocalins [17, 20]. In this work, we developed an advanced computational model to discriminate lipocalin proteins from non-lipocalin proteins. In the proposed model, protein sequences were encoded by six descriptors. Then, feature selection was performed to pick out the best features which could produce the maximum accuracy. On the basis of the best feature subset, the RF-based classifier can obtained the best prediction results. Further studies will focus on creating a user-friendly web server for the prediction model, and will adopt additional feature selection methods and algorithms to further improve the efficiency of lipocalin recognition.
The codes and data can be found in https://zenodo.org/record/5844993#.YeAL7fgRVPZ.
HZ—Conceptualization, Methodology, Coding, Data curation, Visualization, Writing-Original draft preparation. RSK—Data curation, Methodology. CYM—Data curation, Methodology. ZA—Data curation. BKGM—Data curation. XLY—Reviewing and Editing. ZYZ—Reviewing, Editing and Supervision.
Not applicable.
We are very thankful to Hao Lin Center for Informational Biology, University of Electronic Science and Technology of China for their constructive suggestions and support on this work.
This work has been supported by the grant from National Natural Science Foundation of China (62102067).
The authors declare no conflict of interest.