
- Academic Editor
Background: Clear cell renal cell carcinoma (ccRCC) is a common and lethal urological malignancy for which there are no effective personalized therapeutic strategies. Programmed cell death (PCD) patterns have emerged as critical determinants of clinical prognosis and immunotherapy responses. However, the actual clinical relevance of PCD processes in ccRCC is still poorly understood. Methods: We screened for PCD-related gene pairs through single-sample gene set enrichment analysis (ssGSEA), consensus cluster analysis, and univariate Cox regression analysis. A novel machine learning framework incorporating 12 algorithms and 113 unique combinations were used to develop the cell death-related gene pair score (CDRGPS). Additionally, a radiomic score (Rad_Score) derived from computed tomography (CT) image features was used to classify the CDRGPS status as high or low. Finally, we conclusively verified the function of PRSS23 in ccRCC. Results: The CDRGPS was developed through an integrated machine learning approach that leveraged 113 algorithm combinations. CDRGPS represents an independent prognostic biomarker for overall survival and demonstrated consistent performance between training and external validation cohorts. Moreover, CDRGPS showed better prognostic accuracy compared to seven previously published cell death-related signatures. In addition, patients classified as high-risk by CDRGPS exhibited increased responsiveness to tyrosine kinase inhibitors (TKIs), mammalian Target of Rapamycin (mTOR) inhibitors, and immunotherapy. The Rad_Score demonstrated excellent discrimination for predicting high versus low CDRGPS status, with an area under the curve (AUC) value of 0.813 in the Cancer Imaging Archive (TCIA) database. PRSS23 was identified as a significant factor in the metastasis and immune response of ccRCC, thereby validating experimental in vitro results. Conclusions: CDRGPS is a robust and non-invasive tool that has the potential to improve clinical outcomes and enable personalized medicine in ccRCC patients.
Renal cell carcinoma (RCC) is among the top ten most commonly diagnosed cancers globally, with clear cell RCC (ccRCC) being the predominant histological subtype and accounting for approximately 70% of RCC cases [1].
The global incidence of ccRCC is increasing and this subtype has the worst prognosis of all RCC variants, with the highest rates of invasion, metastasis, and mortality [2]. In recent surveillance work, 73,820 new cases of ccRCC were diagnosed in the United States in 2019 and 14,770 deaths reported [1]. Tumor, Node, Metastasis (TNM) stage continues to be the most pertinent prognostic indicator for ccRCC in clinical practice. However, the prognostic accuracy of TNM is less than ideal, with substantial variation in survival between individuals with identical TNM stage [3]. ccRCC also exhibits lower responsiveness to radiotherapy and chemotherapy modalities compared to other RCC subtypes. Although immune checkpoint inhibitor (ICI) therapy has emerged as the standard immunotherapeutic approach for advanced RCC, only a small proportion of patients show meaningful and long-lasting benefits. The expression of programmed death ligand 1 (PD-L1), tumor mutation burden (TMB), neoantigen load (NAL), and mismatch repair deficiency (dMMR, or microsatellite instability-high [MSI-H]) are potential biomarkers of sensitivity to ICI therapy. However, these techniques are limited by issues such as spatial and temporal heterogeneity, poor precision, and the presence of minor cell subpopulations [4, 5, 6]. To achieve tailored treatment plans for ccRCC, it is therefore important to develop effective models that can improve the accuracy of prognosis and the selection of patients for immunotherapy.
Programmed cell death (PCD) is intrinsically linked to both tumorigenesis and therapeutic efficacy. Tumors undergo diverse modes of cell death in response to varying environmental conditions [7]. The most recent guidelines put forth by the Nomenclature Committee on Cell Death (NCCD) define PCD as encompassing a spectrum of processes including apoptosis, necroptosis, ferroptosis, pyroptosis, netotic cell death, entotic cell death, lysosome-dependent cell death, parthanatos, autophagy-dependent cell death, oxeiptosis, and alkaliptosis. Apoptosis is a regulated process that removes injured or surplus cells in an orderly manner without triggering inflammation. It involves condensation, nuclear cleavage, and macrophage-mediated vesicle engulfment [8]. Autophagy-dependent cell death involves stepwise lysosomal degradation and is central to metabolic homeostasis and nutrient recycling [9]. Both apoptosis and autophagy have been implicated in mediating chemoresistance in glioblastoma [10]. Alkaliptosis is a recently described modality of PCD that is governed by intracellular alkalinization [11]. Cuproptosis represents a novel form of cell death that relies on mitochondrial respiration and proceeds through direct binding of copper to fatty acylated constituents of the tricarboxylic acid (TCA) cycle [12]. Recent studies have identified disulfidptosis as a novel PCD mechanism characterized by disulfide stress [13]. Entotic cell death represents a process of active cellular invasion that is restricted to viable cells and pericellular regions. This non-apoptotic pathway proceeds independently of apoptotic executioner activation [14]. Ferroptosis is defined by the iron-dependent accumulation of cytotoxic lipid peroxides to lethal concentrations. Suppression of ferroptosis has been found to confer resistance to PD-1/PD-L1 immune checkpoint blockade [15, 16]. Lysosome-dependent cell death proceeds through the activity of lysosomal hydrolases released into the cytosol subsequent to organelle membrane permeabilization [17]. The pivotal characteristic of necroptosis centers around the assembly of necrosomes and involves multifaceted progression [18]. Netotic cell death arises from the extrusion of neutrophil extracellular traps (NETs), which are reticulated chromatin structures deployed by granulocytes in response to infection or tissue damage [19]. Oxeiptosis harnesses the reactive oxygen species-sensing capability of KEAP1 to execute a distinct cell death program. It represents a novel cellular pathway that is likely to intersect with other modes of regulated cell death [20]. Parthanatos represents a specialized form of regulated cell death mediated by the overactivation of PARP-1 nuclease [21]. Pyroptosis is characterized by cell swelling, lysis, and the copious release of proinflammatory mediators [22]. It has been implicated in the translocation of programmed cell death ligand 1 (PD-L1) and the therapeutic response to PD-1 checkpoint blockade [23]. In summary, it has been established that PCD is a critical determinant of tumorigenesis and metastasis [18].
The generation of PCD-associated genetic signatures to categorize patients into discrete risk strata has been proposed to improve the accuracy of prognostic modeling [24]. However, prior efforts at generating quantitative models have been hampered by biological noise and technical biases. An alternative approach based on relative gene expression to generate gene pair (GP) signatures may be worthwhile since it eliminates the requirement for data standardization, thus allowing the development of reliable models [25]. However, this approach is constrained by necessary intrusive procedures and excessive cost to the patient. A potentially non-invasive alternative is the application of radiomics, which makes use of the quantitative characteristics of medical imaging [26, 27].
The aim of this study was to identify PCD-associated gene pairs which can predict the prognosis and outcome of immunotherapy in ccRCC patients through a novel computational framework. Additionally, we investigated associations between radiomic features extracted from contrast-enhanced computed tomography (CT) and the cell death-related gene pair score (CDRGPS). Transcriptomic and clinical data for ccRCC patients were obtained from The Cancer Genome Atlas (TCGA-KIRC) database and ArrayExpress (E-MTAB-1980). These were used as discovery and validation cohorts, respectively. Cell death-related gene pairs were identified through single sample gene set enrichment analysis (ssGSEA), consensus clustering, and univariate Cox regression. A machine learning framework incorporating 12 algorithms and 113 combinations was used to develop the CDRGPS. The prognostic utility of CDRGPS was evaluated and incorporated into a nomogram. CDRGPS was applied in single-cell analysis to assess biological differences between high- and low-risk subgroups. We also examined the prediction of drug response and efficacy of immunotherapy. In addition, a radiomic score (Rad_Score) was derived from the CT imaging-quantified CDRGPS status. Finally, the role of PRSS23 in ccRCC was investigated (Fig. 1).
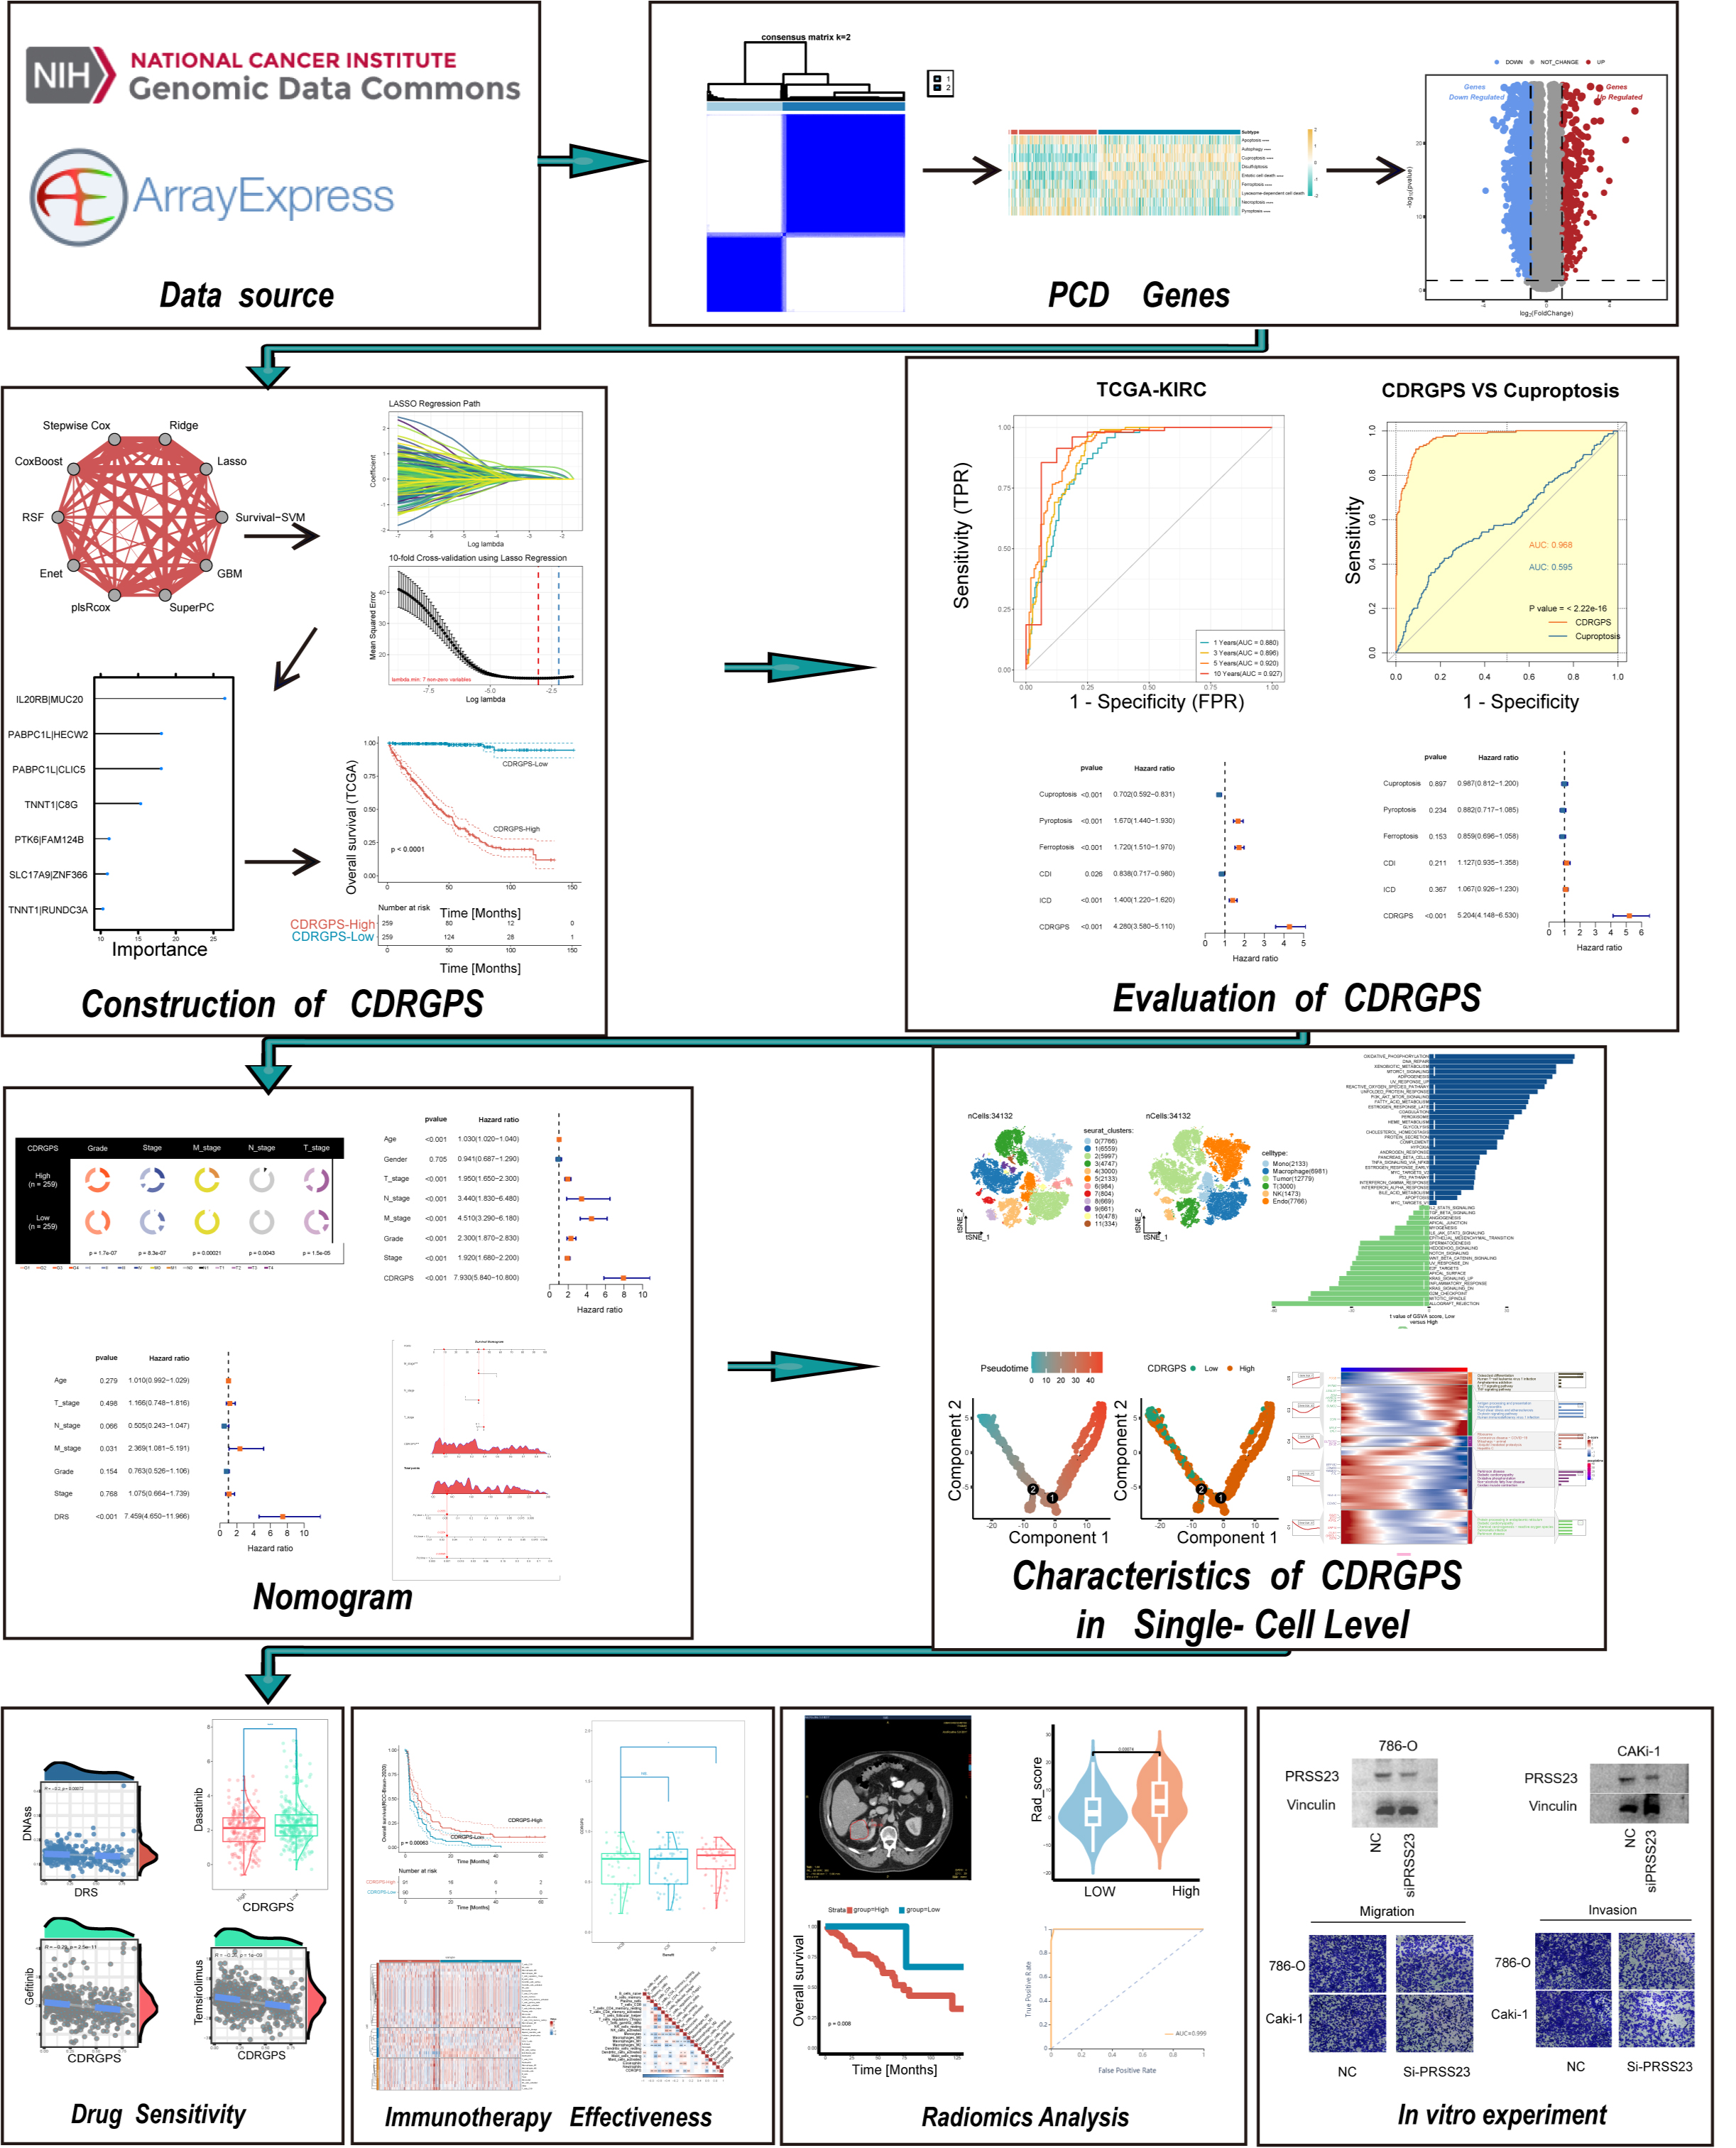 Fig. 1.
Flowchart for this study. PCD, programmed cell death; CDRGPS, cell death-related gene pair score; TCGA-KIRC, The Cancer Genome Atlas - Kidney Renal Clear Cell Carcinoma.
RNA sequencing (RNA-seq) data and corresponding clinical data for ccRCC were obtained from The Cancer Genome Atlas (TCGA) (https://cancergenome.nih.gov) cohort. After excluding samples with incomplete or absent essential clinicopathological annotations, the final TCGA-Kidney Renal Clear Cell Carcinoma (KIRC) cohort comprised 518 patients. An additional validation cohort of 101 ccRCC patients with gene expression microarray data and clinical details was sourced from the E-MTAB-1980 dataset in the ArrayExpress (https://www.ebi.ac.uk/biostudies/arrayexpress) repository [28].
PCD-associated genes were selected from Kyoto Encyclopedia of Genes and Genomes (KEGG) databases, Gene Set Enrichment Analysis (GSEA) gene sets, and published reviews [29, 30]. Specifically, a total of 580 apoptosis genes, 52 pyroptosis genes, 87 ferroptosis genes, 367 autophagy genes, 15 entotic cell death genes, 101 autophagy genes, 14 cuproptosis genes, 9 parthanatos genes, 8 netotic cell death genes, 7 alkaliptosis genes, 220 lysosome-dependent cell death genes, 15 disulfidptosis genes, and 5 oxeiptosis genes were compiled (Supplementary Table 1).
To quantify PCD pathway activity in each sample, ssGSEA was conducted using the GSVA R package 1.44.5 with gene expression profiles. The ssGSEA scores were then utilized to perform unsupervised consensus clustering with the ConsensusClusterPlus R package 1.60.0 (1000 iterations, 80% resampling rate, Spearman correlation) to categorize ccRCC into distinct PCD subclusters.
Differentially expressed genes (DEGs) between the two PCD subclusters were
identified using the DESeq2 R package 1.42.0. Univariate Cox regression analysis
was then performed to identify DEGs that were significantly correlated with
overall survival (OS) in both the training and test cohorts (p
Based on the model generated above, a score was determined for each sample in the training and test datasets. Using the median value as the cutoff point, patients were then divided into CDRGPS-high and -low groups. The “survminer” R package 0.4.9 and Kaplan-Meier (KM) analysis were used to compare the two groups in terms of OS, progression-free survival (PFS), disease-free survival (DFS), and disease-specific survival (DSS). Furthermore, the “timeROC” package 0.4 was employed to perform receiver operating characteristic (ROC) analysis for evaluating the sensitivity and specificity of CDRGPS in predicting the OS of ccRCC patients in the training and test cohorts. Additionally, the area under the curve (AUC) of CDRGPS was compared to that of other PCD-related signatures. Univariate and multivariate Cox regression analyses were also performed to determine whether CDRGPS was an independent prognostic factor for ccRCC patients. To improve the prognostic accuracy of CDRGPS, a nomogram was constructed using the “rms” package. This nomogram integrated CDRGPS and clinical characteristics, allowing quantification of the survival outcomes of ccRCC patients. The timeROC curve, calibration curves, and decision curve analysis (DCA) were used to thoroughly assess the performance of the nomogram.
Single-cell RNA sequencing (scRNA-seq) data was obtained from 7 ccRCC samples in the GSE156632 collection [32]. Cell clustering and dimension reduction were performed using the Seurat package [33]. Principal component analysis (PCA) was performed using “RunPCA”. A K-nearest neighbor analysis was then conducted using the “FindNeighbors” function. Complex expression profiles were visually represented by downscaling and facilitated by the “RunTSNE” function. This was followed by cell annotation based on marker genes associated with various cell types. Finally, pseudotime analysis was conducted using the monocle R package 2.26.0.
Based on prior research, we derived six tumor stemness indices using messenger ribonucleic acid (mRNA) expression and methylation signatures: RNA expression-based stemness score (RNAss), Epigenetically regulated RNA expression-based stemness score (EREG.EXPss), DNA methylation-based stemness score (DNAss), Epigenetically regulated DNA methylation-based stemness score (EREG-METHss), Differentially methylated probes-based stemness score (DMPss), and Enhancer Elements/DNAmethylation-based stemness score (ENHss) [34]. With regard to personalized treatment, the pRRophetic R package 0.5 [35] was used to predict the half-maximal inhibitory concentration (IC50) of chemotherapy drugs that are commonly administered to ccRCC patients. This was based on their distinct CDRGPS level.
To quantify immune infiltrating cells and the ESTIMATE score, we utilized CIBERSORT [36], MCPcounter (Microenvironment Cell Populations-counter) [37], the QUANTISEQ algorithm [38], and the ESTIMATE (Estimation of Stromal and Immune cells in Malignant Tumors using Expression data) algorithm [39]. Additionally, we used data from ssGSEA to compute the cancer immunity cycle, which reflects the functionality of chemokines and immunomodulators [40]. Furthermore, to explore the predictive ability of CDRGPS for immunotherapy, we used data from the RCC-Braun_2020 cohort consisting of 181 ccRCC patients treated with nivolumab, of which 57 showed clinical benefit, 57 showed intermediate clinical benefit, and 67 showed no clinical benefit [41].
Preoperative CT scans for 267 samples and stored in The Cancer Imaging
Archive (TCIA) were used to extract radiomics features for use in model building [42].
The volume of interest (VOI) for tumor segmentation was performed manually using
the 3D Slicer program (http://www.itksnap.org/pmwiki/pmwiki.php). The entire
tumor was manually segmented for each axial slice by two radiologists, both with
Human renal cell carcinoma cell lines 786-O and CAKi-1 obtained from the
American Type Culture Collection were cultured under standard conditions in a
humidified incubator at 37 °C and 5% CO
The 786-O and CAKi-1 cells were rinsed twice using chilled Phosphate-Buffered Saline (PBS) and lysed on ice by the addition of 250 µL lysis buffer. They were then centrifuged for 15 minutes at 14,000 rpm and 4 °C, and the debris removed. The combined protein was heated at 100 °C for 10 minutes. Equal amounts of protein samples were resolved by sodium dodecyl sulfate-polyacrylamide gel electrophoresis (SDS-PAGE) using a 10% polyacrylamide gel under a constant voltage of 120 V. The separated proteins were subsequently transferred to polyvinylidene difluoride (PVDF) membranes. These were blocked with 5% non-fat dry milk in Tris-buffered saline containing 0.1% Tween-20 (TBST) for 60 minutes at room temperature. This was followed by overnight incubation at 4 °C with primary antibodies against PRSS23 (Abcam, Cambridge, UK, ab201182) and vinculin (Abcam, ab129002). After washing with TBST, the membranes were incubated with appropriate horseradish peroxidase-conjugated secondary antibodies for 60 minutes at room temperature. The immunoreactive bands were visualized using enhanced chemiluminescence reagents after further washing with TBST. Analysis of band densitometry was performed using Image Lab software and ImageJ to determine relative protein expression levels. These were normalized to the vinculin loading control.
Cell migration and invasion assays were performed using 24-well Transwell
chambers containing 8 µm pore size polycarbonate membrane inserts (Thermo
Fisher, Waltham, MA, USA). For invasion assays, the upper surface of the
Transwell inserts was precoated with 100 µL of Matrigel basement membrane
matrix (BD Biosciences, Franklin Lakes, NJ, USA) and incubated overnight at 4 °C to allow
gelling. Cells were harvested and resuspended at a density of 3
The statistical analysis software R 4.2.1 (The R Foundation for Statistical
Computing, Vienna, Austria) was used for all analyses. The Wilcoxon test was used
for non-parametric comparisons between two variables with non-normal
distributions. Kaplan-Meier survival analysis and the log-rank test were used to
compare OS, DFS, PFS, and DSS between subgroups. This was carried out using the
survival R package 3.5-5. Univariate and multivariate Cox regression analyses
were conducted to identify independent prognostic variables. Model performance
was evaluated using ROC analysis, and the AUC was calculated using the R package
timeROC. Differences in clinical traits between two CDRGPS subclusters were
examined using the chi-squared test. p
The overall workflow for this study is outlined in Fig. 1. We utilized the
RNA-seq data of 13 PCD-related genes from 518 ccRCC patients in the TCGA to
perform ssGSEA and subsequently univariate Cox regression analysis. Nine of the
13 PCD patterns exhibited significant associations with the clinical outcome of
ccRCC (p
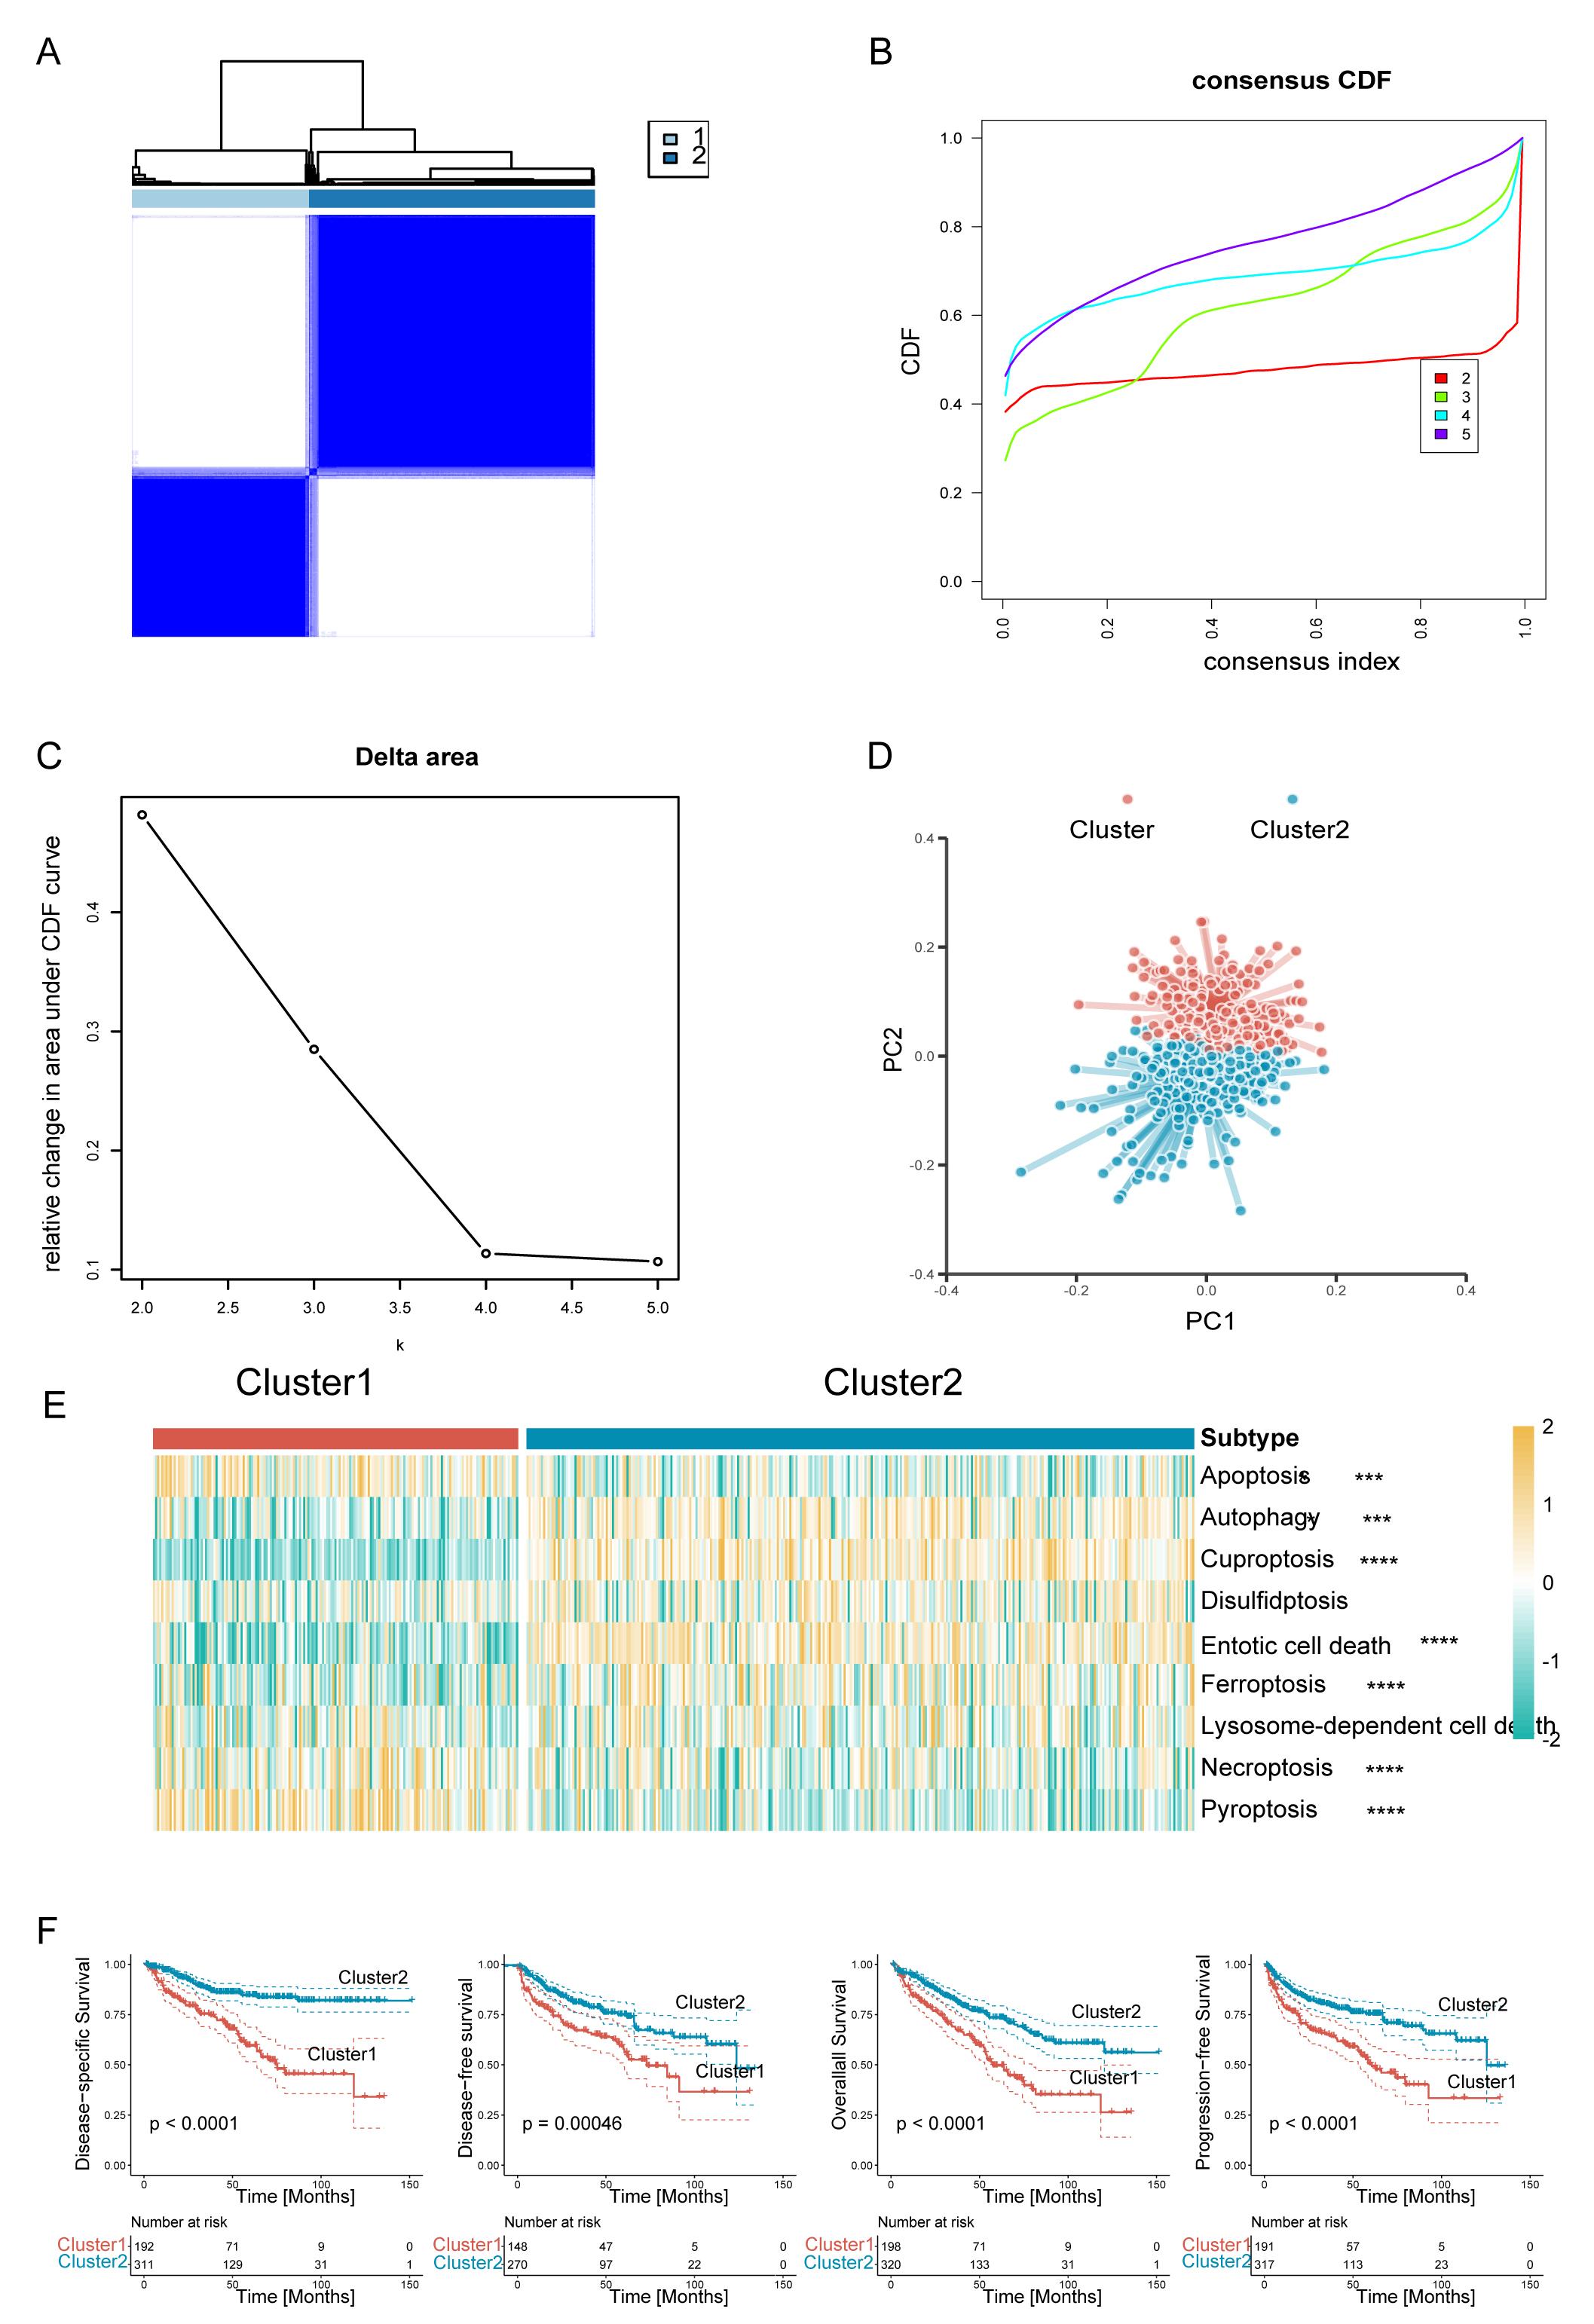 Fig. 2.
Clear cell renal cell carcinoma (ccRCC) was classified into two
programmed cell death (PCD) subclusters. (A) Consensus clustering matrix. (B)
Consensus clustering cumulative distribution function (CDF) curves. (C) Delta
area under CDF curves. (D) The principal component plot for the two clusters of
ccRCC. (E) Heatmaps of two ccRCC subclusters associated with PCD based on
single-sample gene set enrichment analysis (ssGSEA) scores. (F) Survival analysis
of the two subtypes in the TCGA-KIRC dataset. Disease-specific survival (DSS),
disease-free survival (DFS), overall survival (OS), and progression-free survival
(PFS) are shown. ****p
To further examine the transcriptional heterogeneity of PCD subpopulations in
ccRCC, differential analysis was conducted to contrast the two subclusters. A
total of 920 genes were found to display substantial variation in expression
level across the delineated groups (Supplementary Fig. 1A). Of these,
303 putative genes linked to PCD processes were identified as potential
predictors of OS, as revealed by univariate Cox regression analysis (p
A compendium of 12 distinct machine learning algorithms were synergistically
harnessed, comprising Lasso, Ridge, Stepglm, XGBoost, RF, Enet, partial least
squares regression for generalized linear models(plsRglm), GBM, NaiveBayes, LDA,
glmBoost and SVM. By employing a rigorous 10-fold cross-validation methodology,
these algorithms were strategically amalgamated to identify the most resilient
CDRGPS, as indicated by an elevated C-index performance metric. This iterative
process was meticulously performed with both the training dataset and an
independent external test dataset, as shown in Fig. 3A. Of the 113 models
examined, the five prediction models with the highest average C-index were
obtained exclusively using the RF algorithm. These five predictive models showed
good efficacy not only within the training dataset, but also with external
validation datasets, exhibiting a C-index greater than the 0.75 threshold.
Following an exhaustive screening process, the combined Lasso + RF configuration
emerged as a particularly discerning predictive model, characterized by excellent
accuracy with minimal variables. The final iteration of the CDRGPS was finally
derived through synergistic integration of the Lasso and RF algorithms. Of note,
the Lasso algorithm discerned a selection of seven pre-eminent cell death-related
gene pairs (Fig. 3B), while the RF algorithm identified the most robust
predictive model (Fig. 3C). A tailored risk score was calculated for each sample
in the training and test cohorts, thus allowing patients to be categorized into
CDRGPS-high or CDRGPS-low groups according to the median value. In both the
TCGA-KIRC and E-MTAB-1980 cohorts, patients in the CDRGPS-high group had
significantly worse OS than those in the CDRGPS-low group (p
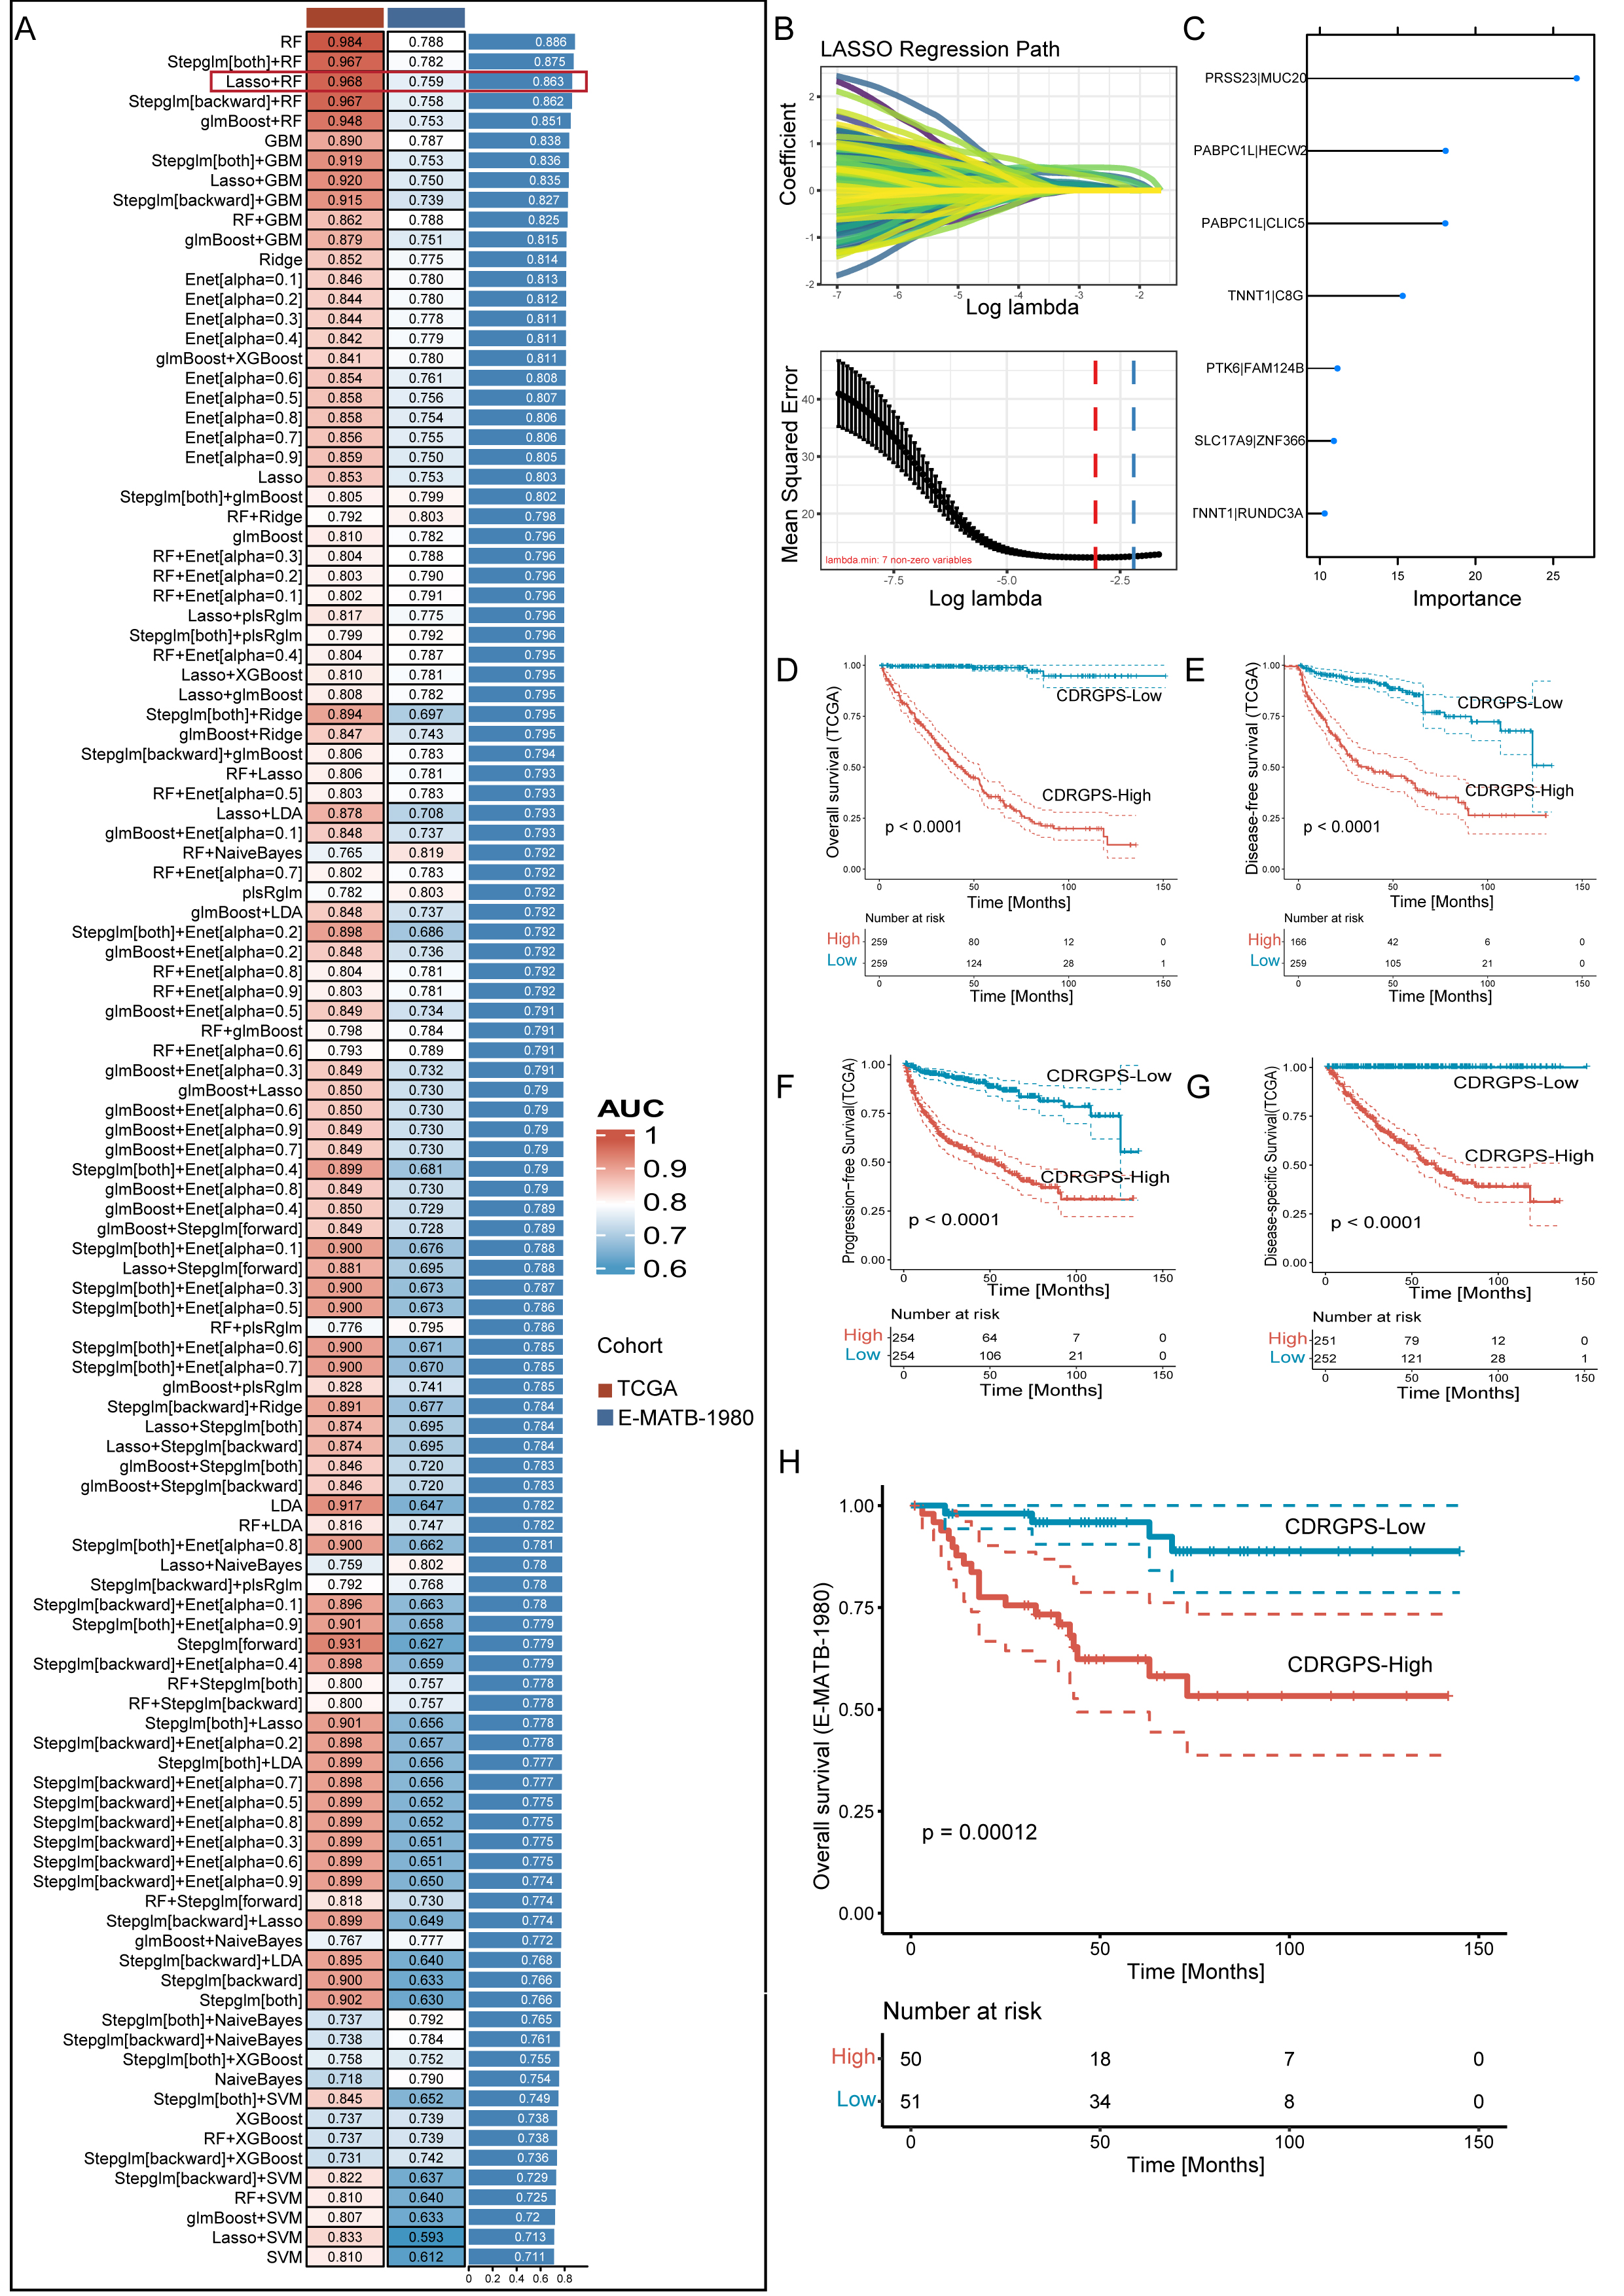 Fig. 3.
A consensus CDRGPS was created and confirmed using a machine
learning-based integrative process. (A) A total of 113 different predictive
models were generated using a 10-fold cross-validation framework. The C-index for
each model was then calculated across all datasets. (B) Visualization of Least Absolute Shrinkage and Selection Operator (LASSO)
regression in the training cohort. The optimal
The discriminative performance of the CDRGPS was assessed by ROC analysis. The 1-, 3-, 5- and 10-year AUCs were 0.880, 0.896, 0.920 and 0.927, respectively, in the TCGA-KIRC, and 0.776, 0.763, 0.797 and 0.701 in the E-MTAB-1980 dataset (Fig. 4A,B). These findings highlight the powerful discriminative ability of the CDRGPS. Recent developments in big data analytics and sequencing technology have enabled considerable progress in the development of prognostic and predictive gene expression signatures for various diseases through the application of machine learning techniques. We next evaluated the prognostic accuracy of the CDRGPS compared to five alternative cell death-related signatures. These alternative signatures are based on cuproptosis, ferroptosis, immunogenic cell death, pyroptosis, and a composite of 12 combined PCD models, with a particular focus on ccRCC patient outcomes [7, 30, 43, 44, 45, 46, 47]. Significantly higher AUCs in both the training and external test cohorts demonstrated better performance by the CDRGPS in predicting patient survival compared to the other five risk scores (Fig. 4C–I, Supplementary Fig. 2A–G). Moreover, we performed univariate and multivariate Cox regression analyses on both the training and test cohorts for each of the relevant signatures. In both cohorts, the CDRGPS model was the only independent predictor of ccRCC patient outcome (Fig. 4J,K; Supplementary Fig. 2H,I). This finding underscores the robustness and reliability of the CDRGPS.
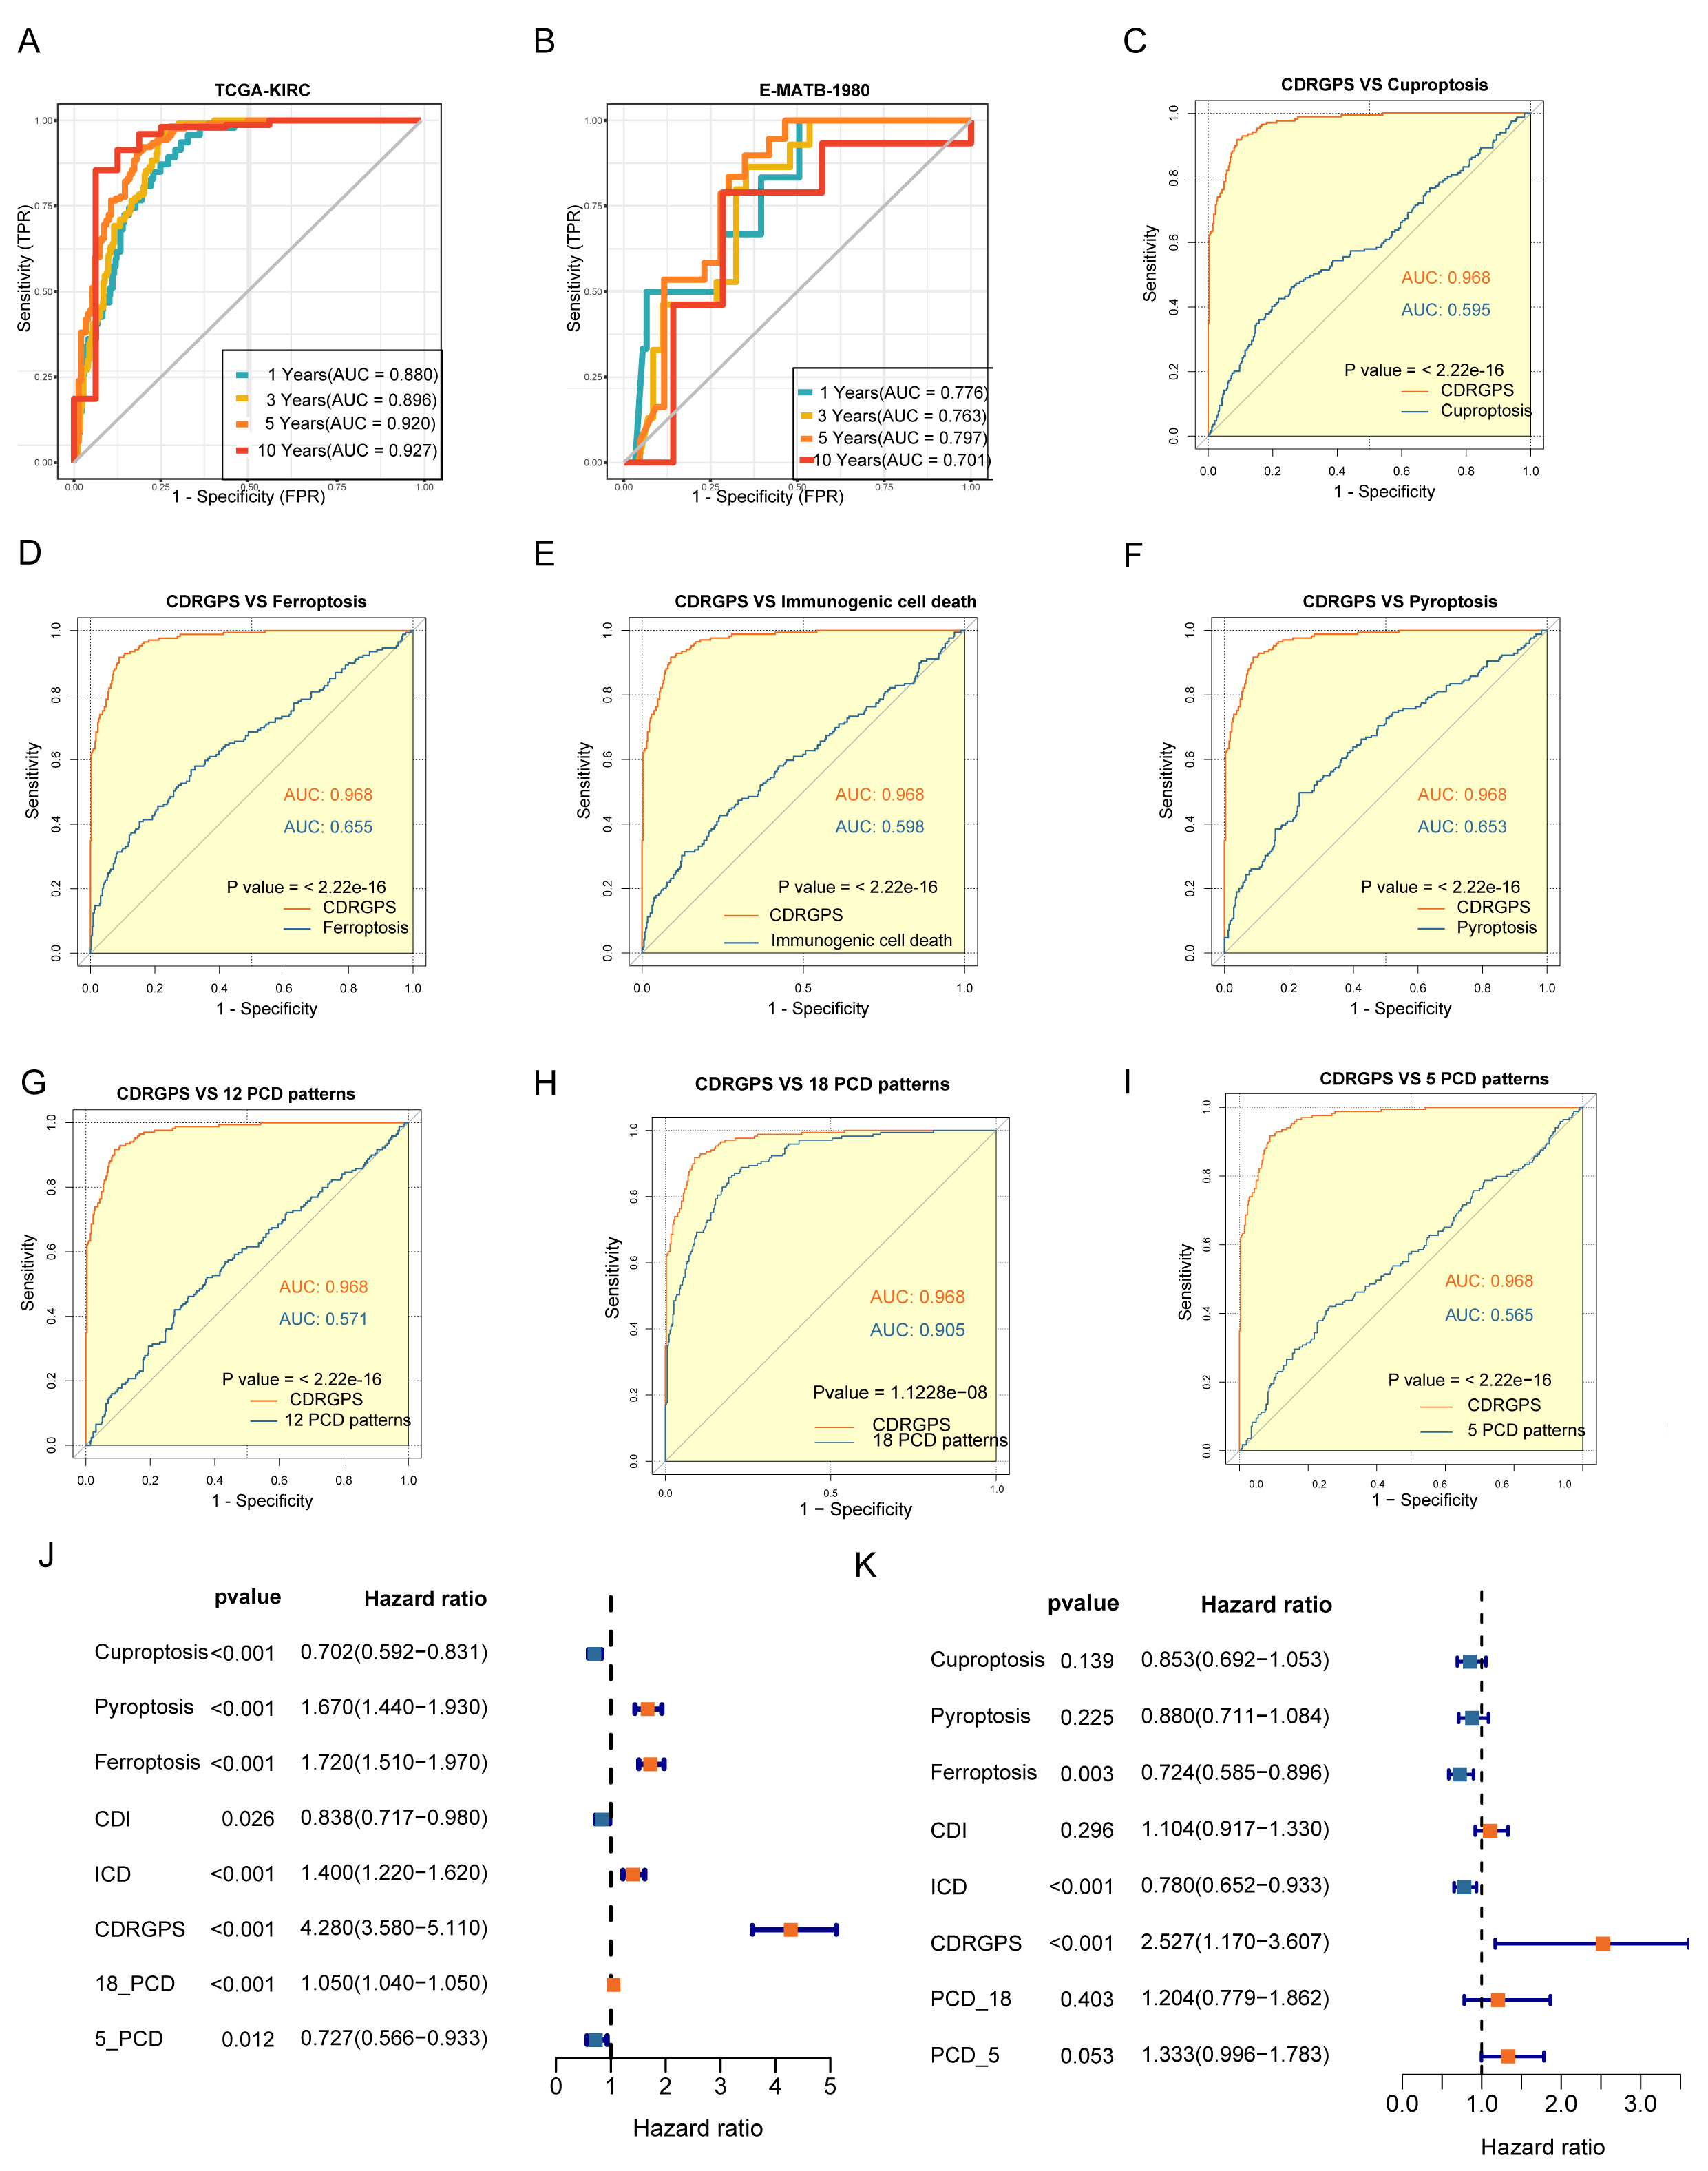 Fig. 4.
Evaluation of the CDRGPS model. (A,B) Time-dependent receiver operating characteristic (ROC) analysis for the prediction of OS at 1-, 3-, and 10-years in the training and test cohorts. (C–I) Area under curve (AUC) analysis of the CDRGPS and other PCD-related models in the training cohort. (J,K) Results of univariate and multivariate analyses of OS using the CDRGPS and other PCD-related models.
Given that clinical characteristics are routinely used to assess the prognosis
of ccRCC patients, we performed an in-depth investigation into the associations
between CDRGPS and various clinical parameters. Significant differences in grade,
stage and TNM status were found between the CDRGPS-high and -low groups in the
training cohort (p
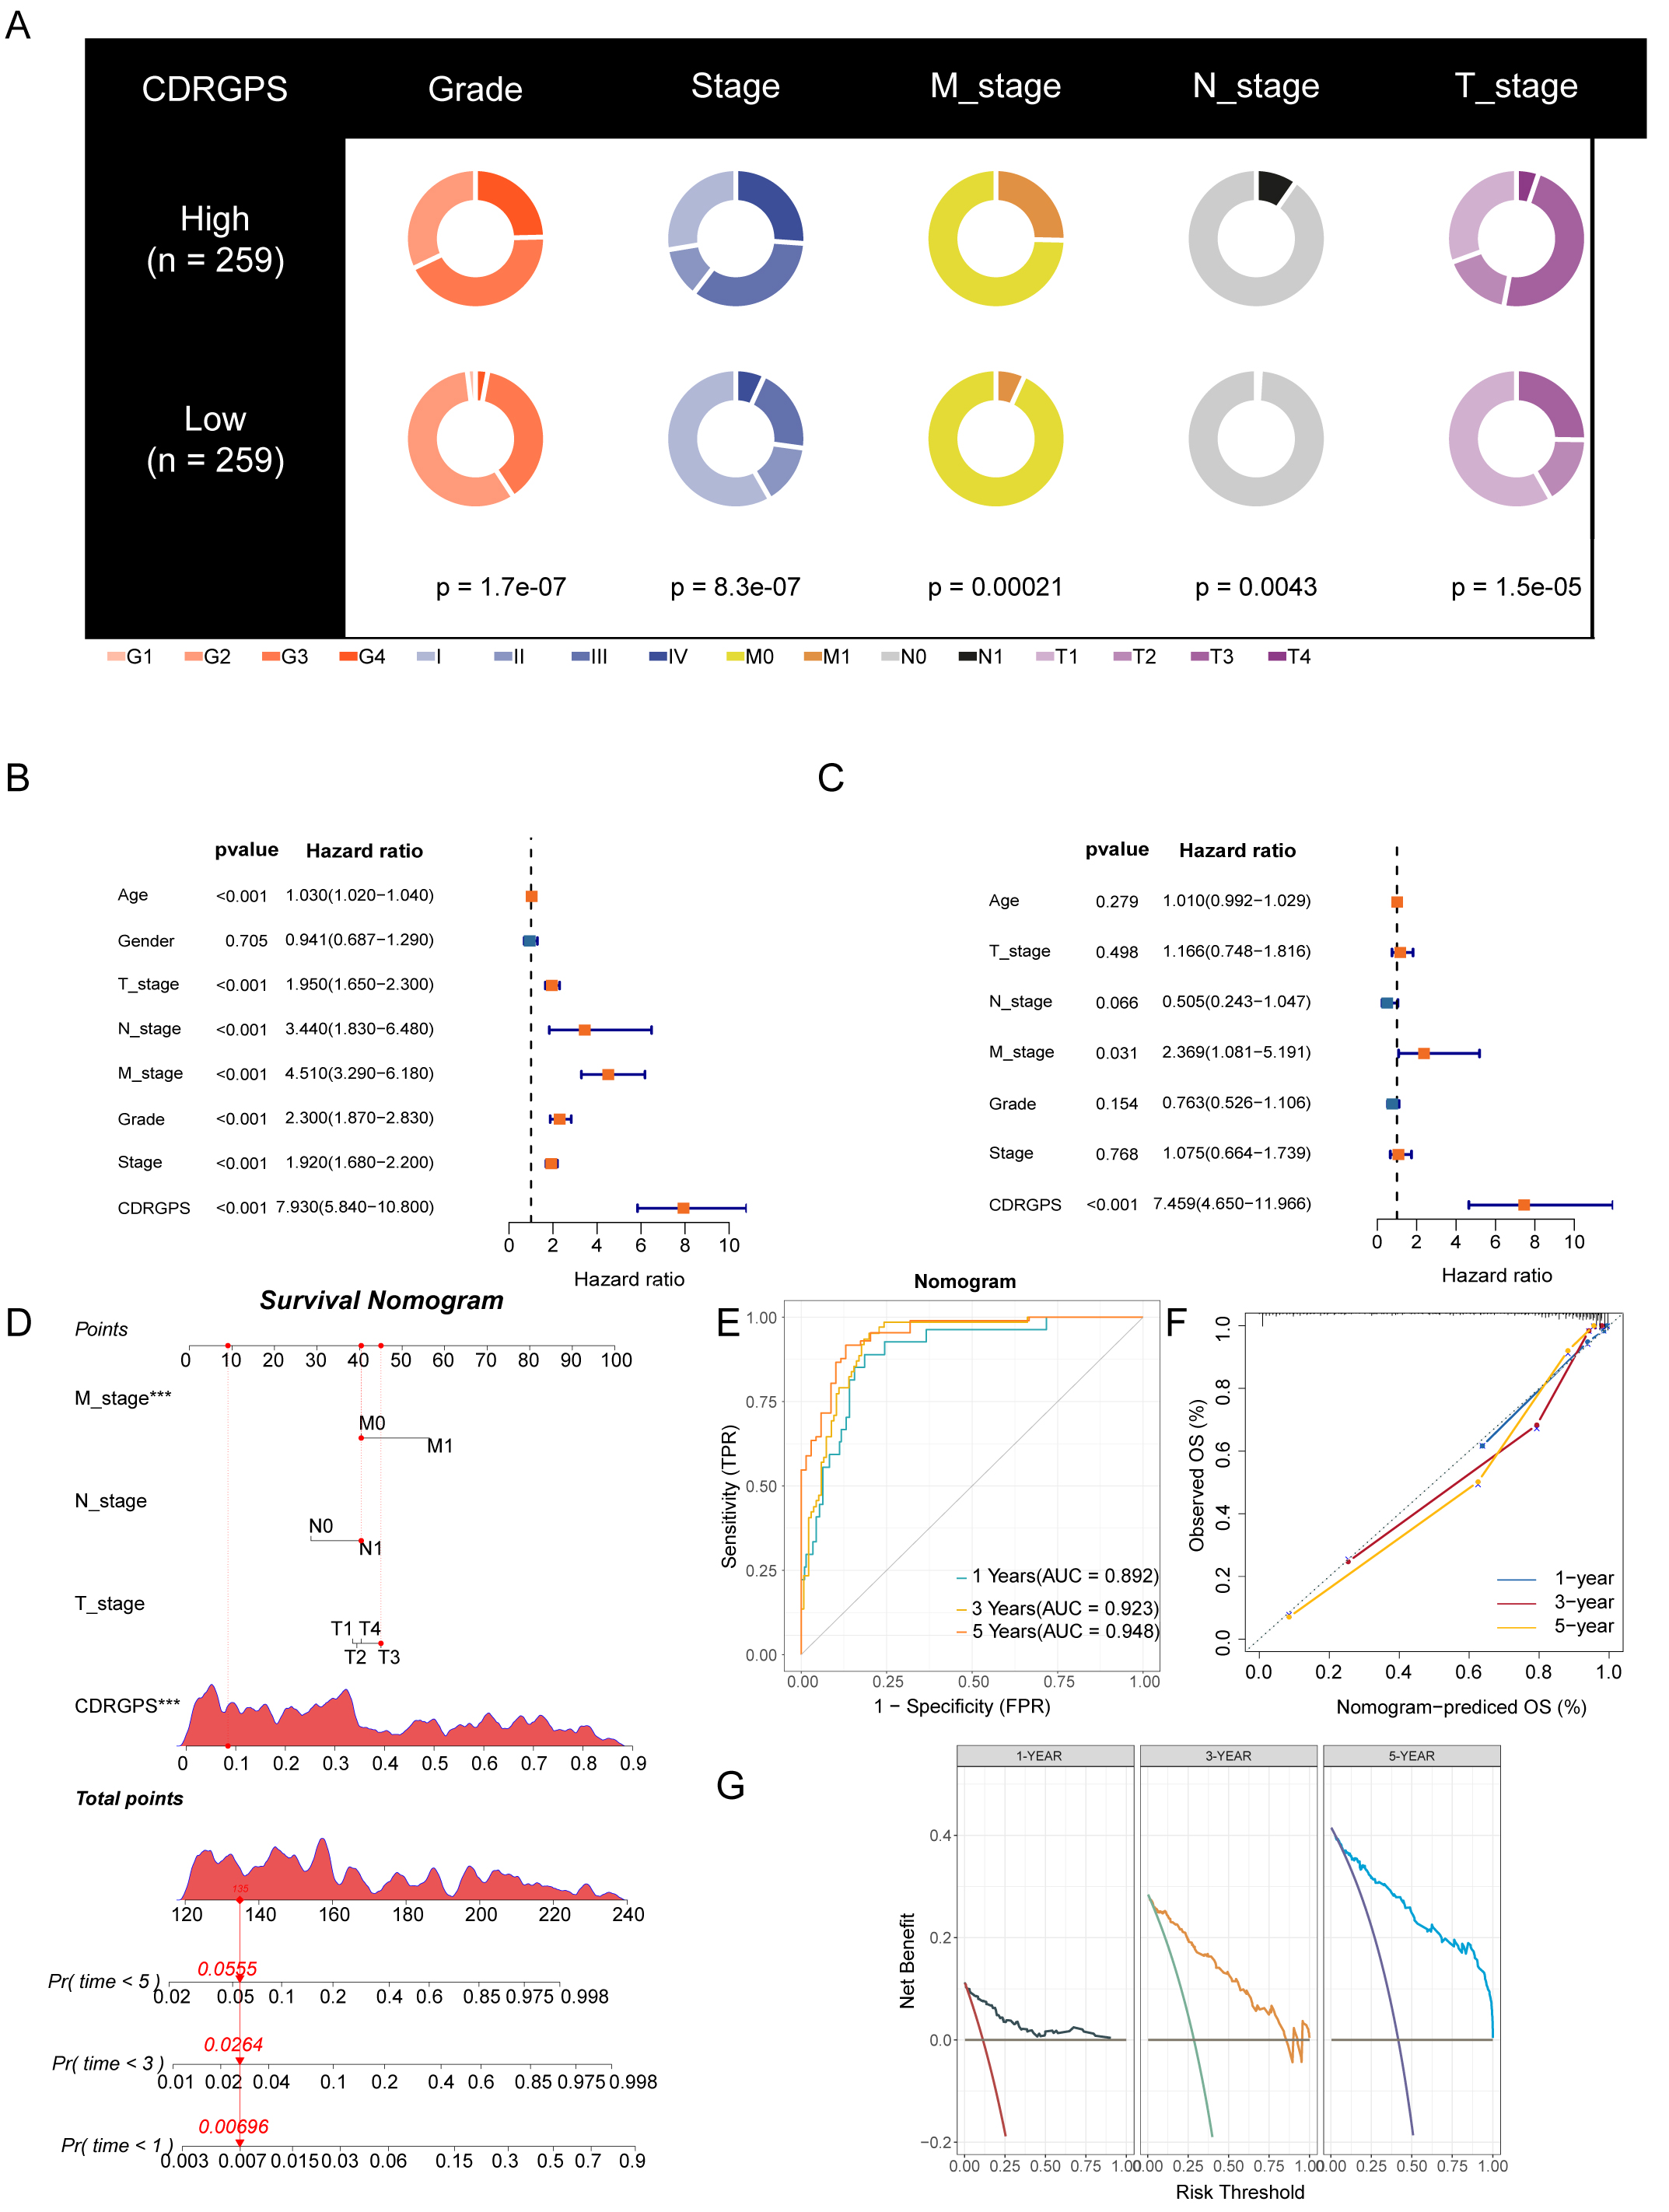 Fig. 5.
Development and validation of the nomogram. (A) Clinical traits
and their correlation with the CDRGPS-low and CDRGPS-high groups. (B,C) Results
of univariate and multivariate analysis for OS in relation to clinical traits and
CDRGPS in the TCGA-KIRC cohort. (D) The nomogram was constructed using the
CDRGPS, T_stage, N_stage, and M stage. (E) ROC curves demonstrating the ability
of the nomogram to predict outcomes at 1-, 3- and 5-years. (F) Nomogram
calibration curves for 1-, 3- and 5-year OS. (G) Decision curve analysis (DCA) demonstrating the net
benefit using the nomogram. ***p
Additional analyses were conducted using single-cell transcriptomic profiles from 7 ccRCC samples to determine if CDRGPS could distinguish discrete biological features at the single-cell level in ccRCC. After eliminating low-quality cells and carrying out normalization, integration and PCA, 11 clusters comprising 34,132 cells were identified (Fig. 6A). Six distinct cell types based on the marker genes were identified by subcluster annotation (Supplementary Table 3): B cells, endothelial cells, macrophages, monocytes, tumor cells, and T cells (Fig. 6B,C). Analysis of single-cell sequencing data using GSEA and GSVA revealed that tumor cells with high CDRGPS demonstrated a more robust regulation of tumor-related immunity, including pathways such as IMMUNE_RESPONSE, IL2_STAT5_SIGNALING, INTERFERON_GAMMA_RESPONSE, INTERFERON_ALPHA_RESPONSE, and the humoral immune response. Additionally, these cells displayed pronounced malignant biological characteristics, such as TGF_BETA_SIGNALING, PI3K_AKT_MTOR_SIGNALING, apoptosis, epithelial to mesenchymal transition, the tumor necrosis factor-mediated signaling pathway, and a greater response to hypoxia (Fig. 6D–H). We next used pseudo-time analysis to study correlations between CDRGPS and the developmental trajectory of malignant cells, given the diversity of cell developmental stages within tumor tissue. This investigation yielded a cell trace plot that effectively illustrates the fluctuations in CDRGPS across pseudo-time (Fig. 6I). Cells exhibiting an elevated CDRGPS were mostly clustered close to the terminus node of the branching tree, whereas those with lower CDRGPS values were primarily found in the root of the branch tree. Differential gene expression analysis was performed relative to pseudo-time progression. Heatmaps were generated to visualize changes in gene expression patterns aligned with increasing pseudo-time, and the corresponding increase in CDRGPS. Interestingly, the up-regulated genes mostly had immune response-related functions (Fig. 6J).
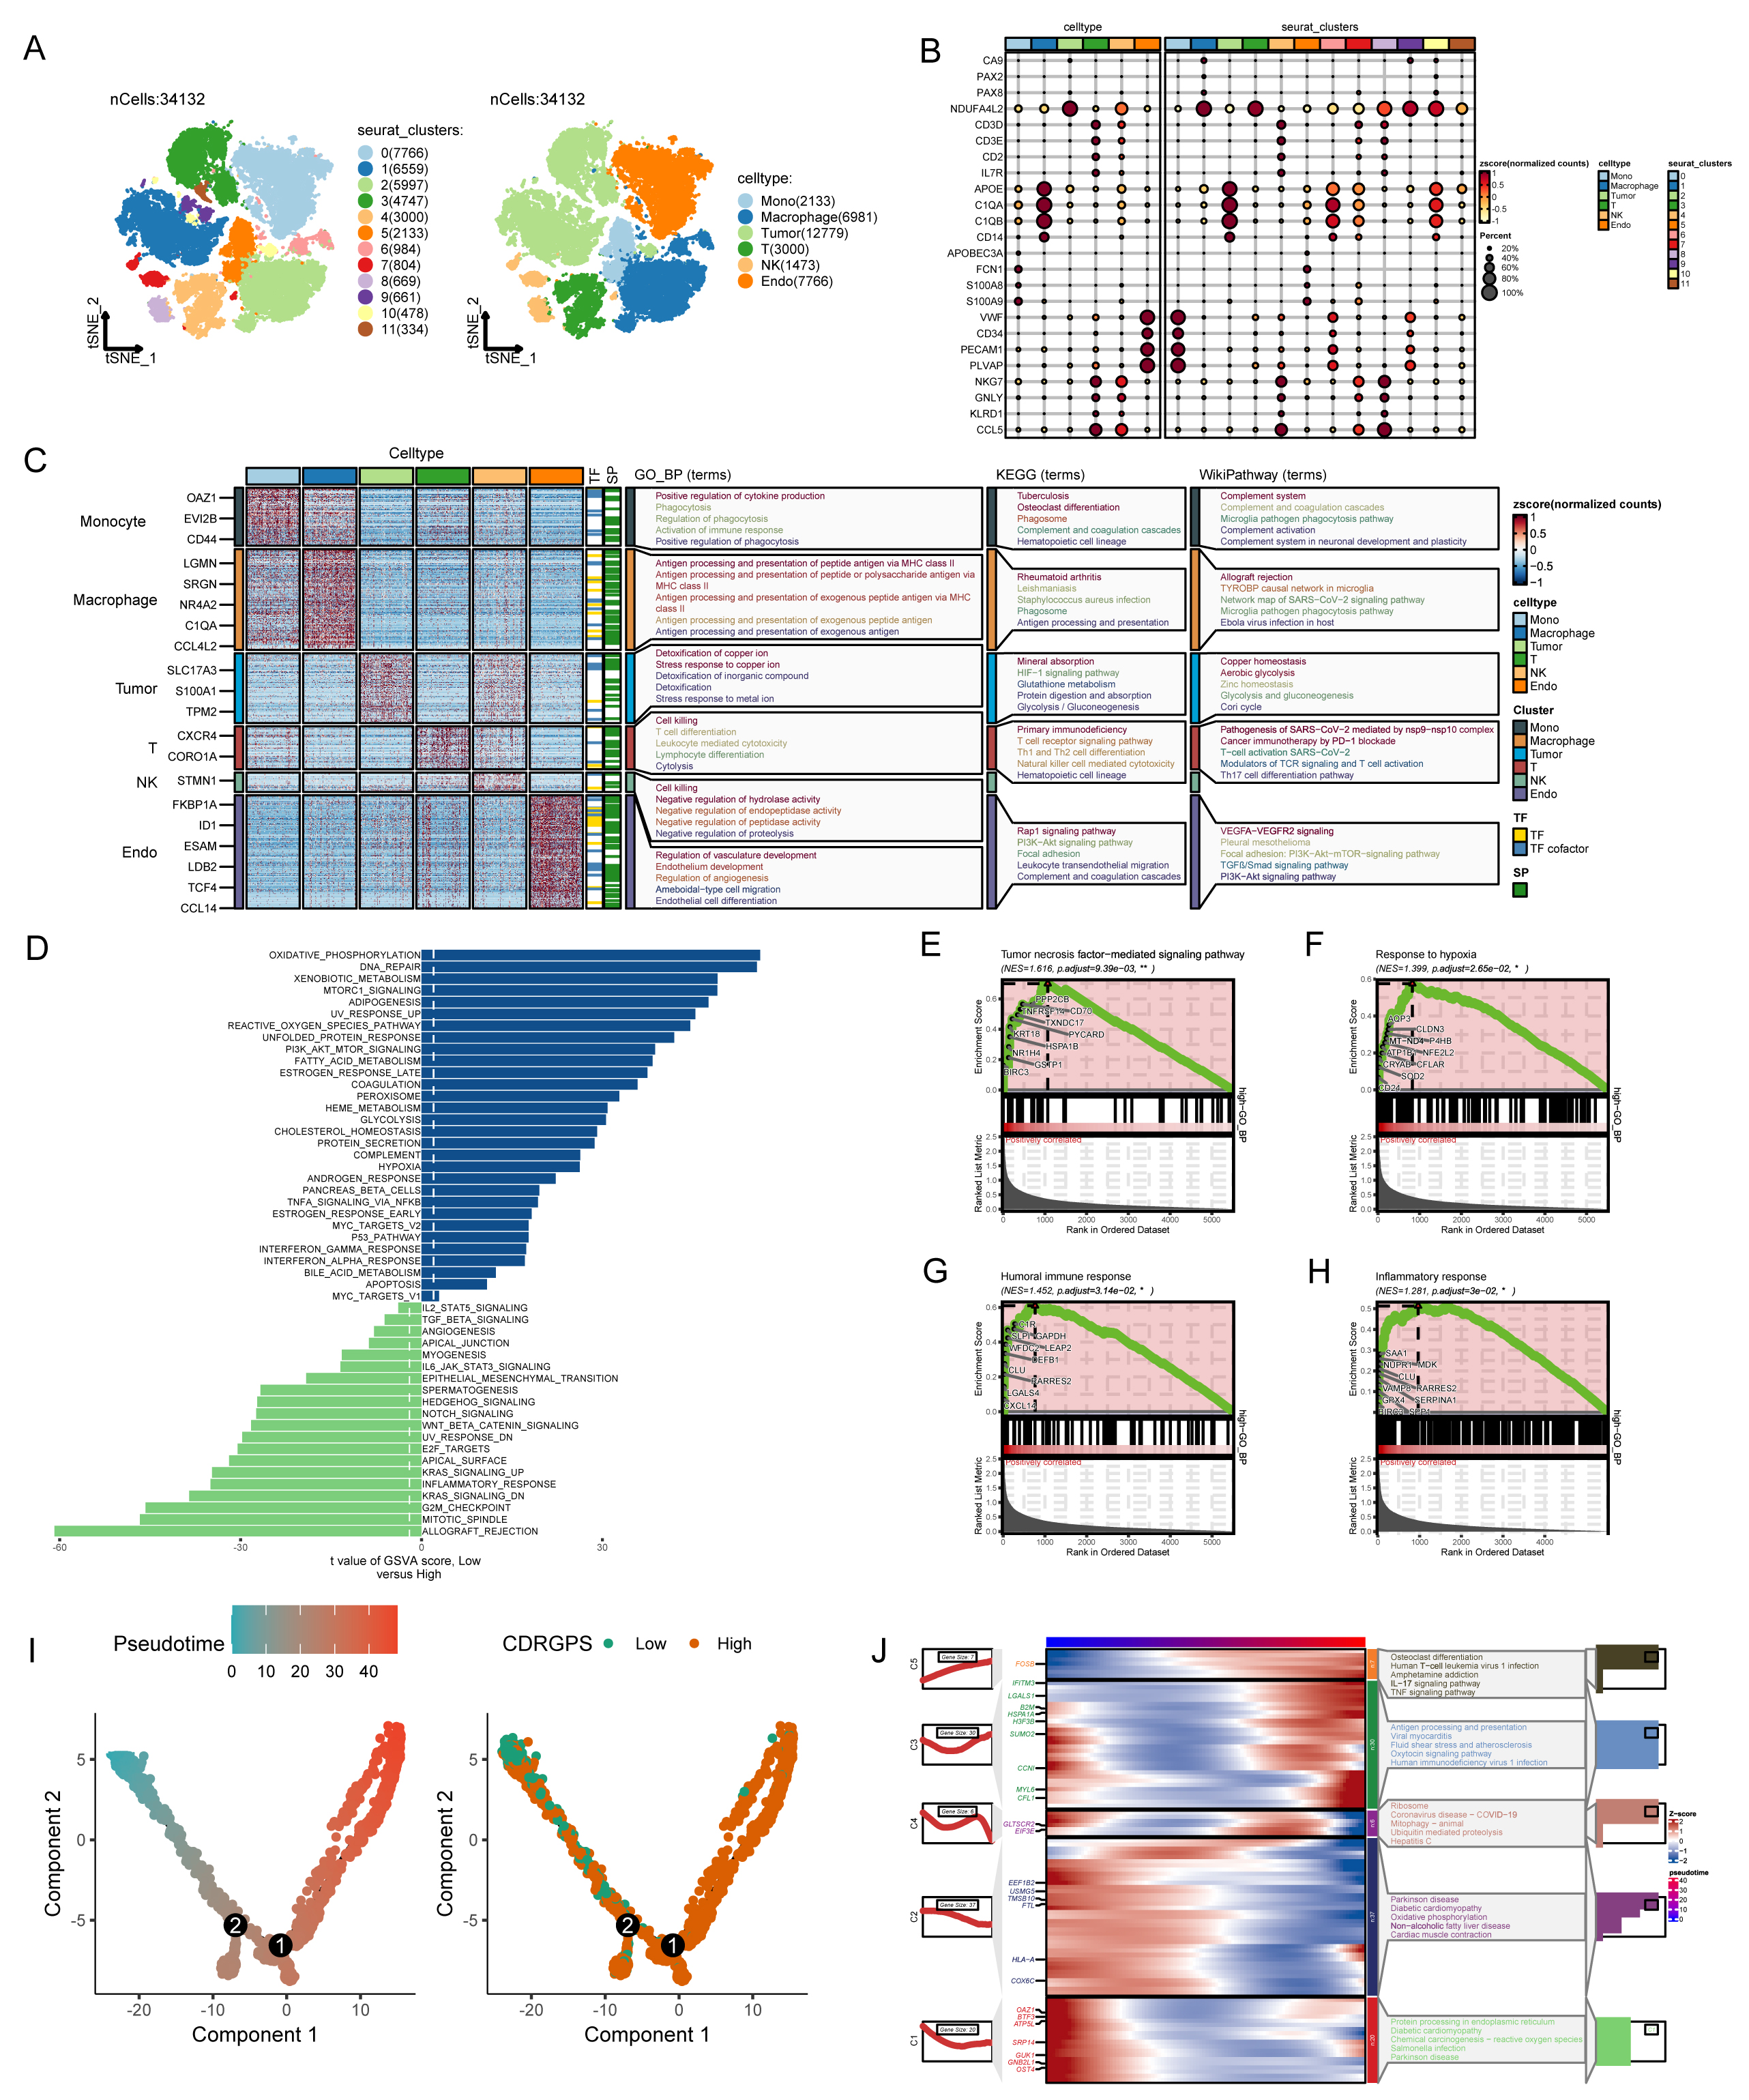 Fig. 6.
Analysis of single-cell RNA sequencing data. (A) Plots of 11 cell clusters and 6 different cell types using t-Distributed Stochastic Neighbor Embedding (t-SNE). (B) The expression of marker genes in six cell clusters. (C) Marker gene heatmap of each cell subpopulation. (D) Gene set variation analysis of renal cancer cells with different levels of CDRGPS. (E–H) Gene set enrichment analysis of renal cancer cells with different CDRGPS levels. (I) Pseudo-time trajectory plot showing the association between CDRGPS and pseudo-time progression. (J) Heatmap displaying the top GO_BP terms and scaled expression of dynamic genes along a pseudo-time axis for renal carcinoma cells with varying CDRGPS levels. GO_BP, Gene Ontology Biological Process; KEGG, Kyoto Encyclopedia of Genes and Genomes.
A rigorous, systematic investigation was performed to evaluate the effect of
CDRGPS on immunotherapy in ccRCC. We initially studied the RCC-Braun_2020 cohort
due to the complete prognostic and treatment-related data available for this
patient cohort. The CDRGPS-high group exhibited more favorable prognostic
outcomes, suggesting greater benefit from immunotherapy (Fig. 7A). In addition,
the group showing clinical benefit (CB) had a significantly higher CDRGPS than
the patient group showing no clinical benefit (NCB) (p
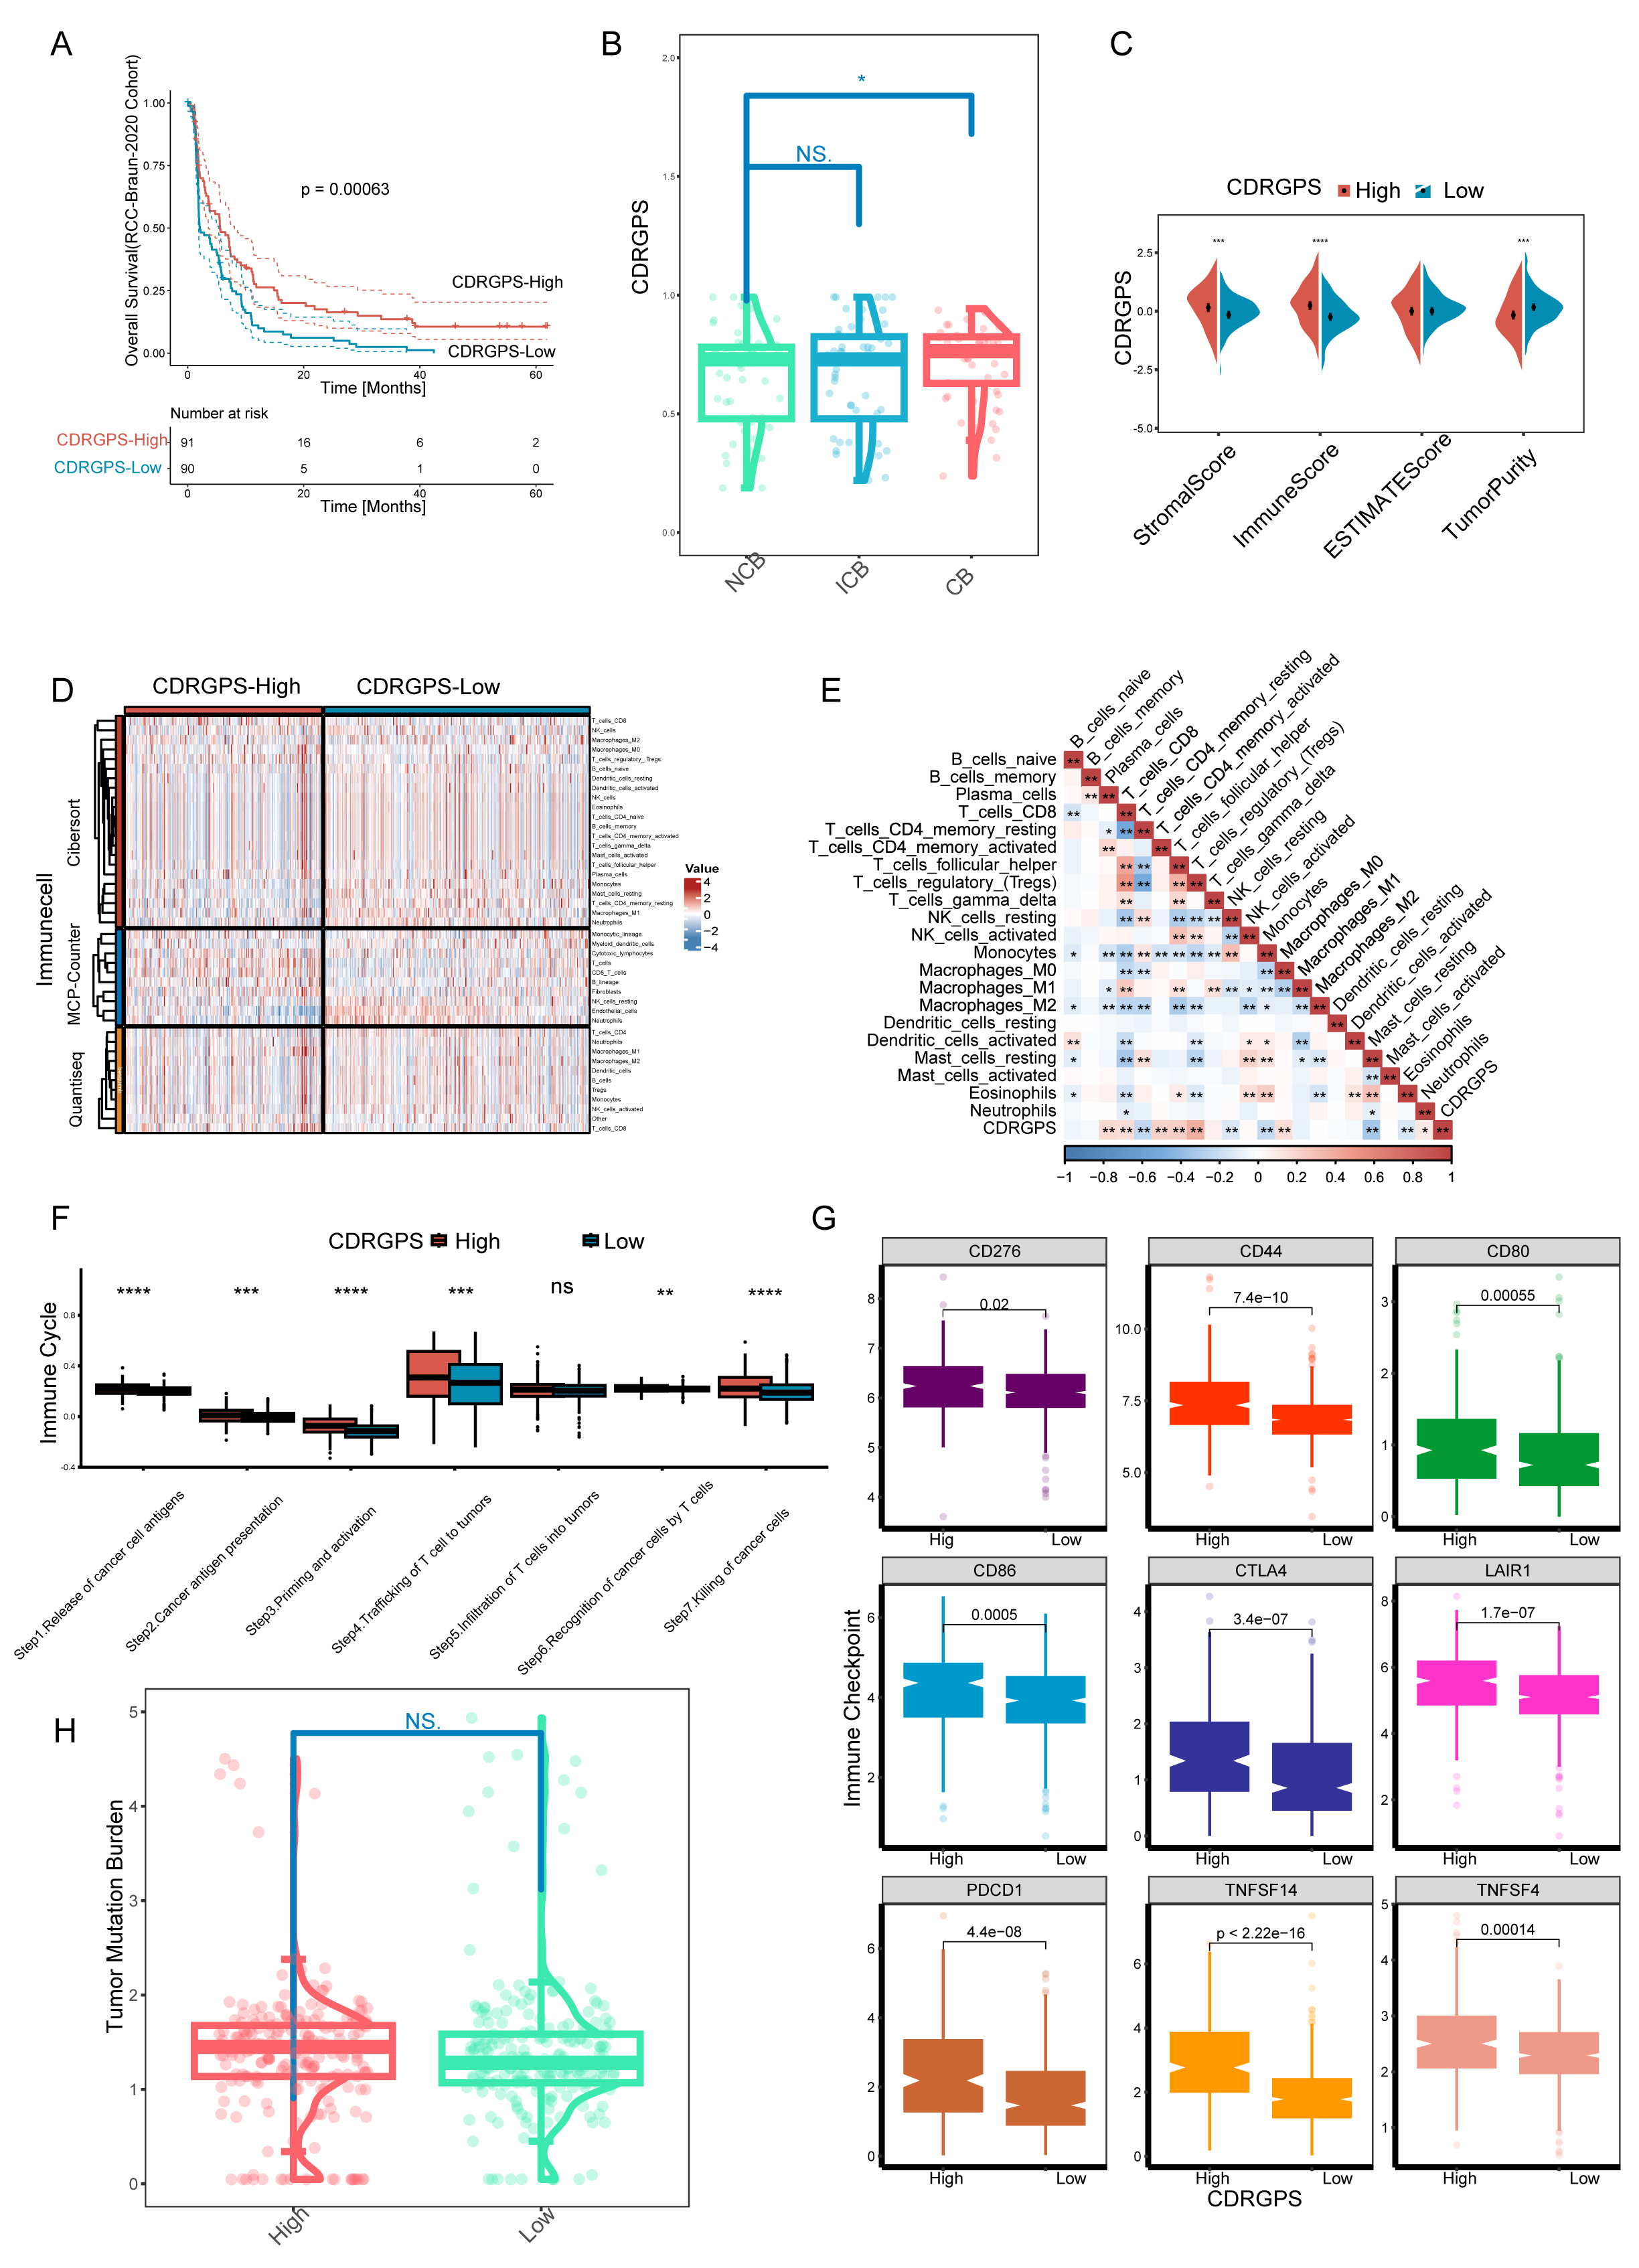 Fig. 7.
 Implications of the CDRGPS for immunotherapy. (A) Survival
analysis of CDRGPS-high and -low patient groups in the immunotherapy cohort. (B)
The distribution of CDRGPS in patient groups with different response to
immunotherapy. (C) Comparison between CDRGPS-high and -low groups for the
stromalscore, immunescore, ESTIMATE score, and tumor purity. (D) The abundance of
infiltrating immune cells in the CDRGPS-high and -low groups was assessed using
multiple algorithms. (E) Heatmap based on the Spearman r value between the CDRGPS
and immune cell infiltration in the TCGA-KIRC cohort. (F) Comparison of the
seven-step anticancer immunity cycle between CDRGPS-high and -low groups. (G)
Comparison of immune checkpoint expression profiles between CDRGPS-high and -low
groups. (H) Violin plots showing the distribution of tumor mutation burden (TMB)
scores in CDRGPS-high and -low groups. ****p
First-line therapy for advanced RCC typically involves tyrosine kinase inhibitors (TKIs) and mammalian Target of Rapamycin (mTOR) inhibitors. However, both intrinsic and acquired drug resistance pose persistent challenges, largely due to the subpopulation of tumor cells known as tumor-initiating cells (TICs) or cancer stem cells (CSCs). Six tumor stemness indices based on mRNA expression and DNA methylation signatures were obtained from earlier publications [50, 51, 52]. Correlations between the CDRGPS and these six indices were subsequently calculated. With the exception of DMPss, all indices showed statistically significant correlations with CDRGPS. Moreover, these correlations were consistently negative, with the exception of RNAss (Fig. 8A). To further confirm these correlations, the drug response to selected TKIs (dasatinib, gefitinib, imatinib) and to the mTOR inhibitor temsirolimus was examined in patients stratified by CDRGPS. The CDRGPS-high group exhibited lower half-maximal inhibitory concentrations (IC50) for dasatinib, gefitinib, and temsirolimus (Fig. 8B). Furthermore, a negative association was observed between the CDRGPS and the IC50 values for these three drugs (Fig. 8C). These observations imply that ccRCC patients with CDRGPS-high may respond more favorably to therapy with TKIs and mTOR inhibitors.
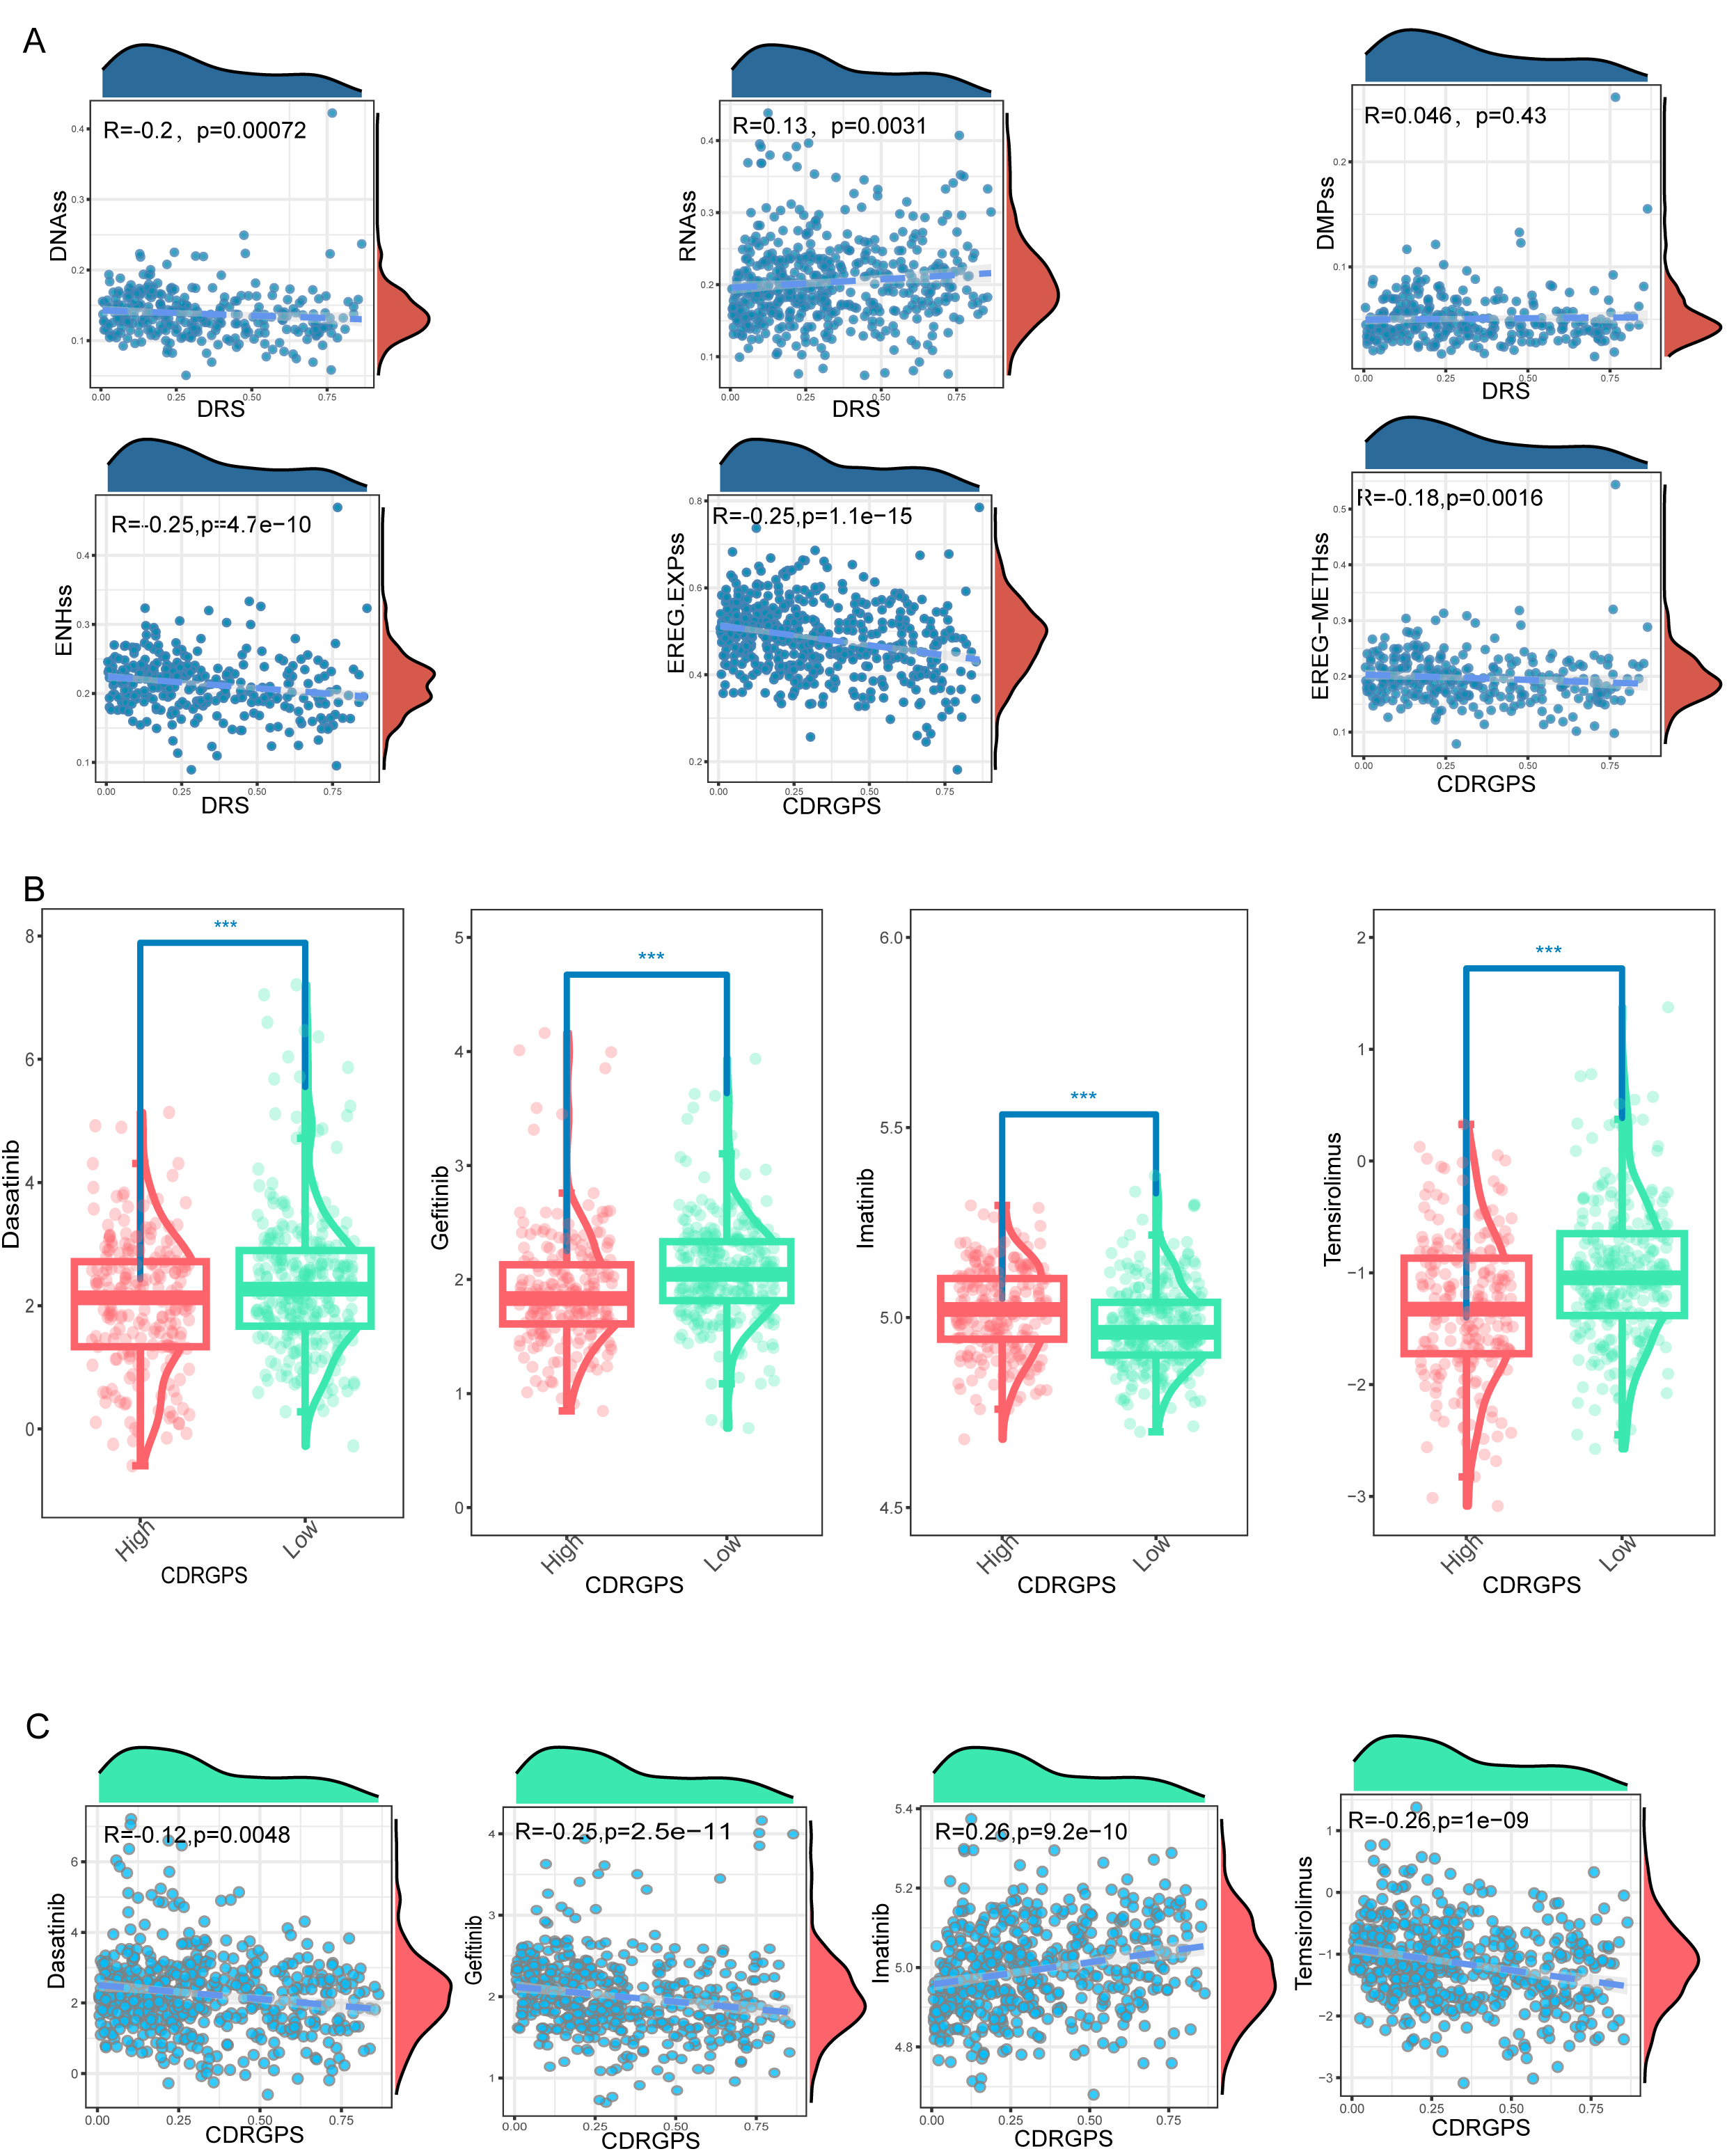 Fig. 8.
Associations between CDRGPS and drug sensitivity. (A)
Correlations between CDRGPS and tumor stemness indexes in ccRCC, including RNAss,
EREG.EXPss, DNAss, EREG-METHss, DMPss, and ENHss. (B) Comparison of the
susceptibility of CDRGPS-high and CDRGPS-low patients to TKIs such as dasatinib,
gefitinib, and imatinib, and to the mTOR inhibitor temsirolimus. (C) The
relationship between CDRGPS and the half-maximal inhibitory concentration (IC50)
of small molecule drugs including dasatinib, gefitinib, imatinib, and
temsirolimus in ccRCC. ***p
We selected 14 of 1688 features via LASSO regression to develop a Rad_Score
that was predictive of high/low CDRGPS in TCGA-KIRC (Fig. 9A,B). The Rad_Score
varied considerably between the CDRGPS-high and -low groups (p
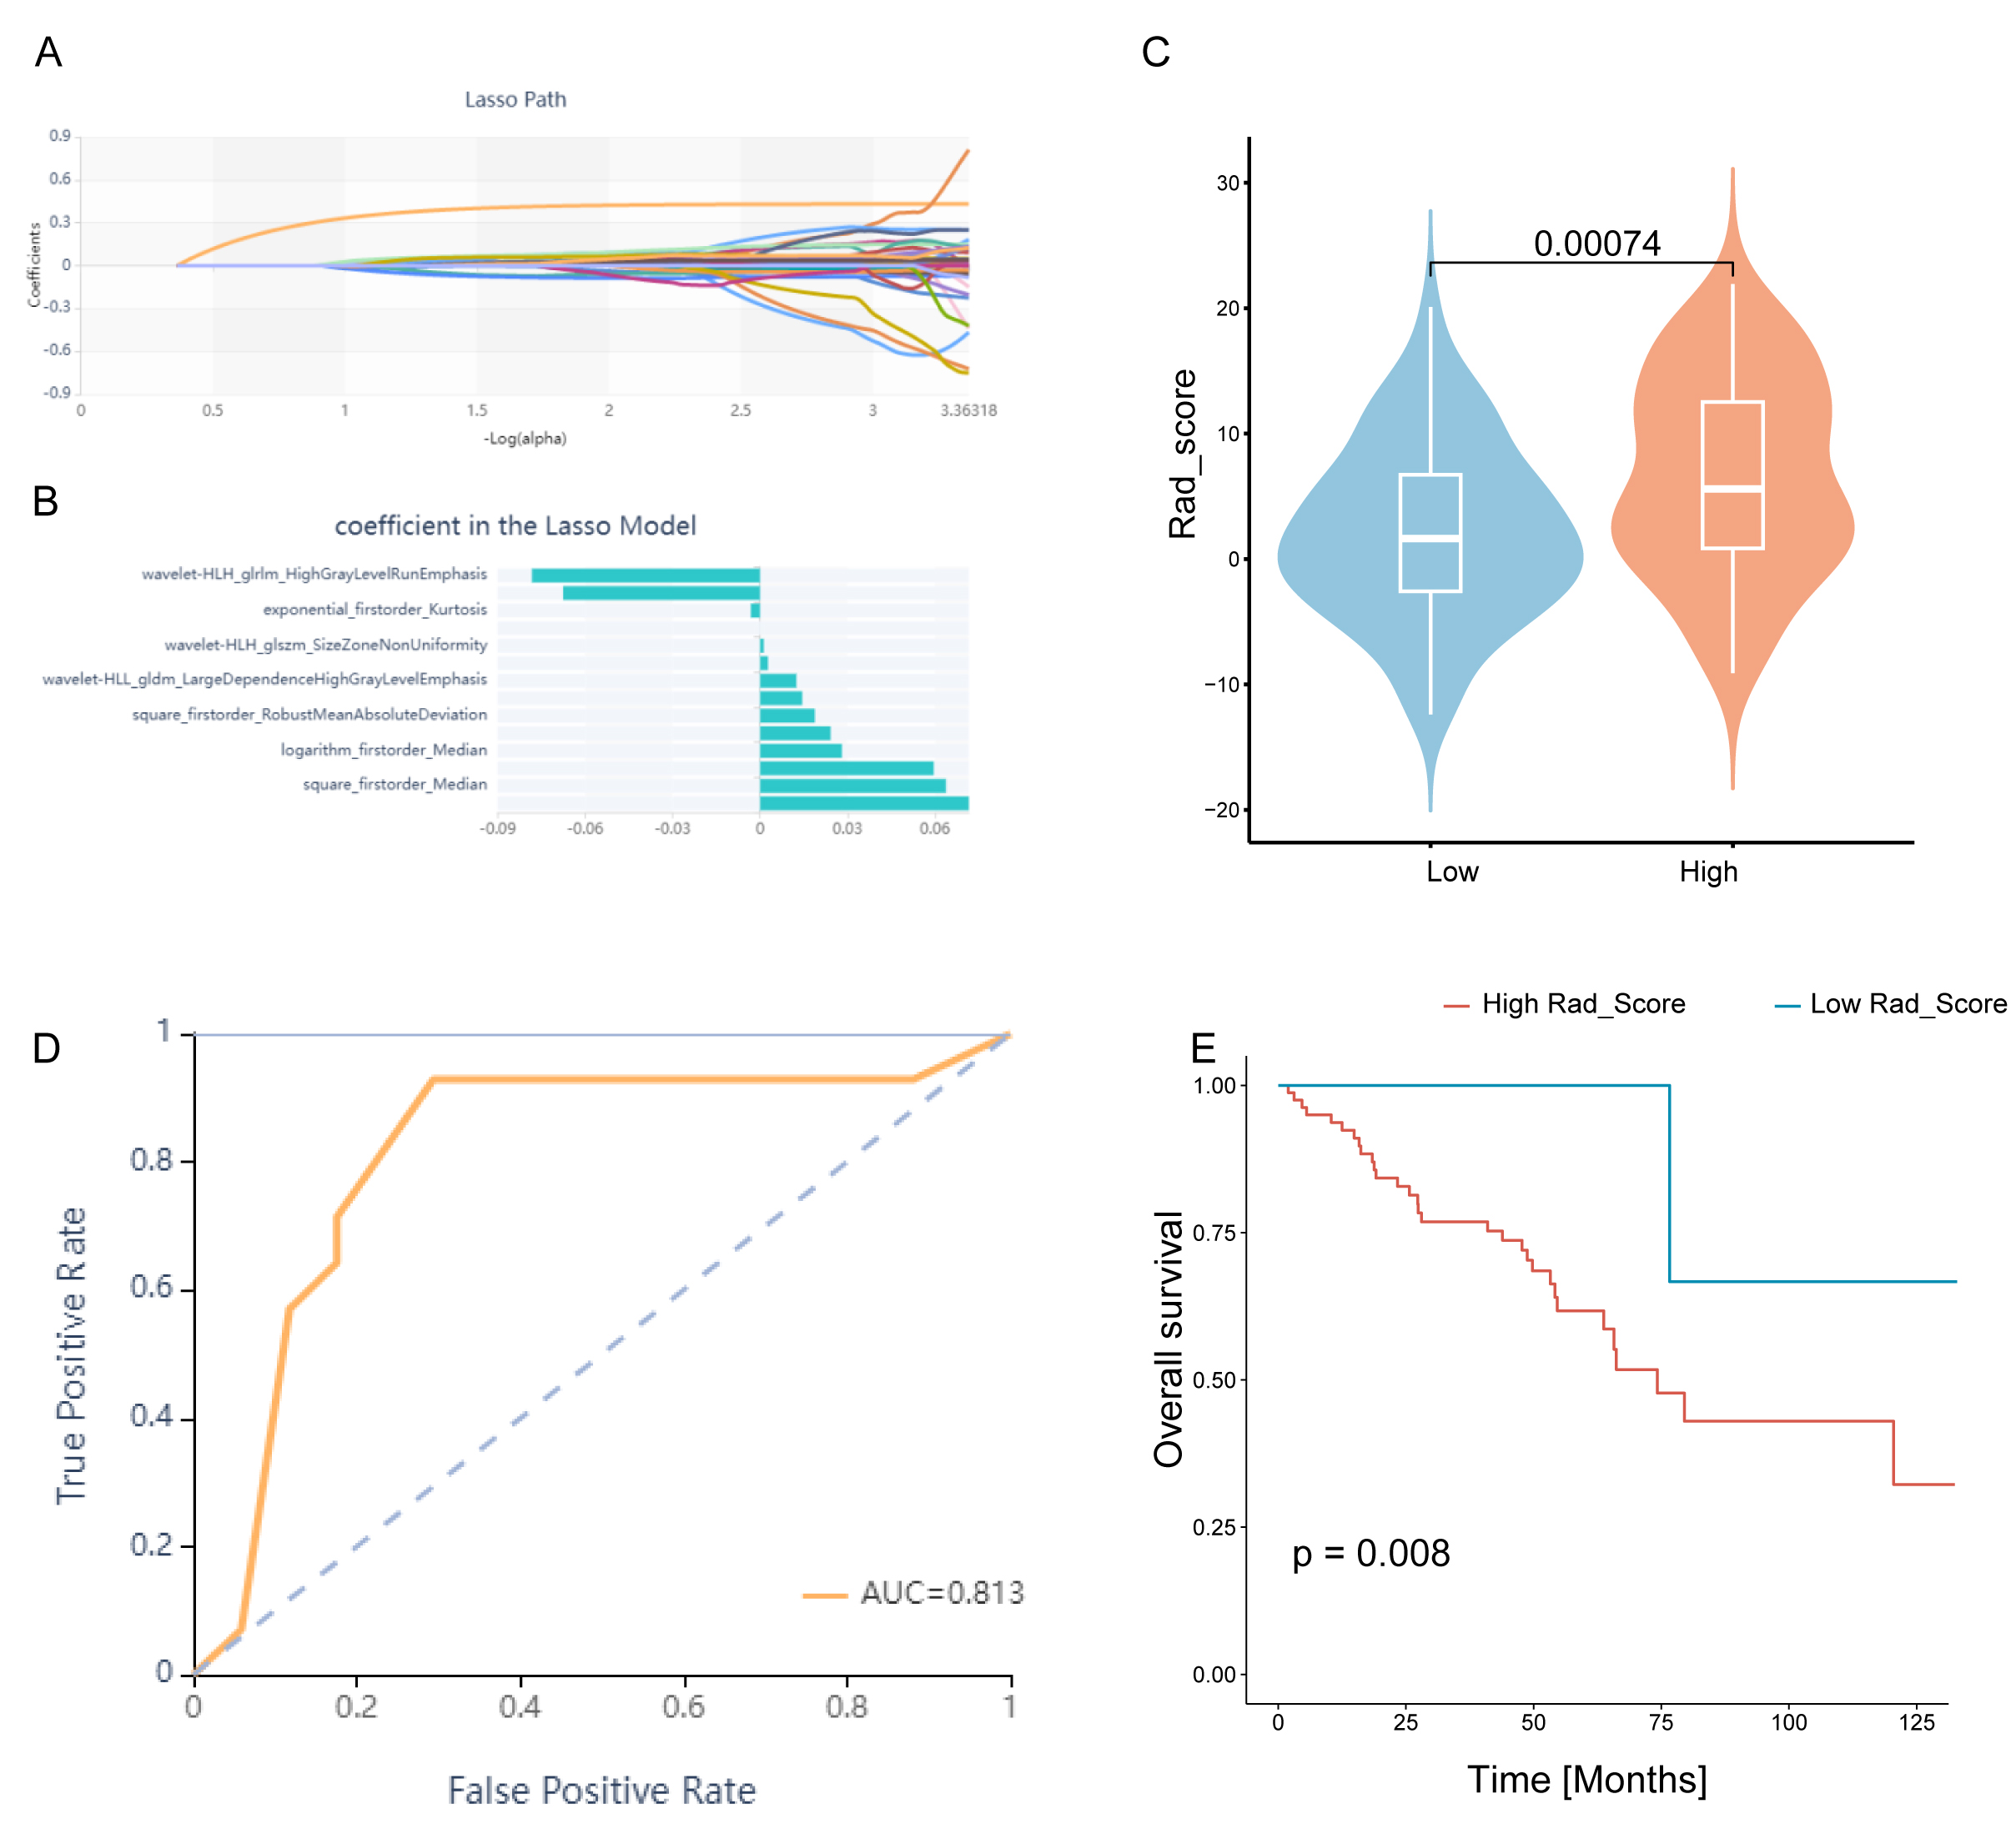 Fig. 9.
Construction and evaluation of the Rad_score. (A) Lasso regression. (B) Plot of coefficient profiles for radiomics characteristics associated with the Rad_Score. (C) Differences in Rad_Score between the CDRGPS-high and -low groups. (D) The predictive value of Rad_Score for distinguishing the CDRGPS-high and -low groups. (E) Survival analysis (OS) of patients with high and low Rad_Score.
Preliminary experiments suggest that serine protease 23 (PRSS23) may be a
promising target for the suppression of metastasis and for immunotherapy in RCC
patients. Analysis of gene expression data from TCGA and GTEx revealed
upregulation of PRSS23 in ccRCC tissues compared to normal tissues (Fig. 10A).
Immunohistochemical analysis confirmed that PRSS23 protein expression was higher
in RCC tissues compard to matching normal tissues (Fig. 10B). GSEA found that
epithelial-mesenchymal transition and the IL2-Stat5 signaling pathway were
positively associated with PRSS23 expression (Fig. 10C). Moreover, the TIMER
database revealed associations between elevated PRSS23 expression and multiple
immune cell categories, including CD8
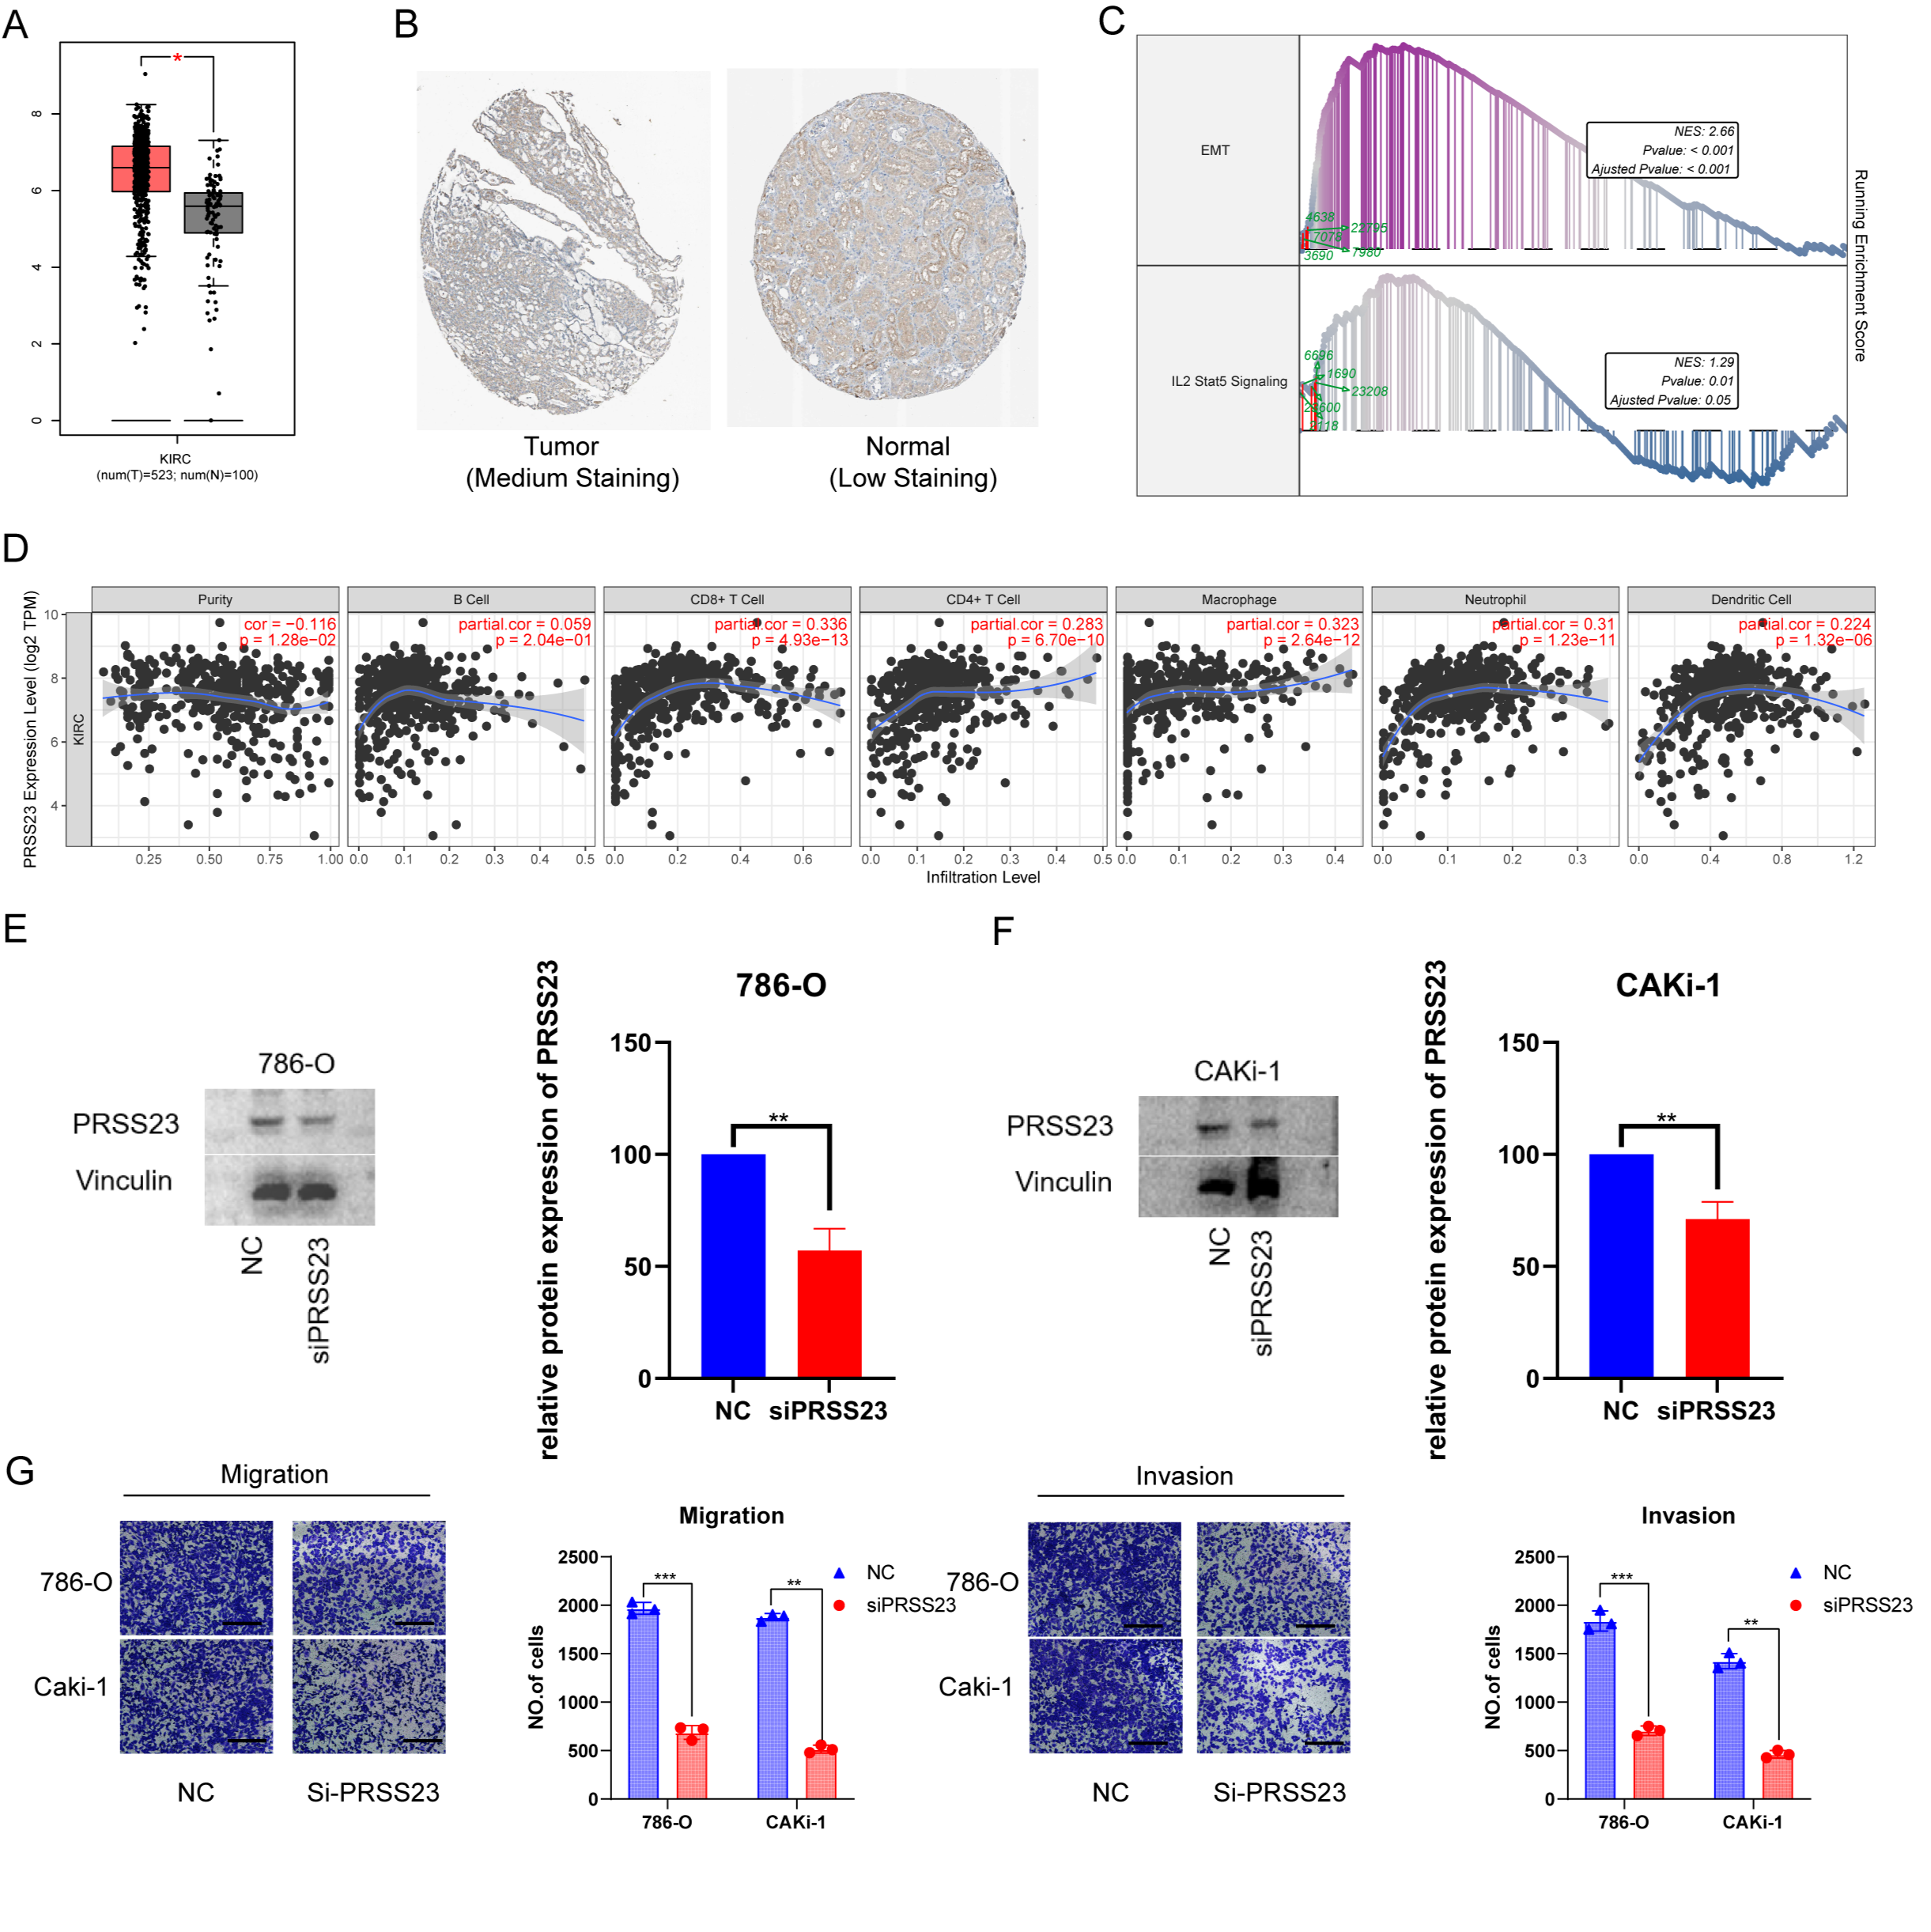 Fig. 10.
The putative biological role of PRSS23 in RCC immunology and
metastasis. (A) Comparison of PRSS23 expression level between tumor and normal
tissues in RCC from the GEPIA database. (B) PRSS23 expression in RCC from The Human Protein Atlas database Version (HPA, image available from v23.proteinatlas.org). (C) The TCGA-KIRC cohort was split into two
subgroups according to the median expression of PRSS23: PRSS23-high and
PRSS23-low subgroups. GSEA found that the differentially expressed genes
exhibited significant associations with immunity, epithelial-mesenchymal
transition (EMT), and immune-related pathways. (D) Associations between PRSS23
and seven different immune cell types were revealed using TIMER analysis. (E)
Knockdown of PRSS23 in 786-O and CAKi-1 cells. (F) Confirmation of PRSS23
knockdown by Western blot. (G) Transwell assay was used to assess the ability of
RCC cells to migrate and invade following PRSS23 knockout (magnification:
400
ccRCC is a significant global health concern due to its high incidence, metastatic potential, and poor prognosis. This type of RCC is quite common worldwide and exhibits substantial heterogeneity in terms of its molecular characteristics, clinical behavior, and natural disease progression [53]. The management of ccRCC is particularly challenging because of this diversity. The TNM staging system developed by the AJCC is a commonly used tool in clinical decision-making for ccRCC. However, the significant molecular and biological diversity of ccRCC mean that it is not adequately represented by anatomical TNM classification alone. This limitation can potentially lead to either overtreatment or undertreatment of patients based solely on TNM staging [54].
In recent years, cancer treatment has been revolutionized by immunotherapy targeting immune checkpoint pathways. Specifically, immune checkpoint inhibitors (ICIs) such as anti-PD-1/PD-L1 agents have become the standard of care for advanced RCC due to their ability to reverse T cell exhaustion and stimulate anti-tumor immune responses. However, despite improvements in RCC treatment by ICIs, long-lasting responses occur in only a minority of patients [55, 56]. These challenges underscore the pressing need to develop more refined prognostic models for ccRCC that can assist clinical decision-making.
In the present study, ccRCC was classified into two distinct clusters. Cluster-1 showed elevated levels of apoptosis, necroptosis, and pyroptosis, while cluster-2 was enriched for autophagy, cuproptosis, entotic cell death, and ferroptosis. Importantly, cluster-1, was associated with worse prognosis than cluster-2. By performing differential expression analysis of the two clusters and univariate Cox regression analysis, we identified the critical genes contributing to the unique PCD patterns in ccRCC. Previous models often suffer from bias due to their reliance on absolute gene expression values. Moreover, the choice of algorithm used by researchers may be influenced by their personal preferences and biases. The current study devised a novel gene pair signature based on the relative expression order within samples, rather than absolute expression levels. This eliminates the requirement for data normalization, thereby improving reliability and generalizability. Following the evaluation of 113 combinations of 12 machine learning algorithms, Lasso and RF were found to be the best model based on PCD-related gene pairs. This generated a more straightforward and transferable model by significantly reducing the dimensionality of the variables and exposing underlying patterns. Therefore, the CDRGPS may accurately predict the prognosis and efficacy of immunotherapy for ccRCC patients. Prognostic analysis of both the training and test cohorts revealed that CDRGPS was a predictor of OS. Furthermore, ROC analysis indicated that CDRGPS consistently exhibited high accuracy and stable performance in both cohorts. These findings highlight the significant clinical potential of CDRGPS.
To further validate the robustness of our CDRGPS signature, we compared it to five previously published gene signatures that are based on various combinations of PCD-related genes. Few of these prognostic models have been used in clinical practice or undergone careful external validation. Univariate and multivariate Cox regression analysis revealed that only the CDRGPS model exhibited statistical significance as an independent prognostic factor in ccRCC. Comparative performance assessments further demonstrated the superior prognostication ability of CDRGPS versus all other models across different datasets. Most models were proficient when applied to their own training dataset, but displayed weaker performance in independent external datasets, likely because of overfitting and poor generalizability. Subsequently, independent prognostic factors and crucial clinical variables were integrated to develop a concise and precise nomogram for prognostic prediction in patients. Moreover, calibration and decision curve analyses upheld the clinical utility of the nomogram for providing valuable prognostication.
In the current study we leveraged the GSE156632 cohort, comprising scRNA-seq profiles of seven ccRCC samples, to characterize the heterogeneity of the TME. Quality control and annotation of the scRNA-seq data using established marker genes identified six predominant cell types: endothelial cells, tumor cells, T cells, natural killer (NK) cells, macrophages and monocytes. Analysis of single-cell sequencing data using GSEA and GSVA revealed that tumor cells with high CDRGPS show enhanced regulation of tumor-related immunity pathways, including IMMUNE_RESPONSE, IL2_STAT5_SIGNALING, INTERFERON_GAMMA_RESPONSE, INTERFERON_ALPHA_RESPONSE, and humoral immune response. Additionally, these cells display enhanced malignant biological characteristics such as TGF_BETA_SIGNALING, PI3K_AKT_MTOR_SIGNALING, apoptosis, epithelial-to-mesenchymal transition, tumor necrosis factor-mediated signaling, and increased response to hypoxia. Furthermore, pseudotime trajectory analysis of tumor cell states showed that genes associated with high CDRGPS were linked to pathways related to carcinogenesis and immune function.
The conventional initial therapy used for advanced ccRCC is TKIs and mTOR inhibitors. However, the current prognostic markers utilized in clinical practice are unable to accurately identify individuals who may benefit from this treatment. To address this critical unmet need, we assessed the ability of CDRGPS to predict which patients would benefit most from TKIs and mTOR inhibitors. Mounting evidence has implicated PCD pathways in the response to these inhibitors [57, 58]. Our findings revealed an inverse association between high CDRGPS and tumor stemness features. Additionally, a high CDRGPS was predictive of increased responsiveness to TKI and mTOR inhibitor therapy. Collectively, these results indicate the CDRGPS signature may serve as a powerful tool to inform treatment decisions and allow the selection of ccRCC patients for personalized therapy.
The advent of cancer immunotherapy has radically altered the treatment of solid tumors, including ccRCC. Nonetheless, ICIs are only effective in some individuals, and hence their over-utilization can result in substantial cost and severe adverse events. In this study, CDRGPS-high patients displayed abundant immune cell infiltration, indicative of an “immune-hot” tumor phenotype. Furthermore, CDRGPS-high tumors showed increased expression of numerous inhibitory checkpoint molecules, in line with the finding that integral immune checkpoint pathways are frequently co-opted by malignancies to attenuate anti-tumor immunity [59, 60]. This suggests that adverse outcomes in CDRGPS-high ccRCC may be due to suppressed immune function caused by increased immune checkpoint signaling. Consequently, immune checkpoint blockade to restore anti-neoplastic immune responses may be an effective therapeutic strategy for CDRGPS-high patients. Furthermore, these patients also exhibited higher TMB and stronger anti-cancer immune cycle activity. Elevated TMB can increase the generation of immunogenic neoantigens derived from somatic mutations, subsequently driving the proliferation and activation of cytotoxic T lymphocytes against the tumor [61]. Taken together, our findings indicate that CDRGPS may be a useful biomarker to identify ccRCC patients most likely to derive clinical benefit from immunotherapy. This conclusion was validated in an independent cohort of patients undergoing immunotherapy.
Enzyme-Linked Immunosorbent Assay (ELISA), Immunohistochemistry (IHC) and RNA-sequence data can be used to evaluate CDRGPS. However, these methods are expensive and complex, thereby limiting their scalability. Enhanced CT examinations are commonly used in China for renal cancer diagnosis, even in resource-limited regions. The use of CT image-based radiological features to determine a patients’ CDRGPS therefore has significant clinical and economic potential. Earlier studies on ccRCC mainly used radiomics to predict post-nephrectomy clinical outcomes or nuclear grading, with few studies having explored the use of CT images to determine gene signatures [62, 63]. In the present study, our radiomics model-based score (Rad_Score) showed good performance for determining the CDRGPS of patients in the TCIA database. Based on CT images, the Rad_Score can accurately reflect the CDRGPS and thus serve as a rapid prognostic indicator to help clinicians in treatment decision-making.
All of the genes in the gene pair model used in this study had significant
involvement in cancer. PRSS23 is a serine protease that has been linked to tumor
growth in a variety of malignancies and is markedly up-regulated in cancer stem
cells [64, 65]. Gene expression profiling studies have reported increased PRSS23
expression in several tumor types including breast cancer [66], prostate
carcinoma [67], papillary thyroid carcinoma [68], and pancreatic cancer [69].
However, more research is required to determine the precise function of PRSS23 in
RCC and its relationship to immunity. Our study showed that PRSS23 was positively
associated with EMT and immune cell infiltration. Specifically, PRSS23 expression
correlated positively with several immune cell types, including CD8
Despite the potential clinical utility of CDRGPS in ccRCC, certain limitations of this study warrant consideration. Firstly, although CDRGPS was rigorously evaluated and validated in the training and external datasets, large-scale prospective studies across multiple centers are needed to confirm these findings. Another limitation of the current investigation is the lack of direct in vitro or in vivo experimental confirmation of the results. Finally, the sample size in the TCGA database is relatively small.
By integrating diverse bioinformatics approaches and machine learning methods, we have built a robust and reliable model termed CDRGPS that has prognostic utility in ccRCC and the ability to predict treatment outcomes for targeted therapies and immunotherapy. A key accomplishment is development of the Rad_Score radiomic biomarker, which provides a non-invasive means of estimating patient CDRGPS status. Overall, CDRGPS holds significant promise for enabling precision oncology by guiding clinical decision-making and surveillance strategies. This should lead to individualized patient care based on minimally invasive and cost-effective approaches.
All authors have given their approval for this paper to be published.
The corresponding author can be contacted for free to receive any data or R code used in this work. The datasets presented in this study can be found in online repositories.
The research project was designed by DW and WC. BC and XS performed the data acquisition, and interpretation through a comprehensive review of the relevant literature. BC performed the data analysis and visualization. BC, LG, and MZ performed the in vitro experiments. BC, MZ, LG and WC wrote the manuscript. BC, ZP and HH contributed to preparing the figures and tables. DW and WC revised the manuscript. All authors contributed to editorial changes in the manuscript. All authors approved the final manuscript to be published. All authors have participated sufficiently in the work and agreed to be accountable for all aspects of the work.
Not applicable.
Not applicable.
This research received no external funding.
The authors declare no conflict of interest.
Publisher’s Note: IMR Press stays neutral with regard to jurisdictional claims in published maps and institutional affiliations.