


 , Gautam Sen 1,2, Aamir Shamsi 1,2, Antonio Cannata 1,2, Daniel Bromage 1,2, Daniel Sado 1,2
1 School of Cardiovascular and Metabolic Medicine & Sciences, King’s College London British Heart Foundation Centre of Excellence, James Black Centre, SE5 9NU London, UK
2 Department of Cardiology, King’s College Hospital NHS Foundation Trust, SE5 9RS London, UK
Abstract
Myocarditis, an inflammatory condition of the myocardium, can present with a spectrum of clinical manifestations, ranging from mild symptoms to cardiogenic shock or death. While endomyocardial biopsy (EMB) remains the gold standard for diagnosis, its invasive nature and limited sensitivity have shifted focus toward non-invasive imaging, particularly cardiovascular magnetic resonance (CMR) imaging. CMR has emerged as a cornerstone in diagnosing myocarditis, offering high sensitivity and specificity through advanced tissue characterisation and functional assessment. Key CMR techniques include T1 and T2 mapping, which allow quantitative evaluation of myocardial injury, oedema, and fibrosis, alongside late gadolinium enhancement (LGE), which identifies predominantly necrosis and scar tissue. The revised 2018 Lake Louise Criteria have further standardised the diagnostic approach with integration of mapping for enhanced accuracy. However, emerging technologies, such as radiomics with machine learning techniques, show promise in improving diagnostic precision, risk stratification, and prognostication. This review explores the pathophysiology, clinical manifestations, and underlying causes of myocarditis, with a particular emphasis on the role of imaging modalities. It highlights the central importance of CMR in the diagnosis and management of myocarditis, while also underscoring the need for ongoing innovation and advancements to enhance patient outcomes.
Keywords
- cardiac magnetic resonance imaging
- myocarditis
- inflammation
- echocardiography
- cardiac computed tomography
Myocarditis, characterised by inflammation of the myocardium, was first identified as a distinct condition by German physician Dr Joseph Friedrich Sobernheim in 1837 [1]. It can be triggered by both infectious and non-infectious factors and may present in acute, subacute, or chronic forms. Signs and symptoms can range from chest pain, shortness of breath and palpitations, to fevers, peripheral oedema, fatigue and lethargy. In rare cases, it can lead to serious adverse outcomes such as decompensated heart failure, ventricular arrhythmias, cardiogenic shock, or death. Diagnosing myocarditis has traditionally been challenging due to its wide range of symptoms and the absence of specific biomarkers, and in addition, real-world diagnostic accuracy and coding of myocarditis can be poor [2]. While endomyocardial biopsy (EMB) has historically been the gold standard for diagnosis, the advent of cardiac imaging, particularly cardiovascular magnetic resonance (CMR) imaging, has facilitated a shift towards non-invasive diagnostic approaches in most cases [2, 3]. This review will examine the aetiology and clinical presentation of myocarditis, the role of various imaging modalities in its diagnosis with a focus on CMR, its inclusion in clinical guidelines, and potential future research directions.
Patients with myocarditis can present acutely, subacutely or in the chronic phase. The acute phase is typified by myocardial oedema and inflammation with associated myocardial injury. Over a period of days to weeks, there is a transition into the subacute phase where the myocardial tissue begins to heal, and the presence of mixed inflammation and interstitial oedema is usually present. Over subsequent weeks, granulation tissue develops at sites of myocardial injury with collagen deposition replacing necrotic cardiomyocytes cleared by macrophage activity. The collagen matures into a heterogeneous scar tissue. Rarely, chronic myocarditis can occur where inflammation persists with coexistent healing.
Acute myocarditis is most frequently seen in the young (30–45 years old) and
men (60–80%) [4]. The most common presentation of acute
myocarditis is with chest pain (82–95%), and frequently it is associated with
dyspnoea (19–49%) and fever (58–65%), with presentations of cardiogenic shock
(fulminant myocarditis) being rare (3–9%) [5, 6, 7]. Recent evidence has shown that it is possible
to quickly risk-stratify myocarditis patients with basic blood tests, where a
neutrophil lymphocyte ratio of
There is a wide range of triggers for myocarditis, ranging from infective to autoimmune, toxin, drug-induced and hypersensitivity causes [10] (Table 1, Ref. [11]). More recently, it has become evident that there is a genetic interplay with myocarditis, and some individuals are at heightened risk [12, 13]. In particular, genetic variants linked to arrhythmogenic cardiomyopathy (ACM) are associated with myocarditis. Described as the “hot phase” of ACM, such acute myocarditis is particularly observed in desmosomal ACM, with a typically more widespread mid-wall involvement on imaging, and in many cases, patients present with recurrent myocarditis episodes [14, 15].
| Aetiology | ||
| Infection | Viral | Coxsackie B, Parvovirus B19, adenoviruses, herpes, HIV, COVID-19, influenza |
| Bacterial | Corynebacterium diphtheriae, Staphylococcus aureus, Borrelia burgdorferi, Ehrlichia species, Neisseria meningitidis | |
| Protozoal | Trypanosoma cruzi | |
| Parasitic | Babesia, Schistosomiasis, Toxocara canis | |
| Autoimmune | Primary autoimmune | Churg-Strauss (eosinophilic) myocarditis, giant cell myocarditis (GCM), sarcoidosis |
| Associated with systemic disease | Systemic lupus erythematosus (SLE), inflammatory bowel disease, Takayasu’s arteritis, granulomatosis with polyangiitis (GPA), thyrotoxicosis | |
| Others | Toxins | Alcohol, radiation, chemicals (hydrocarbons and arsenic) |
| Drugs | Doxorubicin, cocaine, Interleukin-2 (IL-2) inhibitors, mRNA vaccines* | |
| Hypersensitivity | Sulphonamides, penicillins, digoxin, tricyclic antidepressants, dobutamine | |
| Genetic | Arrhythmogenic cardiomyopathy | Desmosomal—plakophilin 2 (PKP2), desmoplakin (DSP), |
| Non-desmosomal—filamin C (FLNC), lamin A/C (LMNA) | ||
Notes: HIV, Human Immunodeficiency Virus; mRNA, messenger Ribonucleic Acid; COVID-19, Coronavirus Disease 2019. *Rare, usually self-limiting [11].
Myocarditis is a non-ischemic inflammatory disease of the myocardium, defined by the presence of inflammation, cellular injury with leucocyte ingress, and myocyte necrosis [3, 16]. The gold standard for diagnosis is EMB, which provides histopathological detail about the pattern and aetiology of inflammation. Subsequently, myocarditis is classified by cell infiltrate, which includes eosinophilic, lymphocytic, lymphohistiocytic and neutrophilic infiltrates.
Eosinophilic myocarditis is identified by one of two separate histopathological patterns—mild patchy interstitial eosinophilic infiltrate or dense eosinophilic infiltrate with cardiomyocyte necrosis. Lymphocytic myocarditis is characterised most commonly by patchy infiltration of T lymphocytes in the myocardial interstitium. Lymphohistiocytic myocarditis can describe either granulomatous myocarditis, characterised by distinct epithelioid granulomas, or giant cell myocarditis, in which multinucleated giant cells are present. The latter is associated with diffuse inflammation and myocardial necrosis, whereas the former demonstrates patchy inflammation and granulomatous fibrosis, with sarcoidosis being the most common underlying aetiology. Lastly, neutrophilic myocarditis is a rare pattern seen in patients with bacterial involvement, either through sepsis/bacterial endocarditis, or very uncommonly, fungal infection.
Endomyocardial biopsy remains the reference standard for the diagnosis of myocarditis. However, in many countries, EMB is rarely performed, with only 3.6% of North American and 0.7% of United Kingdom (UK) suspected myocarditis cases undergoing EMB [17, 18]. EMB carries a risk of complications (1–5%), and in the UK, only 18% of National Health Service (NHS) trusts undertake this procedure [17]. It is often only performed in specific circumstances where the diagnosis remains uncertain, particularly if giant cell myocarditis is suspected, where its role can be pivotal, or when biopsy results would dramatically alter management, most commonly in new-onset heart failure. The decision to perform an EMB demands careful consideration, weighing the patient’s clinical condition against the expertise of the medical team and the balance of potential benefits and risks. In addition, biopsy has a relatively low sensitivity when compared with autopsy findings [19]. As a result of these limitations, the vast majority of clinical myocarditis diagnoses are made through non-invasive testing such as serology and cardiac imaging.
Cardiac imaging has become a cornerstone in the evaluation and diagnosis of myocarditis and its associated cardiac complications. Here, we will discuss various imaging modalities used in the assessment of patients with suspected myocarditis.
In the majority of individuals, echocardiography is the first cardiac imaging medium utilised in the investigation of patients presenting with chest pain and breathlessness, the most common symptoms of myocarditis. Low cost, widely available and accessible, echocardiography provides a foundation for the exclusion of alternative pathologies (such as valvular or pericardial disease) and can give a rapid and accurate assessment of left and right ventricular function. However, the features of myocarditis on echocardiography are non-specific, and include left ventricular systolic dysfunction (LVSD), which can be global or more commonly regional (of the basal inferolateral wall), ventricular dilation, and pericardial effusion (in the context of perimyocarditis) [4]. Hypo or akinetic walls create substrate for ventricular thrombi, and these may be easily visible on 2D imaging, but if there is uncertainty, contrast should be considered to enhance diagnostic accuracy.
Contemporary methods, such as strain analysis (Fig. 1), which measure the displacement of tissue (pixels) and thus strain over the course of the cardiac cycle, can be helpful in cases of myocarditis owing to the inability of echocardiography to accurately characterise myocardial inflammation. Global longitudinal and radial strain correspond to areas of myocardial inflammation on biopsy [20] and, in both 2D and 3D imaging, have been correlated with regional changes of inflammation and late gadolinium enhancement (LGE) on CMR [21, 22].
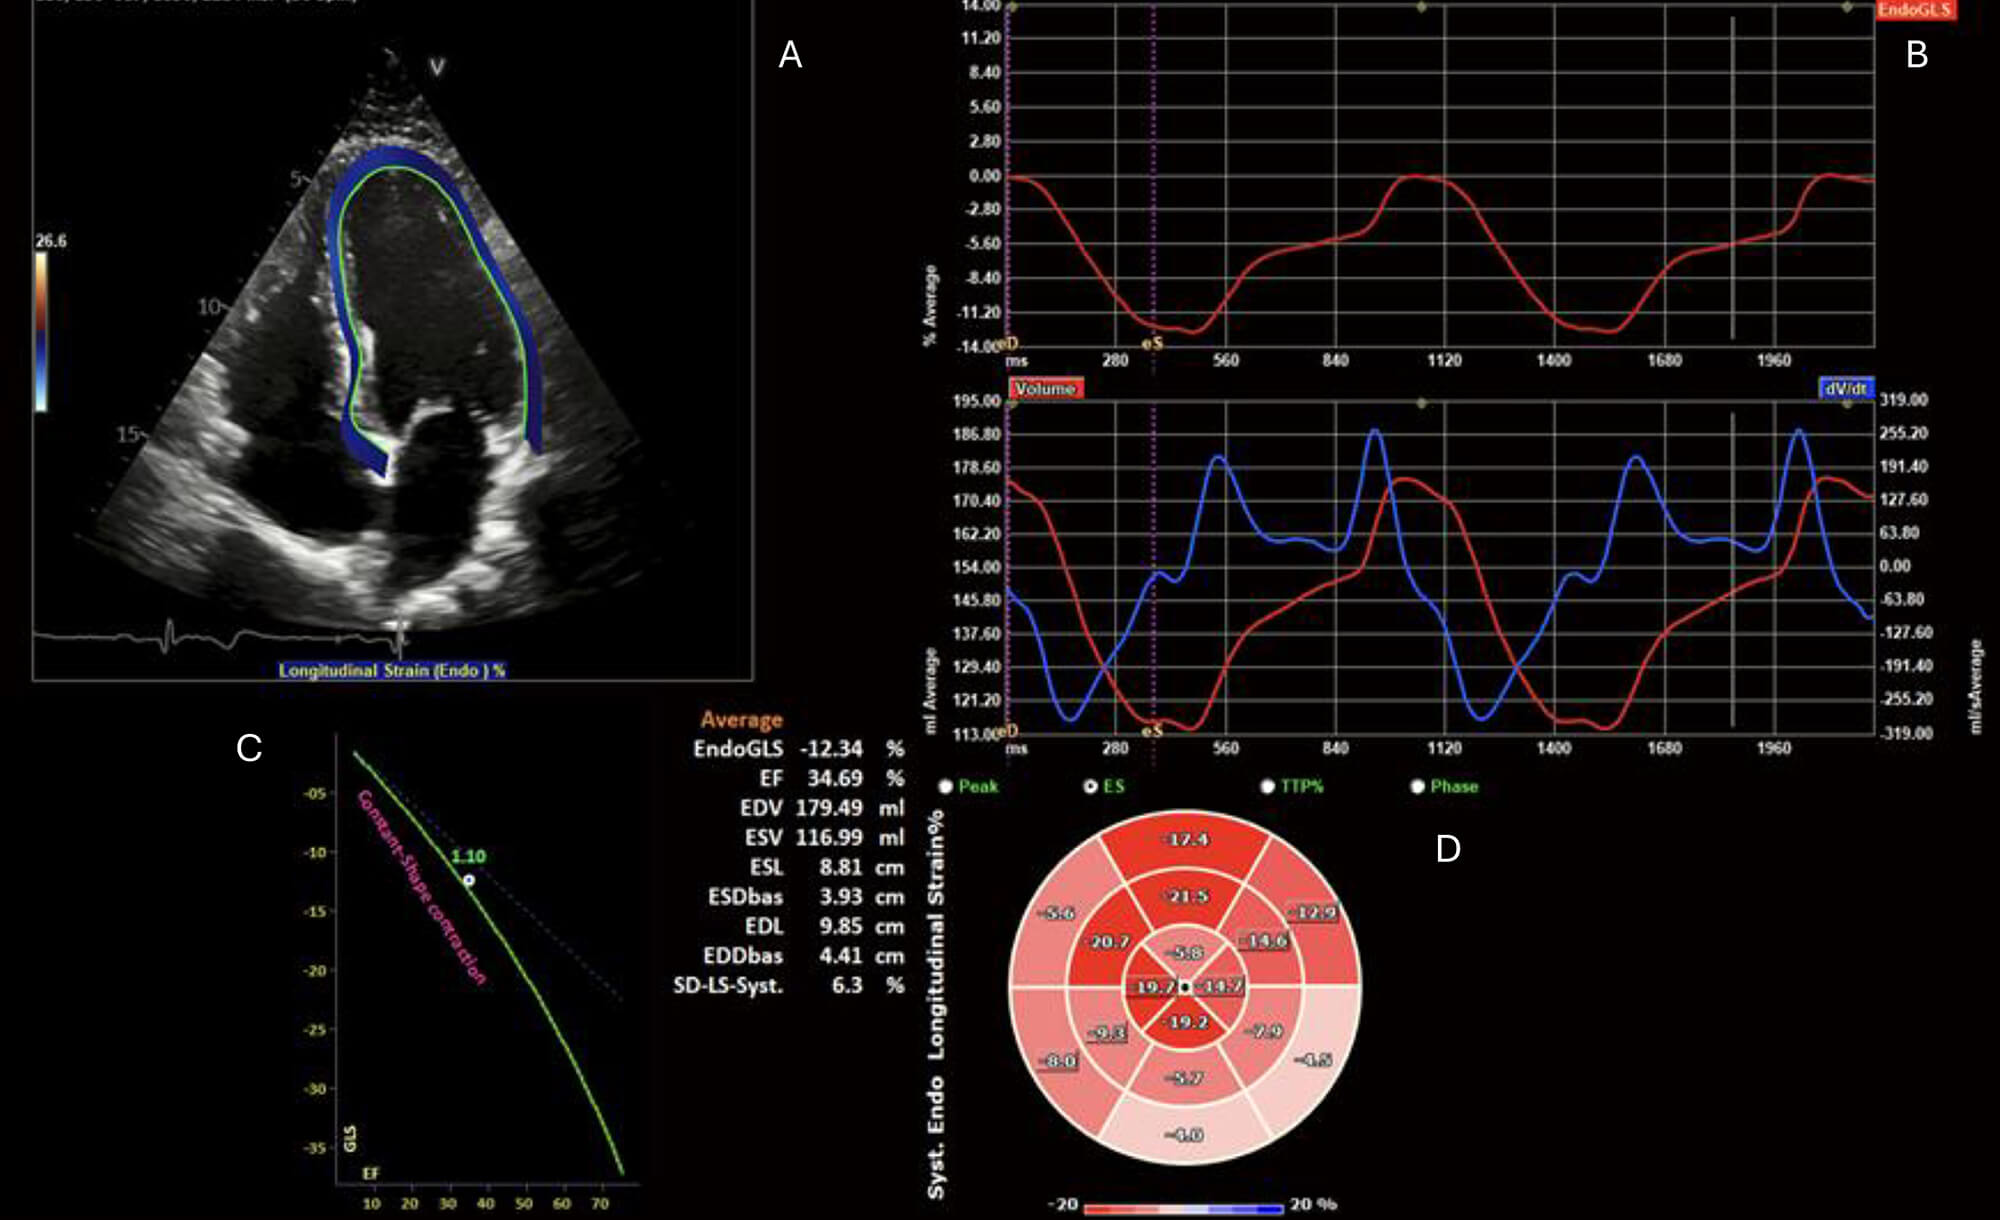 Fig. 1.
Echocardiogram with endocardial speckle tracking and global longitudinal strain analysis. (A) 2D apical 4-chamber view with endocardial border speckle-tracking. (B) Upper: EndoGLS over time (ms), and lower: LV volume curve (red) and dV/dt (blue) over time (ms). (C) Reference plot for global longitudinal strain (GLS) vs LVEF. (D) 16-segment polar map if segmental EndoGLS demonstrating regional reduction in longitudinal strain, particularly affecting the basal inferior and inferolateral segments. ES, End-Systole; TTP, Time to Peak; EndoGLS, endocardial global longitudinal strain; EF, ejection fraction; EDV, End-Diastolic Volume; ESV, End-Systolic Volume; ESL, End-Systolic Length; ESDbas, End-Systolic Diameter, basal; EDL, End-Diastolic Length; EDDbas, End-Diastolic Diameter, basal; SD-LS-Syst., Standard Deviation of Longitudinal Strain during Systole.
Cardiac computed tomography (CT) usually does not play a significant role in the diagnosis of patients with potential myocarditis. In part, this is due to the exposure of a typically younger population to ionising radiation and the limited role that CT plays in tissue characterisation. Cardiac CT can be beneficial in excluding alternative causes of patients presenting with chest pain, especially if there is equipoise between myocardial infarction, aortic dissection, and myocarditis, due to its diagnostic accuracy in assessment of coronary artery and aortic disease [23]. More recent advancements in the field of cardiac CT include extracellular volume (ECV) mapping, iodine enhancement, and photon-counting, which correlate with cardiac magnetic resonance imaging (MRI) findings, and have been utilised in tissue characterisation and diagnosis of myocarditis [24, 25].
Patients with potential myocarditis often present with symptoms and findings mimicking acute coronary syndromes (elevated troponin levels, ischemic electrocardiographic [ECG] changes), and subsequently, invasive coronary angiography is commonly undertaken to exclude obstructive coronary lesions [26].
Considered the non-invasive gold standard for myocardial diagnosis, CMR offers high sensitivity and specificity for the assessment of myocardial function, inflammation and scar, which together provide a comprehensive assessment of myocardial injury [27].
MRI-specific features associated with myocarditis include:
Hyperaemia is identified through early gadolinium enhancement (EGE) following intravenous contrast, reflecting increased vascular permeability and cellular necrosis typical of inflamed myocardium. The EGE ratio, where a value of 4 against reference tissue (typically skeletal muscle) indicates pathology, suggests increased relative myocardial signal intensity by over 45%, a strong indicator of active inflammation. Although EGE initially featured in the 2009 Lake Louise Criteria (LLC) [28], its lower sensitivity and specificity, and variability in image quality, have limited its standalone diagnostic utility, leading to its removal in the 2018 revised LLC. However, EGE can still provide complementary information on vascular changes in myocarditis [29].
The advantages of parametric mapping lie in the ability to provide spatial visualisation and quantification of myocardial tissue changes seen in myocarditis. This allows for better assessment of diffuse disease processes and the study of the evolution of the disease process. T1 mapping measures the longitudinal relaxation time (T1), which is frequently elevated in myocarditis due to oedema, necrosis, or interstitial expansion associated with inflammation (Fig. 2A,B). Native, pre-contrast, T1 mapping is particularly useful for detecting diffuse myocardial oedema or fibrosis that may not be apparent with conventional imaging. It is therefore sensitive, but lacks specificity for the assessment of oedema. T2 mapping quantifies transverse relaxation time (T2), and elevated values serve as a more specific marker for myocardial oedema (Fig. 2C,D). Extracellular volume (ECV) is derived from pre- and post-contrast T1 mapping values and reflects extracellular matrix expansion and is elevated in areas of oedema or scar [30]. Utilising the combination of these three values allows for a comprehensive assessment of areas of myocardial scar and oedema, with the presence of elevated ECV, T1 and T2 being associated with adverse events in myocarditis, including arrhythmia and cardiac mortality [31].
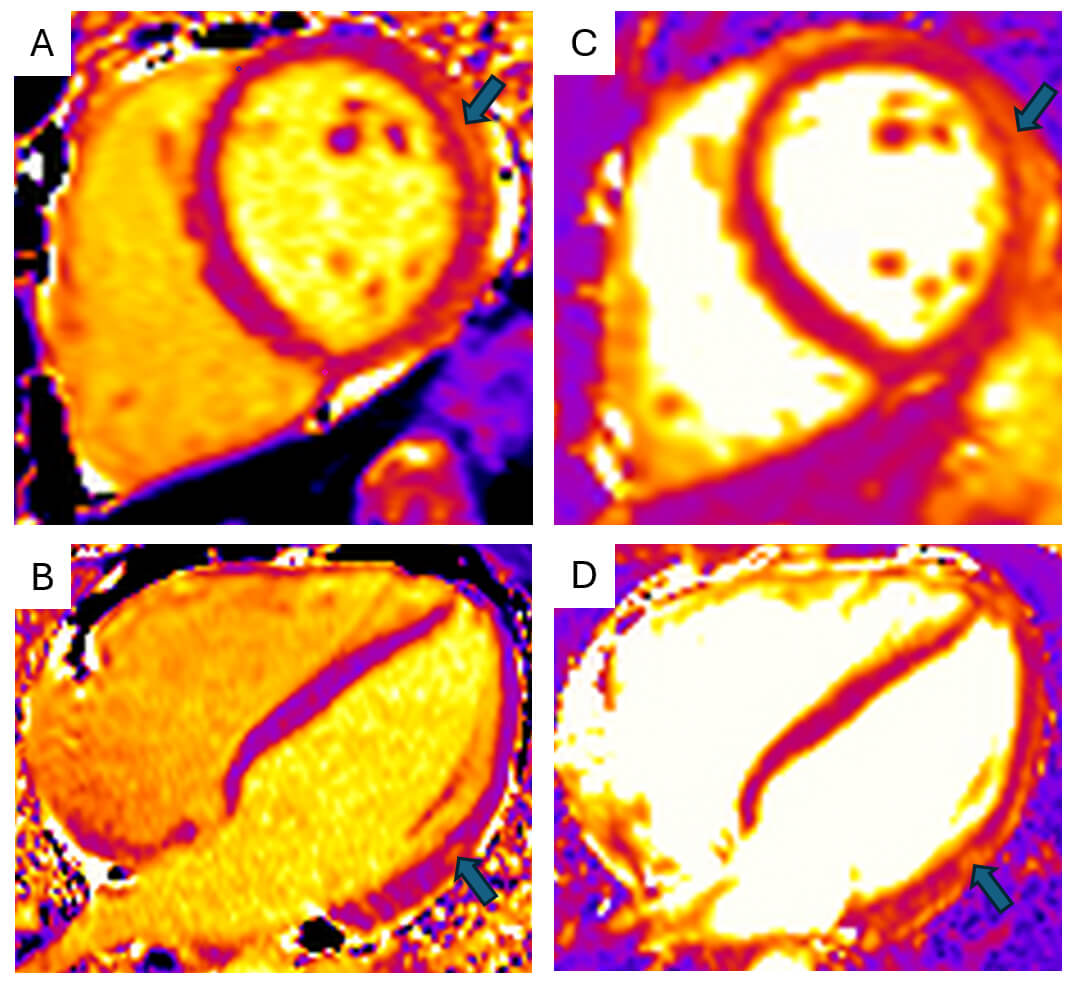 Fig. 2.
Cardiac magnetic resonance parametric mapping. Cardiac magnetic
resonance imaging (MRI) T1 (A,B) and T2 (C,D) mapping of the myocardium in mid
short-axis (A,C) and four-chamber (B,D) views demonstrates focal increases in
relaxation times (T1 = 1281 ms; T2 = 63 ms) within the mid-lateral and
infero-lateral walls (arrows). Images acquired on Siemens Aera 1.5T scanner
(Siemens, London, England) (normal ref range T1
Late gadolinium enhancement (LGE) uses T1-weighted inversion-recovery sequences following gadolinium contrast administration. It identifies focal areas of predominantly myocardial necrosis and fibrosis. In myocarditis, LGE typically appears in subepicardial or mid-wall patterns, often in the inferior/inferolateral segments of the left ventricle (Fig. 3). While signal intensity often diminishes in chronic stages, persistent LGE related to the formation of scar, making it the most reliable indicator of myocarditis in approximately 90% of cases [32], and a valuable marker for long-term prognosis, where presence of LGE in viral myocarditis, is associated with 8.4-fold increase in all-cause mortality, after adjusting for left ventricular function, New York Heart Association (NYHA) functional class and left ventricle end diastolic volumes [33].
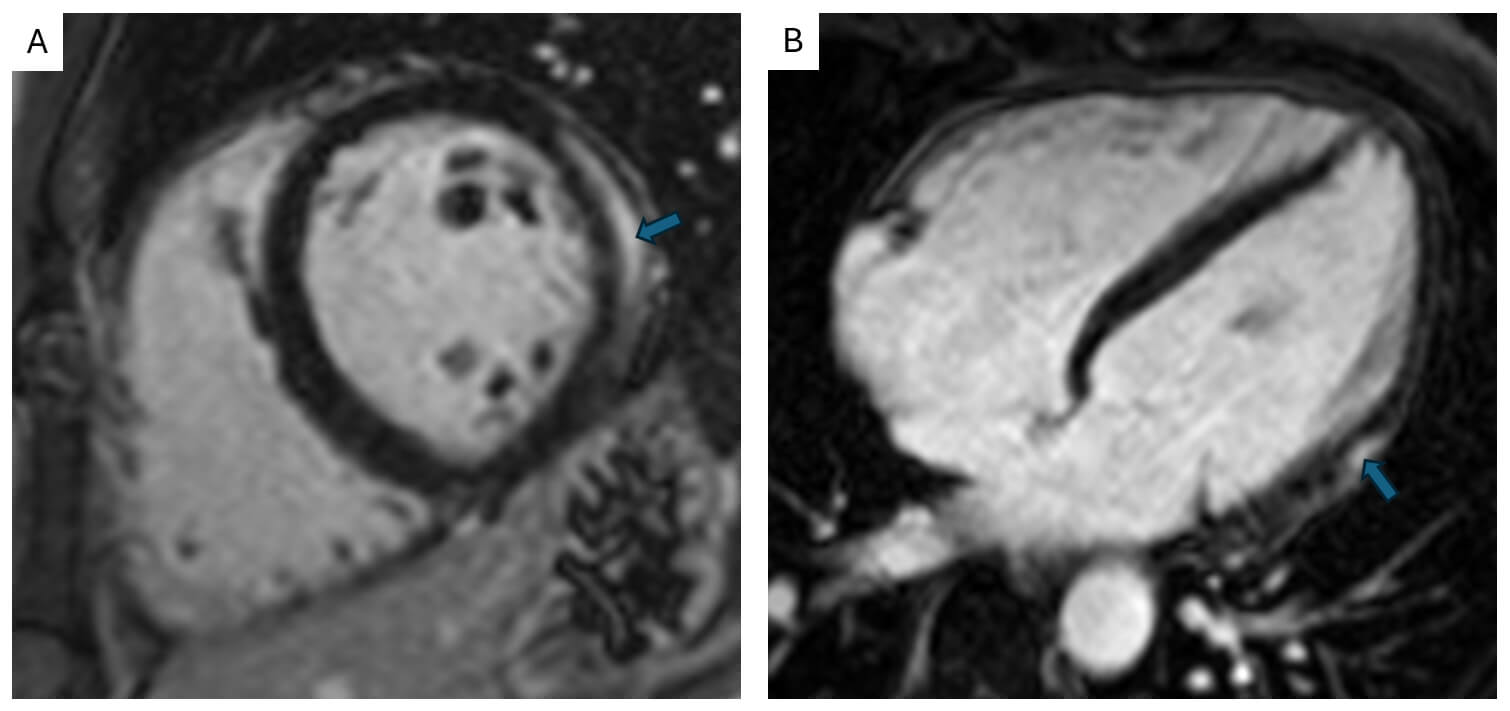 Fig. 3.
Cardiac magnetic resonance late enhancement imaging. Cardiac MRI mid short-axis (A) and four-chamber (B) images demonstrating post-gadolinium mid to subepicardial enhancement in the lateral wall (arrows). Images acquired on Siemens Aera 1.5T scanner (Siemens, London, England).
The CMR appearance of myocarditis depends on the stage of the disease. In the acute phase, CMR typically shows marked myocardial oedema (elevated T2, T1, and ECV) reflecting active inflammation, and early or patchy LGE. Diagnostic sensitivity of CMR is greatest within the first 2–4 weeks after symptom onset, as oedema is most pronounced during this period [34].
In the subacute to chronic phase, myocardial inflammation and oedema generally subside, with normalisation of T1/T2 values. LGE often persists and becomes more organised, indicating progressive fibrosis and early scar formation.
In myocarditis, the LGE pattern most commonly seen is a subepicardial or
mid-wall pattern along the basal to mid inferolateral and inferior segments
[35]. A mid-wall LGE pattern in the interventricular
septum, while less common, has prognostic implications, often associated with
poorer outcomes, and it is important to consider a genetic aetiology in these
cases, such as ACM [36]. In cases of fulminant
myocarditis, imaging may show diffuse myocardial oedema, extensive LGE, and LVSD,
where a left ventricular ejection fraction (LVEF) of
| Pattern of late enhancement | Aetiology | Imaging findings |
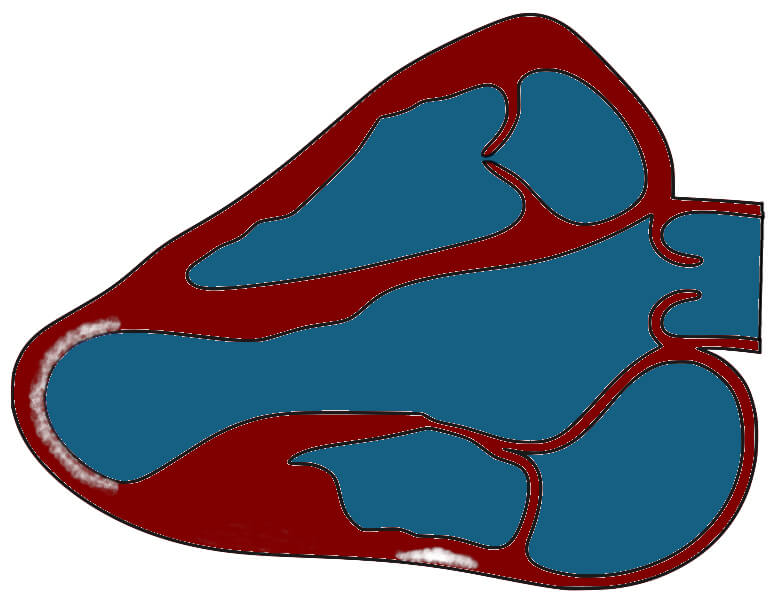
1—Focal late enhancement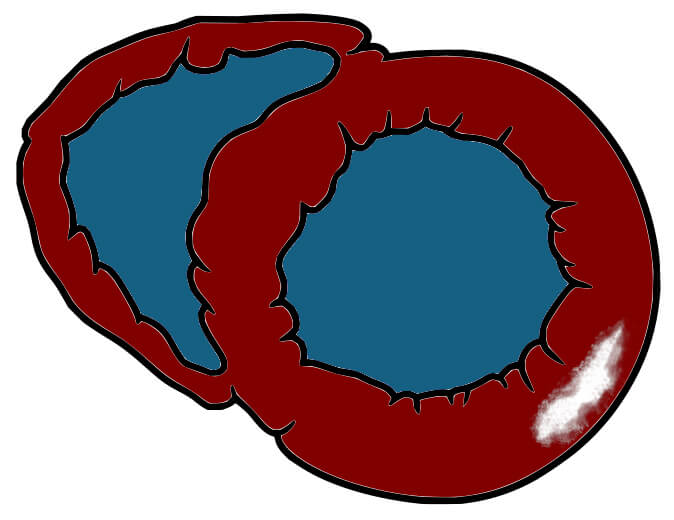 Basal short-axis illustration with inferolateral mid-wall LGE Basal short-axis illustration with inferolateral mid-wall LGE |
Viral, bacterial, systemic lupus erythematosus (SLE), alcohol, radiation | - Viral—Typically, elevated T2 (acutely) with patchy subepicardial late gadolinium enhancement (LGE) in the lateral free wall on CMR [37]. |
| - Bacterial—Septal LGE (diphtheriae and borrelia) [38]. Others are non-specific. | ||
| - SLE is associated with chronic myocardial inflammation, with elevated T1/T2 mapping. LGE is seen in 27–70% of individuals, with a non-ischemic, predominantly mid-wall patchy pattern [39]. | ||
| - GPA is associated with subepicardial to mid-wall LGE in the baso anterolateral and inferolateral segments [40]. | ||
| - Long-term alcohol use is associated with alcoholic cardiomyopathy (dilated and impaired ventricles, mid-wall LGE in approximately 30% of individuals). | ||
| - Radiation myocarditis often demonstrates patchy LGE in particularly irradiated areas and pericardial thickening [41]. | ||
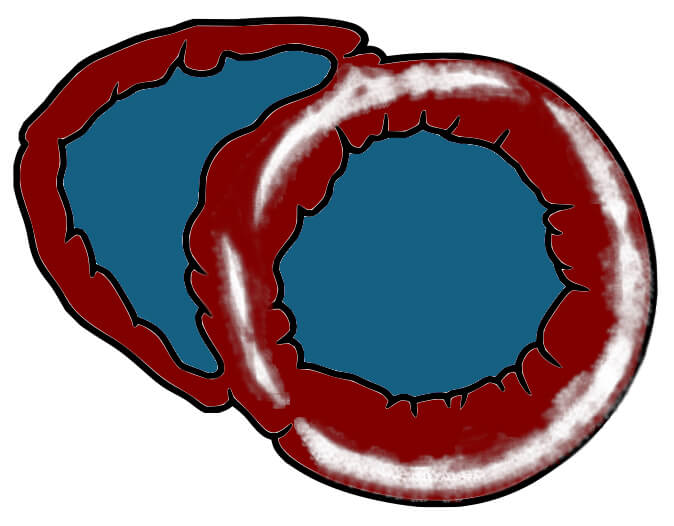
| 2—Focal enhancement and apical aneurysm | Protozoal | - T. Cruzi (Chagas) gives rise to patchy mid to transmural heterogeneous LGE of predominantly the inferolateral, anterolateral/septal segments and apex. Apical aneurysms are not uncommon [42]. |
 |
||
| Three-chamber illustration with mid-wall inferolateral and subendocardial aneurysmal apical LGE | ||
3—Diffuse patchy late enhancement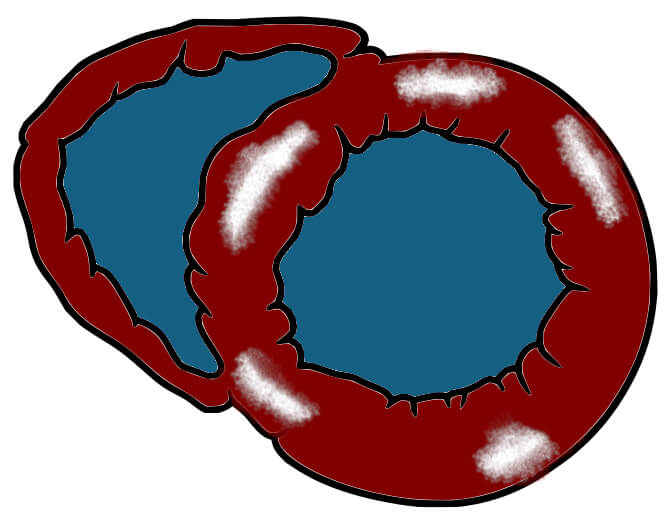 Basal short-axis illustration with diffuse patchy mid-wall LGE Basal short-axis illustration with diffuse patchy mid-wall LGE |
Churg-Strauss (eosinophilic) myocarditis, giant cell myocarditis (GCM), sarcoidosis, toxins and drugs | - Eosinophilic aetiology can demonstrate extensive subendocardial LGE involving the free LV wall and occasionally RV, commonly with pericardial effusion [43]. |
| - GCM can lead to widespread mid-wall and subendocardial LGE, with both LV (in particular right-sided septum, anterior wall) and subendocardial RV involvement [44]. | ||
| - Sarcoidosis can cause patchy, mid-wall/subepicardial, multifocal LGE, often involving the basal septum and LV inferolateral walls, with subendocardial sparing. It may also affect the RV free wall [45]. | ||
| - Doxorubicin is associated with mid-wall septal LGE, globally elevated ECV and early strain reduction. | ||
| - Cocaine is associated with patchy mid-wall to transmural LGE (dependent on coronary involvement) and elevated T1/T2 acutely [46]. | ||
| - IL-2 inhibitors can cause widespread patchy mid-wall LGE. | ||
| 4—Near global late enhancement | Arrhythmogenic cardiomyopathy | - Both desmosomal (DSP, PKP2) and non-desmosomal (FLNC, LMNA) mutations can cause patchy to near global late enhancement, with a predominantly epicardial to mid-wall pattern [47]. |
 |
||
| Basal short-axis illustration with near global mid-wall to epicardial LGE |
Notes: CMR, cardiovascular magnetic resonance; LV, left ventricular; RV, right ventricular; ECV, extracellular volume; DSP, desmoplakin; PKP2, plakophilin 2; FLNC, filamin C; LMNA, lamin A/C; IL-2, Interleukin-2.
The original LLC, introduced in 2009, provided foundational diagnostic criteria for acute myocarditis on CMR [28], requiring at least two of three findings: heightened T2-weighted myocardial signal, early gadolinium enhancement (EGE), and LGE in a non-ischemic distribution. With the advent and evolution of parametric mapping, the 2018 revised LLC incorporated T1 and T2 imaging, which enhances diagnostic sensitivity (73% vs. 88%, p = 0.03) while maintaining high specificity at 96% [49, 50]. The updated LLC requires that each of the two categories be satisfied, namely:
- The presence of a T1-based indicator of myocardial injury, such as non-ischemic LGE, increased native T1, or extracellular volume (ECV).
- A T2-based indicator of myocardial oedema such as regional elevated T2-signal
intensity/increased T2 relaxation time or increased global T2 ratio (
The combination of the above provides robust evidence of myocardial inflammation in patients with high clinical suspicion of myocarditis. Supportive criteria include evidence of pericardial inflammation or LVSD. However, one of the main drawbacks of parametric techniques is the requirement for local reference ranges, as values are scanner-specific and require local calibration, and thus should be interpreted accordingly [30].
There are a variety of different protocols proposed to assess myocarditis. However, the Society for Cardiovascular Magnetic Resonance (SCMR) has published standardised protocols to ensure consistency in CMR studies [51].
The 2020 update emphasises sequences such as cine imaging for functional assessment, T2-weighted imaging for oedema detection, T1 mapping for fibrosis evaluation, and LGE for identifying necrosis or scar tissue, with the aim of streamlining CMR procedures and enhancing diagnostic accuracy. Myocarditis protocol recommendations are summarised below (Table 3).
| Sequence | Purpose | Views | Parameters/Notes |
| Cine imaging (SSFP) | Ventricular dimensions, function and wall motion assessment | Short-axis stack, 2-chamber, 3-chamber, 4-chamber | - Balanced steady-state free precession (bSSFP) imaging. - Temporal resolution |
| T2-weighted imaging (T2WI) | Oedema detection | Short-axis stack | - Acquired using T2-STIR or turbo spin echo (TSE) techniques with fat suppression. |
| - Increased signal intensity indicates myocardial oedema due to inflammatory response, i.e., myocardial: skeletal muscle SI ratio | |||
| - Typical TE: 60–80 ms; TR: | |||
| - Use a 3-Tesla scanner for a higher signal-to-noise ratio. | |||
| T2 mapping | Quantitative assessment of oedema | Short-axis basal, mid and apical slices | - Provides pixel-wise quantification of myocardial T2 relaxation times. - T2 values |
| - Gradient-echo or spin-echo sequences are used for mapping. | |||
| - Avoid T2 shine-through artefact. | |||
| Pre-contrast T1 mapping | Quantitative assessment of fibrosis, oedema or infiltration | Short-axis basal, mid and apical slices | - Performed pre-contrast using modified Look-Locker inversion recovery (MOLLI) or ShMOLLI sequence. |
| - Native T1 values | |||
| - Slice thickness: 8 mm; In-plane resolution: approximately 1.2 | |||
| First pass perfusion imaging + EGE (optional) | Evaluate for hyperaemia and microvascular dysfunction | Short-axis basal, mid and apical slices | - Performed during the first pass of gadolinium bolus (0.05–0.1 mmol/kg) using T1-weighted fast gradient echo imaging. |
| - Temporal resolution | |||
| - Primarily, if concurrent ischemia is suspected, stress perfusion using vasodilators (e.g., adenosine) may be included. | |||
| Late gadolinium enhancement | Detects scar/fibrosis or necrosis | Short-axis stack, 2-chamber, 3-chamber, 4-chamber | - Acquired 10–20 minutes post-intravenous injection of 0.1–0.2 mmol/kg of gadolinium-based contrast agent. -TI scout to null normal myocardium (approximately 250–350 ms @ 1.5T). |
| - Phase-sensitive inversion recovery (PSIR) is preferred for enhanced contrast resolution. | |||
| - Inversion time (TI) adjusted to null normal myocardium (approximately 250–350 ms at 1.5T). | |||
| Post-contrast T1 mapping (optional) | Extracellular volume (ECV) fraction | Short-axis basal, mid and apical slices | - Requires paired pre- and post-contrast T1 mapping and haematocrit measurement. - Typical ECV |
| - MOLLI sequences optimised for T1 quantification (TI approximately 600–700 ms pre-contrast, approximately 400 ms post-contrast at 1.5T). |
Note: All values provided as examples; please use local reference ranges. STIR, Short Tau Inversion Recovery; SI, signal intensity; TE, Echo Time; TR, Repetition Time; SSFP, steady-state free precession; ShMOLLI, shortened modified Look-Locker inversion recovery; EGE, early gadolinium enhancement.
Longitudinal assessment of patients with myocarditis is important to monitor disease activity, guide return to exercise, especially in performance athletes, and assess cardiac function, which informs ongoing treatment and prognosis [52, 53]. Repeat imaging is typically performed 6 months after the index presentation, and in the majority of patients, left ventricular (LV) systolic function is either normal at baseline or resolves at follow-up [54]. Persistent LV systolic dysfunction, especially in the initial setting of fulminant myocarditis, relays a worse prognosis [55]. A strength of utilising follow-up CMR is the ability to characterise the myocardium, in particular oedema and fibrosis. There is uncertainty regarding the prognostic presence of persistent oedema on follow-up CMR, with reports of elevated values associated with improved prognosis, possibly relating to the potential for resolution and recovery [56], and others linking normalisation of T2 values with clinical recovery, suggesting a healed stage of the disease [57]. However, consensus lies with the persistent presence and extent of isolated LGE, suggesting scar formation, which is associated with worse outcomes such as ventricular arrhythmia, and necessitates longer-term follow-up [31, 34, 56].
Recognised by the 2021 European Society of Cardiology (ESC) heart failure guidelines, CMR is a first-line (or Class I) investigation for the investigation of suspected myocarditis, with a recommendation for follow-up imaging in those who have LVSD, arrhythmias or ECG abnormalities [58]. In addition, the American Heart Association (AHA) and American College of Cardiology (ACC) guidelines strengthen these recommendations, giving CMR a class 1B recommendation for evaluation of chest pain in suspected myocarditis [23]. The AHA/ACC guidelines, specifically, underscore MRI’s utility with LGE for differentiating myocarditis from other aetiologies of myocardial injury where coronary arteries are unobstructed (i.e., myocardial infarction with non-obstructive coronary arteries [MINOCA]) and when there is diagnostic uncertainty.
Beyond traditional measures, strain analysis quantifies myocardial deformation by tracking the motion of tissue (pixels) throughout the cardiac cycle, offering sensitive detection of subtle functional changes, and can be applied across imaging modalities, including echocardiography and CMR. CMR offers new modalities to evaluate myocardial strain through feature tracking techniques, and is considered superior to strain via echocardiography, especially for regional abnormalities [59, 60].
CMR-derived myocardial strain analysis detects deformation, torsion, and synchrony impairments, which may be present even in myocarditis patients with normal ejection fraction [61]. Recent data underscore the enhanced diagnostic sensitivity and prognostic value of strain parameters, particularly global longitudinal strain (GLS), in myocarditis, with predictive utility extending beyond traditional measures such as LVEF and LGE [62]. GLS has been identified as an independent predictor of adverse cardiac outcomes, including mortality, ventricular arrhythmia, and heart failure hospitalisation, with a hazard ratio of 1.21 (95% confidence interval [CI]: 1.08–1.36, p = 0.001) [63]. Furthermore, incorporating GLS into a multivariable predictive model significantly improved diagnostic accuracy [63].
Positron emission tomography (PET) is not routinely employed for diagnosing acute myocarditis or chronic inflammatory cardiomyopathy. However, it can be a useful non-invasive diagnostic tool for stable patients who are unable to undergo CMR imaging or for those with suspected systemic autoimmune diseases affecting multiple organs.
F-fluoro-deoxy-glucose (FDG) cardiac PET/CT provides an assessment of myocardial inflammation through the use of increased FDG uptake. It requires patients to undergo dietary preparation through a low-carbohydrate/high-fat diet and fasting prior to the scan, to allow suppression of physiological FDG. Despite these precautions, 10–15% of cardiac PET scans may fail diagnostically due to inadequate suppression of physiological glucose uptake. FDG PET/CT has been found to be able to localise inflammation within the myocardium in case-based publications [64, 65], but lacks prospective randomised trials in its assessment of myocarditis diagnosis.
PET has gained particular utility in diagnosing and managing cardiac sarcoidosis (CS). The technique leverages the avid glucose uptake by active inflammatory cells within sarcoid granulomas. Cardiac PET is often combined with whole-body imaging to assess extracardiac involvement. A meta-analysis of 17 studies including 891 patients with suspected CS reported a sensitivity of 84% and a specificity of 83% for PET imaging [66]. Additionally, PET serves as a valuable modality for monitoring disease progression and evaluating response to immunosuppressive therapy. The usefulness of PET/CT is likely to grow, especially in multi-system conditions where it can give information for more than just the heart [67].
A relatively new field in medical science, radiomics uses image analysis to extract large volumes of quantitative features (texture, shape, and intensity) from medical imaging [68]. Such data can then be leveraged in combination with machine learning (ML) and artificial intelligence (AI) techniques to provide enhanced abilities in disease classification, prognosis, treatment response and early detection [69]. Cardiac MRI is an attractive avenue for radiomics due to the large volume of spatial data, including functional data and tissue characterisation, where a typical workflow incorporates the extraction of hundreds to thousands of quantitative features, followed by pattern analysis with ML techniques. One of the challenges arising in CMR assessment of myocarditis is differentiating it from focal myocardial infarction. Radiomic techniques such as texture analysis (TA), which involves assessing spatial variations in pixel intensity, have been utilised in T1 and T2 mapping for myocarditis, with TA demonstrating a sensitivity and specificity for the diagnosis of acute, infarct-like myocarditis that was significantly greater than the Lake Louise Criteria (area under the curve [AUC]: 0.88 vs. 0.62) [70]. In addition, radiomic and ML techniques have been used to predict a composite of death, heart failure hospitalisation, ventricular arrhythmia and recurrent myocarditis in patients with suspected myocarditis (AUC: 0.8) based on LGE features [71], and to identify varying patterns of CMR inflammation in ethnically diverse populations [72].
Incorporation of machine learning techniques into MRI assessment of myocarditis is in its relative infancy, and suffers from limited data sets, single-centre data, and heterogeneous methodologies [73]. However, these hurdles are likely to be overcome with the rapid development of AI platforms and technological advances, with the ability to share large volumes of data [74]. Further research is required to maximise the potential of AI in transforming diagnostic and prognostic approaches in myocarditis.
A multi-modality cardiac imaging approach is key in the workup of potential myocarditis. All patients should undergo echocardiography in the first instance, and where available, CMR is the next investigation of choice. It is important in establishing aetiology, excluding alternative diagnoses and aiding prognostication and risk stratification, along with guiding therapeutic decision making. There have been recent advancements in risk stratification in myocarditis; however, there remains considerable uncertainty regarding optimal treatment strategies and the timing of interventions, particularly with respect to immunomodulatory therapies. Improvements in current echocardiographic and CMR techniques, along with newer approaches like radiomics and strain, are poised to expand the diagnostic and prognostic capabilities, but further research is needed to refine risk assessment, clarify therapeutic approaches, and ultimately improve patient outcomes in this heterogeneous condition.
Not applicable.
MS: Conceptualization, Investigation, Methodology, Project administration, Resources, Writing—original draft, Writing—review & editing. GS: Writing—original draft, Investigation, Methodology, Writing—review & editing. AS: Investigation, Writing—review & editing. AC: Investigation, Writing—review & editing. DB: Resources, Investigation, Writing—review & editing. DS: Conceptualization, Resources, Writing—review & editing. All authors contributed to the important editorial changes in the manuscript. All authors read and approved the final manuscript. All authors have participated sufficiently in the work and agreed to be accountable for all aspects of the work.
Images incorporated within this review are fully anonymised recordings. In accordance with General Medical Council (GMC) guidance, informed consent was not required. The research was conducted in strict accordance with the ethical principles outlined in the Declaration of Helsinki.
MS is supported by the British Society of Heart Failure (Grant no. BSHFellowMS), Charity no: 1075720. GS is supported by a British Heart Foundation fellowship (FS/CRTF/22/24368). AS is supported by a British Heart Foundation fellowship (FS/CRTF/24/24686). AC is supported by a British Heart Foundation fellowship (FS/CRTF/21/24175). DB is supported by a Medical Research Council Clinician Scientist Fellowship (MR/X001881/1). The funders played no role in the writing of the manuscript or in the decision to submit the paper for publication. They accept no responsibility for the contents. The authors would like to thank the King’s College Hospital Cardiac MRI department for their assistance in image acquisition.
This research received no external funding.
The authors declare no conflict of interest.
References
Publisher’s Note: IMR Press stays neutral with regard to jurisdictional claims in published maps and institutional affiliations.