
- Academic Editor
Background: Pre-eclampsia is a serious disorder associated with
pregnancy, but its etiology remains poorly understood. In this study, we aimed to
explore the shared genes and molecular pathways between pre-eclampsia and type 2
diabetes mellitus (T2DM). Methods: The record of 2160 pregnant women who
had pre-eclampsia risk assessed by placental growth factor (PIGF) levels in
Fuyang People’s Hospital, China were retrospectively reviewed. The microarray
datasets of pre-eclampsia and T2DM were searched in the Gene Expression Omnibus
(GEO) and were downloaded for secondary analysis. Results: According to
the PIGF stratification, the high-risk group had a significantly higher
proportion of T2DM than the low-risk group (51/326, 15.6% vs. 1.4%,
p
Pre-eclampsia (PE) is a severe disorder associated with pregnancy, affecting about 4–5% of pregnancies worldwide [1, 2]. It is characterized as the onset of hypertension after 20 weeks of pregnancy and is accompanied by proteinuria, which may become a severe disorder causing maternal and fetal morbidity and mortality [2].
The etiology of pre-eclampsia remains poorly understood. It is currently defined as a cumulative placental and maternal dysfunction, triggered by a series of genetic alterations (such as FLT1, MECOM, FGF5 and SH2B3 SNPs) [3, 4], maternal and immunological factors (hypertension, kidney disease, diabetes, autoimmune diseases) [2, 5]. These factors might increase the risk of abnormal placentation (such as incomplete spiral artery remodeling) and the release of antiangiogenic factors (such as soluble fms-like tyrosine kinase 1, sFLT1 and soluble endoglin, sEng) from the ischemic placenta into the maternal circulation [2, 5]. Due to the growing understanding of the pathogenesis, some novel therapeutic strategies, such as administration of recombinant vascular endothelial growth factor (VEGF) and placental growth factor (PIGF) and selective inhibition of sFLT1 have been proposed [2, 5]. However, delivery of the fetus remains the only definitive treatment for pre-eclampsia [2].
One previous meta-analysis of genome-wide association scans (GWAS) identified positive genetic correlations between pre-eclampsia and both systolic and diastolic blood pressure, hypertension, coronary artery disease and type 2 diabetes mellitus (T2DM) [4], suggesting that these diseases may share some gene signatures and molecular pathways in common. T2DM is characterized by insulin resistance, with the loss of reactive insulin receptors and weakened downstream signals, resulting in excessive compensatory production of insulin, leading to both hyperglycemia and hyperinsulinemia [6]. Obesity is a shared risk factor for pre-eclampsia and T2DM [6]. A clear understanding of the inter-relational molecular mechanisms might help identify biomarkers for diagnosis, prediction or treatment of pre-eclampsia.
In this study, we aimed to explore the shared genes and molecular pathways between pre-eclampsia and T2DM, using available gene expression datasets from the Gene Expression Omnibus (GEO).
This study was approved by the ethics committee of Fuyang People’s Hospital,
Fuyang, China (Approval No. 2022-176). To characterize the association between
the risk of pre-eclampsia in pregnant women with or without pre-existing T2DM, we
retrospectively checked the record of 2160 pregnant women who had pregnancy
check-ups in Fuyang People’s Hospital, China in 2020–2021. Their risk of
pre-eclampsia was assessed by serum placental growth factor (PIGF) levels using
commercial ELISA kit (batch number: AL3030, PerkinElmer Medical Laboratory, Suzhou, Jiangsu, China). The cut-off values of PIGF were provided by the kit manual according to
the pregnant weeks. Risk group stratification was performed according to the
specific cutoff values. The low-risk group was defined as the test result
We used the keywords “pre-eclampsia” or “type 2 diabetes” to search relevant
gene expression datasets in the GEO database (http://www.ncbi.nlm.nih.gov/geo/).
The following criteria were applied to identify datasets included for this study:
(1) Samples included both disease and healthy controls. (2) Size
WGCNA was performed following standard procedures introduced previously [17].
The gene expression profile in GSE75010 was used to calculate the Median Absolute
Deviation (MAD) of each gene. The first 50% of the genes with the smallest MAD
were eliminated. Then, the GoodSamplesGenes method of R software (v4.2.1, R Core
Team 2021, https://www.r-project.org/) package WGCNA was used. The modules with
For GO annotation, we used genes in the R software package org. Hs. eg. db
(version 3.1.0, https://www.r-project.org/) as the background. For KEGG
enrichment analysis, we used KEGG rest API
(https://www.kegg.jp/kegg/rest/keggapi.html) to obtain the latest KEGG
Pathway gene annotation as the background. The shared genes were mapped genes to
the background set for enrichment analysis, by using the R software package
clusterProfiler (version 3.14.3). The following parameters were set: minimum gene
set: 5; the maximum gene: 5000; p value of
The association between the risk of pre-eclampsia and pre-existing T2DM of the
2160 pregnant women was summarized in Table 1. Results showed that the group with
T2DM had significantly higher age at the pregnancy (34.4
| Parameters | T2DM | p | ||
|---|---|---|---|---|
| N (n = 2082) | Y (n = 78) | |||
| Age (mean |
29.1 |
34.4 |
||
| PE-risk (by PIGF) | ||||
| Low | 1807 | 27 | ||
| High | 275 | 51 | ||
PE, Pre-eclampsia; SD, standard deviation; PIGF, placental growth factor; T2DM, type 2 diabetes mellitus; N, No; Y, Yes.
The information of the pre-eclampsia and T2DM datasets were summarized in Table 2, including GSE number, study design, sample number, tissue sources and detection platforms.
| Dataset ID | Study design | Tissue sources | Array platform |
|---|---|---|---|
| GSE75010 | PE placentas (n = 80) vs. non-PE placentas (n = 77) | Human placentas | Affymetrix 1.0 ST |
| GDS3681 | T2DM (n = 10) vs. control (n = 20) | Human skeletal muscle | Affymetrix U95Av2 |
| GDS3715 (G1) | T2DM (n = 15) vs. insulin sensitive (n = 20) | Human skeletal muscle | Affymetrix U95A |
| GDS3715 (G2) | T2DM (n = 15) vs. insulin resistant (n = 20) | Human skeletal muscle | Affymetrix U95A |
| GSE25462 (G1) | T2DM (n = 10) vs. control (no family history of T2DM, n = 15) | Human skeletal muscle | Affymetrix U133 Plus 2.0 |
| GSE25462 (G2) | T2DM (n = 10) vs. control (with family history of T2DM, n = 25) | Human skeletal muscle | Affymetrix U133 Plus 2.0 |
| GSE19420 (G1) | T2DM before training (n = 10) vs. pre-diabetes subjects (n = 12) | Human skeletal muscle | Affymetrix U133 Plus 2.0 |
| GSE19420 (G2) | T2DM after training (n = 8) vs. pre-diabetes subjects (n = 12) | Human skeletal muscle | Affymetrix U133 Plus 2.0 |
| GSE19420 (G3) | T2DM before training (n = 10) vs. normoglycemic controls (n = 12) | Human skeletal muscle | Affymetrix U133 Plus 2.0 |
| GSE19420 (G4) | T2DM after training (n = 8) vs. normoglycemic controls (n = 12) | Human skeletal muscle | Affymetrix U133 Plus 2.0 |
| GSE18732 (G1) | T2DM (n = 20) vs. normal muscle (n = 20) | Human skeletal muscle | Affymetrix U133 Plus 2.0 |
| GSE18732 (G2) | T2DM (n = 20) vs. muscle glucose intolerant (n = 20) | Human skeletal muscle | Affymetrix U133 Plus 2.0 |
| GSE15932 | T2DM (n = 8) vs. control (n = 8) | Human peripheral blood | Affymetrix U133 Plus 2.0 |
| GSE13760 | T2DM (n = 10) vs. control (n = 11) | Human arterial tissue | Affymetrix U133 Plus 2.0 |
| GSE9006 | T2DM (n = 12) vs. control (n = 24) | Human peripheral blood | Affymetrix U133 Plus 2.0 |
| GSE25724 | T2DM (n = 6) vs. control (n = 7) | Human islets | Affymetrix U133A |
| GSE23343 | T2DM (n = 10) vs. control (n = 7) | Human liver biopsies | Affymetrix U133 Plus 2.0 |
52 weeks of exercise training was conducted in GSE19420.
PE, Pre-eclampsia; T2DM, type 2 diabetes mellitus.
WGCNA was performed to identify the key modules and genes associated with
pre-eclampsia using data from GSE75010. The soft-thresholding power was set to
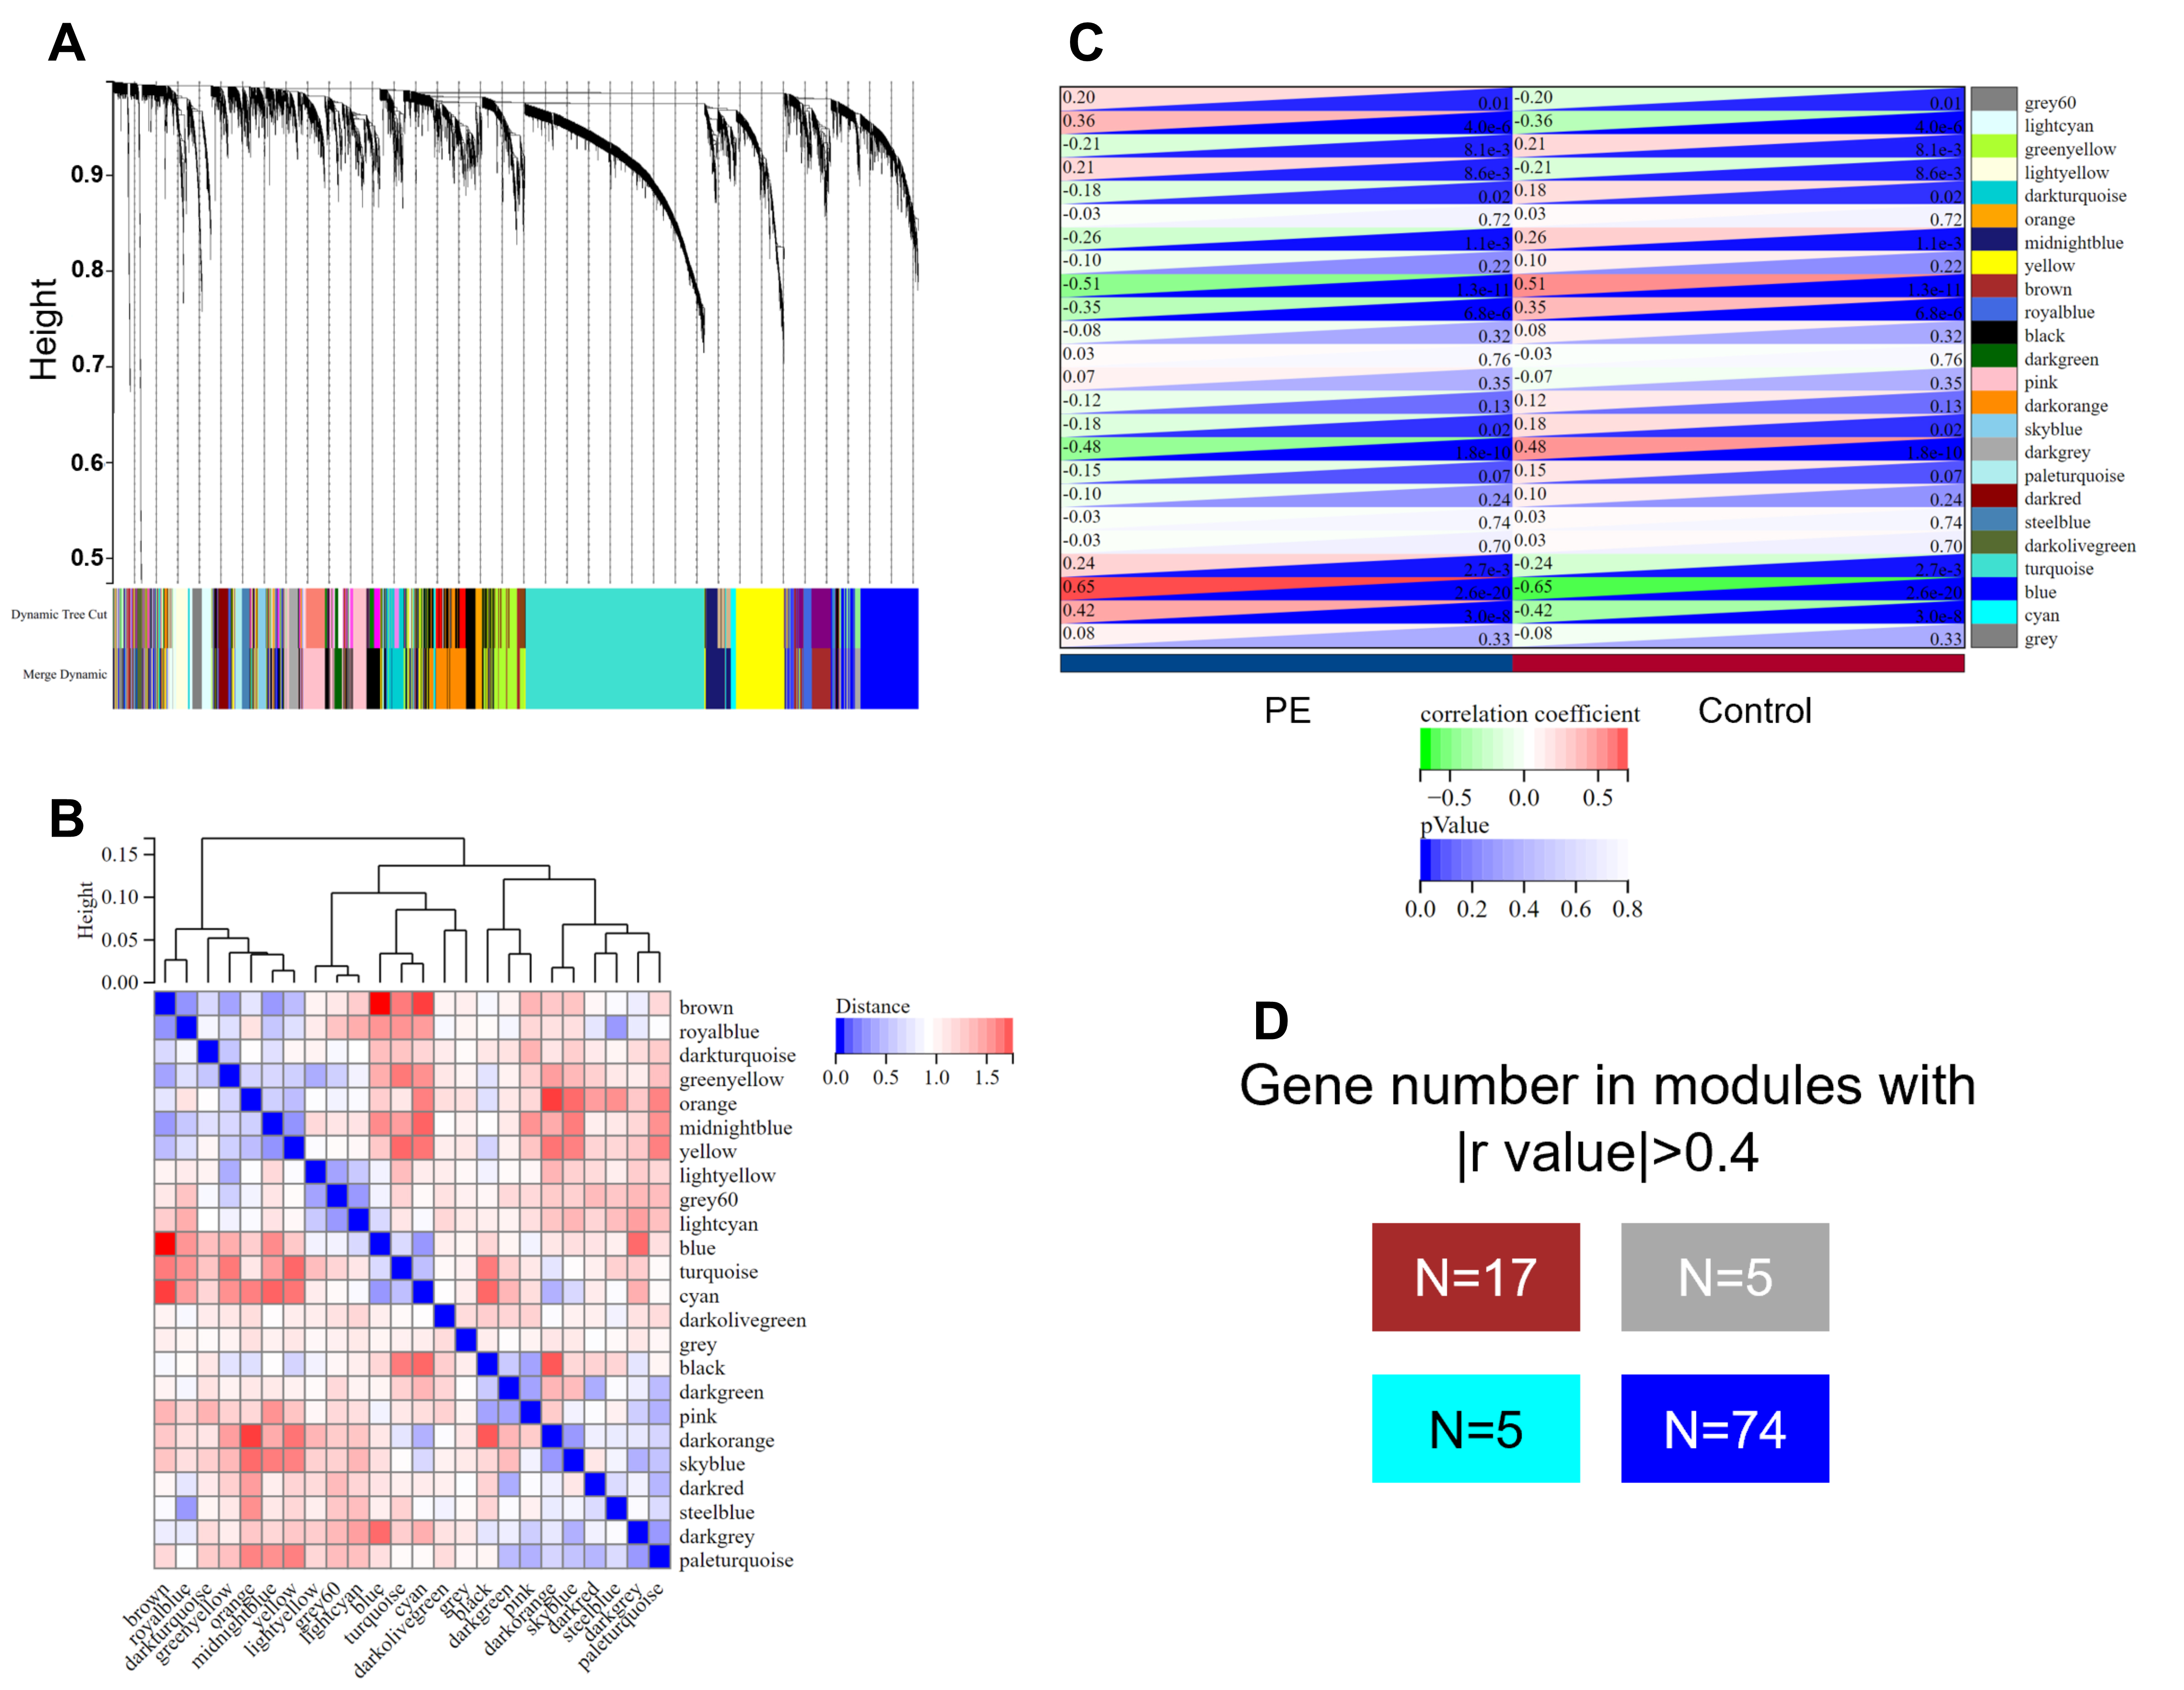 Fig. 1.
Weighted gene co-expression network analysis (WGCNA) of genes
related in pre-eclampsia. (A,B) The cluster dendrogram (A) and heatmap (B) of
co-expression genes in pre-eclampsia in GSE75010. (C) Module-trait relationships
in pre-eclampsia in GSE75010. Each cell contains the corresponding correlation
and p-value. (D) A block matrix showing the modules with
For the 10 datasets included to identify dysregulated genes in T2DM, we
introduced a strict criteria (FDR-adjusted (adj.) p value
| Dataset ID | No. of dysregulated genes (adj. p |
|---|---|
| GDS3681 | 0 |
| GDS3715 (G1) | 5 |
| GDS3715 (G2) | 144 |
| GSE25462 (G1) | 0 |
| GSE25462 (G2) | 1 |
| GSE19420 (G1) | 0 |
| GSE19420 (G2) | 0 |
| GSE19420 (G3) | 0 |
| GSE19420 (G4) | 0 |
| GSE18732 (G1) | 0 |
| GSE18732 (G2) | 0 |
| GSE15932 | 0 |
| GSE13760 | 0 |
| GSE9006 | 1652 |
| GSE25724 | 3576 |
| GSE23343 | 0 |
adj, adjusted.
By comparing the genes in PE modules and dysregulated genes related to T2DM, we identified an overlapping geneset containing 30 members (Fig. 2). We hypothesized that these genes are highly related to the pathogenesis of both pre-eclampsia and T2DM.
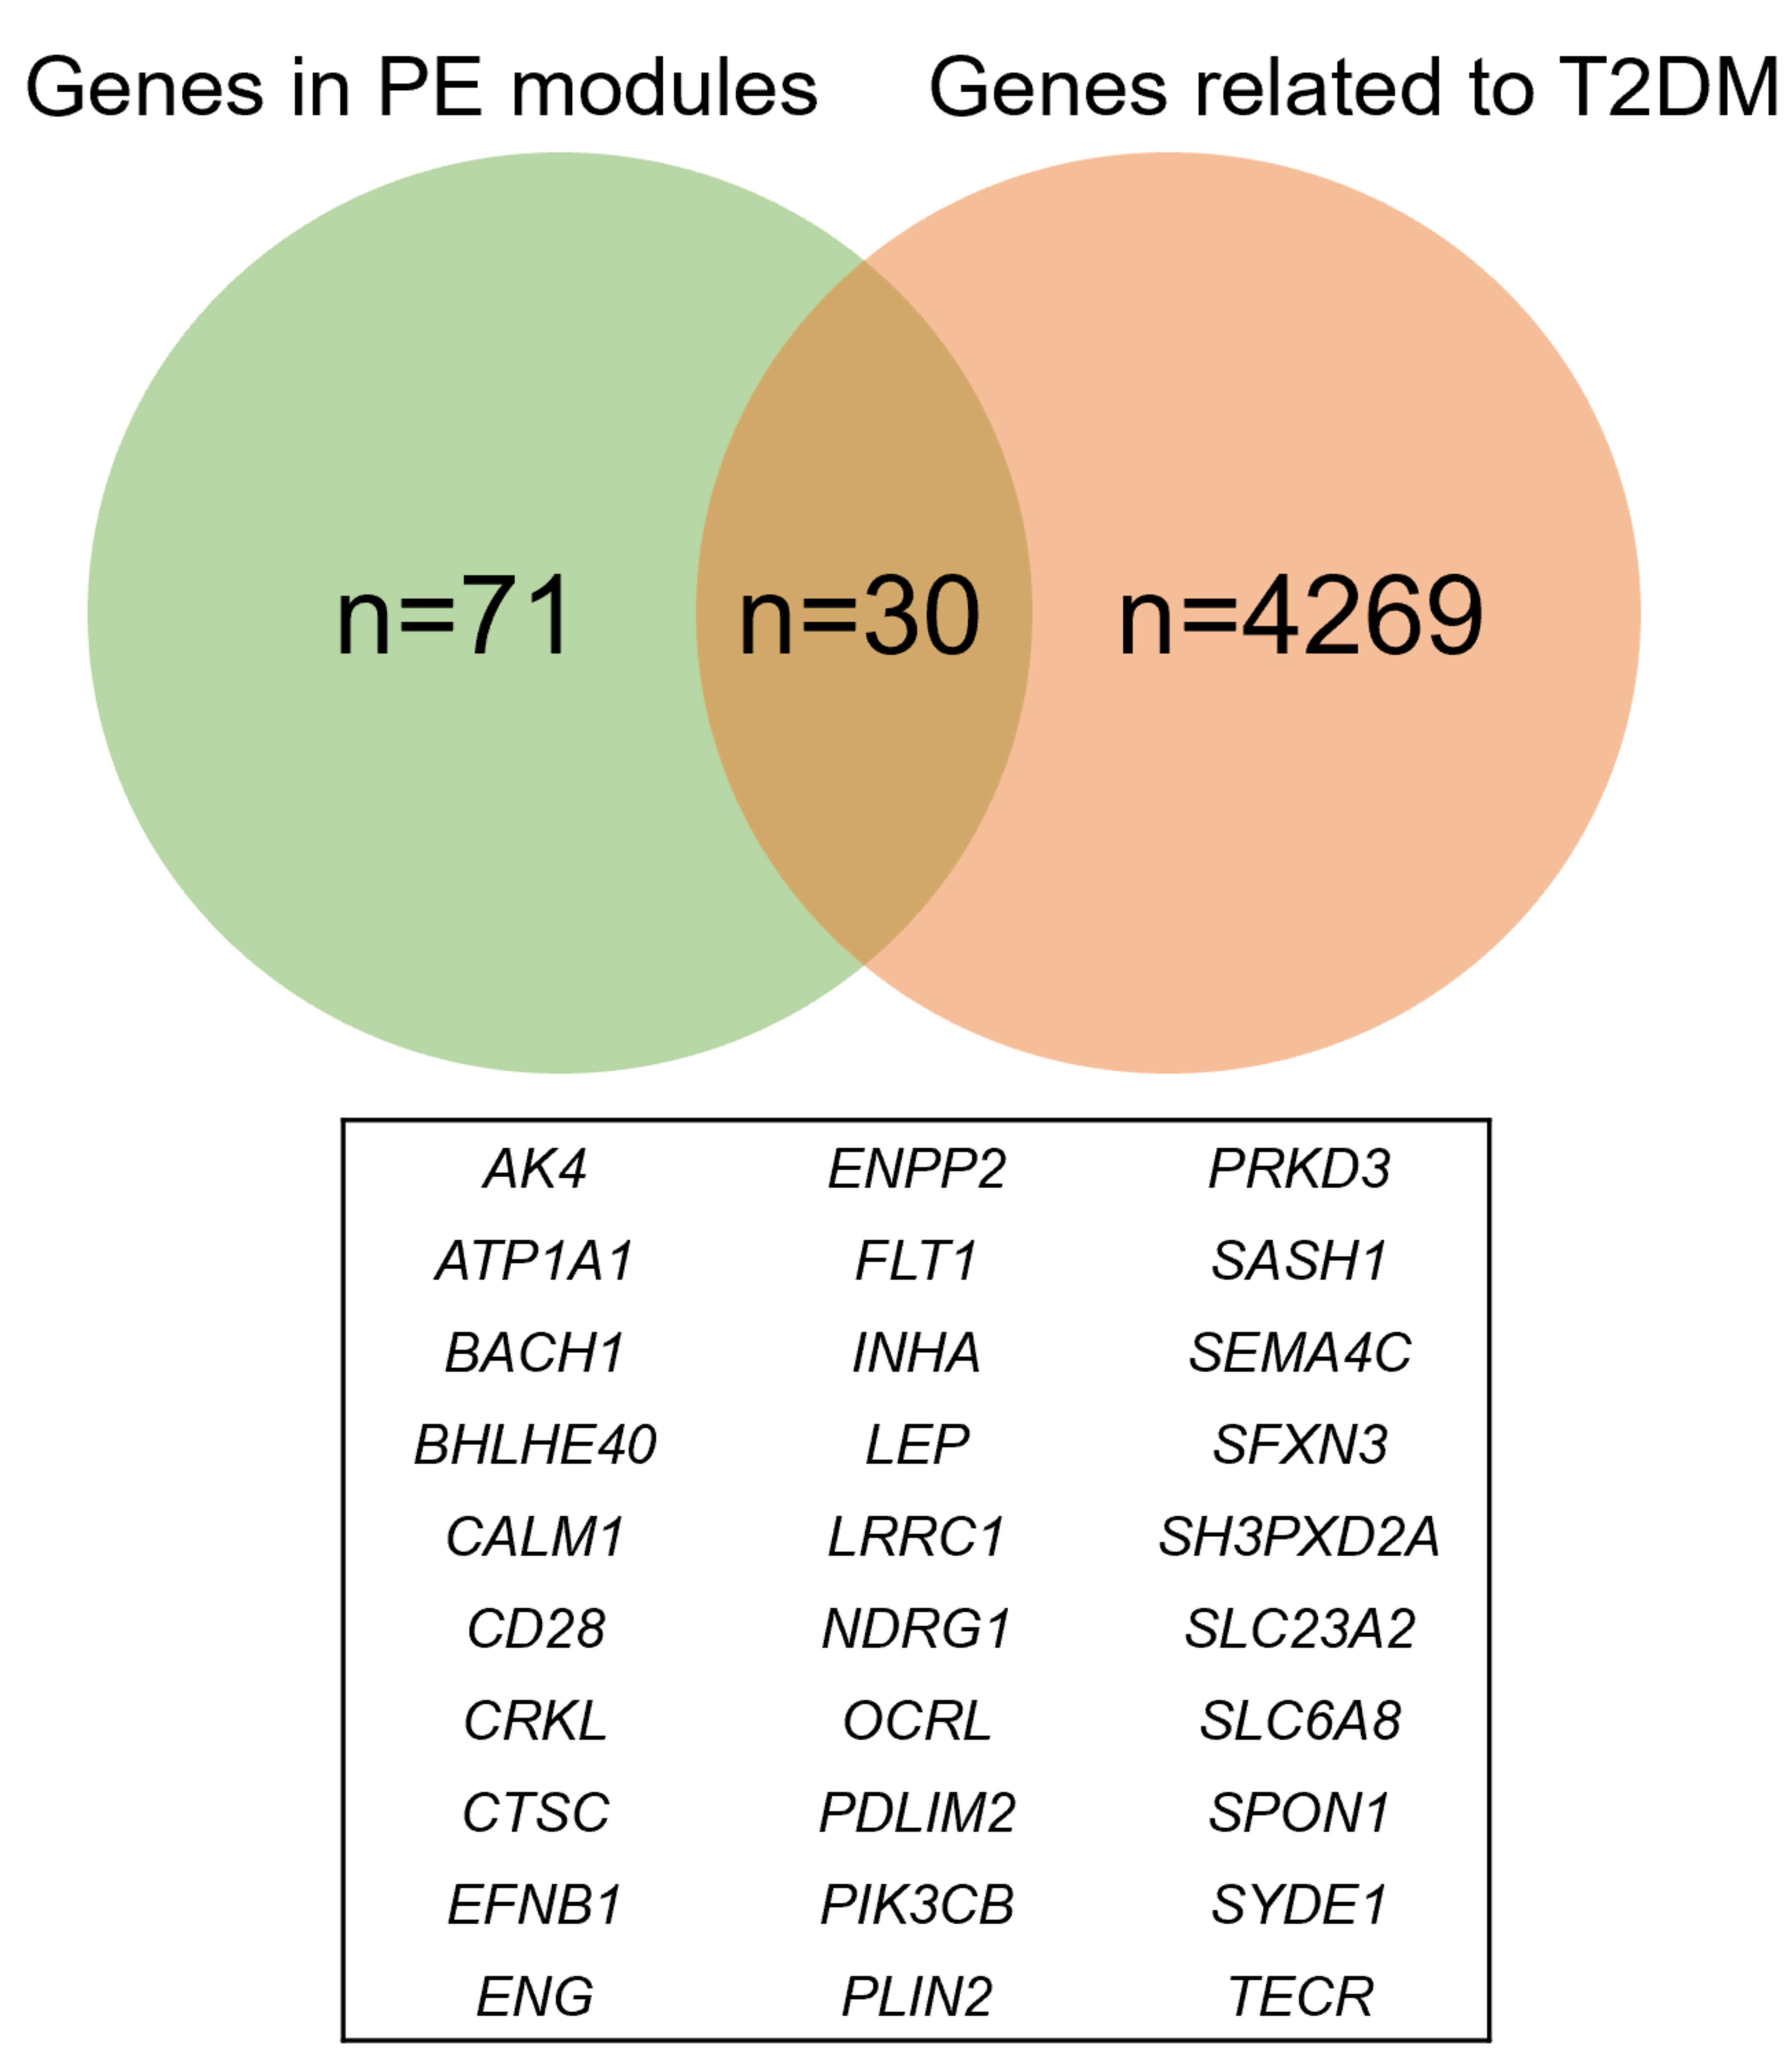 Fig. 2.
A Venn plot showing the shared genes between pre-eclampsia and T2DM. PE, Pre-eclampsia; T2DM, type 2 diabetes mellitus.
To explore the potential regulatory pathways of the 30 shared genes, we conducted KEGG and GO analysis. The significantly enriched KEGG pathways were “Rap1 signaling pathway”, “Aldosterone synthesis and secretion”, “Phosphatidylinositol signaling system”, “Neurotrophin signaling pathway”, “Aldosterone-regulated sodium reabsorption” and “Insulin signaling pathway” (Fig. 3, Table 4).
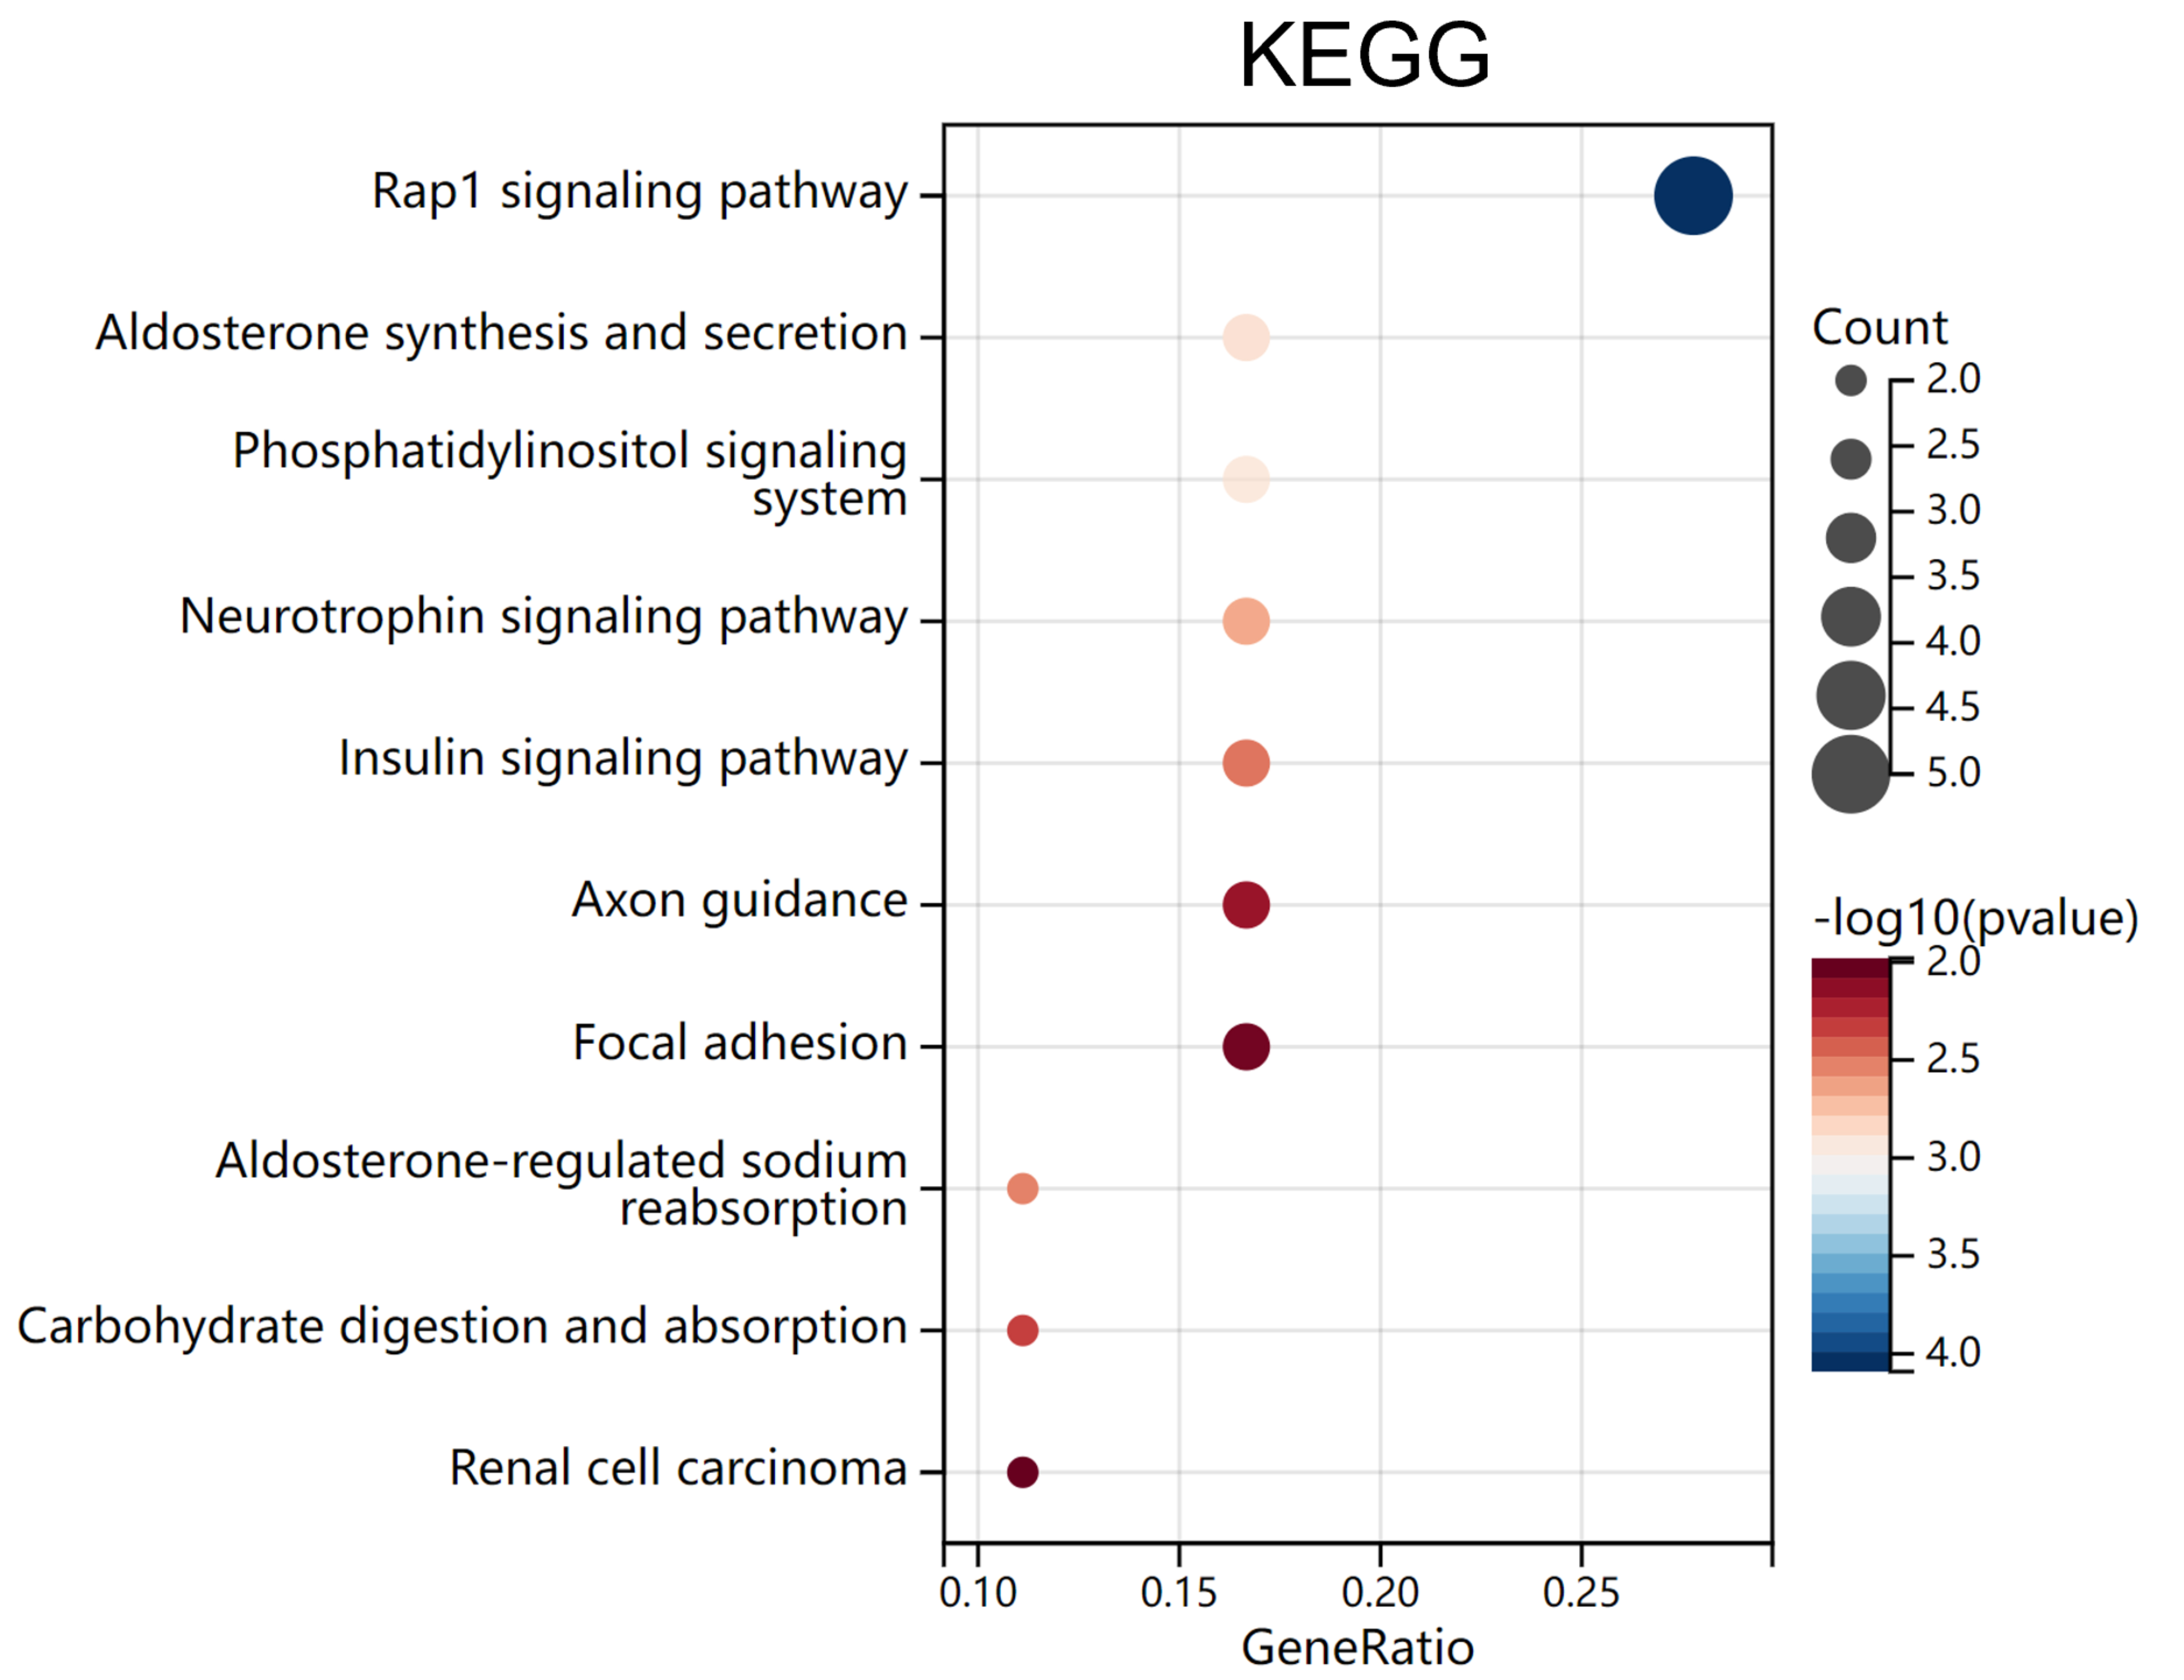 Fig. 3.
Bubble plots of KEGG analysis. The significantly enriched (adj.
p
| ID | Description | Generatio | BgRatio | p value | p adjust | q value | Gene ID | Count |
|---|---|---|---|---|---|---|---|---|
| hsa04015 | Rap1 signaling pathway | 5/18 | 210/7914 | 8.11 × 10 |
0.012241 | 0.009642 | CALM1/CRKL/FLT1/PIK3CB/PRKD3 | 5 |
| hsa04925 | Aldosterone synthesis and secretion | 3/18 | 98/7914 | 0.001313 | 0.068047 | 0.053603 | ATP1A1/CALM1/PRKD3 | 3 |
| hsa04070 | Phosphatidylinositol signaling system | 3/18 | 99/7914 | 0.001352 | 0.068047 | 0.053603 | CALM1/OCRL/PIK3CB | 3 |
| hsa04722 | Neurotrophin signaling pathway | 3/18 | 119/7914 | 0.002294 | 0.086149 | 0.067862 | CALM1/CRKL/PIK3CB | 3 |
| hsa04960 | Aldosterone-regulated sodium reabsorption | 2/18 | 37/7914 | 0.003104 | 0.086149 | 0.067862 | ATP1A1/PIK3CB | 2 |
| hsa04910 | Insulin signaling pathway | 3/18 | 137/7914 | 0.003423 | 0.086149 | 0.067862 | CALM1/CRKL/PIK3CB | 3 |
In GO analysis, only significantly enriched GO-Biological Process (BP) terms and
GO-Molecular Function (MF) terms were identified by applying FDR-adjusted
q value
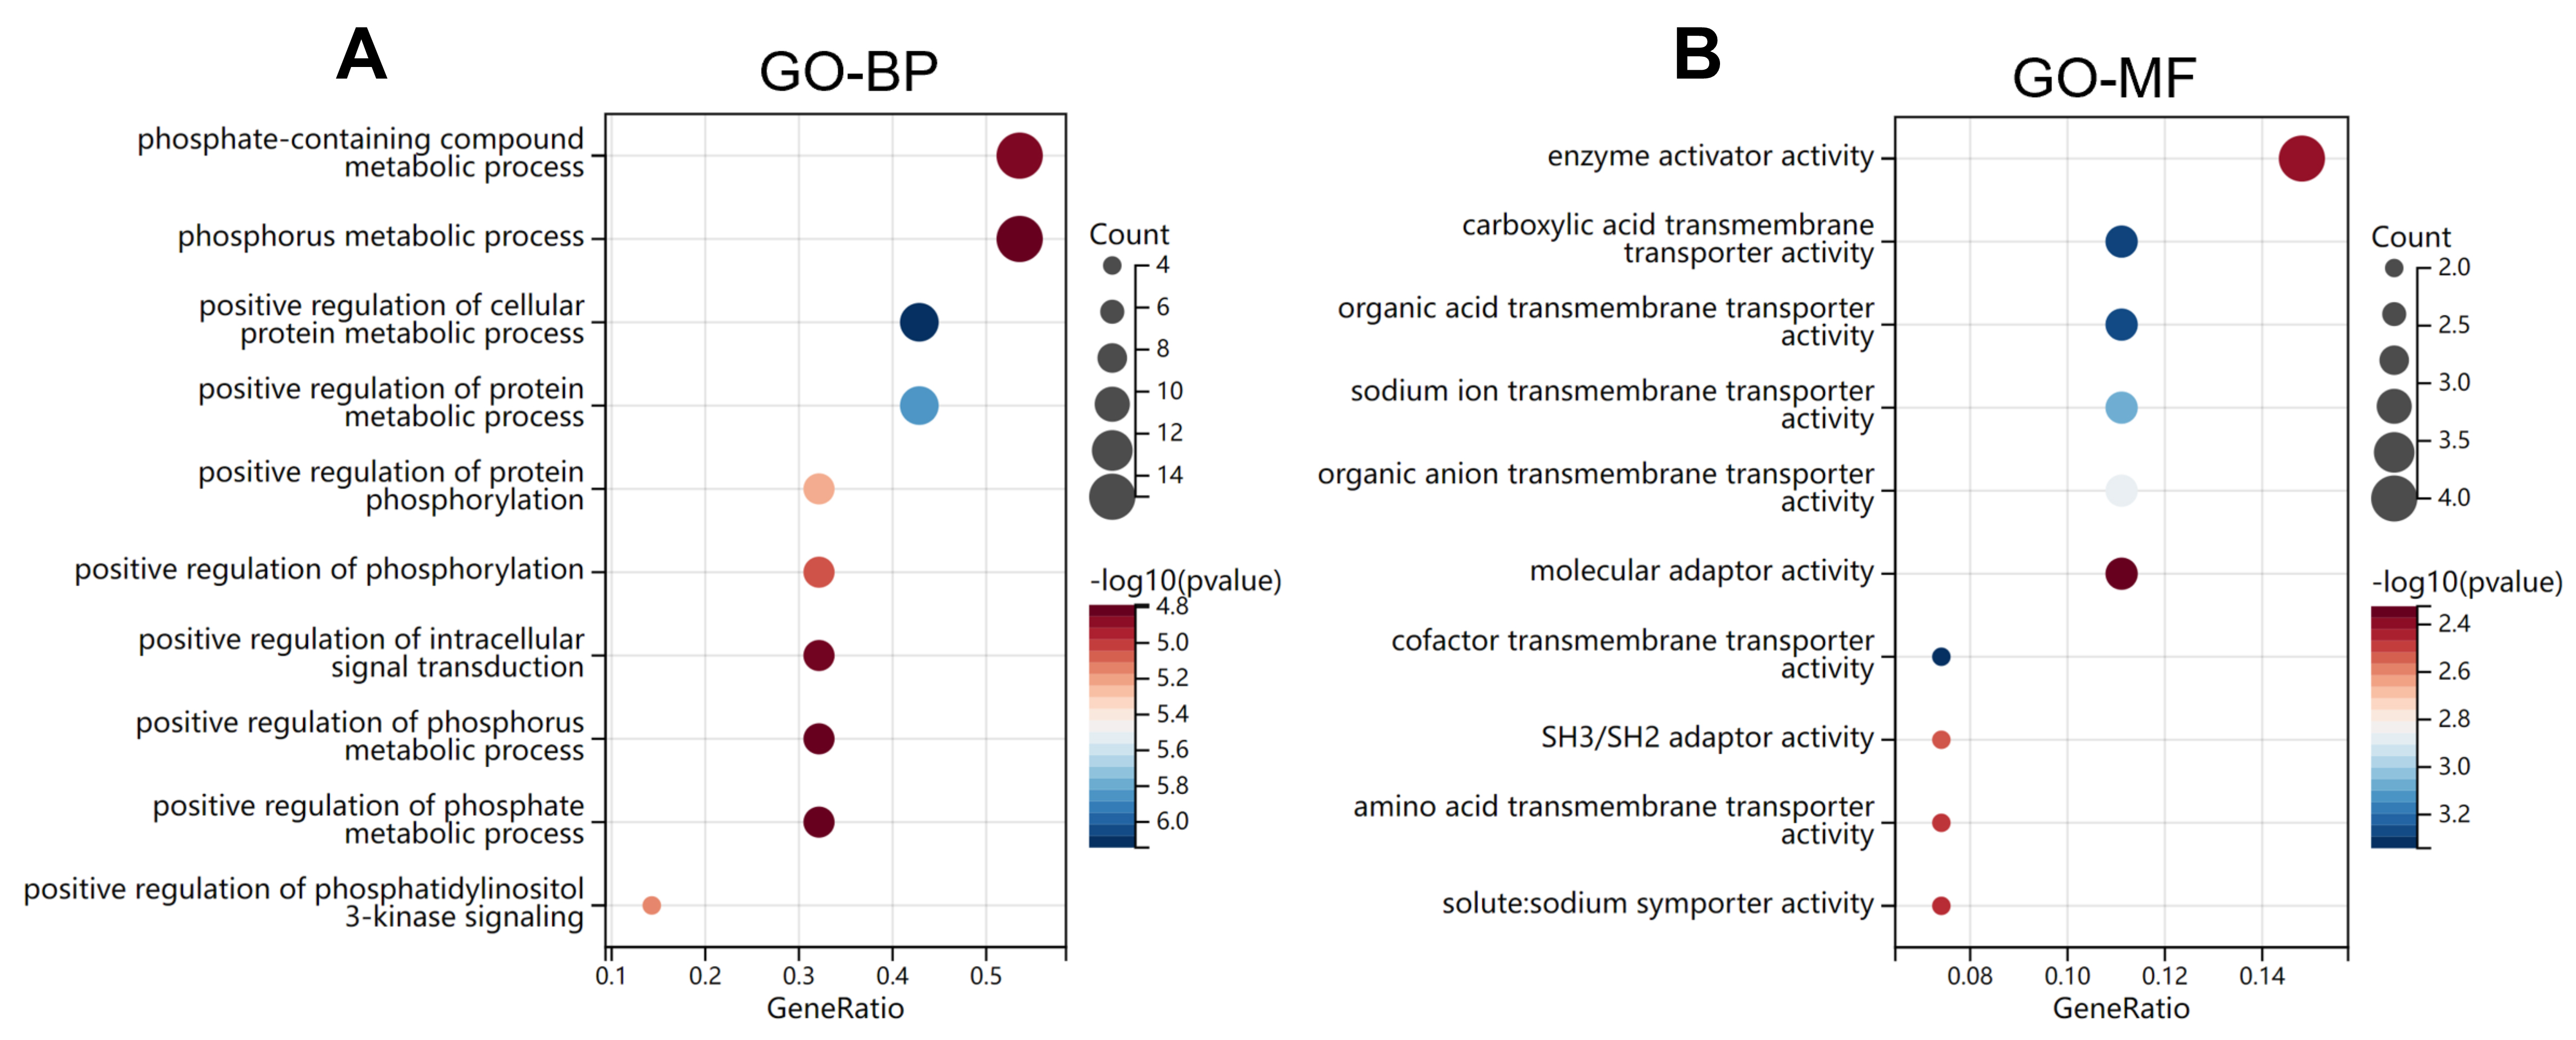 Fig. 4.
Bubble plots of GO analysis. (A,B) The significantly enriched
(adj. p
| ID | Description | Generatio | BgRatio | p value | p adjust | q value | Gene ID |
|---|---|---|---|---|---|---|---|
| GO:0032270 | Positive regulation of cellular protein metabolic process | 12/28 | 1458/17910 | 7.2 |
1.3 |
8.7 |
CALM1/CD28/CRKL/CTSC/ENG/ENPP2/FLT1/LEP/PIK3CB/SASH1/SEMA4C/SPON1 |
| GO:0051247 | Positive regulation of protein metabolic process | 12/28 | 1548/17910 | 1.4 |
1.3 |
8.7 |
CALM1/CD28/CRKL/CTSC/ENG/ENPP2/FLT1/LEP/PIK3CB/SASH1/SEMA4C/SPON1 |
| GO:0001934 | Positive regulation of protein phosphorylation | 9/28 | 907/17910 | 6.1 |
3.1 |
2.1 |
CALM1/CRKL/ENG/ENPP2/FLT1/LEP/PIK3CB/SASH1/SEMA4C |
| GO:0014068 | Positive regulation of phosphatidylinositol 3-kinase signaling | 4/28 | 81/17910 | 7.3 |
3.1 |
2.1 |
CD28/FLT1/LEP/PIK3CB |
| GO:0042327 | Positive regulation of phosphorylation | 9/28 | 955/17910 | 9.2 |
3.1 |
2.1 |
CALM1/CRKL/ENG/ENPP2/FLT1/LEP/PIK3CB/SASH1/SEMA4C |
| GO:0006796 | Phosphate-containing compound metabolic process | 15/28 | 3115/17910 | 1.5 |
3.1 |
2.1 |
AK4/ATP1A1/CALM1/CRKL/ENG/ENPP2/FLT1/INHA/LEP/OCRL/PIK3CB/PRKD3/SASH1/SEMA4C/TECR |
| GO:1902533 | Positive regulation of intracellular signal transduction | 9/28 | 1019/17910 | 1.6 |
3.1 |
2.1 |
CALM1/CD28/CRKL/ENG/FLT1/LEP/PIK3CB/SASH1/SEMA4C |
| GO:0006793 | Phosphorus metabolic process | 15/28 | 3139/17910 | 1.6 |
3.1 |
2.1 |
AK4/ATP1A1/CALM1/CRKL/ENG/ENPP2/FLT1/INHA/LEP/OCRL/PIK3CB/PRKD3/SASH1/SEMA4C/TECR |
| GO:0010562 | Positive regulation of phosphorus metabolic process | 9/28 | 1025/17910 | 1.6 |
3.1 |
2.1 |
CALM1/CRKL/ENG/ENPP2/FLT1/LEP/PIK3CB/SASH1/SEMA4C |
| GO:0045937 | Positive regulation of phosphate metabolic process | 9/28 | 1025/17910 | 1.6 |
3.1 |
2.1 |
CALM1/CRKL/ENG/ENPP2/FLT1/LEP/PIK3CB/SASH1/SEMA4C |
The top 10 significantly enriched GO-MF terms were “cofactor transmembrane transporter activity”, “carboxylic acid transmembrane transporter activity”, “organic acid transmembrane transporter activity”, “sodium ion transmembrane transporter activity”, “organic anion transmembrane transporter activity”, “SH3/SH2 adaptor activity”, “amino acid transmembrane transporter activity”, “solute: sodium symporter activity”, “enzyme activator activity” and “molecular adaptor activity” (Fig. 4B, Table 6).
| ID | Description | Generatio | BgRatio | p value | p adjust | q value | Gene ID |
|---|---|---|---|---|---|---|---|
| GO:0051184 | Cofactor transmembrane transporter activity | 2/27 | 20/16967 | 4.6 × 10 |
4.6 × 10 |
2.9 × 10 |
SLC23A2/SLC6A8 |
| GO:0046943 | Carboxylic acid transmembrane transporter activity | 3/27 | 98/16967 | 4.9 × 10 |
4.6 × 10 |
2.9 × 10 |
SFXN3/SLC23A2/SLC6A8 |
| GO:0005342 | Organic acid transmembrane transporter activity | 3/27 | 99/16967 | 5.1 × 10 |
4.6 × 10 |
2.9 × 10 |
SFXN3/SLC23A2/SLC6A8 |
| GO:0015081 | Sodium ion transmembrane transporter activity | 3/27 | 117/16967 | 8.3 × 10 |
5.7 × 10 |
3.6 × 10 |
ATP1A1/SLC23A2/SLC6A8 |
| GO:0008514 | Organic anion transmembrane transporter activity | 3/27 | 139/16967 | 1.4 × 10 |
7.5 × 10 |
4.7 × 10 |
SFXN3/SLC23A2/SLC6A8 |
| GO:0005070 | SH3/SH2 adaptor activity | 2/27 | 52/16967 | 3.1 × 10 |
7.6 × 10 |
4.8 × 10 |
CD28/CRKL |
| GO:0015171 | Amino acid transmembrane transporter activity | 2/27 | 55/16967 | 3.4 × 10 |
7.6 × 10 |
4.8 × 10 |
SFXN3/SLC6A8 |
| GO:0015370 | Solute: sodium symporter activity | 2/27 | 56/16967 | 3.6 × 10 |
7.6 × 10 |
4.8 × 10 |
SLC23A2/SLC6A8 |
| GO:0008047 | Enzyme activator activity | 4/27 | 419/16967 | 4.1 × 10 |
7.6 × 10 |
4.8 × 10 |
CALM1/CTSC/OCRL/SYDE1 |
| GO:0060090 | Molecular adaptor activity | 3/27 | 216/16967 | 4.8 × 10 |
7.6 × 10 |
4.8 × 10 |
CD28/CRKL/SASH1 |
The molecular pathogenesis of pre-eclampsia remains to be fully revealed. The cooccurrence of pre-eclampsia and T2DM has been previously documented. T2DM has been considered a risk factor for pre-eclampsia. Besides, there is compelling epidemiological evidence that women with pre-eclampsia during pregnancy, including increased risk of essential hypertension, coronary artery disease, and T2DM later in life [18]. Obesity is a shared risk factor for both pre-eclampsia and T2DM [6]. Although the epidemiological association was confirmed, the underlying mechanisms at the genetic level have not been explored. In the general population, pre-eclampsia presents a greater risk in nulliparae. However, in patients with type I diabetes, the incidence of pre-eclampsia was similar among nulliparae and multiparae [19]. This phenomenon might also be true for other types of pregestational diabetes. Therefore, there might be a common genetic basis promoting pre-eclampsia in diabetes. In this study, we explored the key gene modules of pre-eclampsia using the WGCNA. This method can identify the key co-expression modules relevant to the clinical traits [20].
To identify dysregulated genes related to T2DM, we compared the expression profile in ten previous microarrays, based on a strict statistical comparison. Via comparison of the overlapping gene set, we identified 30 shared genes. More importantly, we found that these 30 genes were enriched in multiple KEGG terms that might be related to both pre-eclampsia and T2DM. Among the 6 KEGG pathways, “Aldosterone synthesis and secretion” and “Aldosterone-regulated sodium reabsorption” are closely associated, while “Insulin signaling pathway” and Phosphatidylinositol signaling system” are closely related.
The renin-angiotensin-aldosterone system (RAAS) plays a critical role in regulating blood pressure and volume [21]. Dysregulation of this system is closely associated with the development of T2DM [22]. In patients with primary hyperaldosteronism, excessive aldosterone reduces insulin secretion in isolated islets and impairs insulin sensitivity in skeletal muscle and adipocytes [23], leading to a significantly higher risk of T2DM. However, this trend might not be readily transferable to a general population since T2DM cases in a general population are not associated with elevated aldosterone [24]. Normal pregnancy is associated with increased circulating renin, angiotensin II, and aldosterone [25], for an expansion of maternal plasma volume. In the mice model, aldosterone is required for optimal fetal development via maintaining the expression of PIGF and the proliferation of trophoblasts [26]. However, no significant alteration in aldosterone levels is observed in pre-eclampsia cases until proteinuria occurs [27]. Therefore, aldosterone-related pathways might not be the common signaling pathway between T2DM and pre-eclampsia.
In normal physiological conditions, insulin binds to its receptor and initiates sequential phosphorylation events that activate the PI3K/AKT signaling pathway [28]. Activated PI3K/AKT signaling promotes glucose transport, glycogen synthesis and protein synthesis in skeletal muscle, enhances lipid biosynthesis and inhibits lipolysis in adipose tissue and reduces hepatic glucose production and glycogenolysis, increases the synthesis of glycogen and fatty acids in the liver [29]. However, in patients with T2DM, insulin resistance was associated with blunted response to insulin in organs and weakened PI3K-Akt signaling [29]. Decreased expression of placental PI3K, Akt, and p-Akt at the protein level in pre-eclamptic placentas was observed in some previous studies [30, 31, 32]. In addition, decreased expression of p-Akt was associated with increased circulating sEng in pre-eclampsia [31].
It is worth noticing that increased total phospholipid content was observed in pre-eclamptic placental tissues in T2DM cases compared to controls [33]. This might be an excessive compensatory production due to the reduced PI3K-Akt activation in T2DM cases. By performing GO analysis, we confirmed that the shared genes were enriched in several MF terms directly related to insulin-PI3K-Akt signaling pathways, such as “Positive regulation of phosphatidylinositol 3-kinase signaling”, “Phosphate-containing compound metabolic process” and “Positive regulation of intracellular signal transduction”. Based on these findings, we infer that impaired PI3K/Akt signaling pathway may be a common pathogenetic factor of T2DM and pre-eclampsia.
The intervention strategies for T2DM are associated with PI3K/Akt activating effects. For example, Metformin, a first-line therapeutic drug for T2DM, can activate IRS2/PI3K/Akt signaling transduction [34]. Exercise training might also enhance IGFI-R/PI3K/Akt signaling in diabetic rat models [35, 36]. Therefore, self-management behaviors, including self-monitoring of blood glucose, healthy diet, physical activity and medication adherence should be highly recommended during nursing practice for pregnant women with pre-existing T2DM.
In summary, this study identified that impaired PI3K/Akt signaling pathway might be a common pathogenetic factor of T2DM and pre-eclampsia. For activating purposes, self-management behaviors, including self-monitoring of blood glucose, healthy diet, physical activity, and medication adherence should be highly recommended during nursing practice for pregnant women with pre-existing T2DM.
The datasets used and/or analyzed during the current study are available from the corresponding author on reasonable request.
ZFD and RL—the study design; ZFD, LLC, RJ and RL—data collection; ZFD and LLC—data analysis; ZFD, RJ and RL—data interpretation and drafting of the manuscript. All authors contributed to editorial changes in the manuscript. All authors have participated sufficiently in the work and agreed to be accountable for all aspects of the work. All authors read and approved the final version of the manuscript.
This study was conducted in accordance with the Declaration of Helsinki. The study protocol was approved by the Ethics Committee of Fuyang People’s Hospital, Fuyang, China (Approval No. 2022-176). All participants gave written informed consent prior to entering the study.
Not applicable.
This research received no external funding.
The authors declare no conflict of interest.
Publisher’s Note: IMR Press stays neutral with regard to jurisdictional claims in published maps and institutional affiliations.