
- Academic Editor
Background: Triple-negative breast cancer (TNBC) is an aggressive type of breast cancer that cannot be treated with targeted therapies such as endocrine therapy or anti-HER-2 (anti-human epidermal growth factor receptor 2) therapy. In the growth of tumors, AFF3 (AF4/FMR2 family member 3) plays a critical role. This study aims to examine the prognostic value and immune-related functions of AFF3 in TNBC. Methods: In the Gene Expression Omnibus (GEO) database, differentially expressed genes (DEGs) were identified from three datasets associated with TNBC. Clinicopathologic characteristics, overall survival (OS) data and gene expression data of TNBC patients were acquired from The Cancer Genome Atlas (TCGA). The Kaplan-Meier analyses and proportional hazards model (Cox) regression were used to assess factors associated with OS, including gene expression levels and clinicopathological factors. Gene Ontology, the Kyoto Encyclopedia of Genes and Genomes were performed for the analysis of biological processes associated with DEGs related to TNBC. Gene Set Enrichment Analysis was used to analyze the biological processes associated with AFF3 in TNBC. Twenty-five paired primary TNBC tumor tissues and adjacent non-tumorous tissues were collected from patients at Jiangxi Cancer Hospital (Nanchang, China). Quantitative real-time polymerase chain reaction (qRT-PCR) and western blotting were performed to assess the mRNA and protein expression of AFF3 in these samples. Immune cell infiltration status of 152 TNBC samples was analyzed by CIBERSORT algorithm. Results: Seventy-five DEGs from three TNBC-related gene expression profiles in GEO database. Based on the L1000 fireworks display (L1000FWD) dataset, five small-molecule drugs which were potentially suitable for treating TNBC patients were obtained. Univariate and multivariate Cox analyses revealed that low AFF3 expression in TNBC patients was an independent prognostic factor for poor survival. AFF3 expression was comparatively analyzed in 152 TNBC samples. The CIBERSORT algorithm was used to examine immune cell infiltration in TNBC tumors, which provided useful insights into the interface between the immune system and TNBC. Conclusions: In TNBC, low AFF3 expression might be predictive of poor survival. AFF3 might provide additional insight into therapeutics in TNBC.
Breast cancer (BC) is the most prevalent malignancy among women worldwide. BC can be categorized into five basic intrinsic or molecular subgroups based on existing molecular and genetic information. There is a spectrum of breast cancer types exists, including luminal A, luminal B, triple-negative/basal-like, HER2 (Human Epidermal Growth Factor Receptor 2)-enriched, and normal-like cancers [1]. The most invasive BC is triple-negative breast cancer (TNBC), accounting for 12–17% of all cases [2], and TNBC is diagnosed in more than 200,000 women annually [3]. TNBC is more aggressive and proliferative and has poorer prognoses and survival rates compared to other breast cancer types [4]. Due to ER (estrogen receptor)-negative, PR (progesterone receptor)-negative, and HER2-negative status, TNBC usually only responds to chemotherapy [5]. Furthermore, the prognosis of the patient with TNBC is not always favorable. Therefore, there is an urgent need to identify prognostic biomarkers to develop efficient therapeutic strategies for patients with TNBC.
The AFF (AF4/FMR2) protein family includes four members. The expression of AFF1/2/3/ is localized in the nucleus. AFF3 (AF4/FMR2 family member 3) was initially thought to be a lymphoid gene. It may function in transcriptional control. Additionally, AFF3 is reported to mediate tamoxifen resistance in BC [6]. However, the role and mechanisms of AFF3 in TNBC have not been elucidated.
In this study, differentially expressed genes (DEGs) were identified using three TNBC datasets in the Gene Expression Omnibus (GEO) database. Subsequently, univariate and multivariate proportional hazards model (Cox) analyses revealed that low AFF3 expression in TNBC is able to predict survival of TNBC as an independent prognostic factor.
Furthermore, DEGs were obtained by comparison between TNBC samples according to the levels of AFF3 expression from The Cancer Genome Atlas (TCGA) data. Using CIBERSORT, we profiled immune cell types in TNBC tumors to gain insight into the immune system’s interface. The findings of this study indicated AFF3 is a potential indicator for treatment targets in TNBC patients.
The primary tumor (T) and adjacent non-tumorous (N) tissue samples were obtained from 25 patients with TNBC undergoing surgery at Jiangxi Cancer Hospital (Nanchang, China). All paired tumor and normal tissue samples were independently identified by two pathologists. These samples were examined by quantitative real-time polymerase chain reaction (qRT-PCR) and western blotting analyses. All samples were stored at –80 °C until analysis. The tissue specimens were collected with the consent of patients from July 2019 to September 2020. The Ethics Committee of the Jiangxi Cancer Hospital approved the study design. All patients signed an informed consent form.
Three gene microarray datasets (GSE38959 [7], GSE62931 [8] and GSE64790 [9]) of expression profiles of TNBC tissues or TNBC cells and non-TNBC samples or healthy mammary ductal cells or healthy breast tissues were obtained from the GEO database (https://www.ncbi.nlm.nih.gov/geo/). High-throughput RNA sequencing data and clinicopathological data of breast cancer patients were downloaded from TCGA [10]. We confirmed the ER, PR and HER2 expression status of all breast cancer patients in TCGA based on the immunohistochemical (IHC). Information on patients with TNBC was extracted according to the classification system proposed by Voduc et al. [11]. These patients were enrolled in the TCGA-TNBC cohort.
The data were divided into TNBC and non-TNBC subsets. DEGs between the TNBC and
non-TNBC samples were filtered by the Limma package in R (version 3.5.0, R
Foundation for Statistical Computing, Vienna, Austria). To screen TNBC-related
DEGs, the following criteria were used: false discovery rate (FDR)
To clarify the biological processes in which AFF3 and all DEGs, GO [12]
and KEGG [13] analyses were performed using the clusterProfiler R package.
Significant DEGs were identified based on the following criteria: p
GSEA is a computational method that determines whether an a priori defined set of genes shows statistically significant, concordant differences between two biological states. In order to analyze correlations among all DEGs, clusterProfiler package was used to perform GSEA [14, 15].
GSEA firstly generated an ordered list of all DEGs according to their
correlation with AFF3 expression and gene set permutations were
performed 1000 times for each analysis. The criteria for significant correlations
were as follows: p
Based on the TNBC-related DEGs, the L1000 fireworks display (L1000FWD) database [16] was utilized to predict prospective drugs that could attenuate or enhance the biological status of TNBC. The DEGs were submitted to the L1000FWD database for potential small-molecular drugs for TNBC. The closer the similarity score is to –1, the higher the efficacy of the drug against TNBC.
Survival analysis was conducted using survival and survminer packages. The
survival duration of 152 patients with TNBC for whom detailed survival data were
available was 0–9.61 years. The Kaplan–Meier method was used to draw the
survival curve. Statistical significance was assessed by the log-rank test and
p
To further determine the effect of gene expression and clinical characteristics in TNBC patients, univariate Cox regression analysis was used to calculate the association between gene expression and clinical characteristics and patient’s overall survival (OS) in TCGA-TNBC cohort. Afterwards, a multivariate analysis was used to assess the independent prognostic factor for TNBC patient survival. The survival package in R was used to perform univariate and multivariate Cox regression.
The CIBERSORT algorithm [17], which can analyze the composition of immune cells in samples based on RNA high-throughput sequencing data, was applied to assess tumor-infiltrating immune cell (TICs) in tumor tissues of TCGA-TNBC cohort. The permutation (perm) was set at 1000 to obtain more stable results.
Radioimmunoprecipitation lysis buffer was used to lyse TNBC samples and adjacent
non-tumorous tissues. The supernatant was collected after centrifugation for 10
min at 12,000 g. The bicinchoninic acid (BCA) protein quantification kit (Beijing
Cwbiotech Co., Ltd., Beijing, China) measured the total protein content. After
mixing the protein with the loading buffer, it was boiled for 10 min in a water
bath. Protein lysates (20 µg) was separated by 10% sodium dodecyl sulfate polyacrylamide gel electrophoresis (SDS-PAGE) and
transferred onto a polyvinyl difluoride (PVDF) membrane (10600023, GE Healthcare
Life Sciences, Woburn, MA, USA). Nonspecific binding protein on PVDF was blocked
by 10% Bovine Serum Albumin (BSA, GC305006, Servicebio, Wuhan, Hubei, China).
Then, the membranes were incubated with antibodies against AFF3 (1:1000,
ab106231) and
Total RNA was extracted and reverse-transcribed into complementary DNA (cDNA)
using the all-in-one first-strand cDNA synthesis super mix kit (TransGen Biotech,
Beijing, China). qRT-PCR analysis was performed using the fast green qRT-PCR
supermix (TransGen Biotech, Beijing, China). All samples were divided into tumor
tissue (T) or non-tumorous tissue (N) to detect the mRNA expression of
AFF3. The 2
All statistical analyses were performed using the R software (version 3.5.0, the
Vienna University of Economics and Business, Vienna, Austria).
Clinicopathological and immune infiltration data between different groups were
tested by Wilcoxon test. The Correlation between AFF3 expression and
TICs was examined using Spearman correlation analysis. All statistical tests were
two-sided, and the level of significance was set at p
As shown in Table 1, we selected three GEO datasets for analysis. The number of upregulated and downregulated genes in different datasets were as follows: GSE38959, 939 upregulated genes and 509 downregulated genes (Fig. 1A); GSE62931, 356 upregulated genes and 483 downregulated genes (Fig. 1B); GSE64790, 509 upregulated genes and 630 downregulated genes (Fig. 1C). Fig. 1D shows a Venn diagram with 75 overlapping DEGs, comprising 38 upregulated and 37 downregulated genes (Supplementary Table 1).
| Accession number | Platform | Sample type and number | Experiment type |
| GSE38959 | GPL4133 | TNBC cells (30) | Expression profiling by array |
| normal mammary ductal cells (13) | |||
| GSE62931 | GPL15048 | TNBC samples (47) | Expression profiling by array |
| non-TNBC (ER+/PR+) samples (53) | |||
| GSE64790 | GPL19612 | TNBC tissue (3) | Expression profiling by array |
| matched normal breast tissues (3) | Non-coding RNA profiling by array |
TNBC, Triple-negative breast cancer; ER+, estrogen receptor – positive; PR+, progesterone receptor – positive.
 Fig. 1.
Identification of differentially expressed genes (DEGs) in triple-negative breast cancer (TNBC). (A–C) Volcano map of three genes expression profiles in GEO datasets, GSE38959 (A), GSE62931 (B), and GSE64790 (C). Red and blue colors indicate upregulated and downregulated genes in tumor tissues, respectively. (D) Venn diagram showing the common DEGs in three datasets.
GO and KEGG functional enrichment analyses were performed with ClusterProfiler to examine the functional implications of 75 DEGs between TNBC and non-TNBC samples. The biological process (BP) included mitotic nuclear division, nuclear division, organelle fission, chromosome segregation and kinetochore organization. Cellular components (CC) were condensed chromosome kinetochore, condensed chromosome, condensed nuclear chromosome kinetochore, condensed chromosome, centromeric region, kinetochore; KEGG enrichment suggested progesterone-mediated oocyte maturation, cell cycle, and oocyte meiosis (Fig. 2, Supplementary Table 2).
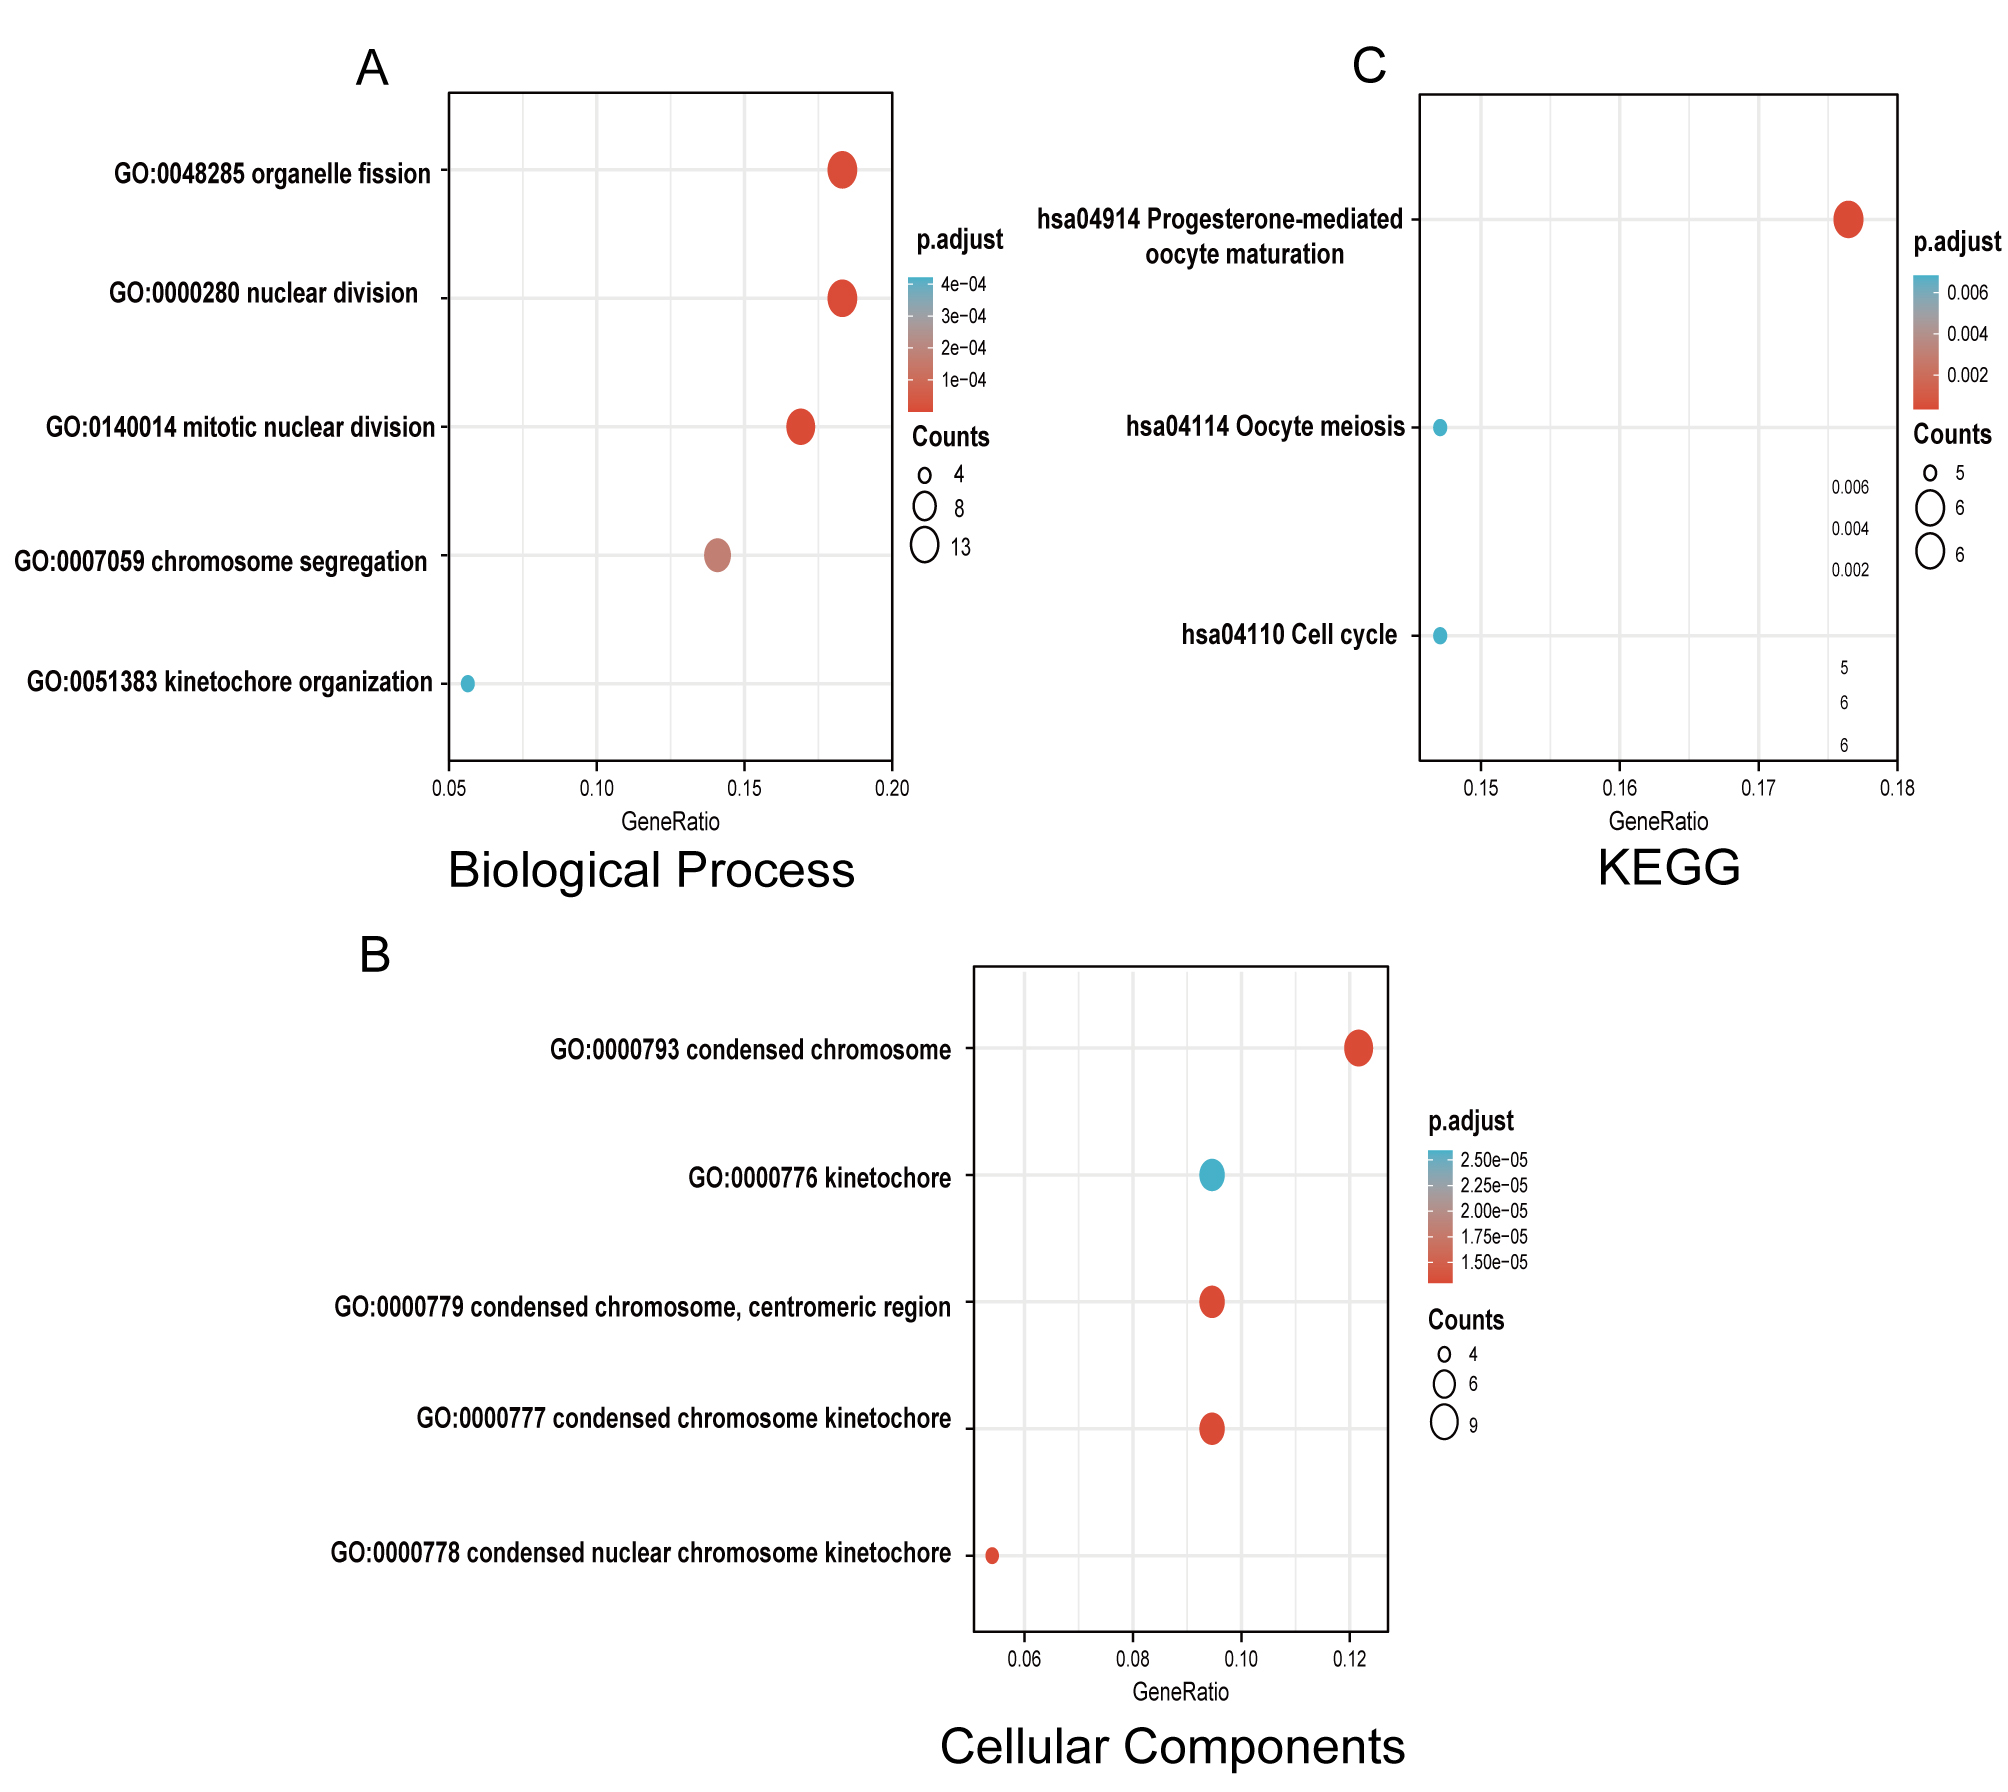 Fig. 2.
Gene Ontology (GO) and Kyoto Encyclopedia of Genes and Genomes (KEGG) enrichment analyses of DEGs between TNBC and non-TNBC tissues. (A) Enriched GO terms in the “biological process” category. (B) Enriched GO terms in the “Cellular Components” category. (C) KEGG pathway annotations. The size of the circle represents the number of genes contained in a category. The higher the number of genes, the larger the circle. The color represents the adjusted p-value in enrichment analysis. The smaller the p-value, the higher the red color intensity. The larger the p-value, the higher the blue color intensity.
To screen for drugs for TNBC treatment, upregulated and downregulated DEGs were separately uploaded into the L1000FWD database. Small-molecules with anticancer effects on TNBC progression were selected with a similarity score of zero and an adjusted p-value of 0.01. The five most similar small-molecule drugs were idarubicin, teniposide, homosalate, palbociclib, and tremulacin (Table 2).
| Drug | Similarity score | p-value | Adjusted p-value | Z-score | Combined score |
| Idarubicin | –0.4754 | 4.92 |
9.29 |
1.77 | –57.17 |
| Teniposide | –0.4754 | 3.93 |
9.29 |
1.76 | –56.89 |
| Homosalate | –0.4754 | 6.51 |
9.29 |
1.68 | –54.20 |
| Palbociclib | –0.4426 | 1.05 |
7.48 |
1.72 | –51.47 |
| Tremulacin | –0.4426 | 3.18 |
1.94 |
1.74 | –51.36 |
L1000FWD, L1000 fireworks display.
The correlation between gene expression and clinical characteristics in
TCGA-TNBC dataset was examined. Gene expression matrices and clinicopathological
data of 152 TNBC patients were obtained. Univariate Cox regression analysis
revealed that 13 DEGs (NUF2, TPX2, BUB1, EZH2, ASPM, EXO1, DEPDC1, AFF3,
H1-1, PSAT1, NDC80, CENPF, and KIF18B), race, T stage, and N stage were
correlated with prognosis of TNBC patients (p
| Clinicopathologic variable or gene expression | Hazard ratio (95% confidence interval) | p-value |
| NUF2 (high vs. low) | 0.53 (0.07–4.07) | 0.541 |
| TPX2 (high vs. low) | 0.8 (0.06–11.25) | 0.866 |
| BUB1 (high vs. low) | 2.47 (0.19–32.2) | 0.491 |
| EZH2 (high vs. low) | 0.4 (0.12–1.37) | 0.144 |
| ASPM (high vs. low) | 1.07 (0.13–8.82) | 0.947 |
| EXO1 (high vs. low) | 0.53 (0.07–4.04) | 0.540 |
| DEPDC1 (high vs. low) | 0.51 (0.04-5.75) | 0.583 |
| AFF3 (high vs. low) | 0.22 (0.07–0.72) | 0.012 |
| H1-1 (high vs. low) | 0.75 (0.26–2.14) | 0.587 |
| PSAT1 (high vs. low) | 0.29 (0.06–1.29) | 0.104 |
| NDC80 (high vs. low) | 0.8 (0.2–3.25) | 0.755 |
| CENPF (high vs. low) | 1.05 (0.19–5.87) | 0.960 |
| KIF18B (high vs. low) | 3.3 (0.55–19.88) | 0.193 |
| Race (non-white vs. white) | 0.61 (0.21–1.79) | 0.369 |
| N stage (N2 + N3 vs. N0 + N1) | 1.12 (0.11–11.2) | 0.921 |
| T stage (T3 + T4 vs. T1 + T2) | 1.59 (0.27–9.37) | 0.607 |
Bold indicates that AFF3 is an independent risk factors for overall survival in triple-negative breast cancer patients.
The transcription levels of AFF3 in TCGA-TNBC cohort were analyzed. The
expression of AFF3 in TNBC tumor tissues was significantly lower than
that in healthy mammary tissues (p = 4.40
 Fig. 3.
Expression of AFF3 in TNBC and non-tumorous tissues.
(A) The relative mRNA expression of AFF3 in 152 TNBC tissues and 99
non-tumorous tissues in TCGA dataset. Significant differences between the two
groups were evaluated using the Wilcoxon rank sum test. (B) The relative mRNA
expression of AFF3 in 10 TNBC tissues and paired-adjacent tissues from
TCGA dataset. Significant differences between the two groups were analyzed using
the Wilcoxon signed-rank test. (C) The AFF3 mRNA levels in 25 paired
samples of TNBC are represented as a histogram. N/T expression value
Next, the correlation between clinicopathological and AFF3 expression was further investigated in TCGA-TNBC cohort. All patients in the TCGA-TNBC cohort were categorized into AFF3-high and AFF3-low groups, based on the median AFF3 expression levels. The AFF3 mRNA expression level was significantly correlated with T stage (p = 0.025, Fig. 4A), N stage (p = 0.008, Fig. 4B), pathologic stage (p = 0.046, Fig. 4D), race (p = 0.023, Fig. 4E). In TCGA-TNBC cohort, the median OS in the AFF3-high group was higher than that in the AFF3-low group (p = 0.023, Fig. 4F).
 Fig. 4.
Correlation of AFF3 mRNA expression with clinicopathological characteristics. (A–C) The correlation of AFF3 mRNA expression with T stage (A), N stage (B), and M stage (C). Significant differences between the two groups examined using the Wilcoxon Mann-Whitney test. (D,E) The correlation of AFF3 mRNA expression with pathologic stage (D) and race (E). Significant differences between multiple groups were examined using the Kruskal-Wallis rank sum test. (F) Survival analysis of patients with TNBC in the AFF3-high and AFF3-low groups in TCGA-TNBC cohort. Significant differences between multiple groups were examined using the log-rank test. The number of samples as follows: T1 + T2: 133, T3 + T4: 19; N0 + N1: 131, N2 + N3: 15; M0: 129, M1: 2; stage I: 27, stage II: 96, stage III: 24, stage IV: 2; Asian: 8, White: 84, African: 53.
To further investigate the function of AFF3, the DEGs between
AFF3-high and AFF3-low groups were examined using the Limma
package. The criteria for selecting DEGs were as follows: FDR
 Fig. 5.
GO/KEGG enrichment analysis for DEGs in the AFF3-high and AFF3-low groups. (A) Heatmap of DEGs between AFF3-high and AFF3-low groups. The row of the heatmap represents the gene symbol of the 249 DEGs and the column represents ID number of the samples in TCGA-TNBC cohort. Gene symbols and identification numbers are not shown in the graph. (B) Enriched GO terms in the “biological process” category. (C) Enriched GO terms in the “cellular component” and “molecular function” category. (D) KEGG pathway annotations. Only some notable and leading gene sets are displayed in the graph.
GSEA was performed to investigate the differential activation of AFF3-related signaling pathways in TNBC. GSEA identified some critical signaling pathways in MSigDB collection (c2.cp.v7.2.symbols.gmt and c7.all.v7.2.symbols.gmt). Based on the normalized enrichment score (NES) and p-values, some significant signaling pathways are shown (Fig. 6 and Supplementary Table 6). For the C2 (one of the human collections of the molecular signatures database) collection, neuroactive ligand receptor interaction, steroid hormone biosynthesis and phase II conjugation of compounds (Fig. 6A, Supplementary Table 6) were enriched in AFF3-high group. Meanwhile, the formation of the cornified envelope, keratinization, translation, respiratory electron transport, and complex I biogenesis were enriched in AFF3-low group (Fig. 6B, Supplementary Table 6). For the C7 collection, some different immune-related signaling pathways were enriched in AFF3-high group (Fig. 6C, Supplementary Table 7) or AFF3-low group (Fig. 6D, Supplementary Table 7). These results further suggested that AFF3 had an important role in the immune microenvironment of TNBC.
 Fig. 6.
GSEA identifies AFF3-related signaling pathways. (A,B) Enriched signaling pathways in the C2 collection in the AFF3-high (A) or in AFF3-low expression groups (B). (C,D) Enriched signaling pathways in the C7 collection in AFF3-high (C) and AFF3-low groups (D). GSEA, Gene Set Enrichment Analysis.
GSEA revealed that AFF3 may be involved in the immune function in TNBC. Next, the distribution of immune cells in TNBC was analyzed with CIBERSORT algorithm. M0, M1, and M2 macrophage subsets accounted for most of the infiltrating immune cells (Fig. 7A). Violin plots were used to compare immunity subset distributions between the AFF3-low and AFF3-high groups (Fig. 7B). The proportions of naive B cells, neutrophils, and M2 (a subtype of macrophage) macrophages were significantly different between the AFF3-low and AFF3-high groups (Fig. 7B). The proportions of naive B cells, mast cells resting and T cells CD4 (Cluster of differentiation 4) memory resting were positively correlated with AFF3 expression (Fig. 7C–E). In contrast, the proportions of neutrophils and follicular helper T cells were negatively correlated with AFF3 expression. Therefore, the level of AFF3 regulates the proportion of TICs and immune activity in TME (Tumor microenvironment).
 Fig. 7.
Correlation of tumor-infiltrating immune cell (TIC) proportion with AFF3 expression. (A) Bar plot shows the distribution of TICs in each tumor sample in TCGA-TNBC cohort. Column are the ID numbers of the samples, which are not shown in the plot. (B) The violin plot shows the distribution of TICs between the AFF3-high and AFF3-low groups in TCGA-TNBC cohort. (C–G) The scatter plot shows the distribution of the 5 TICs that were significantly correlated with AFF3 expression.
This study mined the public bioinformatics databases (GEO and TCGA) and tested tissue samples. AFF3 expression in the tumor tissues was lower than that in the healthy mammary tissue. The AFF3 mRNA expression level was negatively correlated with T stage, N stage, and was positively correlated with survival status. The downregulation of AFF3 was an independent poor prognostic factor for TNBC. The underlying mechanisms of AFF3 may involve cellular hormone metabolic process, humoral immune response, and the regulation of trans-synaptic signaling.
Previous research reported AFF3 acted as a mediator of oncogenic effects during transcription and RNA splicing [18]. A previous study reported that AFF3 may play a role in promoting tumor progression in breast cancer [19], but this study did not distinguish between the subtypes of BC. Shi et al. [6] reported that tamoxifen-resistant tumors exhibited upregulated expression of AFF3, which activated the ER signaling pathway. Chen et al. [20] reported that AFF3 was significantly correlated with the prognosis of TNBC (HR = 0.29, 95% CI: 0.10–0.86, p = 0.0263), which was consistent with the results of this study. This study is the first to investigate the expression and biological function of AFF3 in TNBC.
This study arrived at the following conclusions: (1) univariate and multivariate analyses revealed downregulated AFF3 expression was an independent poor prognostic factor for TNBC; (2) clinical and pathological characteristics were correlated with the downregulated expression of AFF3 mRNA; (3) Downregulated AFF3 expression was also correlated with the distribution of immune cell subsets, such as M2 macrophages, naïve B cells, and neutrophils.
Previous studies have demonstrated that immune cell infiltration is involved in various pathological processes in TNBC, such as tumorigenesis, tumor progression, and therapy response. This study examined the role of AFF3 in immune cell infiltration. The levels of M2 macrophages, naïve B cells, and neutrophils were significantly upregulated in the AFF3-low group. M2 macrophage polarization may be involved in tumor progression as it suppresses effective anti-tumor immunity and decreases the effectiveness of immunotherapy [21]. By interfering with the distribution of TIC in TME, patients with downregulated AFF3 expression may benefit from immunotherapy.
Additionally, five potential small-molecule drugs for TNBC patients were identified using the L1000FWD dataset. Idarubicin, an anthracycline antibiotic, is used to treat various cancers, such as acute leukemia, malignant lymphomas, and several solid tumors [22, 23]. Teniposide, an inhibitor of DNA topoisomerase II, induces innate immune activation in tumor cells and activates antitumor T-cells in vitro and in vivo [23]. Homosalate, which belongs to the salicylate family of organic compounds, is a salicylic acid incorporated into 3,3,5-trimethylcyclohexanol, a derivative of cyclohexanol. Previous studies have reported that homosalate regulates BC development [24]. Palbociclib is a selective CDK4 (cyclin dependent kinase 4) and CDK6 (cyclin dependent kinase 6) inhibitor. According to experiments in TNBC cell lines, the luminal-AR subtype [25], a subgroup of TNBC, is more sensitive to CDK4/6 inhibition than the other subtypes [26]. Therefore, CDK4/6 inhibitors should be selected according to the patient’s subgroup within TNBC [27]. Tremulation was glycoside-derived and showed different levels of inhibition of prostaglandin E2 (PGE2) release [28]. Several recent studies have demonstrated that PGE2 is linked to the progression and treatment of breast cancer in recent years [29, 30].
This study performed bioinformatics mining and collected 25 paired tumor and non-tumorous from patients with TNBC. More patient samples and clinicopathological information, including disease free survival and OS, should be collected verify the accuracy of the results of this study. This study did not experimentally validate the bioinformatics results in vivo or in vitro. Further experiments are needed to verify the functions of AFF3 in TNBC.
AFF3 expression was significantly downregulated in TNBC tissues and was correlated with malignant status and prognosis. Future studies should examine the regulatory mechanisms of AFF3-mediated signaling pathways and confirm the clinical value of AFF3 levels in TNBC. Downregulated AFF3 expression may be associated with poor survival. Thus, AFF3 is a potential therapeutic target for TNBC.
AFF3, AF4/FMR2 family member 3; AR, Androgen Receptor; BCA, Bicinchoninic acid; BC, Breast cancer; TCGA-BRCA, the Cancer genome atlas-breast invasive carcinoma; BP, Biological process; CC, Cellular components; CDK, Cyclin-dependent kinases; CI, Confidence interval; Cox, Proportional hazards model; DEGs, Differentially expressed genes; DFS, Disease free survival; DNA, Deoxyribo Nucleic Acid; FC, Fold change; FDR, False discovery rate; GEO, Gene Expression Omnibus; GO, Gene Ontology; GSEA, Gene Set Enrichment Analysis; HR, Hazard ratio; KEGG, Kyoto Encyclopedia of Genes and Genomes; L1000FWD, L1000 fireworks display; MF, Molecular Function; MsigDB, Molecular Signatures Database; NES, Normalized enrichment score; OS, Overall survival; PGE2, Prostaglandin E2; qRT-PCR, Quantitative real-time polymerase chain reaction; TCGA, The Cancer Genome Atlas; TICs, Tumor-infiltrating immune cell; TME, Tumor microenvironment; TNBC, triple-negative breast cancer; ER, estrogen receptor; PR, progesterone receptor; HER2, Human Epidermal Growth Factor Receptor 2; TNBC, triple-negative breast cancer; GEO, Gene Expression Omnibus: GEO Platform; GSE, GEO Series.
The datasets used and/or analyzed during the current study are available from the corresponding author on reasonable request.
JC, TY and CH contributed to study design/planning. CH, JC and BT contributed to data collection/entry. BT, WZ, TY, JL contributed to data analysis/statistics. CH, JC and JL contributed to data interpretation. CH, JC, and TY contributed to preparation of manuscript. WZ, TY and JL contributed to literature analysis/search. All authors contributed to editorial changes in the manuscript. All authors read and approved the final manuscript. All authors have participated sufficiently in the work to take public responsibility for appropriate portions of the content and agreed to be accountable for all aspects of the work in ensuring that questions related to its accuracy or integrity.
The study was performed in accordance with the principles of the Declaration of Helsinki. The study was approved by the Ethics Committee of the Jiangxi Cancer Hospital of Nanchang University (Approval Number: 2021ky227), and all participants provided written in-formed consent to participate and for publication.
Not applicable.
This study was supported by Science and Technology Research Project of Jiangxi Provincial Education Department (Grant Number: GJJ2208202, GJJ2203530).
The authors declare no conflict of interest.
Publisher’s Note: IMR Press stays neutral with regard to jurisdictional claims in published maps and institutional affiliations.