
- Academic Editor
Background: To construct a predictive model for fetal growth restriction (FGR) in preeclampsia (PE) patients using extreme Gradient Boosting (XGBoost) algorithm. Methods: A prospective study was conducted in the Obstetrics Department of Wuming Hospital from October 1, 2016, to October 1, 2021. A total of 303 preeclampsia patients were divided into two groups based on FGR status (restricted vs. unrestricted group). The clinical data and laboratory indicators between the two groups were compared. Logistics multivariate analysis and the XGBoost algorithm model were used to identify the risk factors for FGR in preeclampsia. Moreover, we used the receiver operating characteristic (ROC) curve to verify the accuracy of the XGBoost algorithm model. Results: Multivariate analysis and XGBoost algorithm modeling could predict the risk factors for FGR using clinical data and laboratory indicators. ROC analysis revealed that the area under the curve of the XGBoost algorithm model was 0.851, indicating a good fit. Conclusions: The XGBoost algorithm model can predict the occurrence of FGR in preeclampsia patients. The top three risk factors, triglyceride (TG), total cholesterol (TC), and lipoprotein (a) [Lp (a)], can be used as important predictors of poor patient prognosis in clinical settings.
Preeclampsia (PE) is a severe metabolic and vascular disorder in pregnant women characterized by new-onset hypertension with proteinuria after 20 weeks of gestation [1]. PE occurs when there is a systemic spasm of the small arteries and consequent placental ischemia and hypoxia, resulting in inadequate perfusion, which affects fetal nutrient uptake leading to fetal growth restriction (FGR) [2]. The incidence of PE complicated by FGR is 20%–30% in China, which increases the incidence of preterm birth, stillborn infants, and neonatal asphyxia as well as the risk of adult metabolic complications [3, 4, 5].
Due to the challenges for early prediction and diagnosis of FGR, adequate intervention and treatment are delayed. A previous study revealed that the FGR prediction rate is low (12%–47%), with a false positive rate of 10% [6]. Therefore, a reliable prediction method is needed to improve the outcomes of PE patients with FGR.
As the PE complicated with FGR is multifactorial, common prediction models cannot capture the complex cross-correlation of these factors [7]. The extreme gradient boosting (XGBoost) algorithm, a typical machine learning technique, can predict complex relationships between variables, unlike other models. Moreover, the accuracy of the XGBoost algorithm model has been demonstrated to predict the PE [8]. Therefore, this study established a prediction model for FGR in PE patients using XGBoost to provide early-stage pregnancy interventions to prevent or reverse associated adverse outcomes.
This prospective study included the pregnant mother with PE who delivered in the Obstetrics Department of Wuming Hospital from 1 October 2016 to 1 October 2021. According to the relevant criteria of the Expert Consensus on FGR (2019 edition), 303 patients were divided into 62 cases in the group with PE complicated with FGR (restricted group) and 241 cases in the group with PE alone (nonrestricted group) [9]. This study was approved by the Medical Ethics Committee of Wuming Hospital Affiliated to Guangxi Medical University [approval number: WM-2022 (217)].
Inclusion criteria included the women who meet the diagnostic criteria in the Guidelines for the Management of Hypertensive Disorders in Pregnancy (2020) [10] and the Expert Consensus on FGR (2019 Edition) [9]. We excluded the patient with multiple pregnancies, combined history of chronic hypertension, chronic liver and kidney diseases, and other prepregnancy comorbidities or fetal malformations.
Clinical and laboratory data were prospectively collected from patients in the study. Clinical data included age, gestational week, pregestational body mass index (BMI), number of deliveries, number of births, severity of PE, initial systolic blood pressure, initial diastolic blood pressure, diabetes mellitus, thrombophilia, fundus abnormalities, and amniotic fluid status.
Laboratory data included the results for complementary inflammation, coagulation status, hepatobiliary and renal function, lipid profile, and blood counting. Complement inflammatory parameters include complement component 1q (C1q), and C-reactive protein (CRP). The coagulation parameters included prothrombin time activity (PTA), activated partial thromboplastin time (APTT), and prothrombin time (PTA), fibrinogen (Fib) and thrombin time (TT). The main hepatobiliary indicators included albumin (ALB), alanine aminotransferase (ALT), and glutamate transferase (GTR), glutamic oxaloacetic transaminase (AST), total bile acid (TBA), total protein (TP). The renal function tests included uric acid (UA), urea (Urea), creatinine (Cr), and TBA. Lipid profile included apolipoprotein A-I (ApoA1), high-density lipoprotein cholesterol (HDL-C), lipoprotein (a) [Lp (a)], and serum total protein (serum TP), serum total cholesterol (TC), and triglyceride (TG). Blood cell indices mainly included absolute lymphocytosis (Lym), absolute neutrophil (Neu), platelet count (blood platelet, Plt), Neu/Lym ratio, and Plt/Lym ratio.
The clinical data included age, gestational week, prepregnancy body mass index, number of deliveries, number of births, severity of PE, initial systolic blood pressure, initial diastolic blood pressure, diabetes mellitus, thrombophilia, fundus abnormalities and amniotic fluid retention were compared between the restricted and nonrestricted groups.
The laboratory results including complement inflammation, coagulation, hepatobiliary, renal, lipid, and blood cell count indicators were compared between the restricted and unrestricted groups.
Logistics multivariate analysis was used to examine the risk factors contributing to the patients with FGR.
In this study, the XGBoost algorithm model in the R software (version 3.6.1, University of Auckland, Auckland, New Zealand) package was used to analyze the indicators included in the above FGR model, which were set as the test set and training set, respectively, in the ratio of 2:8. In this model, max_depth is set to 100, objective is set to binary: logistic, Eta is set to 0.4, thread is set to –1, and ROC curve analysis is performed to test the accuracy of the model.
We used SPSS 22.0 (SPSS Inc., Chicago, IL, USA) and the R (3.6.1) softwares to
analyze the data. Continuous data are expressed as the mean
Prepregnancy BMI, number of births, number of maternity examination, eclampsia
staging, and amniotic fluid excess were significantly different between the
restricted and nonrestricted groups (p
| Restricted (n = 62) | Nonrestricted (n = 241) | p-value | |||
| Age (years), mean (SD) | 33.06 |
31.78 |
1.797 | 0.075 | |
| Height (cm) | 155.08 |
156.22 |
1.456 | 0.146 | |
| Prepregnancy BMI (kg/m |
21.87 |
23.09 |
2.677 | 0.008 | |
| Systolic blood pressure (mmHg) | 118.69 |
119.49 |
0.512 | 0.609 | |
| Diastolic blood pressure (mmHg) | 74.65 |
74.22 |
0.359 | 0.720 | |
| The number of births | 0 times | 15 (24.19) | 115 (47.72) | 12.901 | 0.005 |
| 1 time | 42 (67.74) | 106 (43.98) | |||
| 2 times | 5 (8.06) | 17 (7.05) | |||
| 3 times | 0 (0.00) | 3 (1.24) | |||
| The number of maternity examinations | 17 (27.42) | 39 (16.18) | 4.133 | 0.042 | |
| 45 (72.58) | 202 (83.82) | ||||
| Eclampsia stages | Mild | 20 (32.26) | 115 (47.72) | 4.771 | 0.029 |
| Severe | 42 (67.74) | 126 (52.28) | |||
| Fundus abnormalities | Yes | 9 (14.52) | 19 (7.88) | 2.586 | 0.108 |
| No | 53 (85.48) | 222 (92.12) | |||
| Low amniotic fluid | Yes | 9 (14.52) | 11 (4.56) | 7.922 | 0.005 |
| No | 53 (85.48) | 230 (95.44) | |||
SD, standard deviation; BMI, body mass index.
Patients in the restricted group had significantly higher C1q, CRP, PTA, APTT,
ALB, ALT, AST, UA, Urea, Cr, ApoA1, low-density lipoprotein cholesterol (LDL-C),
TC, TG, Neu, Plt, and Neu/Lym (p
| Restricted (n = 62) | Nonrestricted (n = 241) | t | p-value | ||
| Complementary inflammatory indicators | C1q (mg/L) | 196.31 |
186.34 |
3.136 | 0.002 |
| CRP (mg/dL) | 1.33 |
0.88 |
6.76 | 0.000 | |
| Coagulation indicators | PTA (%) | 94.91 |
90.04 |
2.917 | 0.004 |
| APTT (s) | 30.99 |
30.06 |
3.557 | 0.000 | |
| Fib (g/L) | 3.47 |
3.01 |
1.555 | 0.121 | |
| TT (s) | 13.40 |
13.85 |
1.792 | 0.074 | |
| Hepatobiliary function indicators | ALB (g/L) | 43.75 |
43.03 |
2.411 | 0.017 |
| ALT (U/L) | 15.66 |
13.94 |
5.371 | 0.000 | |
| AST (U/L) | 18.94 |
16.08 |
11.478 | 0.000 | |
| TBA (µmol/L) | 1.30 |
1.45 |
8.471 | 0.000 | |
| Renal function indicators | UA (µmol/L) | 237.24 |
218.77 |
10.647 | 0.000 |
| Urea (mmol/L) | 3.33 |
3.21 |
5.233 | 0.000 | |
| Cr (µmol/L) | 61.88 |
59.09 |
10.596 | 0.000 | |
| P (mmol/L) | 1.22 |
1.28 |
3.241 | 0.001 | |
| Ca (mmol/L) | 2.33 |
2.30 |
0.363 | 0.717 | |
| Lipid indicators | ApoA1 (g/L) | 1594.06 |
1589.66 |
2.546 | 0.011 |
| HDL-C (mmol/L) | 1.34 |
1.42 |
5.011 | 0.000 | |
| LDL-C (mmol/L) | 2.37 |
2.16 |
3.413 | 0.001 | |
| Lp (a) (mg/L) | 84.54 |
94.52 |
20.104 | 0.000 | |
| TC (mmol/L) | 4.11 |
3.91 |
3.543 | 0.000 | |
| TG (mmol/L) | 1.14 |
0.95 |
6.253 | 0.000 | |
| Blood cell count | Lim (× 10 |
1.91 |
1.81 |
1.425 | 0.155 |
| Neu (× 10 |
5.92 |
5.41 |
4.125 | 0.000 | |
| Plot (× 10 |
259.48 |
244.77 |
56.671 | 0.000 | |
| Neu/Lym | 3.07 |
2.12 |
3.465 | 0.001 | |
| Plt/Lym | 135.94 |
135.81 |
0.411 | 0.681 | |
C1q, component 1q; CRP, C-reactive protein; PTA, prothrombin time activity; APTT, activated partial thromboplastin time; Fib, fibrinogen; TT, thrombin time; ALB, albumin; ALT, alanine aminotransferase; AST, glutamic oxaloacetic transaminase; TBA, total bile acid; UA, uric acid; Urea, urea; Cr, creatinine; ApoA1, apolipoprotein A-I; HDL-C, high-density lipoprotein cholesterol; LDL-C, low-density lipoprotein cholesterol; Lp (a), lipoprotein (a); TC, total cholesterol; TG, triglyceride; Neu, neutrophil; Lym, lymphocytosis; Plt, platelet.
Multivariate analysis revealed that higher prepregnancy BMI, number of births, number of maternity examinations, eclampsia staging, C1q, CRP, PTA, APTT, ALB, ALT, AST, UA, Urea, Cr, ApoA1, LDL-C, TC, TG, Neu, Plt, Neu/Lym, presence of low amniotic fluid and lower TBA, P, HDL-C, Lp (a) were risk factors for FGR (Tables 3,4).
| Assignment | |
| Prepregnancy BMI | Actual value |
| The number of births | 0 = 0 times, 1 = 1 times, 2 = 2 times, 3 = 3 times |
| The number of maternity examinations | 0 = |
| Eclampsia stages | 0 = Mild, 1= Serve |
| Fundus abnormalities | 0 = No, 1= Yes |
| Low amniotic fluid | 0 = No, 1= Yes |
| C1q | Actual value |
| CRP | Actual value |
| PTA | Actual value |
| APTT | Actual value |
| ALB | Actual value |
| ALT | Actual value |
| AST | Actual value |
| TBA | Actual value |
| UA | Actual value |
| Urea | Actual value |
| Cr | Actual value |
| P | Actual value |
| ApoA1 | Actual value |
| HDL-C | Actual value |
| LDL-C | Actual value |
| Lp (a) | Actual value |
| TC | Actual value |
| TG | Actual value |
| Neu | Actual value |
| Plot | Actual value |
| Neu/Lym | Actual value |
BMI, body mass index; C1q, component 1q; CRP, C-reactive protein; PTA, prothrombin time activity; APTT, activated partial thromboplastin time; Fib, fibrinogen; TT, thrombin time; ALB, albumin; ALT, alanine aminotransferase; AST, glutamic oxaloacetic transaminase; TBA, total bile acid; UA, uric acid; Urea, urea; Cr, creatinine; ApoA1, apolipoprotein A-I; HDL-C, high-density lipoprotein cholesterol; LDL-C, low-density lipoprotein cholesterol; Lp (a), lipoprotein (a); TC, total cholesterol; TG, triglyceride; Neu, neutrophil; Lym, lymphocytosis.
| S.E. | Wald | p-value | OR | 95% CI | ||
| Prepregnancy BMI | 1.037 | 3.574 | 1.313 | 0.001 | 1.263 | 1.038–1.903 |
| The number of births | 1.107 | 4.229 | 1.491 | 0.002 | 1.503 | 1.035–1.995 |
| The number of maternity examinations | 1.203 | 3.303 | 1.566 | 0.000 | 1.628 | 1.037–1.987 |
| Eclampsia stages | 1.422 | 3.453 | 1.602 | 0.000 | 1.198 | 1.039–1.949 |
| Fundus abnormalities | 1.237 | 4.624 | 1.812 | 0.000 | 1.355 | 1.002–1.988 |
| Low amniotic fluid | 1.062 | 5.375 | 1.434 | 0.000 | 1.543 | 1.039–1.969 |
| C1q | 1.377 | 3.397 | 1.373 | 0.000 | 1.716 | 1.078–1.975 |
| CRP | 1.011 | 4.286 | 1.919 | 0.000 | 1.059 | 1.005–1.972 |
| PTA | 1.251 | 2.36 | 1.53 | 0.000 | 1.676 | 1.094–1.962 |
| APTT | 1.078 | 2.23 | 1.994 | 0.000 | 1.609 | 1.028–1.951 |
| ALB | 1.366 | 4.236 | 1.565 | 0.000 | 1.501 | 1.052–1.96 |
| ALT | 1.144 | 4.871 | 1.636 | 0.000 | 1.323 | 1.025–1.916 |
| AST | 1.059 | 3.934 | 1.455 | 0.000 | 1.899 | 1.003–1.972 |
| TBA | 1.342 | 3.916 | 1.793 | 0.000 | 0.311 | 0.009–0.908 |
| UA | 1.311 | 4.948 | 1.409 | 0.000 | 1.796 | 1.043–1.908 |
| Urea | 1.342 | 2.703 | 1.995 | 0.000 | 1.728 | 1.043–1.978 |
| Cr | 1.296 | 3.069 | 1.397 | 0.000 | 1.804 | 1.062–1.915 |
| P | 1.148 | 4.517 | 1.706 | 0.000 | 0.206 | 0.091–0.907 |
| ApoA1 | 1.165 | 3.953 | 1.551 | 0.000 | 1.279 | 1.097–1.911 |
| HDL-C | 1.324 | 2.906 | 1.585 | 0.000 | 0.618 | 0.051–0.949 |
| LDL-C | 1.184 | 2.659 | 1.958 | 0.000 | 1.163 | 1.086–1.958 |
| Lp (a) | 1.078 | 4.753 | 1.413 | 0.000 | 0.231 | 0.026–0.991 |
| TC | 1.014 | 3.557 | 1.811 | 0.000 | 1.397 | 1.077–1.967 |
| TG | 1.230 | 5.168 | 1.725 | 0.000 | 1.712 | 1.091–1.914 |
| Neu | 1.063 | 3.481 | 1.637 | 0.000 | 1.929 | 1.09–1.98 |
| Plot | 1.112 | 2.256 | 1.464 | 0.000 | 1.76 | 1.093–1.961 |
| Neu/Lym | 1.333 | 2.511 | 1.353 | 0.000 | 1.507 | 1.027–1.978 |
| Constant | −2.861 | 2.251 | 51.251 | 0.000 |
S.E., standard error; BMI, body mass index; OR, odds ratio; CI, confidence interval; C1q, component 1q; CRP, C-reactive protein; PTA, prothrombin time activity; APTT, activated partial thromboplastin time; ALB, albumin; ALT, alanine aminotransferase; AST, glutamic oxaloacetic transaminase; TBA, total bile acid; UA, uric acid; Urea, urea; Cr, creatinine; ApoA1, apolipoprotein A-I; HDL-C, high-density lipoprotein cholesterol; LDL-C, low-density lipoprotein cholesterol; Lp (a), lipoprotein (a); TC, total cholesterol; TG, triglyceride; Neu, neutrophil; Lym, lymphocytosis.
The risk factors for FGR were analyzed by the XGBoost algorithm model in order of importance as TG, TC, Lp (a), LDL-C, HDL-C, ApoA1, P, Cr, Urea, UA, TBA, AST, ALT, ALB, APTT, PTA, Neu, CRP, C1q, hypohydramnios, fundus abnormalities, Plt, eclampsia stage, number of births, number of deliveries, prenatal BMI. Plt, eclampsia staging, number of births, number of deliveries, and prepregnancy BMI (Fig. 1). ROC curve analysis revealed that the area under the curve of the XGBoost algorithm model was 0.851 showing a good fit (Fig. 2).
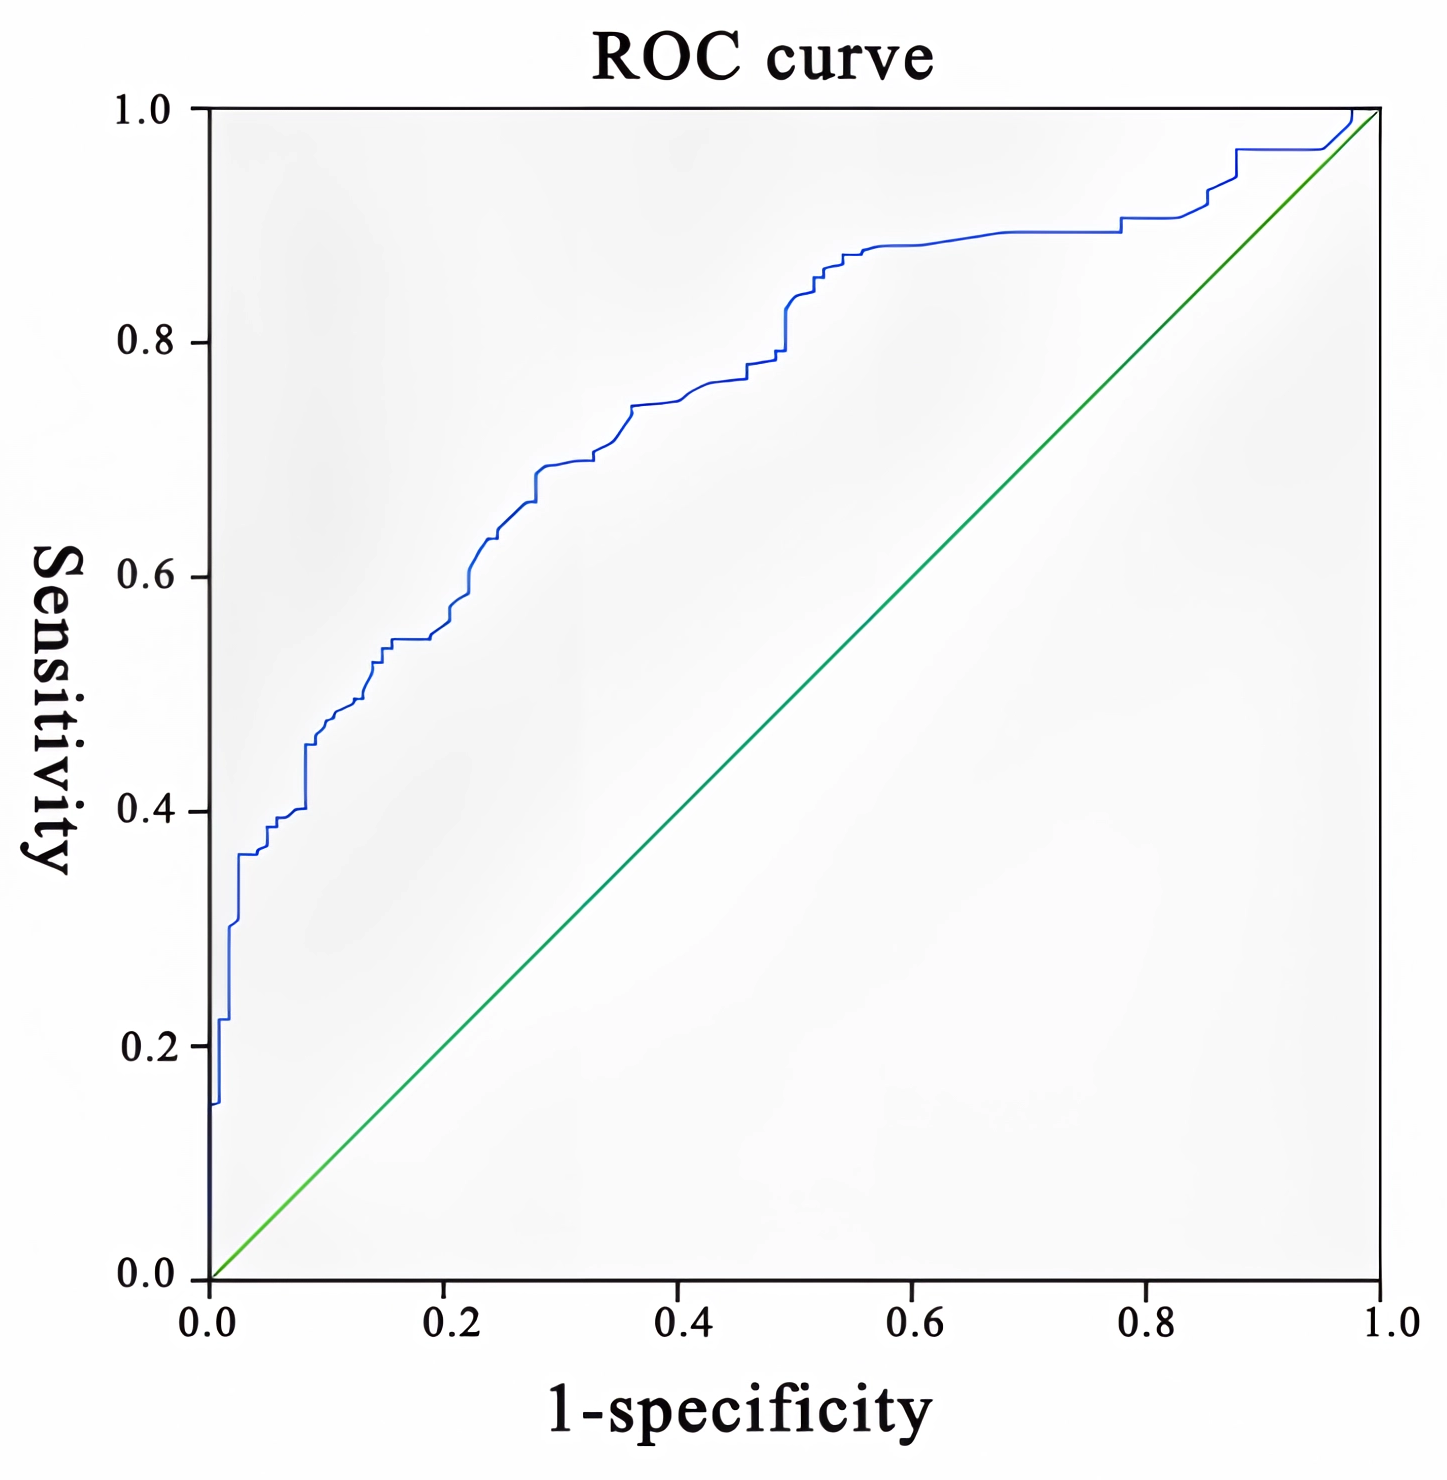 Fig. 1.
ROC curve of the XGBoost algorithm model. ROC, receiver operating characteristic; XGBoost, extreme Gradient Boosting.
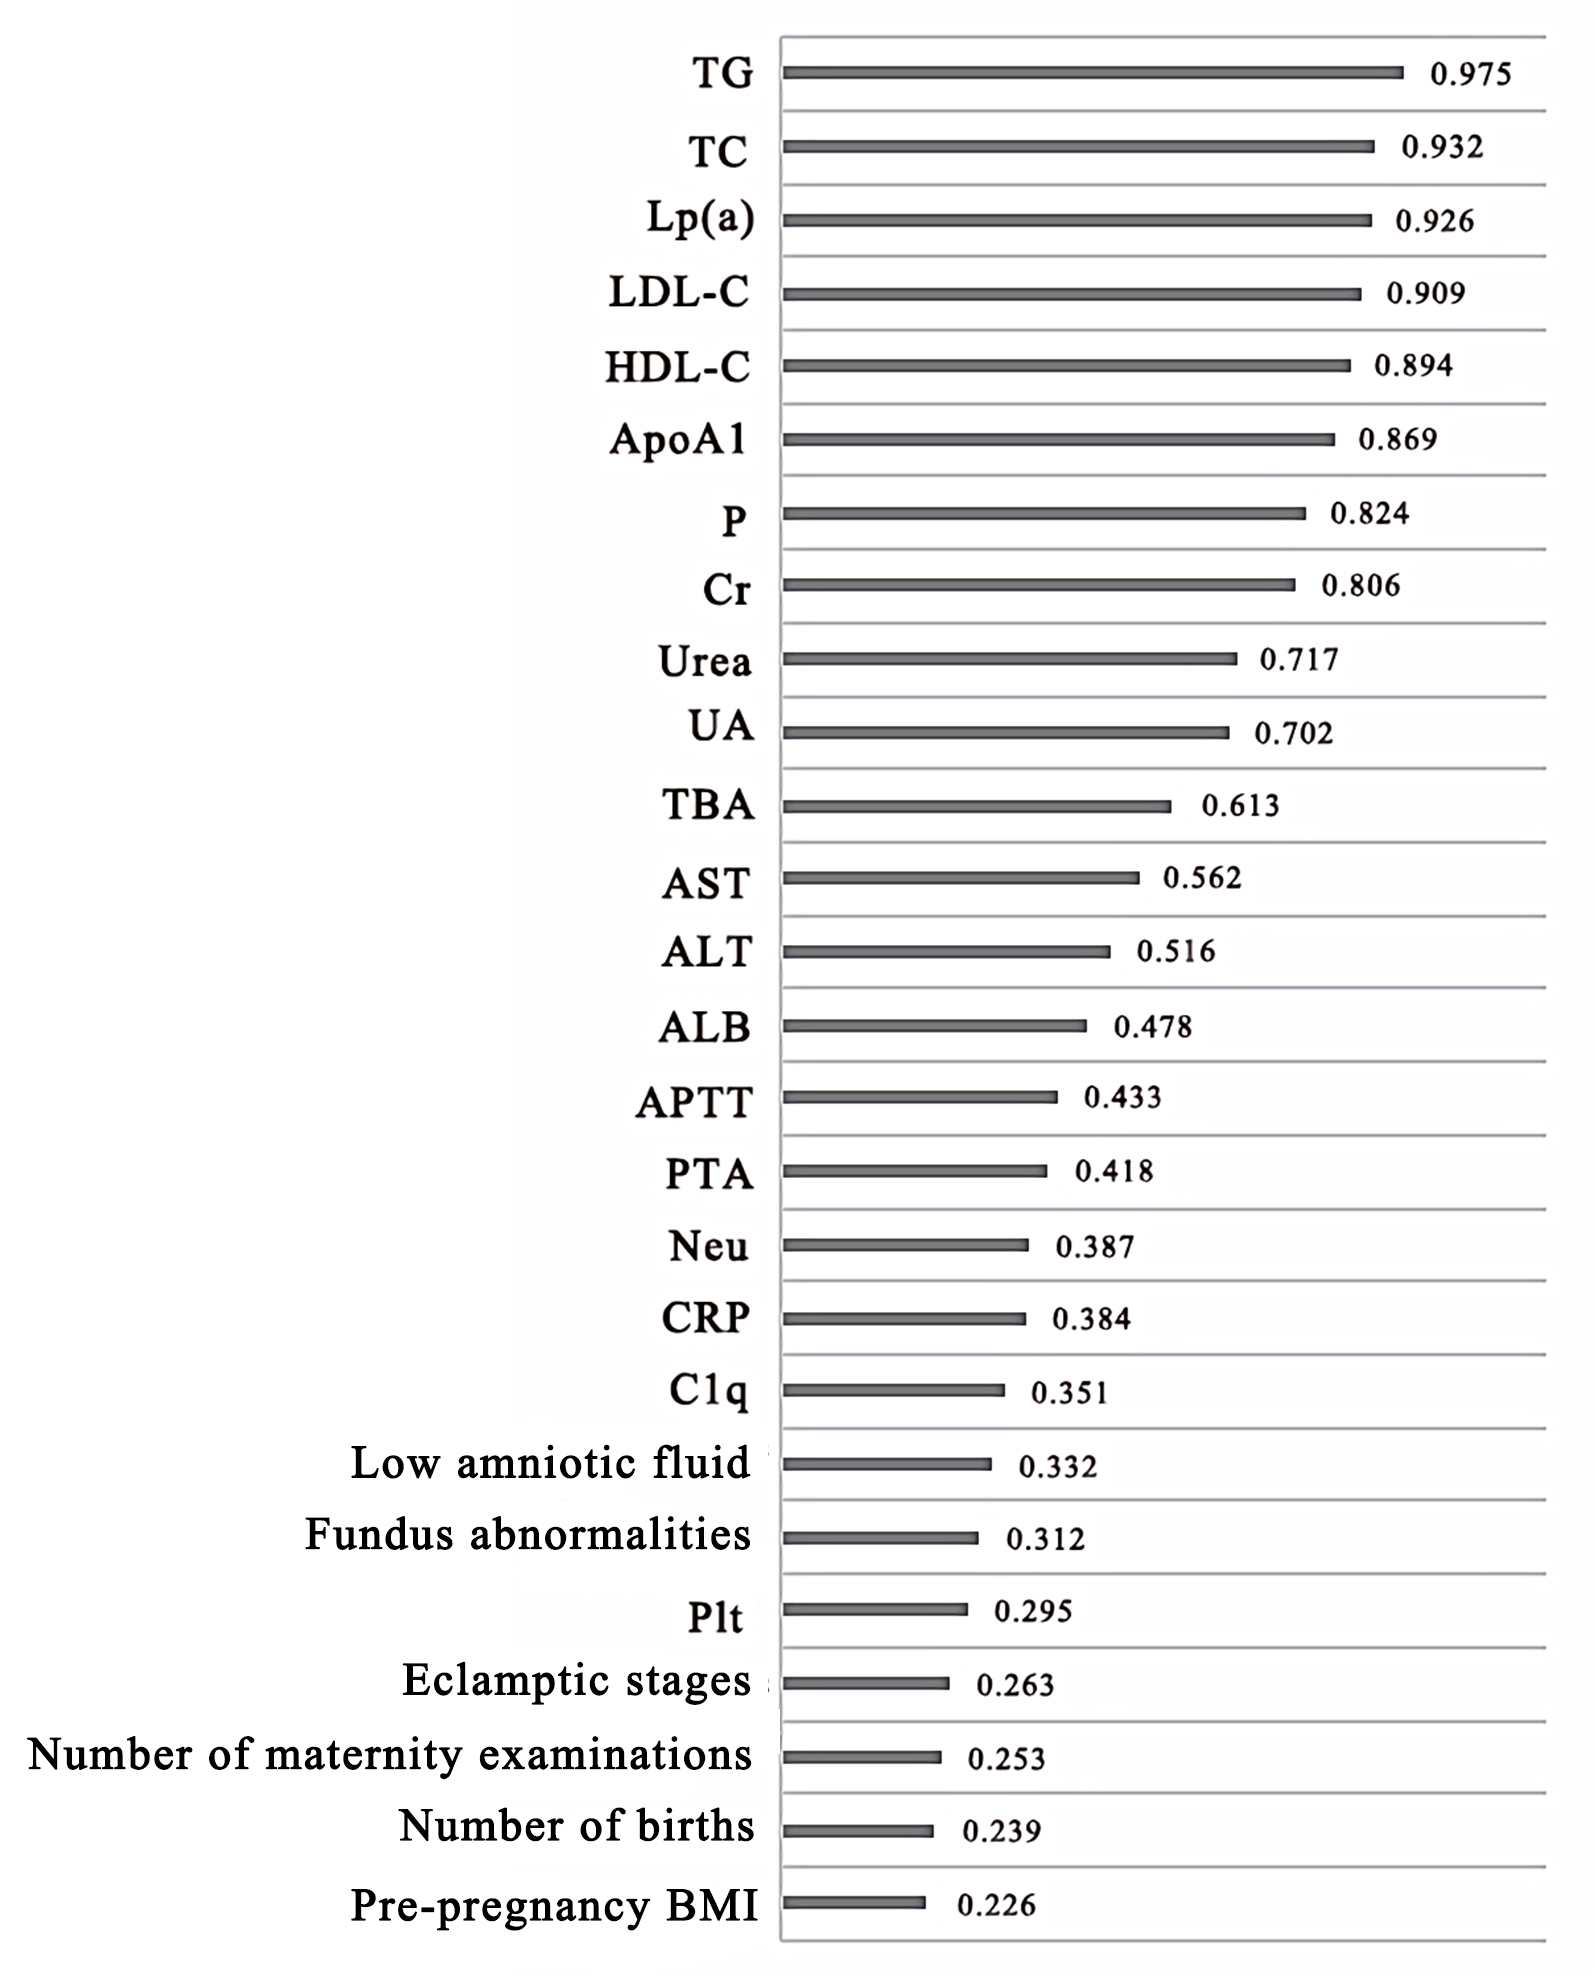 Fig. 2.
ROC curve analysis of the XGBoost algorithm model showing the risk factors. ROC, receiver operating characteristic; XGBoost, extreme Gradient Boosting.
Generally, the onset of PE is associated with endothelial damage, local blood circulation disorders, inflammatory reactions, and oxidative stress. In this process, as the local inflammatory and oxidative stress responses develop, various inflammatory indicators and products of oxidative stress activate the relevant signaling pathways in the body, resulting in a hypercoagulable state with the risk of local capillary thrombosis is significantly increased. The reduced function of the placenta and local vascular perfusion affect fetal growth and development. In the development of PE, the chorionic trophoblast cells are not sufficiently activated in the intrauterine spiral arteries, with impaired remodeling, resulting in inadequate oxygen supply to the fetus, leading to FGR.
The clinical data and laboratory indicators of the two groups of patients showed that prepregnancy BMI, number of births, number of maternity examinations, eclampsia stage, and amniotic fluid were significantly higher in the group with FGR than in the group without FGR. In addition, a study showed that mothers with FGR had a lower BMI compared to mothers with normal fetuses, providing evidence that the maternal BMI plays a crucial role in intrauterine fetal growth and development during pregnancy [11]. A higher number of births can affect body functions and is an important cause of FGR. Regular check-ups during pregnancy promote the health knowledge of the mother and allow her to closely follow the development of the baby so that if any abnormalities occur, timely interventions can be made. Low amniotic fluid compresses the umbilical cord, which can lead to reduced blood circulation to the fetus resulting in hypoxia and asphyxia [12, 13]. Moreover, low amniotic fluid can cause alterations in fetal bowel movements, increased fetal defecation, and a higher risk of amniotic fluid contamination, which is also an significant cause of FGR [14, 15, 16].
In this study, complement inflammation, coagulation, liver, biliary and renal function, lipid profile, and blood cell counts were important factors that affect the growth and development of the fetus. During fetal development, the activation of the complement system is needed to remove the many cellular debris and apoptotic cells derived from the placenta [17]. Therefore, inadequate or excessive activation of the complement system can increase inflammatory response at the local lesion.
In this study, however, in the analysis of blood counts, there were significant abnormalities in Neu, Plt, and Neu/Lym in the patients with FGR. Coagulation disorders are important in activating the platelets and the rise in aggregation capacity, which, along with coagulation disorders, ultimately results in inadequate blood supply to the fetus [18]. Moreover, damage and subtle alterations to the local capillaries of the liver and kidney tissues due to the continuous development of coagulation and blood inflammatory reactions, resulting in abnormal metabolism of local proteins and enzymes as well as alterations in capillary permeability and barrier effects, are important in causing abnormalities in liver and kidney indicators [19]. High lipid levels are also an important cause of local spiral atherosclerosis and reduced vascular smoothness and local thrombosis, and impaired nutrient transport [20].
In this study, the above risk factors were incorporated into the XGBoost algorithm model for further analysis using machine learning, which effectively avoided overfitting in the conventional multifactor analysis [21]. Moreover, its analysis of risk factors was more accurate. The ROC curves analysis revealed a high accuracy of the XGBoost algorithm model for FGR.
In future clinical application, abnormal conditions of TG, TC and Lp (a) can be used as an important basis for the evaluation of fetal growth and development restriction in patients with preeclampsia and the evaluation of therapeutic intervention effects.
The top three risk factors for predicting FGR in PE patients using the XGBoost algorithm model are TG, TC, and Lp (a), which are important predictors of poor prognosis in clinical settings. Therefore, the XGBoost model can be applied in clinical settings and assist clinicians in tailoring precise management for FGR.
All data generated for this study are included in the article.
SW designed the research, performed the research, contributed new reagents or analytic tools, analyzed the data and wrote the manuscript. HL and CZ performed the research and helped in writing of the manuscript. All authors read and approved the final manuscript. All authors have participated sufficiently in the work and agreed to be accountable for all aspects of the work.
All subjects gave their informed consent for inclusion before they participated in the study. The study was conducted in accordance with the Declaration of Helsinki. This study was approved by the Medical Ethics Committee of Wuming Hospital Affiliated to Guangxi Medical University [approval number: WM-2022 (217)].
We thank 51runse (https://www.51runse.cn/) for the English language editing during the preparation of this manuscript.
This research was supported by the Guangxi Natural Science Foundation Project (2020GXNSFAA159046) and the Health Commission of Guangxi Autonomous Region (Z20210050).
The authors declare no conflict of interest.
Publisher’s Note: IMR Press stays neutral with regard to jurisdictional claims in published maps and institutional affiliations.