


 , Doruk Cevdi Katlan 1, Nebahat Uzunay 1
1 Department of Obstetrics and Gynecology, Istanbul Education and Research Hospital, University of Health Sciences Turkey, 34722 Istanbul, Turkey
Abstract
Background: Gestational diabetes mellitus (GDM) is a well-known risk
factor for pregnancy complications. While hemoglobin A1c (HbA1c) is widely used
as a glycemic control indicator, it is known to exhibit falsely low or high
levels during gestation. The purpose of the present study is to analyze the
fluctuations in HbA1c levels throughout pregnancy in diabetic (DM) and non-DM
women with or without iron deficiency anemia (A). Methods: Medical
records of pregnant women who were followed up in our obstetrics clinic between
2018 and 2022 were reviewed. Demographics, gestational history, and biochemistry
values including fasting glucose, HbA1c, erythrocyte and iron metabolism indexes
were recorded. Statistical analysis was carried out by Mann-Whitney U and
Bonferroni corrected one-way analysis of variance (ANOVA) tests.
Results: 670 pregnant women (32
Keywords
- diabetes mellitus
- pregnancy
- hemoglobin A1c
- iron deficiency anemia
- gestational diabetes
The prevalence of diabetes mellitus (DM) among women of child-bearing age has been steadily increasing worldwide [1]. International Diabetes Federation estimated a global prevalence of 16% for hyperglycemia in pregnancy, adding gestational diabetes mellitus (GDM) to type I and II DM [2]. Several recent studies have shown that tight control of blood glucose during this period is necessary to reduce the risk of maternal complications, such as preeclampsia, and adverse perinatal outcomes, such as intrauterine death, congenital abnormalities, macrosomia, and neonatal morbidities [3, 4]. Hemoglobin A1c (HbA1c), formed by glycation of the terminal chain of hemoglobin which reflects, patients’ glycemic status over previous 3 to 4 months. It is currently the most widely used standard marker, serving as a diagnostic criterion for DM and as a screening test for clinical management [5].
However, many recent studies have shown that HbA1c is influenced by several physical factors, such as hemoglobinopathies, hemolytic anemia (A), bleeding, renal azotemia, vitamin B12 deficiency, pregnancy, and iron deficiency A, and it may not reflect glycemic control accurately [6, 7]. Furthermore, several studies report a link between reduced iron stores and increased glycation of HbA1c, resulting in false high values in non-diabetic (non-DM) individuals [4, 8, 9]. Moreover, several recent reports have demonstrated that HbA1c shows a biphasic change, with the trough level occurring at week 24 of pregnancy [8, 9, 10]. Most of these studies suggest a significant increase in HbA1c in late pregnancy as iron deficiency proceeds [10, 11].
In the present study, we aimed to measure the changes in HbA1c level throughout pregnancy in DM and non-DM women. We also evaluated the influence of iron deficiency A on HbA1c values during pregnancy.
Patients provided written informed consent to allow the use of data from their medical records in research. The study was approved by our institutions’s Ethics’ Committee (Health Sciences University, Istanbul Education and Research Hospital, date: 25.03.2022, number: 102). Reported investigations have been carried out in accordance with the principles of the Declaration of Helsinki, as revised in 2000 [12]. Medical records of pregnant women who were followed up in our obstetrics clinic, between January 2018 and December 2022, were reviewed. Demographic data, gestational history, and biochemistry values were recorded cross-sectionally using Excel software (Microsoft Office, Windows 11, Chicago, IL, USA). Only singleton pregnancies were included. Patients with chronic inflammatory diseases, high C-reactive protein (CRP) levels, those under 18 years of age, or those with folate or vitamin B12 deficiency were excluded from the study. Women with all types of hemoglobinopathies (fetal haemoglobin (HbF), hemoglobin A2 (HbA2), hemoglobin E (HbE), sickle hemoglobin (HbS), etc.) were also excluded.
Indicators of glycemic control (fasting serum glucose and HbA1c) and iron-related parameters (hemoglobin, hematocrit, serum ferritin, and mean corpuscular volume (MCV)) were analyzed by high-performance liquid chromatography, calorimetric and chemiluminescent immunoassay methods using auto-analyzers (Siemens Healthineers Diagnostics Co., Erlangen, Germany). Patients with hemoglobin level below 11 g/dL and serum ferritin value below 15 µg/mL were defined as to have iron deficiency A, while those with previous history of DM, abnormal oral glucose tolerence test (OGTT) at 24 weeks of pregnancy or with high fasting glucose level above 100 mg/dL or HbA1c above 6% were diagnosed as DM (gestational, type I or II) [11].
Statistical package for social sciences (SPSS 2018 IBM version 11.5, Chicago,
IL, USA) was used for the statistical analysis. Descriptive values were expressed
as number (n), percentage (%), median or mean with standard deviation
(
A total of 670 pregnant women (mean age
| Variable | DM | Non-DM | A | Non-A | Trimesters | Pregnancy | p | |||
| First | Second | Third | First | Second | ||||||
| Age (y |
33 |
30 |
31.5 |
31 |
32 |
32 |
31 |
33 |
31 |
|
| Gravida (n |
3 |
2 |
3 |
2 |
2 |
2 |
3 |
2 |
3 |
|
| Parity (n |
2 |
1 |
2 |
1 |
1 |
1 |
1 |
1 |
1 |
|
| Abortus (n |
0.4 |
0 | 0.2 |
0 | 0.5 |
0 | 0 | 0.5 |
0 | |
| Living children (n |
2 |
1.9 |
2 |
1.8 |
1 |
1 |
1 | 2 |
2 |
|
DM, diabetes mellitus (diabetic patient); Non-DM, non-diabetic; A, anemia
(anemic patient); Non-A, non-anemic; SD, standard deviation; Trimesters: first
(0–13 weeks), second (14–28 weeks), third (29–42 weeks); Pregnancy: first half
(0–20 weeks), second half (
| Groups | Number (N) | Trimester | Pregnancy | |||
| First | Second | Third | First | Second | ||
| Non-DM and non-A | 327 (48.8%) | 75 (22.9%) | 84 (25.6%) | 168 (51.3%) | 112 (34.2%) | 215 (65.7%) |
| Non-DM and A | 103 (15.3%) | 4 (3.8%) | 19 (18.4%) | 80 (77.6%) | 11 (10.6%) | 92 (89.3%) |
| DM and non-A | 173 (25.8%) | 21 (12.1%) | 51 (29.4%) | 101 (58.3%) | 35 (20.2%) | 138 (79.7%) |
| DM and A | 67 (10%) | 5 (7.4%) | 17 (25.3%) | 45 (67.1%) | 9 (13.4%) | 58 (86.5%) |
| Total | 670 (100%) | 105 (15.6%) | 171 (25.5%) | 394 (58.8%) | 167 (24.9%) | 503 (75%) |
DM, diabetes mellitus (diabetic patient); Non-DM, non-diabetic; A, anemia
(anemic patient); Non-A, non-anemic; Trimesters: first
(0–13 weeks), second (14–28 weeks), third (29–42 weeks); Pregnancy: first half
(0–20 weeks), second half (
| Parameters | Non-DM and non-A (N = 327) | Non-DM and A (N = 103) | DM and non-A (N = 173) | DM and A (N = 67) |
| Hemoglobin (g/dL) | 13.1 + 1.9 | 9.6 + 1.4** | 12.9 + 1 | 9.1 + 1.9** |
| Hematocrit (%) | 38.4 + 2.7 | 34.7 + 3.7** | 37 + 2.2 | 32.1 + 4** |
| MCV (fL) | 84.1 + 4.1 | 74 + 2.1* | 82.9 + 2.1 | 73 + 3.1* |
| Ferritin (µg/mL) | 18.4 + 3.6 | 5.03 + 3** | 17 + 2.4 | 4.7 + 2.2** |
| Fasting glucose (mg/dL) | 85 + 7 | 88 + 4.6 | 128 + 12** | 135 + 21** |
| HbA1c (%) | 5.1 + 0.8 | 5.2 + 0.9 | 6 + 0.4* | 6.4 + 0.7** |
DM, diabetes mellitus (diabetic patient); Non-DM, non-diabetic; A, anemia
(anemic patient); MCV, mean corpuscular volume; HbA1c, hemoglobin A1c; all values
are expressed as mean
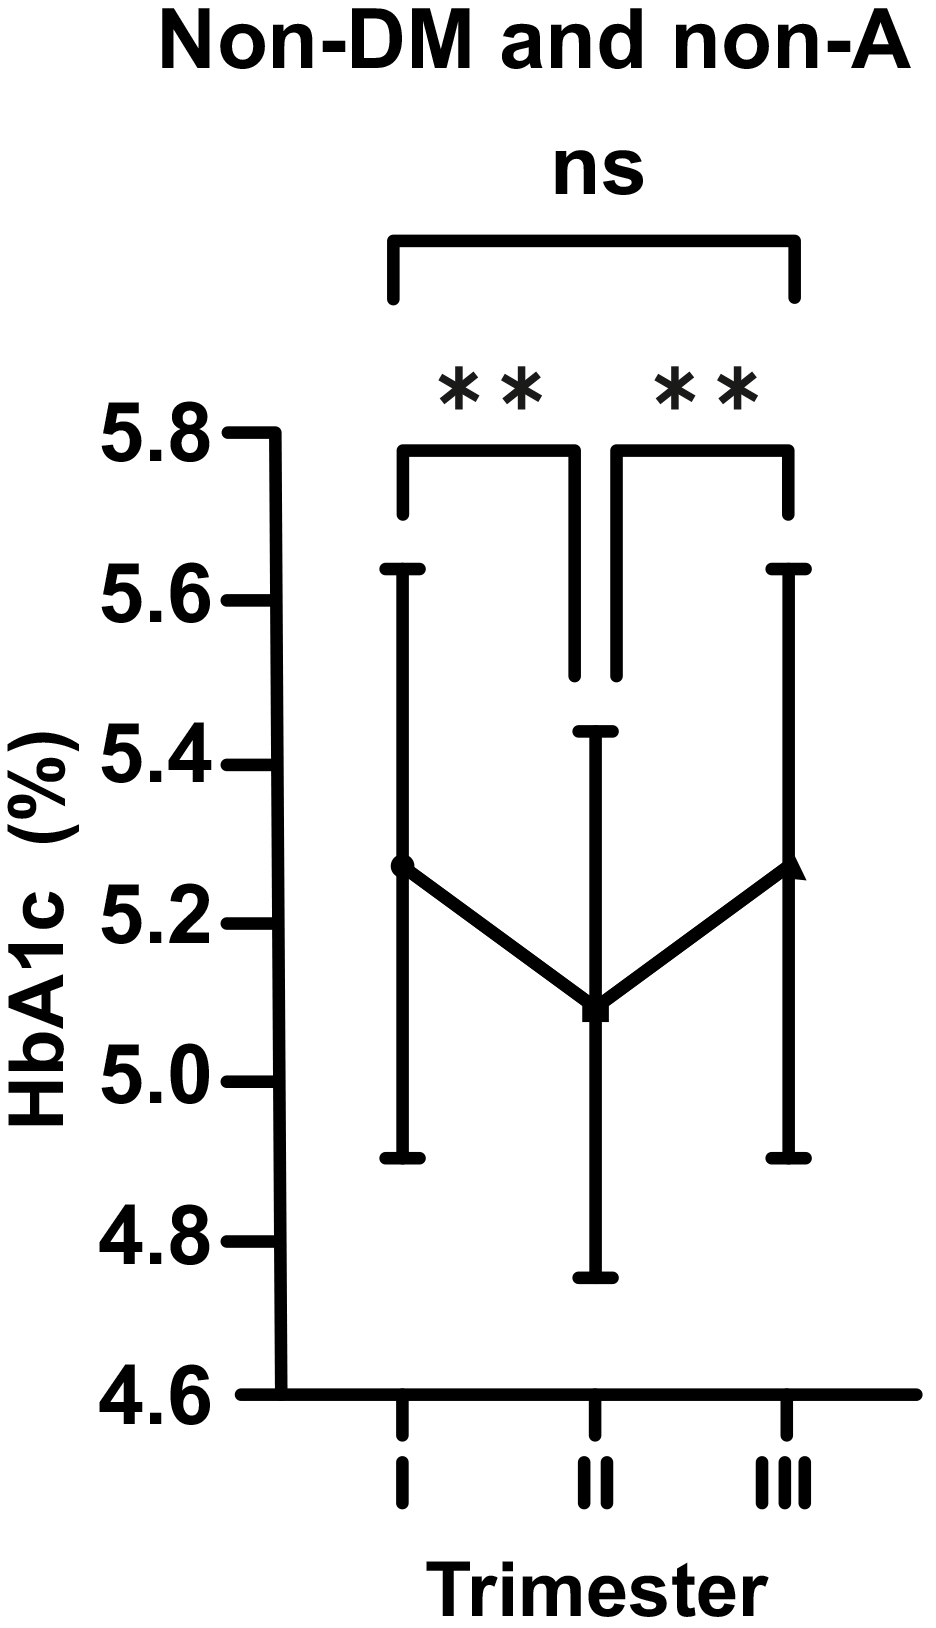
In normal pregnant women (non-DM and non-A; control group), HbA1c levels were
seen to decrease considerably from the beginning to the middle of pregnancy (mean
5.29 vs. 5.08%; p
 Fig. 1.
Changes in HbA1c levels in non-diabetic (non-DM) and non-anemic
(non-A) women throughout gestation. Trimesters: I, first (0–13 weeks); II,
second (14–28 weeks); and III, third (29–42 weeks). **p
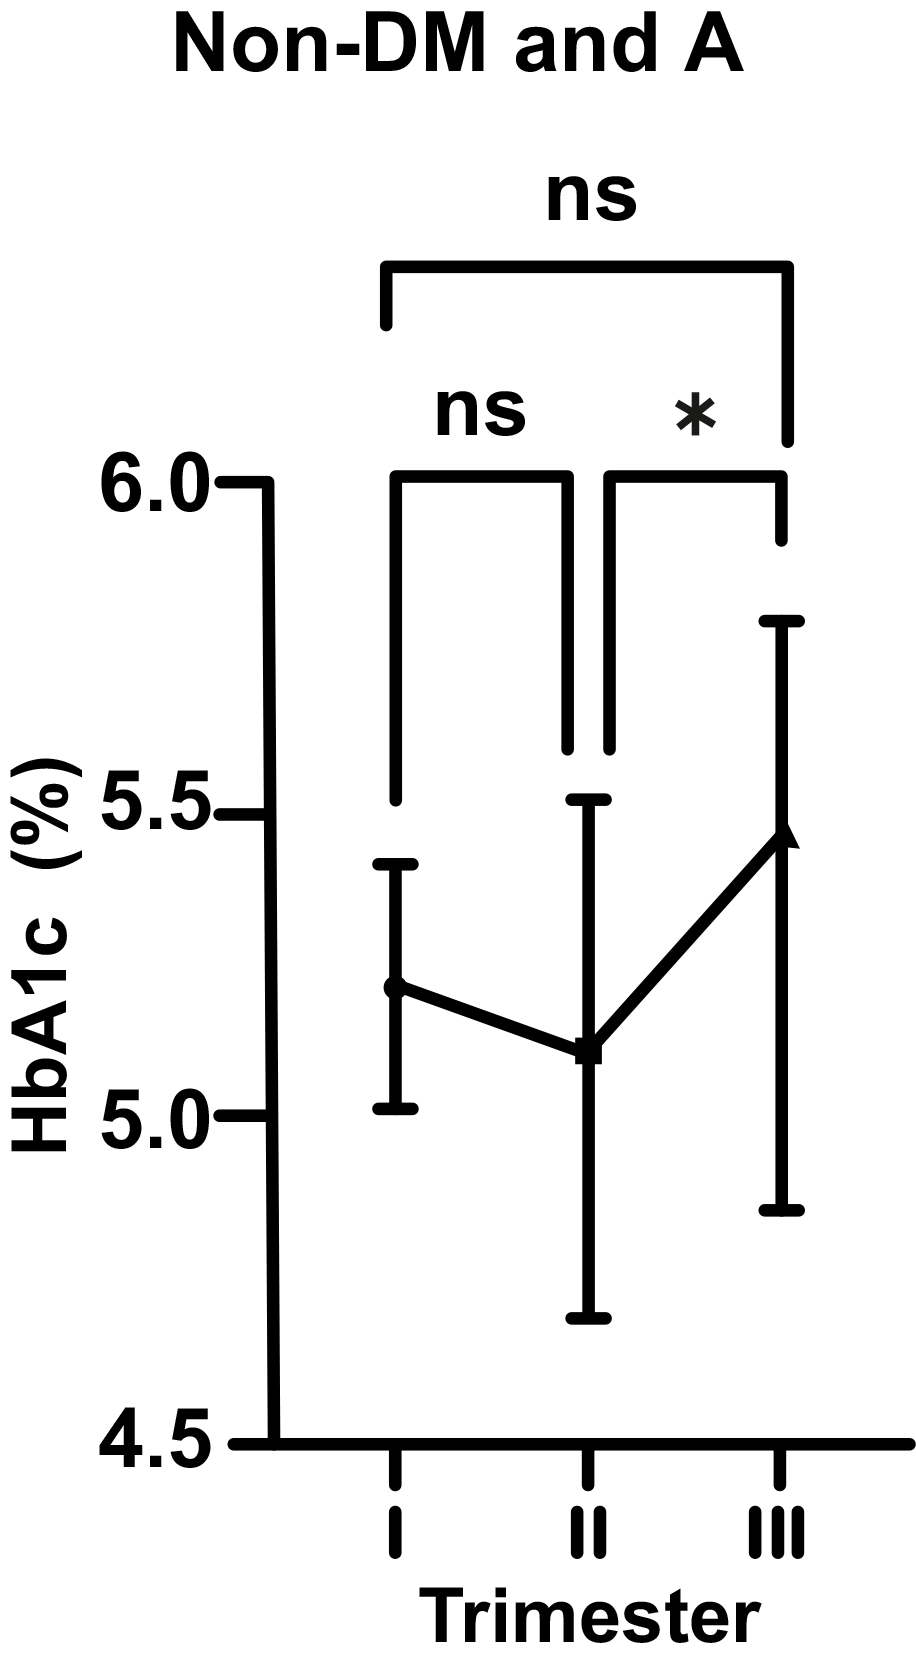
As for non-DM and A pregnant women, there was a statistically insignificant
decrease in HbA1c level from 5.25 to 5.19% (p
 Fig. 2.
Changes in HbA1c levels in non-diabetic (non-DM) and anemic (A)
women throughout gestation. Trimesters: I, first (0–13 weeks); II, second
(14–28 weeks); and III, third (29–42 weeks). *p
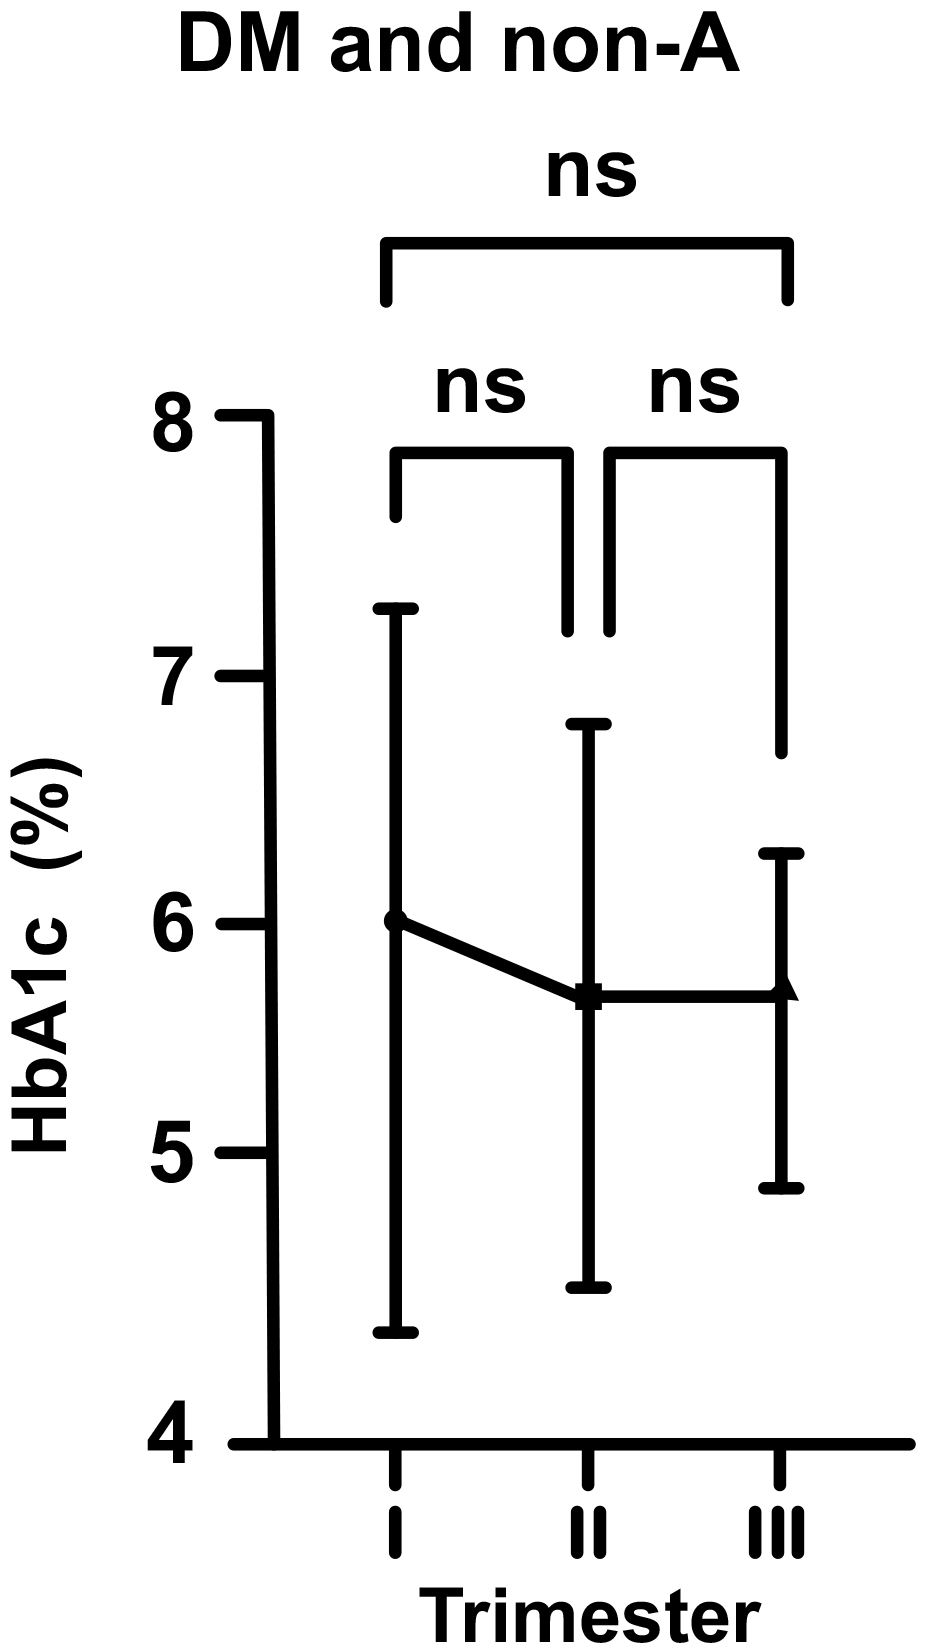
In DM and non-A pregnants, the mean HbA1c level at the beginning of pregnancy
was 6.05% (just above the upper range). According to above described, this value
dropped to 5.79% in the second trimester, and then increased to 5.81% in third
trimester of pregnancy (for each group, p
 Fig. 3.
Changes in HbA1c levels in diabetic (DM) and non-anemic (non-A)
women throughout gestation. Trimesters: I, first (0–13 weeks); II, second
(14–28 weeks); and III, third (29–42 weeks). ns, non-significant
(p
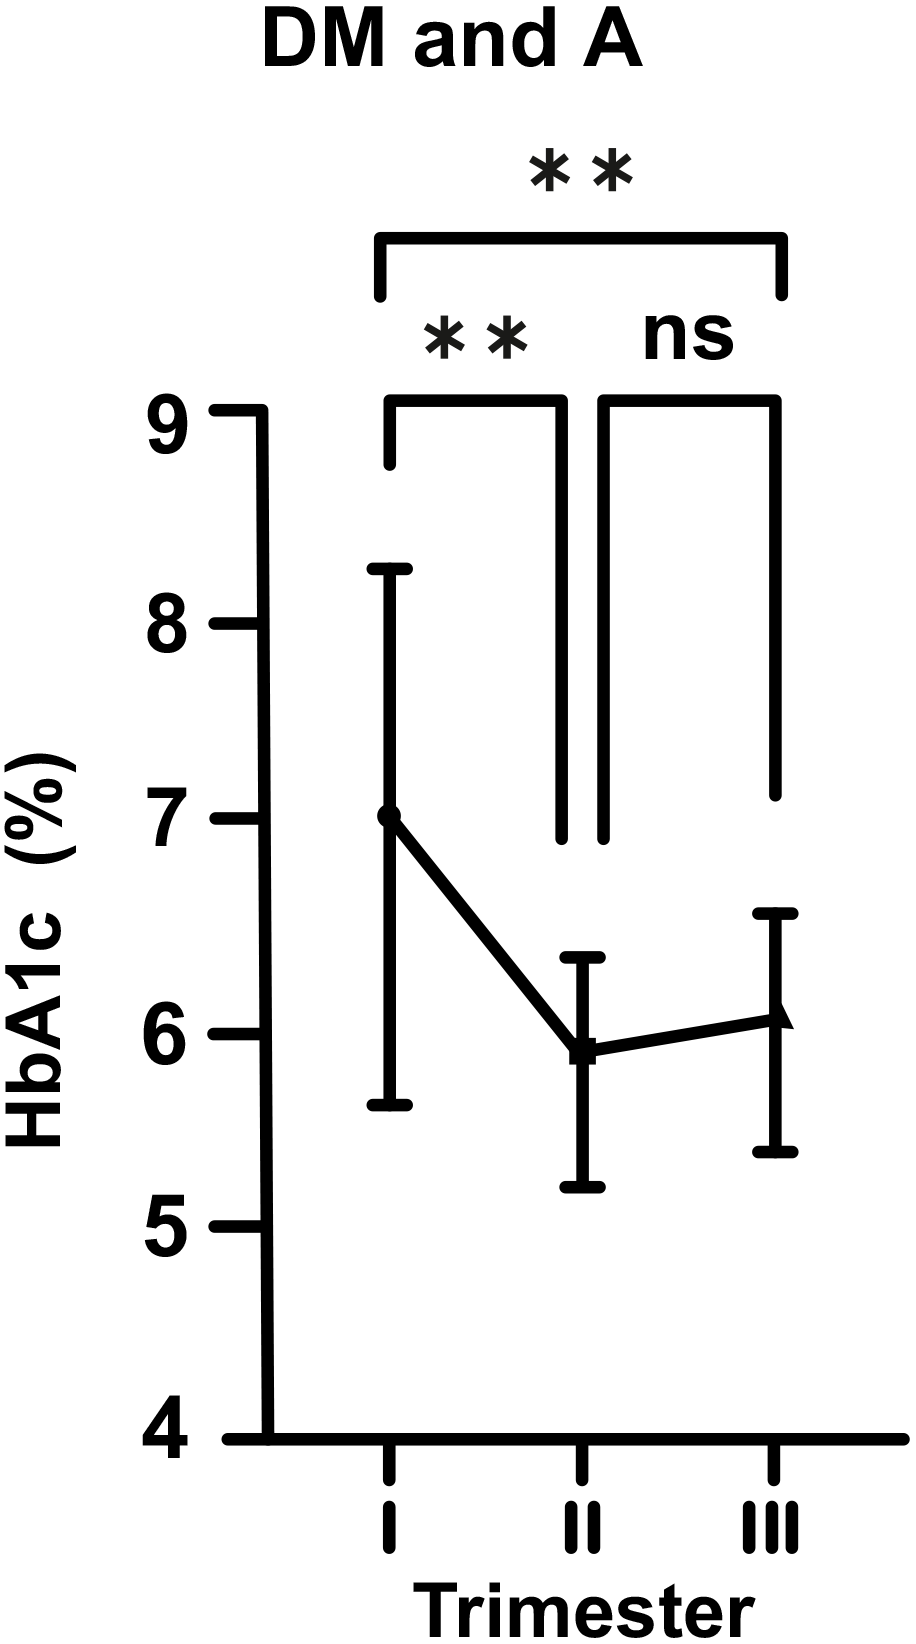 Fig. 4.
Changes in HbA1c levels in diabetic (DM) and anemic (A) women
throughout gestation. Trimesters: I, first (0–13 weeks); II, second (14–28
weeks); and III, third (29–42 weeks). **p
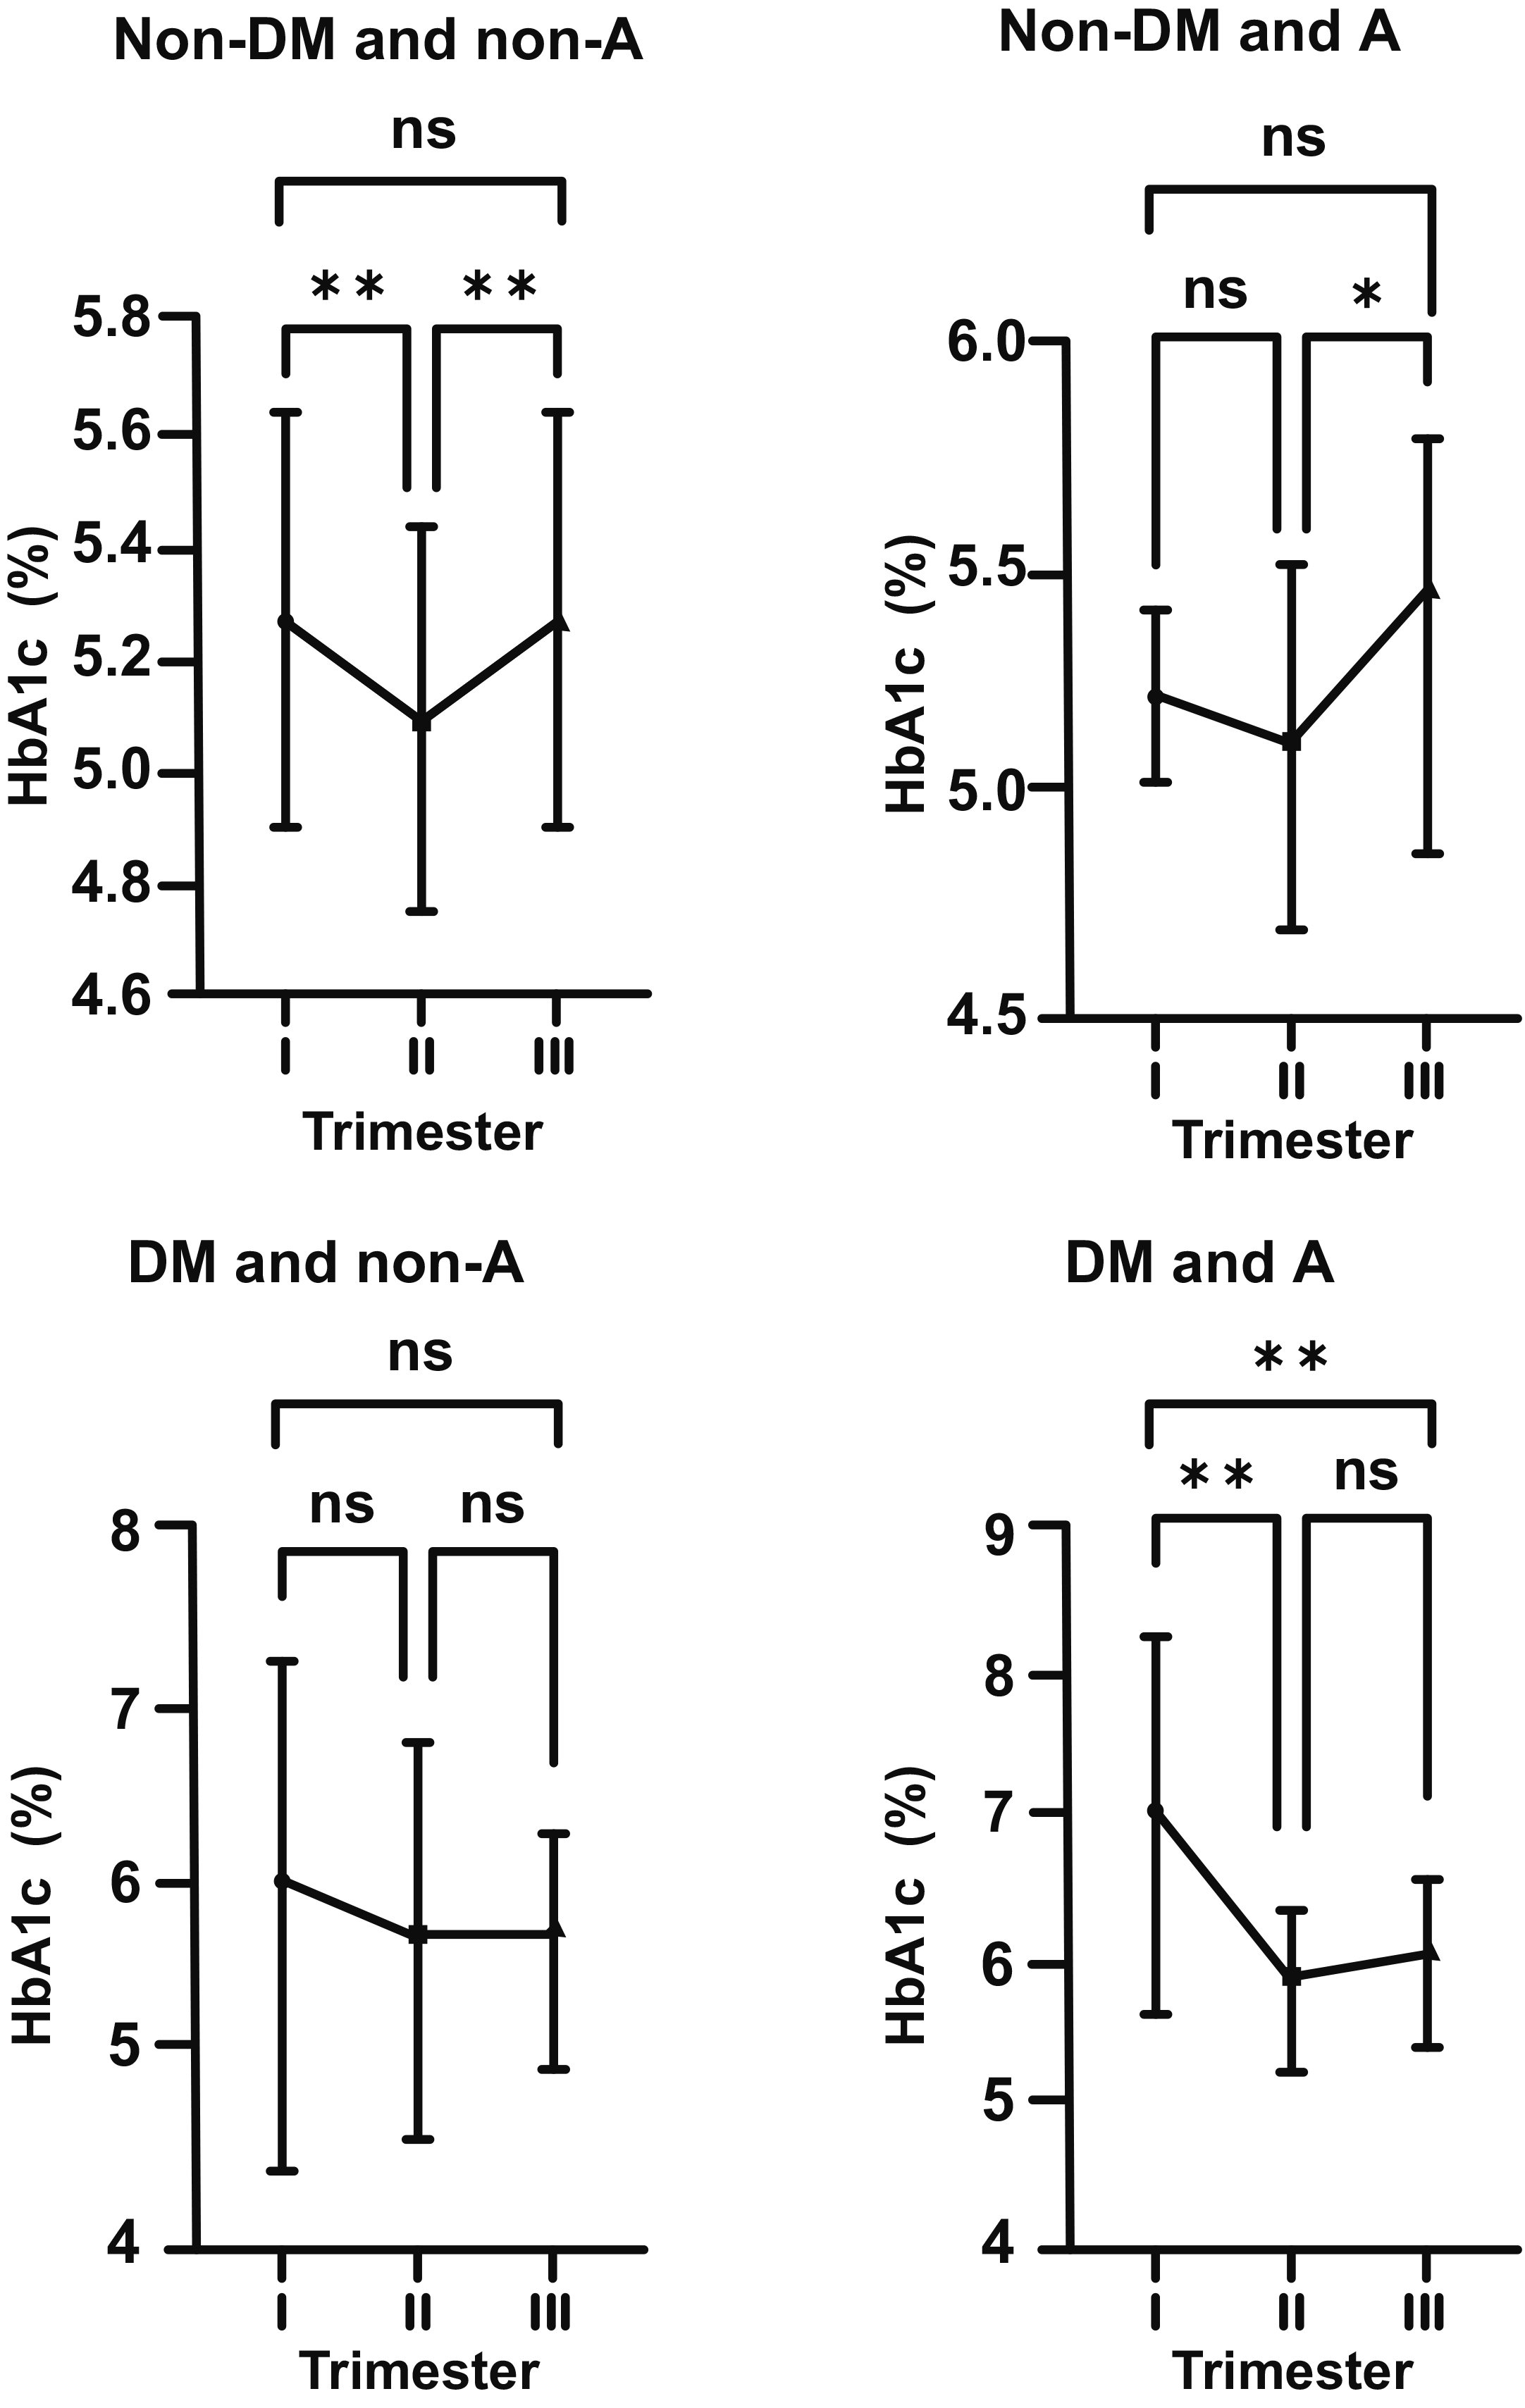
Graphics showing fluctuations in HbA1c levesl during pregnancy in all subgroups (DM, non-DM, A, non-A) are shown together to make comparisons easier (Fig. 5). Correlations between iron related parameters and HbA1c in both non-DM and DM women can also be seen in Figs. 6,7.
 Fig. 5.
Biphasic changes in HbA1c levels during pregnancy in all
subgroups (DM, non-DM, A, non-A) and steep increase in HbA1c in the second half
of gestation, being remarkable in the anemic (A) subgroups. Non-DM groups (top
row), DM groups (bottom row), non-A groups (left side), A groups (right side).
. Trimesters: I, first (0–13 weeks); II, second (14–28 weeks); and
III, third (29–42 weeks). *p
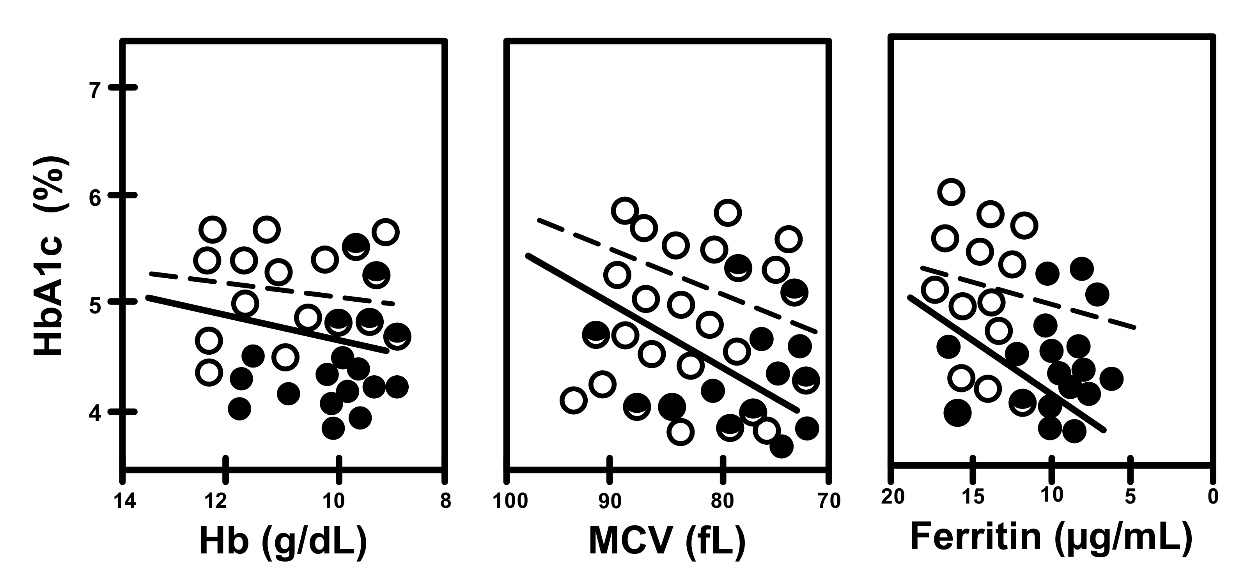 Fig. 6.
 Correlation between HbA1c and iron related parameters in non-A
(open circles, dotted line) and A (closed circles, straight line), in women
without gestational DM (non-DM subgroups). Non-A vs. A, R = 0.186
vs. R = 0.576, and p
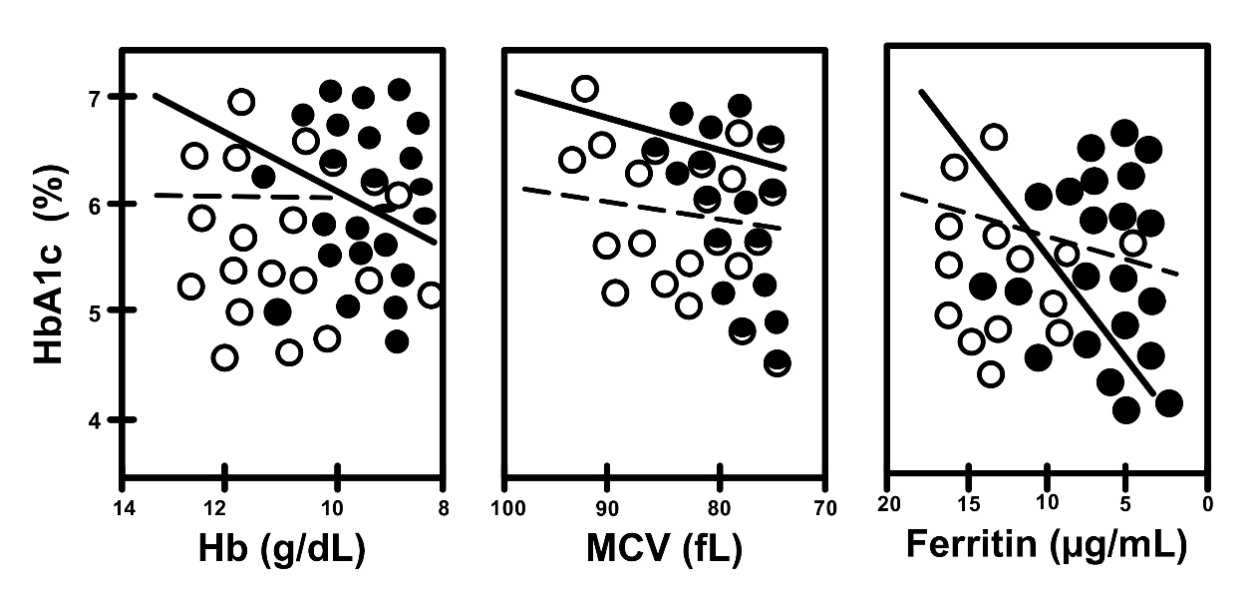 Fig. 7.
Correlation between HbA1c and iron related parameters in non-A
(open circles, dotted line) and A (closed circles, straight line) in women with
gestational DM (DM subgroups). Non-A vs. A, R = 0.210 vs. R =
0.599, and p
Currently, HbA1c is widely used for the target value of glycemic control or the diagnosis of DM, but it has some limitations, and there are a number of factors that can falsely raise or lower its level independent of glycemia [6, 7, 13]. First, Phelps et al. [8] analyzed HbA1c concentrations in 377 non-DM pregnant women and found significant biphasic changes, with initial decline to a nadir level at the 24th week of gestation. This was followed by a subsequent rise to peak near term. Then, in a report of the Japanese Society of Diabetes and Pregnancy, similar tendencies were shown [14]. The authors reported that HbA1c tends to decrease during the first and second trimesters, followed by an increase during the last trimester of gestation, in an analysis of 136 normal pregnant women. Hashimoto et al. [11] also demonstrated HbA1c levels were elevated significantly in relation to glycemia in late pregnancy. They hypothesized that increased iron deficiency in the second half of gestation was involved in this significant rise. Similarly, Coban et al. [15] reported falsely high levels of HbA1c in patients with iron deficiency A. However, subsequent studies have documented slight increases of HbA1c in patients with iron deficiency A [16, 17].
In our study, regardless of the existance of glucose intolerence or DM, we
observed that the level of HbA1c decreased in the first half of pregnancy, as
shown in previous studies. However, in non-DM and non-A cases, this decrease was
more remarkable (p
On the other hand, in the DM cases without iron deficiency A (DM and non-A), this biphasic change was still present, but was statistically not significant. However, in DM and A cases (DM and A), we observed that A exacerbated the effects of DM at the beginning of pregnancy with HbA1c level of 7.09%, and then, it caused a sharp decline towards mid-pregnancy. Increase in the levesl of HbA1c in late pregnancy was statistically insignificant. However, it was still quite obvious in comparison to the DM and non-A group.
The mechanism of this biphasic change in HbA1c is not yet fully understood. In the first half of pregnancy, the significant fall in HbA1c can be explained by physiological changes occuring to nurture the developing fetus [18, 19]. Expansion in plasma volume is greater than the increase in red cell mass, and this hemodilution results in a fall in hemoglobin concentration without any change in MCV [20]. Moreover, increased erythropoiesis and decreased erythrocyte turnover rate in early pregnancy may also play a role to this mechanism [21]. HbA1c is known to increase in the second half of pregnancy since demand for iron increases with fetal development, and when iron intake cannot meet this requirement, iron deficiency A is inevitable [22]. In iron deficiency, red cell production decreases and consequently, an increased life span of circulating erythrocytes ultimately leads to elevated HbA1c levels [23]. Therefore, under these conditions, estimation of glycemic control based solely on HbA1c levels may lead to a risk of misjudging. However, several researchers have reported the effects of iron therapy on glycated hemoglobin and found a significant reduction in HbA1c levels after iron therapy in both non-DM and DM populations [16, 24]. On the other hand, there are other studies reporting that iron supplementation during pregnancy does not affect HbA1c levels and has no significant clinical impact in the final interpretation of blood indices [25].
There are several more studies which report a relationship between iron deficiency A and HbA1c on basis of structural modifications of hemoglobin in erythrocytes [16, 26]. Brooks et al. [27] has shown that a relative absence of iron results in the alteration of quaternary structure of hemoglobin leading to excessive glycation of the N-terminal of the beta chain. In another study, it was reported that glycation of hemoglobin molecule is an irreversible process, and aging of the cell causes a linear increase in HbA1c [28]. Our results are concordant with these literature findings investigating the significance of iron deficiency in both DM and non-DM pregnant women. Lastly, several recent studies have recommended glycated albumin (GA) as a more reliable biomarker in monitoring gestational DM and its probable consequences [29, 30].
The main limitation of the present study is its retrospective design and its observational nature, leaving the possibility of residual confounding. Follow-up examinations after delivery are also missing. However, being one of the largest studies to investigate HbA1c throughout pregnancy in 670 women with or without A and DM is its main strength.
In conclusion, HbA1c level exhibits biphasic changes throughout pregnancy, with decreases towards mid-pregnancy, followed by increases in the third trimester. Iron deficiency A makes reliable interpretation of HbA1c difficult in both DM and non-DM pregnant women.
All raw data (on Excel format with all patients’ names shaded) and statistical work about this study are available upon request as supplementary files (please contact the corresponding author).
AF: conception, data curation, formal analysis, investigation, methodology, writing original draft, re-writing after review and final editing. DCK: data curation, methodology, completion of writing original draft, interpretation of data and review. NU: conception, formal analysis, review and last editing after major revision. All authors have participated sufficiently in the work and agreed to be accountable for all aspects of the work. All authors read and approved the final version of manuscript.
Approval for the present study was obtained from the institutional review board of Health Sciences University Istanbul Education and Research Hospital (date: 25.03.2022, number: 102). All patients provided informed consent.
We would like to express our gratitude to the reviewers for their suggestions and contributions. We also thank to Dr. Omar Al-Omari for English editing.
This research received no external funding.
The authors declare no conflict of interest.
References
Publisher’s Note: IMR Press stays neutral with regard to jurisdictional claims in published maps and institutional affiliations.