
- Academic Editor
Background: Postpartum haemorrhage (PPH) is a serious complication and a cause of maternal mortality after delivery. This study used machine learning algorithms and new feature selection methods to build an efficient PPH risk prediction model and provided new ideas and reference methods for PPH risk management. Methods: The clinical data of women who gave birth at Wenzhou People’s Hospital from 1 January 2021, to 30 March 2022, were retrospectively analysed, and the women were divided into a high haemorrhage group (337 patients) and a low haemorrhage group (431 patients) based on the amount of blood loss. Machine learning algorithms were used to identify the features associated with postpartum haemorrhage from multiple clinical variables using feature selection methods, such as recursive feature elimination (RFE), recursive feature elimination with cross-validation (RFECV), and SelectKBest, and to establish prediction models. Results: For all women, the features associated with postpartum haemorrhage were ‘age’, ‘newborn weight’, ‘gestational week’, ‘perineal laceration’, and ‘caesarean section’. The prediction model established by the random forest classifier performed best, with an F1 score of 0.73 and an area under the curve (AUC) of 0.84. For women who underwent caesarean section or had a vaginal delivery, the features associated with postpartum haemorrhage risk were different. The risk factors for postpartum haemorrhage in women who underwent caesarean section were ‘age’, ‘parity’, ‘preterm birth’, and ‘placenta previa’. The prediction model established by the random forest classifier performed best, with an F1 value of 0.96 and an AUC of 0.95. The risk factors for postpartum haemorrhage in women with vaginal delivery were ‘age’, ‘parity’, ‘gestational week’, ‘diabetes’, ‘assisted reproduction’, ‘hypertension (preeclampsia)’, and ‘multiple pregnancy’. The prediction model established by the AdaBoost classifier performed best, with an F1 value of 0.65 and an AUC of 0.76. Conclusions: Machine learning algorithms can effectively identify the features associated with postpartum haemorrhage risk from clinical variables and establish accurate prediction models, offering a novel approach for clinicians to assess the risk of and prevent postpartum haemorrhage.
Every year, approximately 300,000 maternal deaths occur worldwide postpartum
haemorrhage (PPH) is currently the leading cause of maternal mortality worldwide,
accounting for approximately one-third of deaths [1]. PPH refers to
Although the risk factors for PPH have been studied by researchers from various countries for many years, thus far, no reliable PPH prediction scoring system has been developed [6, 7]. Multiple risk factors often coexist in clinical practice, but quantifying the relevant risk factors and predicting and screening high-risk groups are challenging without the aid of clinical prediction models. Therefore, it is difficult to achieve early preparation, strengthen monitoring and improve prevention [8]. The currently recognized causes of PPH are as follows: (1) uterine atony; (2) placental factors; (3) soft birth canal laceration; and (4) coagulation dysfunction. However, many women without these risk factors have PPH [9]. Therefore, PPH risk assessment should be performed for pregnant women before delivery and at admission and modified continuously with the development of other risk factors during or after delivery [10]. One PPH risk scoring system has been shown to identify 60–85% of patients who will have major obstetric haemorrhage [8, 11], and retrospective cohort studies have validated this tool. The results show that although the tool correctly identified more than 80% of severe PPH patients, more than 40% of nonbleeding women were included in the high-risk group. The specificity of the tool was only slightly lower than 60% [12]. Therefore, there is a lack of efficient clinical prediction models for PPH.
Machine learning is a data-based intelligent computing method that can learn rules and patterns from large amounts of data, thereby achieving tasks such as classification, regression, and clustering [13, 14]. Machine learning has been widely used in the medical field, especially in risk prediction. Machine learning can use multiple clinical variables to construct efficient prediction models to assist clinical decision-making [15, 16]. In recent years, some studies have attempted to use machine learning algorithms to predict the risk of PPH [17, 18], but these studies have shortcomings, such as small sample sizes and simple feature selection methods. The predictive performance needs to be improved. This study discusses three new feature selection methods: recursive feature elimination (RFE), recursive feature elimination with cross-validation (RFECV), and SelectKBest. The study purpose was to explore how to eliminate redundant features while retaining the most important features, thereby improving the accuracy and stability of the prediction model. In addition, we used machine learning algorithms to integrate classification models and identify more suitable risk prediction models among many classification model algorithms for our center’s data characteristics. Therefore, in this study, the most representative feature variables were selected by screening feature selection algorithms and high-risk factors in artificial scoring tables. In different clinical delivery modes, the risk of PPH should be quickly and efficiently evaluated in advance to identify high-risk groups for preoperative preparations, such as blood matching, and provide new ideas and reference methods for PPH risk management.
This study retrospectively analysed the clinical data of 10,803 women who gave
birth at Wenzhou People’s Hospital from 1 January 2021, to 30 March 2022,
including age, parity, gestational week, newborn weight, diabetes, assisted
reproduction, hypertension (preeclampsia), multiple pregnancy, preterm birth,
placenta previa, perineal laceration, and caesarean section. They were divided
into a high haemorrhage group (337 cases) and a low haemorrhage group (431 cases)
according to the amount of blood loss. The high haemorrhage group was defined as
women with blood loss of
Based on the previously implemented “Postpartum Haemorrhage Risk Assessment Table”, the diagnosis and basic information of maternal complications were extracted from the electronic medical record system. In the Python language environment, the matplotlib library was used for plotting, the seaborn library was used for data visualization, the norm module in the SciPy library was used for normal distribution analysis, the stats module in the SciPy library was used for statistical analysis, and the math library was used for mathematical operations. The data were balanced using the SMOTE module in the imblearn library; the data.corr() function was used to calculate the correlation coefficients between each variable in the data, and the sns.heatmap() function was used to draw a heatmap of the correlation coefficient matrix. The data were standardized using the StandardScaler module in the sklearn library and split into a training set and a test set using the train_test_split module. A random forest classifier was built using the RandomForestClassifier module. Classification performance was evaluated using the f1_score, confusion_matrix, precision_recall_curve, roc_curve, accuracy_score, auc, and classification_report modules. The data were preprocessed using the preprocessing module. Feature selection methods such as SelectKBest, chi2, RFE, and RFECV were used. All available classifiers were obtained using the all_estimators function. A grid search for optimal parameters was performed using the GridSearchCV module.
All estimators of the type classifier from the sklearn library were imported and stored in the estimator list. The estimator list was traversed, trying to instantiate each estimator and adding it to two lists: the estimator_list and model_list. According to the feature selection methods described in the previous section, feature variables were selected as independent variables. The train_test_split function was used to split the dataset into a training set and a test set, with the test set accounting for 20% and the random seed being 0. The sklearn.metrics module was imported to calculate various evaluation indicators, such as the F1 score, confusion matrix, accuracy, recall rate, receiver operating characteristic curve (ROC curve), and area under the curve (AUC). The model was fitted on the training set, and predictions were made based on the test set. The F1 score, accuracy, precision, recall rate, AUC and other indicators of the model were calculated and printed out. If the model had a predict_proba method, this method was used to obtain the predicted probabilities based on the test set and plot ROC curves based on probabilities and true labels; otherwise, ROC curves were plotted using predicted labels.
The risk assessment factors of the “Postpartum Risk Assessment Table” were formulated by the clinical team based on the previous research project [19] and included the following 24 assessment factors: basic information (age, body mass index (BMI), assisted reproduction, history of postpartum haemorrhage, history of abortion and curettage); obstetric complications (hypertension, coagulation dysfunction, anaemia, rare blood type, polyhydramnios, multiple pregnancy, uterine fibroids, placenta previa, medication history); intrapartum scores (fundal height, perineal laceration, estimated foetal weight, platelet count, long-term use of oxytocin, late postpartum haemorrhage, partograph, mode of delivery, third stage duration, placental retention). Basic information included the following 6 assessment factors as predictors: age, gravidity, parity, gestational week, intrapartum blood loss (mL), newborn weight (g); obstetric complications included the following 12 assessment factors: multiple pregnancy, assisted reproduction, uterine fibroids, hypertension, uterine scar, preterm birth, placenta previa, cysts, chorioamnionitis, perineal laceration, diabetes, and caesarean section, as shown in Table 1. We simplified the content of the intrapartum score and increased the prediction time point to before delivery. The purpose was to predict the risk of PPH before delivery and manage high-risk groups more efficiently.
| Characteristics | High blood loss | Low blood loss | t value or |
p value | |
| (n = 337) | (n = 431) | ||||
| Basic information | |||||
| Age | 30.82 |
28.38 |
6.88 | ||
| Gravidity | 2.63 |
1.94 |
6.67 | ||
| Parity | 1.65 |
1.44 |
4.22 | ||
| Gestational week | 37.65 |
38.75 |
–5.32 | ||
| Intrapartum blood loss (mL) | 693.18 |
120.61 |
25.99 | ||
| Newborn weight (g) | 3396.13 |
3252.38 |
2.75 | 0.01 | |
| Obstetric complications | |||||
| Multiple pregnancy | 26 (7.7%) | 1 (0.2%) | 31.22 | ||
| Assisted reproduction | 31 (9.2%) | 6 (1.4%) | 25.14 | ||
| Uterine myoma | 33 (9.8%) | 22 (5.1%) | 6.25 | 0.01 | |
| Hypertension | 37 (11.0%) | 20 (4.6%) | 11.06 | ||
| Uterine scar | 39 (49.4%) | 38 (50.6%) | 1.59 | 0.21 | |
| Premature birth | 54 (16.0%) | 15 (3.5%) | 36.39 | ||
| Placenta previa | 60 (17.8%) | 0 | 83.24 | ||
| Cyst | 70 (68.0%) | 33 (32.0%) | 28.01 | ||
| Chorioamnionitis | 73 (21.7%) | 82 (19.0%) | 0.82 | 0.37 | |
| Perineal laceration | 79 (23.4%) | 245 (56.8%) | 86.52 | ||
| Diabetes | 81 (24.0%) | 75 (17.4%) | 5.14 | 0.02 | |
| Caesarean section | 206 (61.1%) | 25 (5.8%) | 275.27 | ||
*t test was used for measurement data and Chi-square test was used for comparison of rates.
We used the data.corr() function to calculate the correlation coefficients between each variable in the data and used the sns.heatmap() function to draw a heatmap of the correlation coefficient matrix, as shown in Fig. 1. PPH was strongly positively correlated with intrapartum blood loss, caesarean section, placenta previa and other variables, with correlation coefficients of 0.728, 0.599, and 0.329, respectively. PPH was strongly negatively correlated with perineal laceration, with a correlation coefficient of –0.336. PPH was moderately positively correlated with age, parity, delivery time and other variables, with correlation coefficients ranging from 0.2–0.3. PPH was weakly positively correlated with newborn weight, assisted reproduction, multiple pregnancy and other variables, with correlation coefficients ranging from 0.1–0.2. PPH had no significant correlation with gestational week, chorioamnionitis, uterine scar and other variables, with correlation coefficients close to 0.
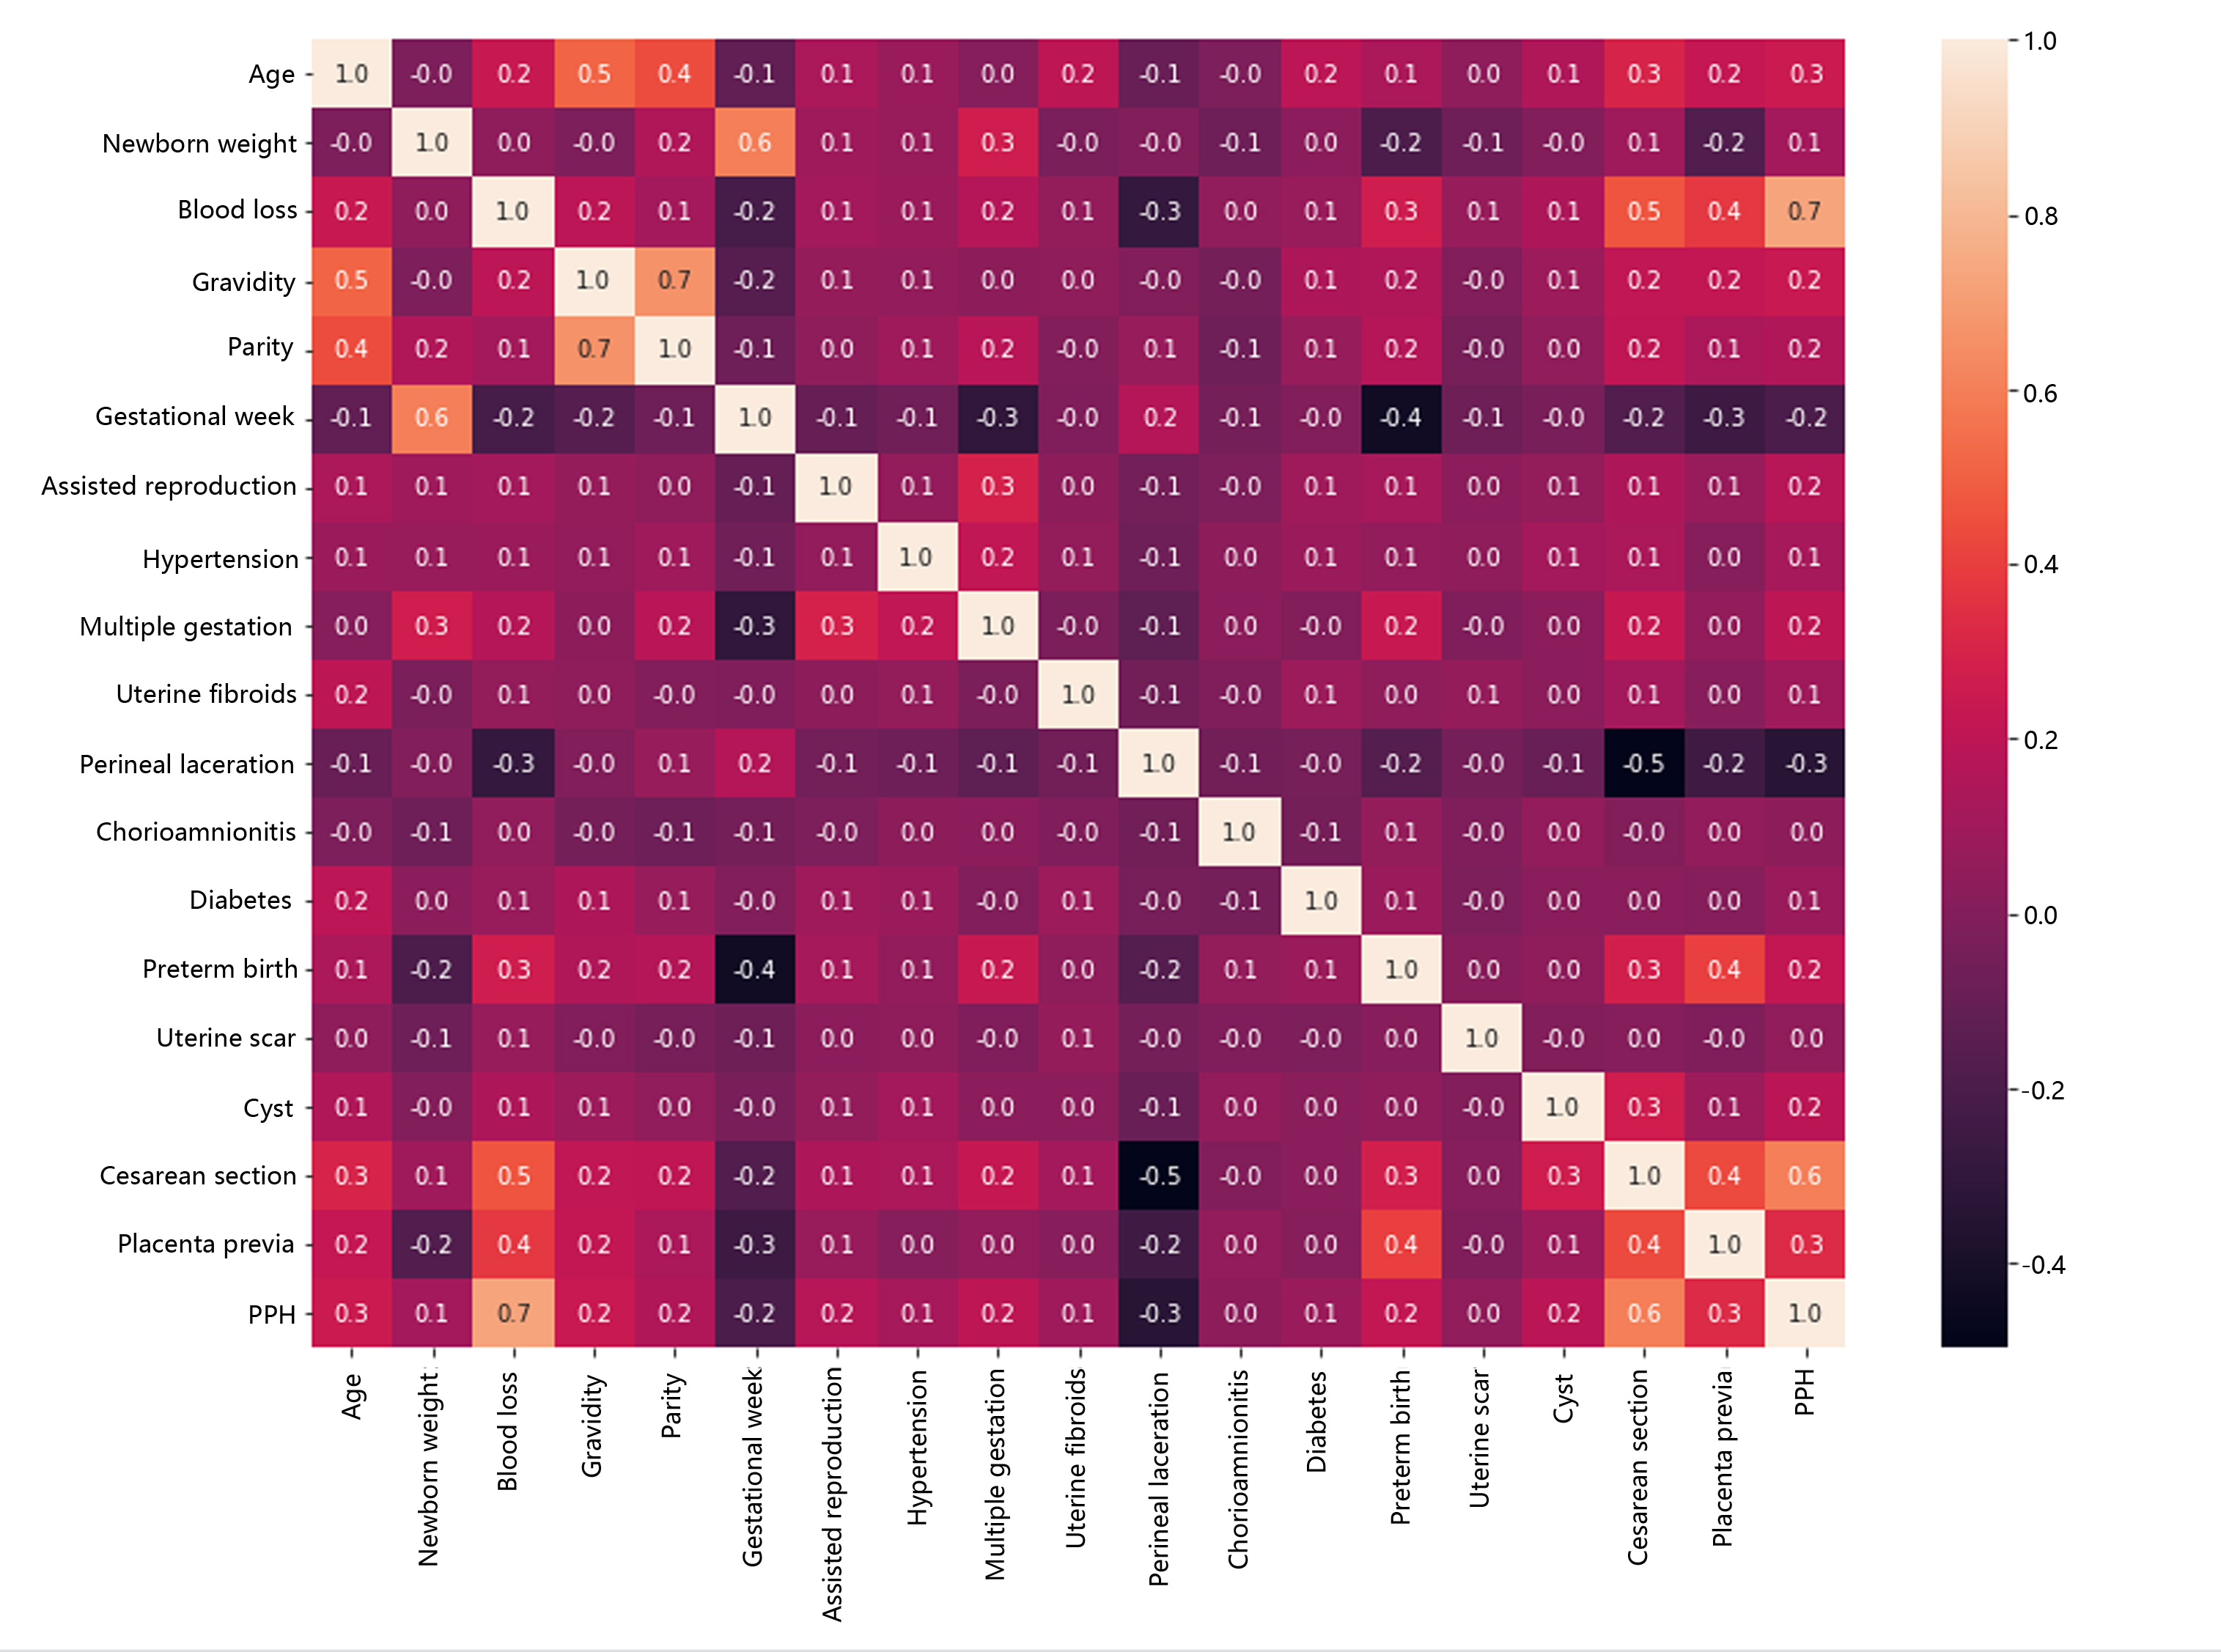 Fig. 1.
Heatmap of the correlation coefficient matrix of postpartum haemorrhage (PPH) risk factors.
We used the SelectKBest, RFE and RFECV feature selection methods to analyse the above data, obtained three different sets of predictive feature combinations, and verified the predictive performance of feature patterns in the random forest classifier model. The results are shown in Table 2. The SelectKBest method selected 5 features, namely, newborn weight, perineal laceration, preterm birth, caesarean section and placenta previa. The feature pattern had an F1 score of 0.697, an accuracy of 0.736, a precision of 0.745, a recall rate of 0.654, and an AUC of 0.790 in the model. The RFE method selected 5 features, namely, age, newborn weight, gestational week, perineal laceration and caesarean section. The feature pattern had an F1 score of 0.730, an accuracy of 0.753, a precision of 0.740, a recall rate of 0.720, and an AUC of 0.837 in the model.
| Optional method | Features | Counts | F1 Score | Accuracy | Precision | Recall | AUC |
| SelectKBest | ‘Neonatal weight’, ‘perineal laceration’, ‘premature delivery’, ‘caesarean section’, and ‘placenta previa’ | 5 | 0.696517 | 0.7359 | 0.744681 | 0.654206 | 0.789983 |
| RFE | ‘Age’, ‘newborn weight’, ‘gestational age’, ‘perineal laceration’, and ‘caesarean section’ | 5 | 0.729858 | 0.7532 | 0.740385 | 0.719626 | 0.836788 |
| RFECV | ‘Age’, ‘birth weight’, ‘at times’, ‘production time’, ‘gestational age’, ‘assisted reproduction’, ‘blood pressure (eclampsia)’, ‘multiple pregnancies’, ‘uterine fibroids’, ‘perineal laceration ‘, ‘chorioamnionitis’, ‘diabetes’, ‘premature’, ‘uterine scar’, ‘cyst’, ‘caesarean delivery’, and ‘placenta previa’ | 17 | 0.776119 | 0.8052 | 0.829787 | 0.728972 | 0.87255 |
RFE, recursive feature elimination; RFECV, recursive feature elimination with cross-validation; AUC, area under the curve.
The RFECV method selected 17 features, namely, age, newborn weight, parity, delivery time, gestational week, assisted reproduction, hypertension (preeclampsia), multiple pregnancy, uterine fibroids, perineal laceration, chorioamnionitis, diabetes, preterm birth, uterine scar, cysts, caesarean section and placenta previa. The feature pattern had an F1 score of 0.776, an accuracy of 0.805, a precision of 0.830, a recall rate of 0.729 and an AUC of 0.873 in the model. The results suggested that among the three feature selection methods, the RFE method had the highest prediction efficiency. In the case where the SelectKBes method also selected 5 features, the prediction efficiency increased from 0.790 to 0.837. Although the prediction efficiency of the RFE method was not as high as that of the RFECV method, the RFE method only needed at least 5 features to achieve a prediction efficiency similar to that of the RFECV method, which needed to evaluate 17 features. Notably, in the previous correlation analysis, the “newborn weight” factor was not strongly correlated with PPH, but in the process of developing the three different models, this feature was selected for all models; however, because the exact “newborn weight” could not be obtained before delivery, we ultimately excluded this factor in the later prediction model and included four factors (‘age’, ‘gestational week’, ‘perineal laceration’, and ‘caesarean section’) related to high postpartum blood loss into the model selection module for operation. The following models all achieved good prediction efficiency, as shown in Fig. 2: AdaBoostClassifier: AUC of 0.859; GaussianNB: AUC of 0.873; GradientBoostingClassifier: AUC of 0.861; HistGradientBoostingClassifier: AUC of 0.857; MLPClassifier: AUC of 0.865; LogisticRegression: AUC of 0.851; and LogisticRegressionCV: AUC of 0.851.
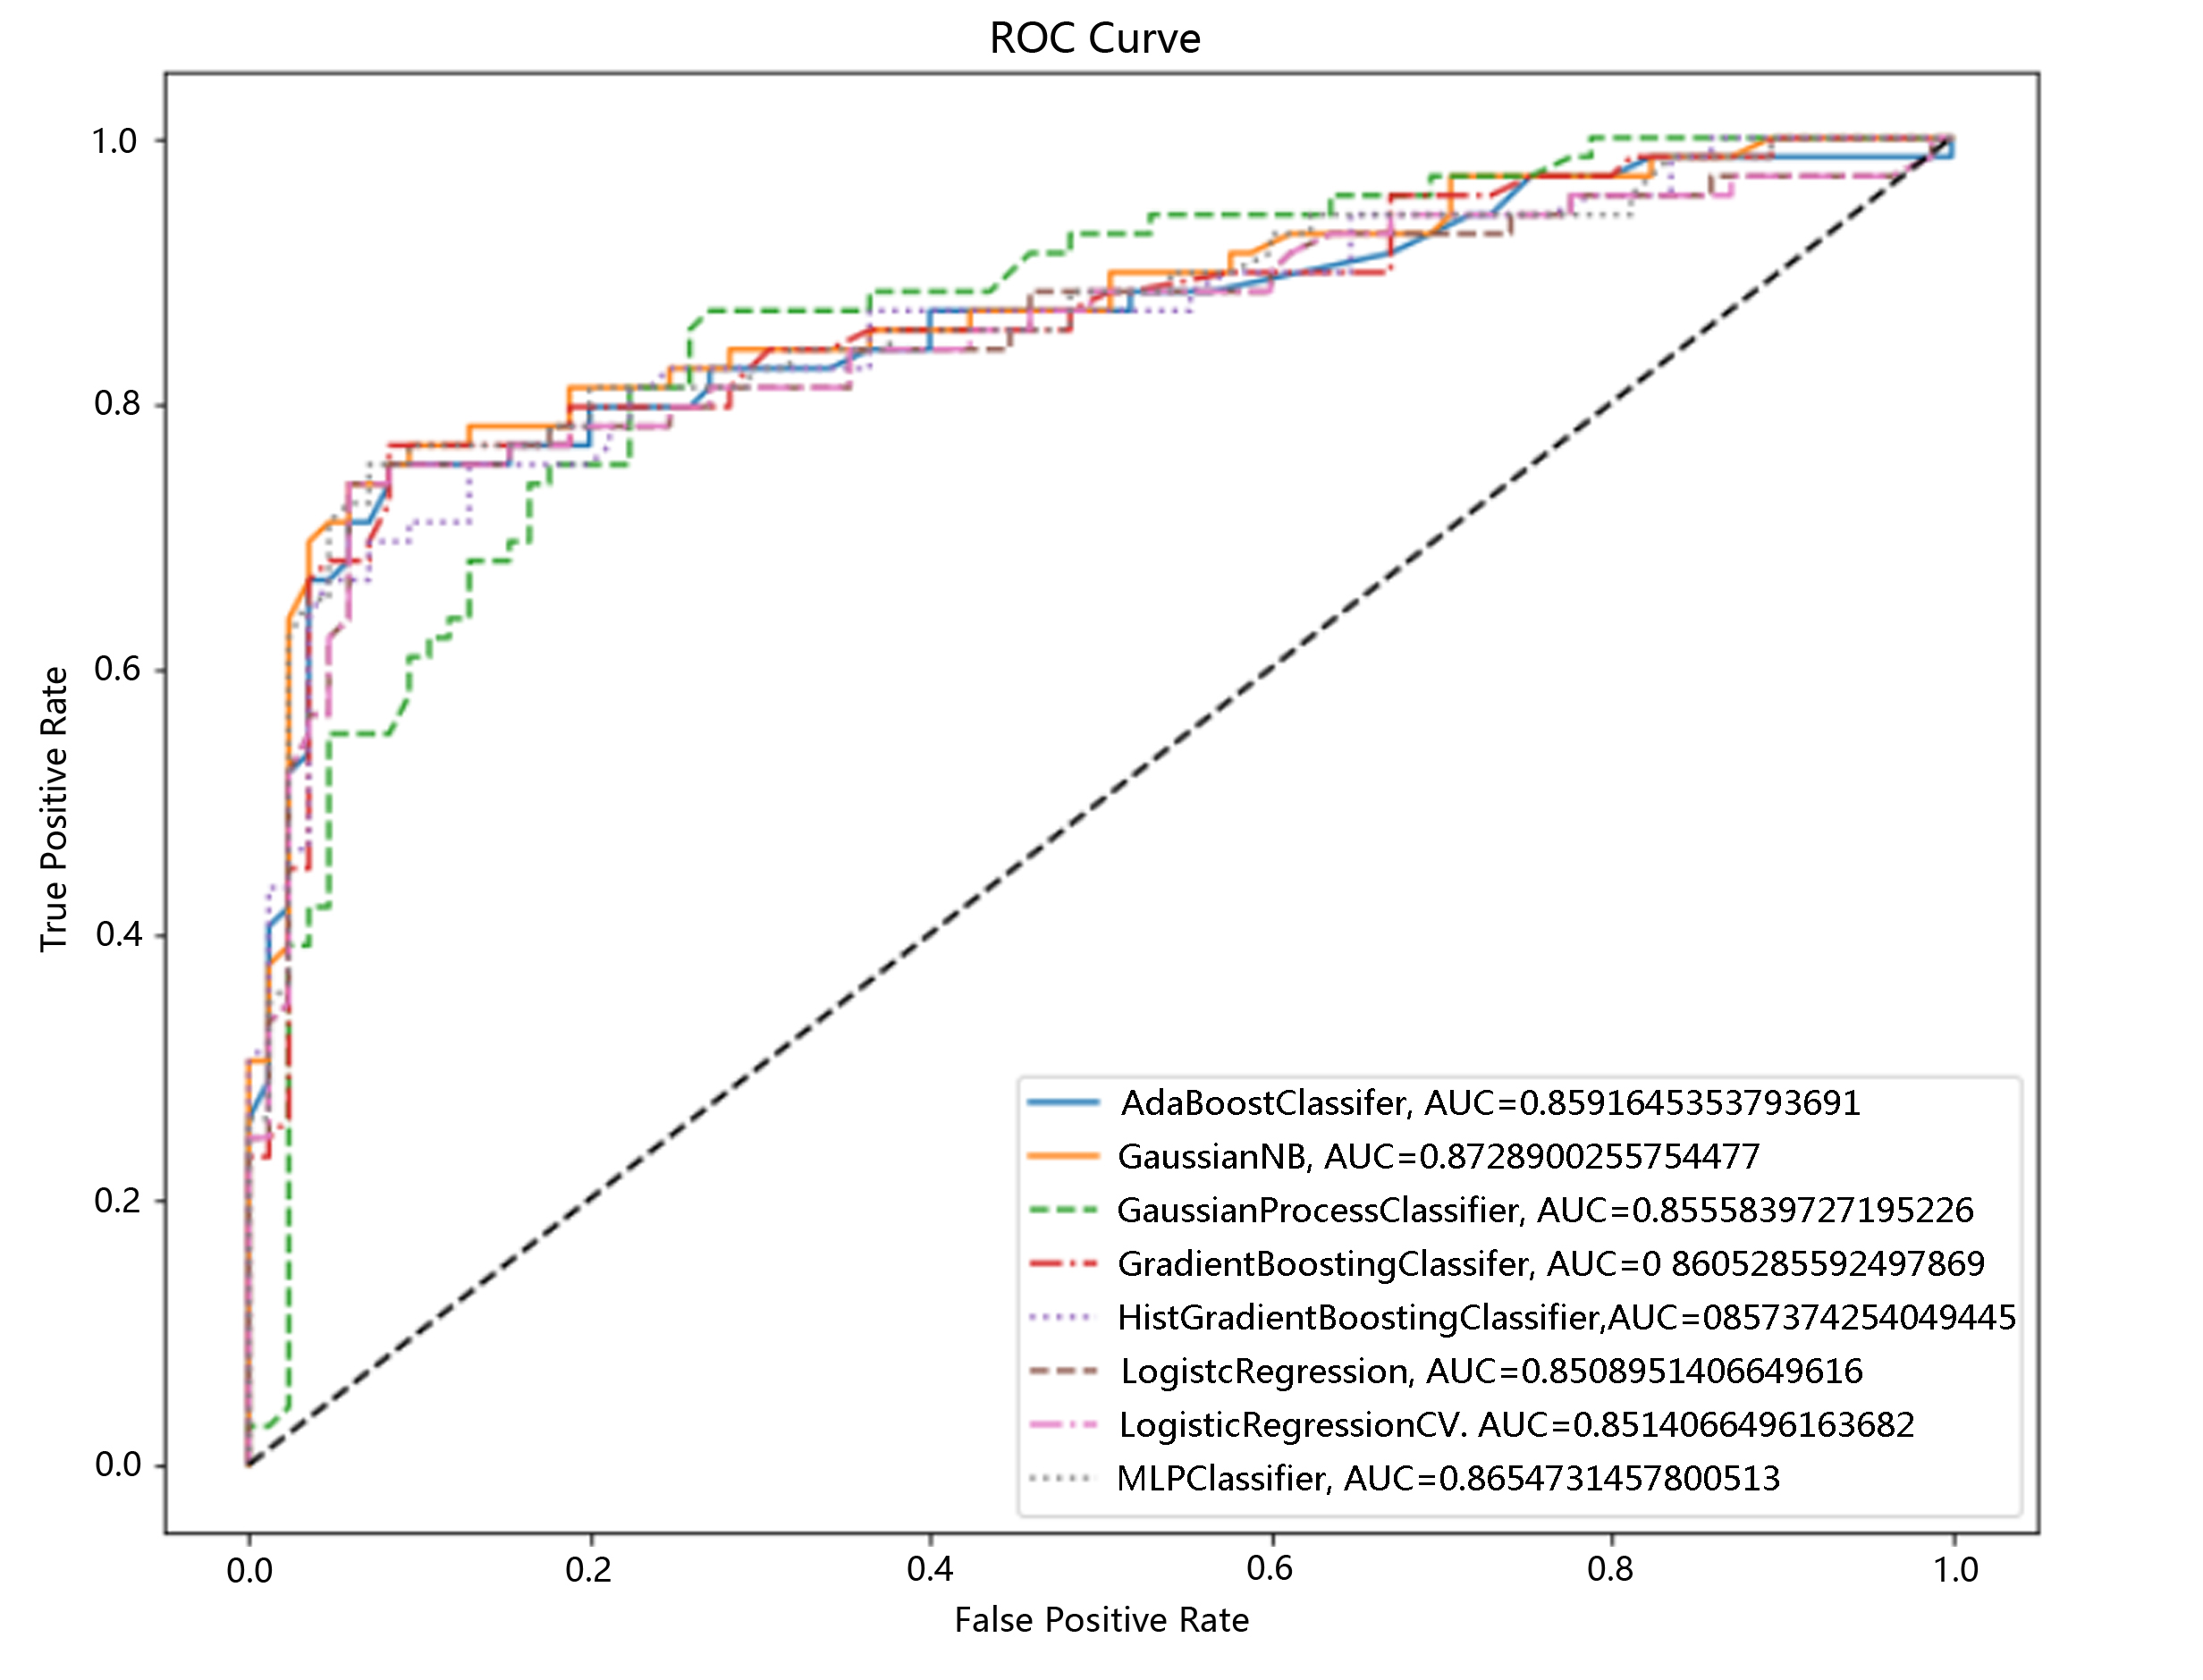 Fig. 2.
Selection of a postpartum haemorrhage risk classification model based on machine learning algorithms. ROC Cure, receiver operating characteristic curve.
Considering the clinical application, the diagnostic criteria for PPH in women
with caesarean section and vaginal delivery are different:
Finally, in pregnant women with caesarean section, we found four risk factors related to PPH (‘age’, ‘parity’, ‘preterm birth’, and ‘placenta previa’), which were verified in the random forest classifier model with an AUC of up to 0.923, as shown in Fig. 3. The F1 score, accuracy, precision, recall rate, AUC, 0.9600000000000001, 0.9375, 1.0, 0.9230769230769231, 0.948717948.
 Fig. 3.
Postpartum haemorrhage risk prediction results of the random forest classifier model among pregnant women with caesarean section.
In natural delivery pregnant women, we identified ‘age’, ‘parity’, ‘gestational week’, ‘diabetes’, ‘assisted reproduction’, ‘hypertension (preeclampsia)’, and ‘multiple pregnancy’ seven risk factors related to postpartum haemorrhage and verified them in the AdaBoostClassifier model with an AUC of up to 0.923, as shown in Fig. 4. The F1 score, accuracy, precision, recall rate, and AUC were as follows: 0.6486486486486486, 0.6666666666666666, 0.6666666666666666, 0.631578947368421, and 0.759868421.
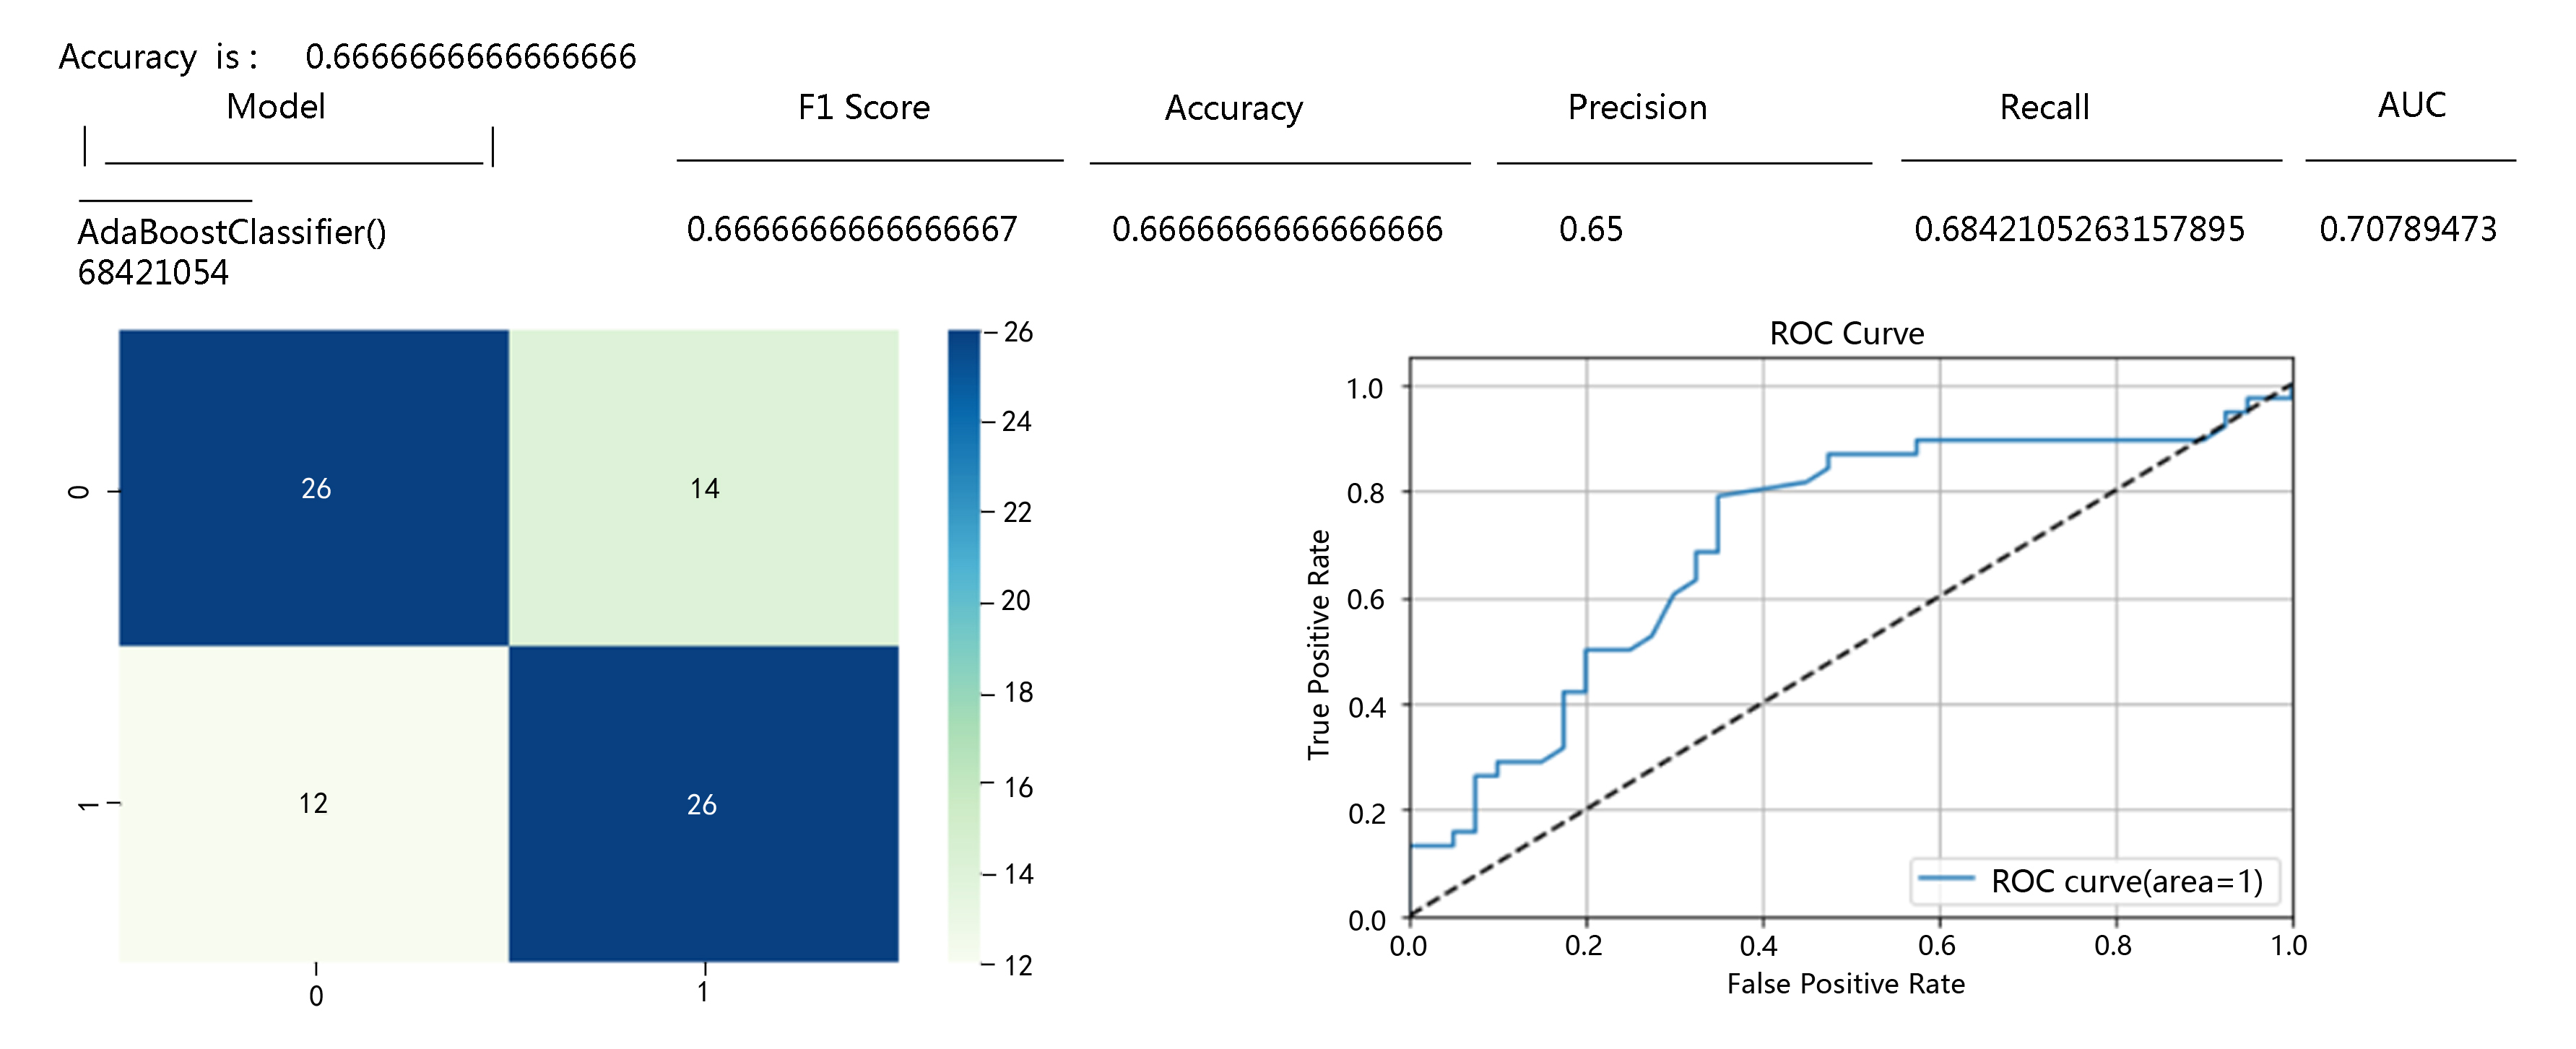 Fig. 4.
Postpartum haemorrhage risk prediction results of the AdaBoostClassifier model among pregnant women with vaginal delivery.
The purpose of this study was to predict the risk of PPH among women before delivery, identify the most critical features of obstetric complications in PPH cases, and provide a quick and easy assessment method for clinical practice. In the previous study, we learned that early warning plays a vital role in the management of PPH [19]. The clinical treatment measures for uterine atony PPH include uterine massage, oxytocin infusion, Xinmupai intrauterine injection, etc. It is extremely important to establish a sound predelivery early warning system to control the development of patients’ conditions, promote clinical efficacy, reduce the incidence of PPH, ensure the safety of delivery, improve patient quality of life, and improve the obstetric medical level of the region through effective prevention and predelivery management [11, 20]. At present, there are generally situations such as a heavy workload, rapid changes in pregnant women and their conditions, and a fast work pace in obstetric clinical work, so it is easy to overlook some potential high-risk factors for in low-risk pregnant women [21]. Therefore, the purpose of this project was to optimize the existing PPH assessment system and use machine learning to improve the work efficiency of clinical doctors and reduce the incidence of PPH and maternal mortality.
The PPH risk assessment table includes more comprehensive factors, but the evaluation process is long, and the table is relatively complex. Compared with the 1300 sets of manually evaluated table data returned by doctors in the previous period and the 10,803 women who gave birth at our hospital that year, the risk assessment implementation efficiency is not high. The implementation rate of the PPH risk assessment table was approximately 10% from January 2021 to March 2022. After data analysis and cleaning, the actual evaluation efficiency was not satisfactory. Even if the results of manual evaluation by doctors are reorganized by means of information technology, the PPH prediction model after informationization had an AUC of 0.669, and the 95% confidence interval was 0.578–0.759, which were slightly higher than those of manual scoring (AUC of 0.557, asymptotic 95% confidence interval of 0.460–0.654). The difference in the prediction results, the difference was statistically significant (p = 0.001). The scoring efficiency after informationization was higher, but from the perspective of clinical application, the AUC of the PPH risk assessment table was 0.669. Prediction efficiency does not reflect risk prediction ability well. In actual clinical application, approximately half of pregnant women with high blood loss are assessed as having a low risk of PPH, the missed detection rate is high, and the prediction model performance ability is insufficient.
PPH risk prediction is a complex process that is affected by various aspects of pregnant women. In addition to obvious bleeding tendencies, the medical history, pregnancy situation, delivery situation and foetal situation of pregnant women all have important effects on PPH risk [22]. This study mainly focused on two aspects: the pregnancy complications and basic situations of pregnant women. Based on the previously implemented “Postpartum Haemorrhage Risk Assessment Table”, we integrated pregnant women’s electronic medical record information with the help of word frequency statistics and other information means. After discussion by obstetrics and gynaecology experts and statistical analysis, we identified possible pregnancy complications that affect PPH risk. Finally, we focused on 19 assessment factors related to PPH risk, including age, parity, delivery time, gestational week, intrapartum blood loss (mL), newborn weight (g), obstetric complications, multiple pregnancy, assisted reproduction, uterine fibroids, hypertension, uterine scar, preterm birth, placenta previa, cysts, chorioamnionitis, perineal laceration, diabetes and caesarean section, as shown in Table 1. After statistical analysis, the results showed that except for uterine scar and chorioamnionitis, the other 17 factors showed significant statistical differences between groups.
Machine learning is a branch of artificial intelligence that uses algorithms and data to learn from patterns and make predictions. Machine learning has been applied in various fields of medicine, including obstetrics and gynaecology [23]. Some studies have used machine learning techniques to develop and validate models that use various types of data (such as demographic, clinical, laboratory and electronic health record data) to identify patients at risk for PPH. For example, Westcott JM et al. [24], based on a Canadian dataset with more than 100,000 delivery records, compared different machine learning algorithms, such as logistic regression, support vector machine, random forest, gradient boosting tree and neural network algorithms, and found that the neural network model had the highest prediction accuracy and sensitivity and could identify patients at high risk of PPH. Escobar GJ et al. [25] used an automated electronic health record dataset of more than 200,000 delivery records in CA, USA, to build a logistic regression model to predict obstetric and foetal complications, including PPH, placental abruption, placenta accreta, and foetal distress. They found that the logistic regression model could effectively predict obstetric and foetal complications and provide real-time risk assessment and management. Akazawa M et al. [26], based on a Japanese dataset of nearly 20,000 vaginal delivery records, compared different machine learning algorithms, such as logistic regression, support vector machine, random forest, XGBoost and LightGBM algorithms, and found that the LightGBM model had the highest prediction accuracy and sensitivity and could predict the risk of PPH in women with vaginal delivery based on predelivery and intrapartum variables. Mehrnoush V et al. [27], compared traditional statistical analysis and machine learning models for predicting PPH using a dataset of 8888 deliveries in Iran. The results showed that machine learning models had higher accuracy, sensitivity and specificity than traditional statistical analysis, and XGBoost classification model performed the best. The article also identified 17 risk factors for PPH, such as anemia, general anesthesia, and abnormal placentation. These studies show that machine learning models have higher accuracy, sensitivity and specificity in predicting PPH than traditional statistical models. Machine learning models can also provide insight into the important features and risk factors associated with PPH, which can potentially help clinical doctors stratify patients according to their risk level and implement preventive and therapeutic interventions accordingly.
Before building a predictive model, selecting appropriate features to enter into the predictive model for operation is very important. Machine learning feature selection methods include the following: RFE, which is a recursive feature elimination method [28] that reduces the number of features by repeatedly building models and selecting the best or worst features [29]; RFECV, which is a recursive feature elimination method that determines the optimal number of features by cross-validation [30, 31]; SelectKBest is a method that involves selecting the k best scoring features and evaluating the importance of each feature based on a given scoring function [32]. These three methods can be used to improve model performance and reduce computational costs, but this study found that the RFE feature selection method performed best in this dataset because it was most in line with the clinical need for efficient management, that is, using the fewest assessment factors to achieve the highest prediction efficiency.
Although there are many machine learning classification algorithms that can use large amounts of data and complex features to improve prediction ability, the interpretability, transferability and implementability of the model also deserves attention. In future research, more machine learning models should be considered for clinical utility and cost-effectiveness, as well as for comparison and integration with traditional statistical models. This study used the Python language and scikit-learn library to implement these two algorithms and a cross-validation method to evaluate the performance of the predictive models; both achieved relatively ideal predictive models. However, limited by the number of participants included, the operation differences of experts from different centres in risk assessment, and the fact that there is no most suitable method for building risk prediction models, the existing research provides a new idea of feature selection and a method of model building. The specific prediction model still needs more clinical practice and application.
We used machine learning algorithms to efficiently develop a PPH prediction model with high prediction efficiency, reduced the need for manual computation, and identified the most suitable PPH prediction model among the existing classification algorithms.
The data used in this study are available to share with other researchers upon reasonable request and approval from the authors. For details on data and code sharing, please contact the corresponding author.
Study concepts and drafting the manuscript: YH; clinical data evaluation and collection: CL; data interpretation: YH; quality control of data: HZ; statistical analysis: WW; manuscript editing: WW. All authors contributed to editorial changes in the manuscript. All authors read and approved the final manuscript. All authors have participated sufficiently in the work and agreed to be accountable for all aspects of the work.
All patient information in this study was reviewed and approved by the Medical Ethics Committee of Wenzhou People’s Hospital (Ethics Approval No. 2020-105). And all subjects gave their informed consent for inclusion before they participated in the study.
We would like to express our gratitude to Wenzhou Key Laboratory of Obstetrics and Gynecology and Research Center of Wenzhou People’s Hospital for their support of this article. We also would like to specially thank Director Xiaokai Yang from Wenzhou Key Laboratory of Neurodegenerative Diseases of Intelligent Medicine for his guidance on the algorithm and code aspects. Thanks to all the peer reviewers for their opinions and suggestions.
This work was supported by the Health Science and Technology Project of Zhejiang Province, China (2021KY1080, 2024KY1629), Wenzhou Major Science and Technology Innovation Project (ZY2021025), and Wenzhou Basic Scientific Research Project (Y2020080).
The authors declare no conflict of interest.
Publisher’s Note: IMR Press stays neutral with regard to jurisdictional claims in published maps and institutional affiliations.