
- Academic Editor
†These authors contributed equally.
Background: The calcium-binding matricellular glycoprotein (SPARC, secreted protein, acidic and rich in cysteine) belongs to the extracellular-matrix-protein family, and its functions mainly focus on tissue injury, remodeling, and tumorigenesis. The role of SPARC in ovarian cancer remains controversial at present. Methods: We searched SPARC using The Cancer Genome Atlas/Genotype-Tissue Expression (TCGA/GTEx) and other databases to analyze the relationship between its expression level and survival, immunity signatures, and chemical drug response, in ovarian cancer. Additionally, we overexpressed SPARC with plasmids in ovarian cancer SKOV3 and ID8 cell lines, then measured the effects of SPARC on the proliferation, migration, invasiveness, clonality, and stemness of ovarian cancer cells by Cell Counting Kit-8 (CCK8), Transwell, wound healing assay, adhesion assay, plate cloning assay, and soft agar spheroid formation in vitro. The Gene Ontology (GO) and Kyoto Encyclopedia of Genes and Genomes (KEGG) enrichment analyses showed the potential signaling pathway for SPARC. Results: The higher expression of SPARC in ovarian cancer is related to more advanced tumor stage, poorer clinical survival, and worse chemical drug response, whereas it is positively correlated with immune signatures. For ovarian cancer phenotypes, higher SPARC expression level promotes cell proliferation, migration, colony formation, and spheroid formation. The GO and KEGG enrichment highlighted the potential molecular mechanisms for SPARC with PI3K-AKT and MAPK signaling regulation. Conclusions: SPARC promotes ovarian cancer progression through proliferation, migration, invasiveness, clonality, and stemness. A high level of expression of SPARC in ovarian cancer patients can be used as a marker of poor prognosis and poor drug response.
SPARC (secreted protein, acidic and rich in cysteine), also known as osteonectin or BM-40, is a multifunctional glycoprotein
(32–35 kDa) that belongs to the extracellular-matrix-protein family. It is
encoded by a single gene on human chromosome 5q31.1 [1, 2]. The mature SPARC
protein is composed of three different regions, which include an N-terminus
acidic domain (NT), a follistatin-like domain (FS), and a C-terminus domain (EC).
The NT domain contains a Ca
According to the The Cancer Genome Atlas (TCGA) database, the SPARC gene is
expressed in 32 different forms of cancer, and patients with breast cancer,
gastric adenocarcinoma, pancreatic cancer, and mesothelioma have a poor prognosis
when this gene is highly expressed [3, 4, 5]. The overexpression of SPARC has been
shown to enhance liver cancer cell (HepG2 cell) proliferation in vitro
and tumor growth in murine xenograft models [6]. SPARC acts as a mediator of
transforming growth factor beta1 (TGF-
However, there is some debate about the roles of SPARC in human malignancies. In colorectal, prostate, and cervical cancer, SPARC is considered to act as a tumor suppressor [10]. Research has suggested that SPARC is involved in inducing endoplasmic reticulum (ER) stress to promote autophagy-mediated apoptosis in neuroblastoma [11]. In addition, SPARC has been found to reduce bladder cancer proliferation and lung metastasis by inhibiting cancer-associated inflammation [12].
The roles of SPARC in ovarian carcinomas are unclear. Some reports have
suggested that SPARC may have pro-tumor effects in ovarian cancer and some
suggested anti-tumor effects. Chen et al. [13] showed
that decreasing SPARC could inhibit ovarian cancer growth,
accelerate apoptosis, and suppress metastasis and invasion. On the other hand,
research has shown that SPARC can inhibit peritoneal metastasis of ovarian cancer
cells by inhibiting the cEBP
In the present study on ovarian cancer, we sought to validate SPARC expression-based function in cell proliferation, migration, invasiveness, clonality and stemness, in vitro.
The SKOV3 and ID8 cell lines were obtained from ATCC and Sigma-Aldrich,
respectively. We tested for mycoplasma contamination and verified cells by short
tandem repeat (STR) test; morphology was confirmed by pathologist before the
experiments. Cells were cultured in DMEM medium mixed with 10% fetal bovine
serum (Biosharp, Hefei, Anhui, China), 100 U/mL penicillin, and 100 U/mL streptomycin (Phygene, Fuzhou, Fujian,
China) at 37 °C with 5% CO
The SPARC over-expressing plasmid was synthesized and the coding area of SPARC, based on pcDNA3.1+ vector, was added. The SPARC-over-expression (OE) vector was transfected into SKOV3 cells and ID8 cells by Lipofectamine 8000 (Beyotime, Shanghai, China). The empty plasmid was also transfected as the internal control.
SKOV3-Vector/ID8-Vector cells and SKOV3-SPARC/ID8-SPARC cells (4
The cells (1
SKOV3-Vector/ID8-Vector cells and SKOV3-SPARC/ID8-SPARC cells (SKOV3: 8
SKOV3-Vector/ID8-Vector cells and SKOV3-SPARC/ID8-SPARC cells
were seeded into 96-well plates at 5
A 24-well plate was precoated with 100 µL fibronectin (20 µg/mL),
100 µL collagen I (100 µg/mL), and 100 µL poly-l-lysine (100
µg/mL) in PBS, and placed in a cell incubator for 1 h. The PBS was replaced
and 300 µL blocking buffer (0.5% bovine serum albumin (BSA) in medium) was
added to each well for an additional 60 min. Then, the blocking buffer was
replaced with 1
Agarose solution (1%) was prepared and autoclaved, then spread on the bottom of
the 100-mm dish when the temperature dropped to about 40 °C. The cells (1
UCSC Xena and Genotype-Tissue Expression (GTEx) databases were explored by
UCSCXenaShiny, an R software package (version 4.23, Lucent Technologies, Murray
Hill, NJ, USA) [16]. The mRNA expression and DNA methylation of SPARC were
screened with this application (Plugin Version: v0.1.0) in both tumor samples and
normal samples, if any. A p
GEPIA is a customizable pan-cancer analysis online tool for sequencing data from TCGA with clinical parameters. The GEPIA database was accessed to obtain SPARC transcript expressions among the major stages of ovarian cancer sorted by transcripts per million [17]. An F value was calculated.
The Kaplan-Meier plotter for ovarian cancer was accessed to evaluate SPARC
expression value with clinical outcome [18]. The probe SPARC (212667_at) was
used for estimating overall survival or progression-free survival by the
Kaplan-Meier method. A positive independent biomarker was considered as log-rank
p
Frequent genetic mutations in ovarian-cancer are considered one of the main reasons for extremely poor clinical outcome. The ROC plotter database (website database with therapy effect associated with sequencing data of cancers) was accessed to explore the general drug response for chemical application in treating ovarian cancer. SPARC (200665_s_at) was validated in both drug-responder and non-responder cohorts, and the Area Under Curve (AUC) with p-value was calculated [19]. In addition, specific drugs (Platin, taxane, docetaxel, paclitaxel, gemcitabine) were applied by ROC plotter in both drug-response and non-response cohort. The relapse-free survival value at 6 mo (n = 1347) was set as the analysis cohort.
The Timer2.0 database was accessed to provide an estimation of immune
infiltration with SPARC level. The Immune association model was applied for
evaluation of the correlation of SPARC expression (log2 TPM (transcripts per
kilobase million)) with infiltration of 9 major immune cell types (B cell; T cell
CD4
The Timer2.0 database was applied using cancer exploration model [20]. The correlation between SPARC RNA-seq expression (log2 TPM) and CD274, CDH1, CDH2, CTNNB1, FN1, MMP2, MMP9, VIM. ZEB1, and MUC1 were calculated by Pearson correlation with a p value. The immune checkpoint genes CTLA4 and PDCD1 were also counted with SPARC expression.
The LinkedOmics online database was used for the identification of DEGs. The
methods were previously described [21]. Briefly, the Pearson correlation of SPARC
with all RNA-seq transcripts was calculated. All positive-Pearson value related
DEGs (p
The Drug-Gene Interaction Database (https://www.dgidb.org/) is an online webtool that contains genetic information on drug-gene interactions, based on the biomarkers of target therapy for ovarian cancer [22]. Using the high or low expression of SPARC with the median value of the database cohort, the drug response for ovarian cancer patients was calculated.
Two groups were compared with Prism software (GraphPad, San Diego, CA, USA)
using a two-tailed unpaired Student’s t-test. All data were represented
as mean
According to the pan-cancer expression analysis comparing tumor and normal
tissue, SPARC is differentially expressed in ACC, BRCA, CESC, CHOL, COAD, DLBC,
ESCA, GBM, HNSCC, KIRC, KIRP, LAML, LGG, LIHC, OV, PAAD, PRAD, READ, SKCM, STAD,
THCA, THYM, and UCEC. With the exception of CESC, PRAD, and UCEC, the cancer
subtypes showed an increased expression of SPARC (Fig. 1A). It is interesting
that the DNA methylation of SPARC did not affect mRNA higher expression in tumor.
The beta-value was higher in BLCA, BRCA, CESC, CHOL, ESCA, HNSCC, KIRC, KIRP,
LUAD, LUSC, PAAD, PCPG, PRAD, and UCEC (Fig. 1B). This inconsistent status
between mRNA expression and DNA methylation indicated post-transcriptional
modification of SPARC. Importantly, SPARC is generally positively correlated with
immune signatures (TIMER). In ovarian cancer, SPARC expression is positively
related to T cell CD8
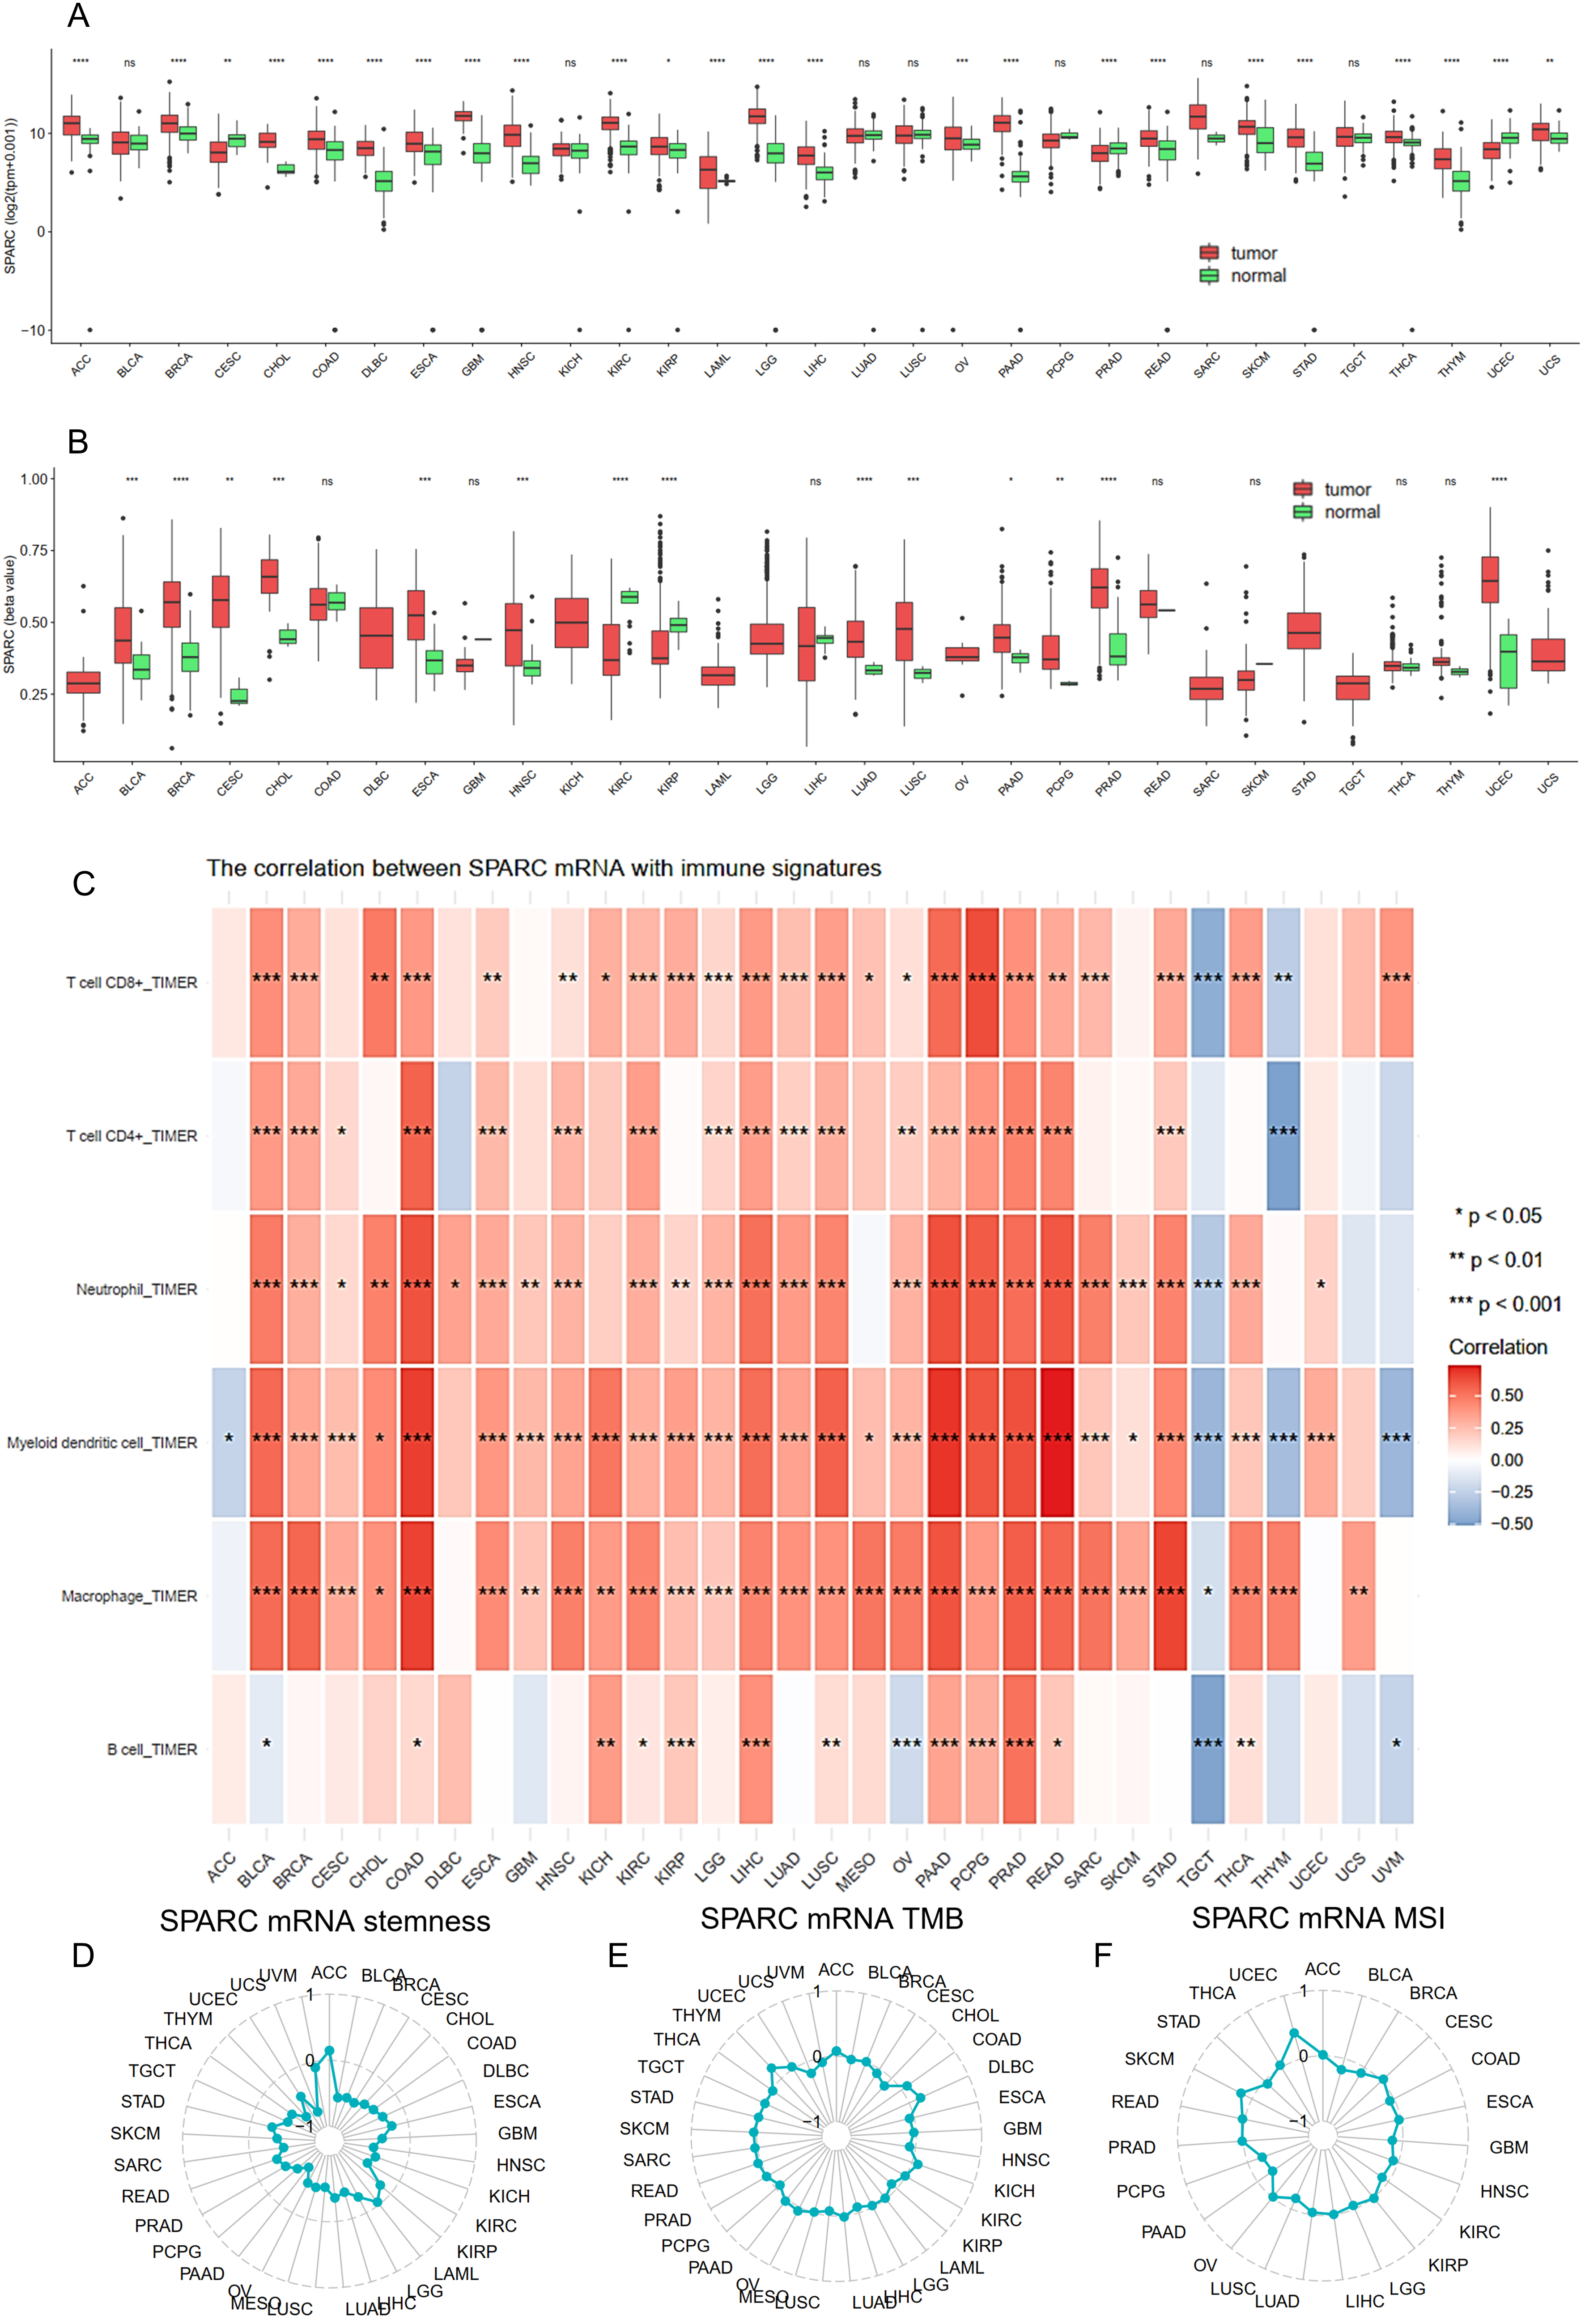 Fig. 1.
Pan-cancer analysis of SPARC. (A) Bar plot of SPARC (secreted protein, acidic and rich in cysteine) expression in tumors from The Cancer Genome Atlas (TCGA) in tumor sample and normal tissue. TPM, Transcripts Per Kilobase Million. (B) The DNA methylation of SPARC (TCGA database) for tumor and normal tissue using a bar plot with beta value. (C) The heatmap of the correlation between SPARC mRNA with immune signature in Pan-cancer. (D) The circle map of the correlation between SPARC mRNA level and cancer stemness through a Pan-cancer analysis. (E) The correlation circle map of SPARC mRNA level and tumor mutational burden (TMB) in Pan-cancer. (F) The correlation circle map of SPARC mRNA level and microsatellite instability (MSI) through Pan-cancer analysis. Inner circle indicates correlation = –1, middle circle indicates correlation = 0, outer circle indicates correlation = 1. Cancer type TCGA study abbreviation list: https://gdc.cancer.gov/resources-tcga-users/tcga-code-tables/tcga-study-abbreviations.
SPARC was significantly increased in ovarian cancer tumor samples comparing
normal ovarian tissue from the TCGA/GTEx database (Fig. 2A). According to the
major-stage analysis, SPARC increased from early stages to late stages, F = 1.19
(Fig. 2B). Although the dataset lacks Stage I data, the other major stages from
Stage IIa to Stage IV have already shown the increased expression pattern with
advancing stages. The Kaplan–Meier (KM)-plot results showed that SPARC
expression could be used as an ovarian cancer prognostic marker for both overall
survival and progression-free survival predictions, p = 0.006 and
0.0013, respectively (Fig. 2C,D). It is important that the higher expression
group demonstrated a worse clinical outcome in overall survival and
progression-free survival prediction [hazard ratio (HR) = 1.19 and 1.24,
respectively]. For general chemical drug response based on SPARC expression
level, the bar plot shows that the non-response group had a higher expression
than did the response group (Fig. 2E). Receiver operating characteristic (ROC)
analysis showed an AUC = 0.585, with p = 5
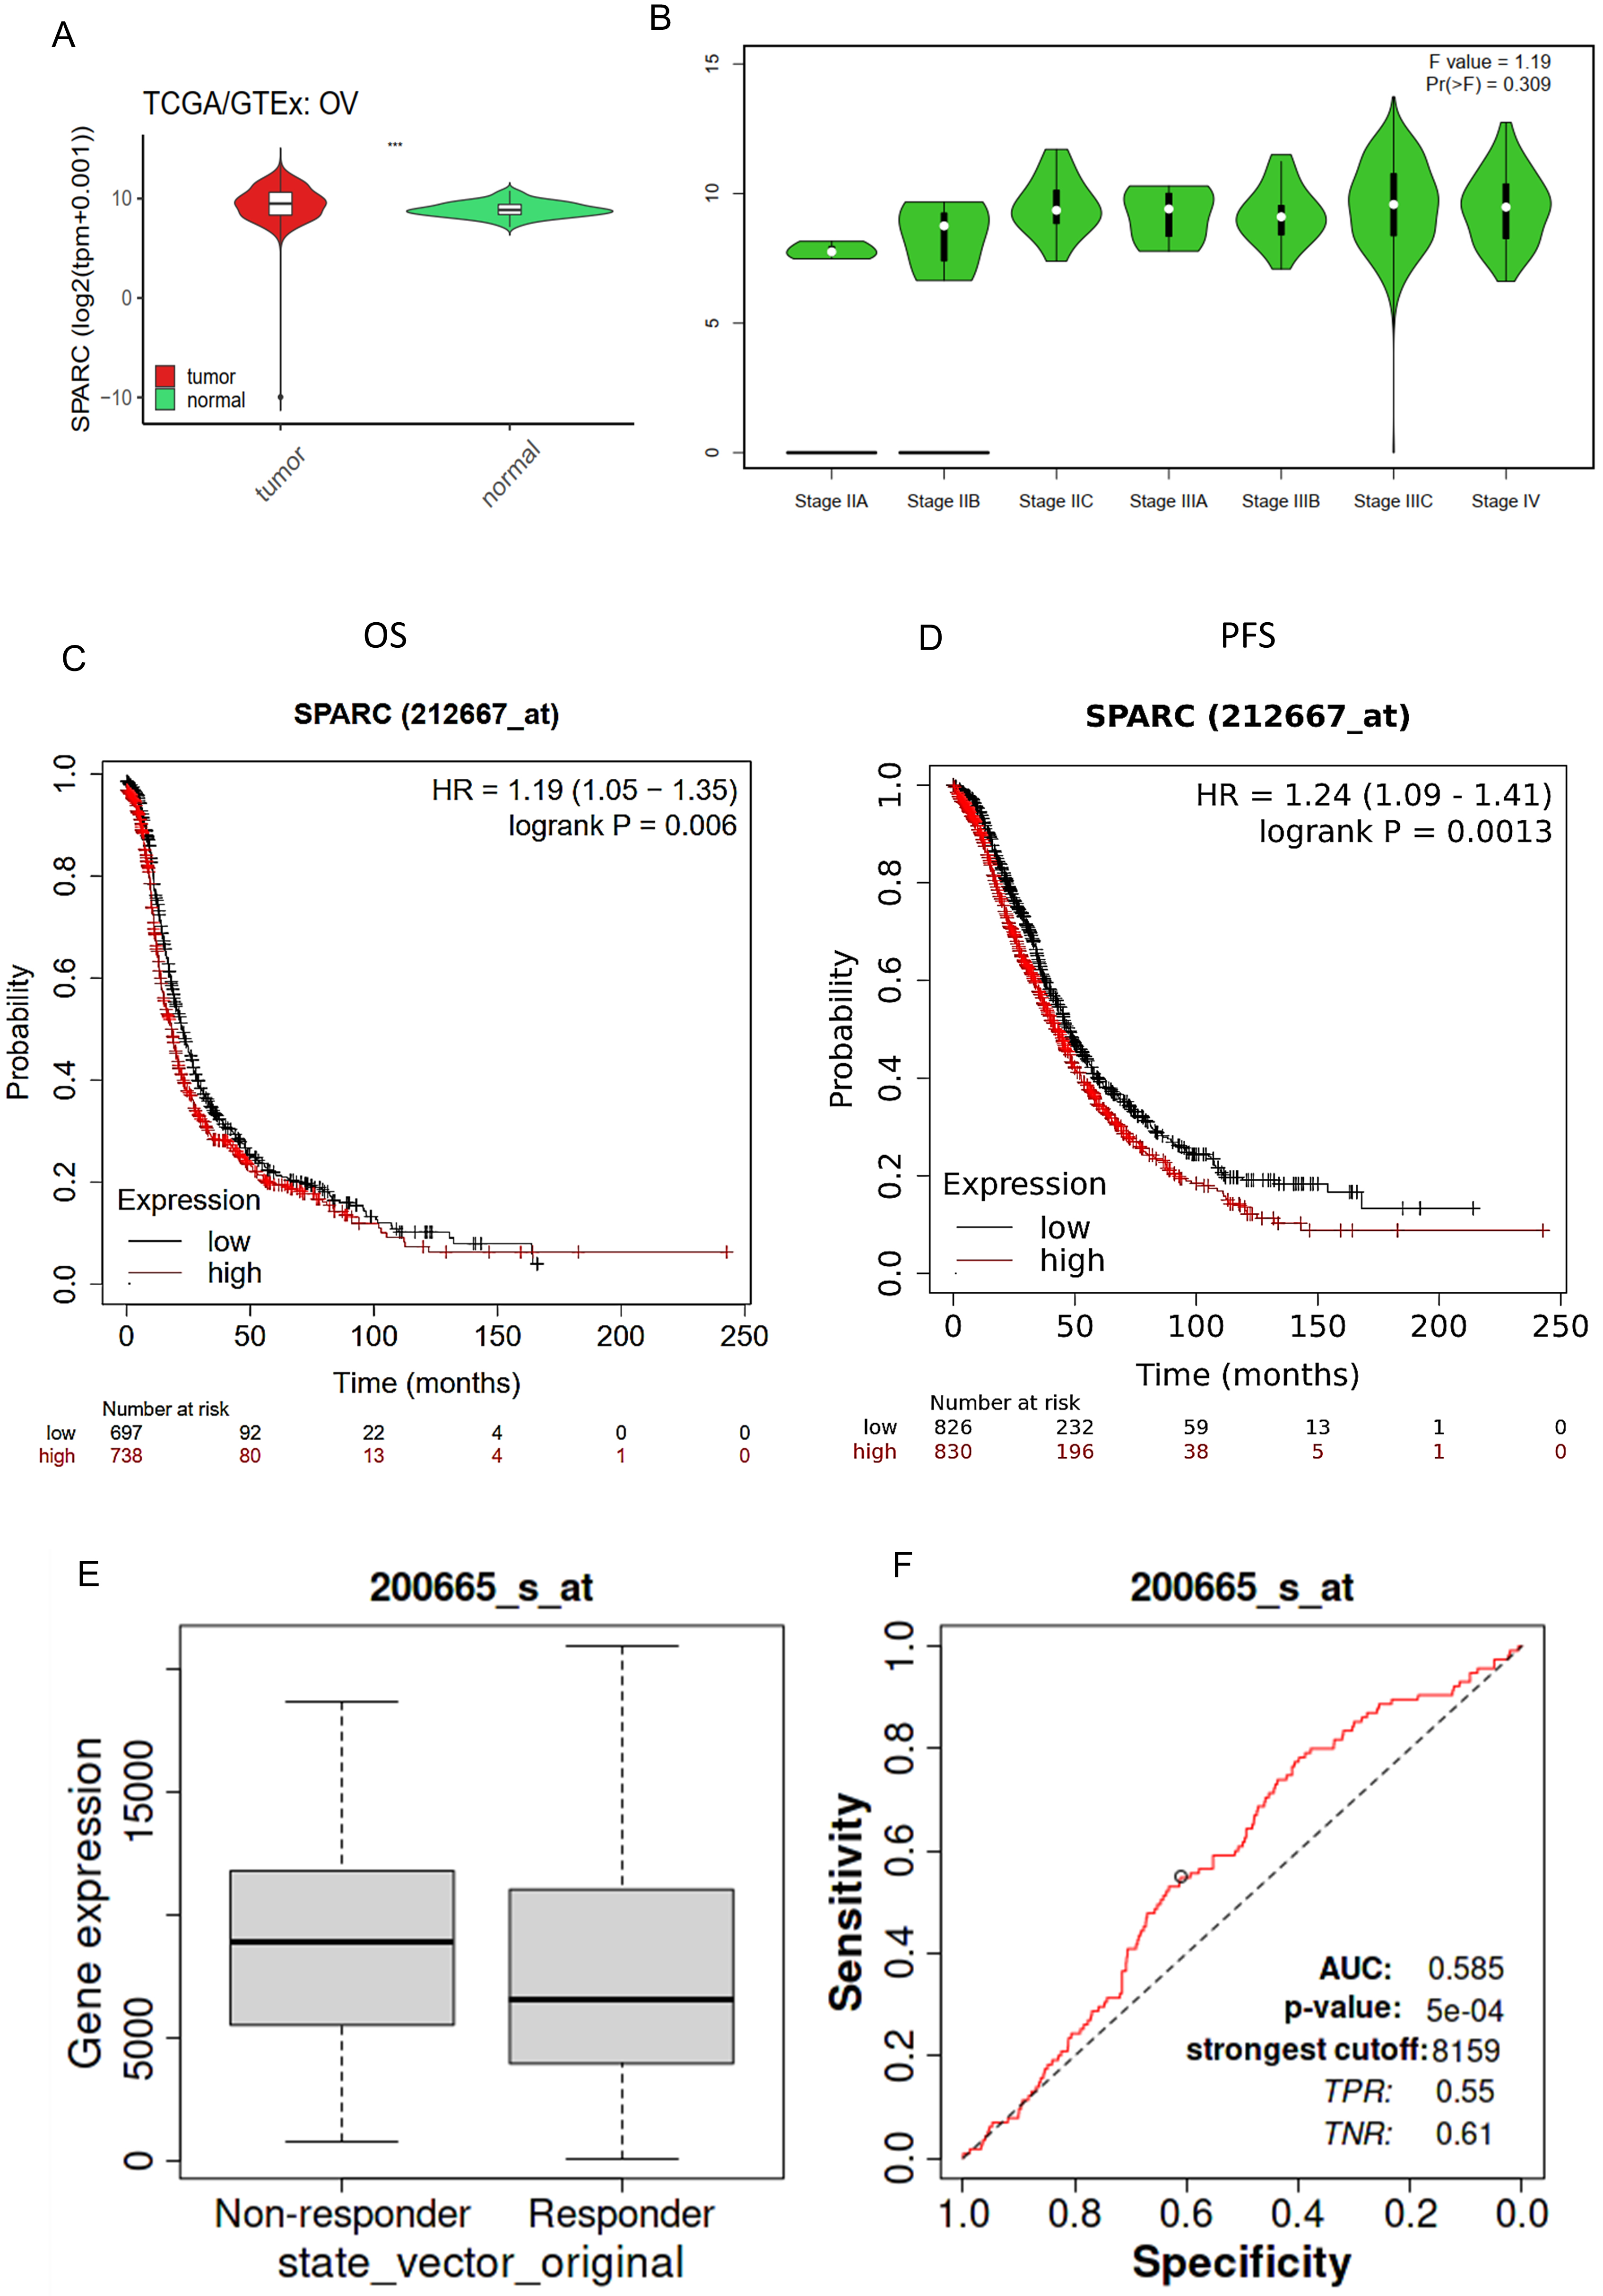 Fig. 2.
SPARC as a biomarker of ovarian cancer. (A) Bar plot of SPARC
expression comparing ovarian carcinoma (OV) tumor and normal tissue. (B) A violin
plot of SPARC expression in ovarian carcinoma major stages. Pr (
For specific drug-response-based survival analysis, including Platin, taxane,
cocetaxel, paclitaxel, and gemcitabine, SPARC gene expression showed a consistent
increase in the non-responder group and a worse clinical outcome. Platin-treated
patients (Fig. 3A): AUC = 0.594 with p = 1.7
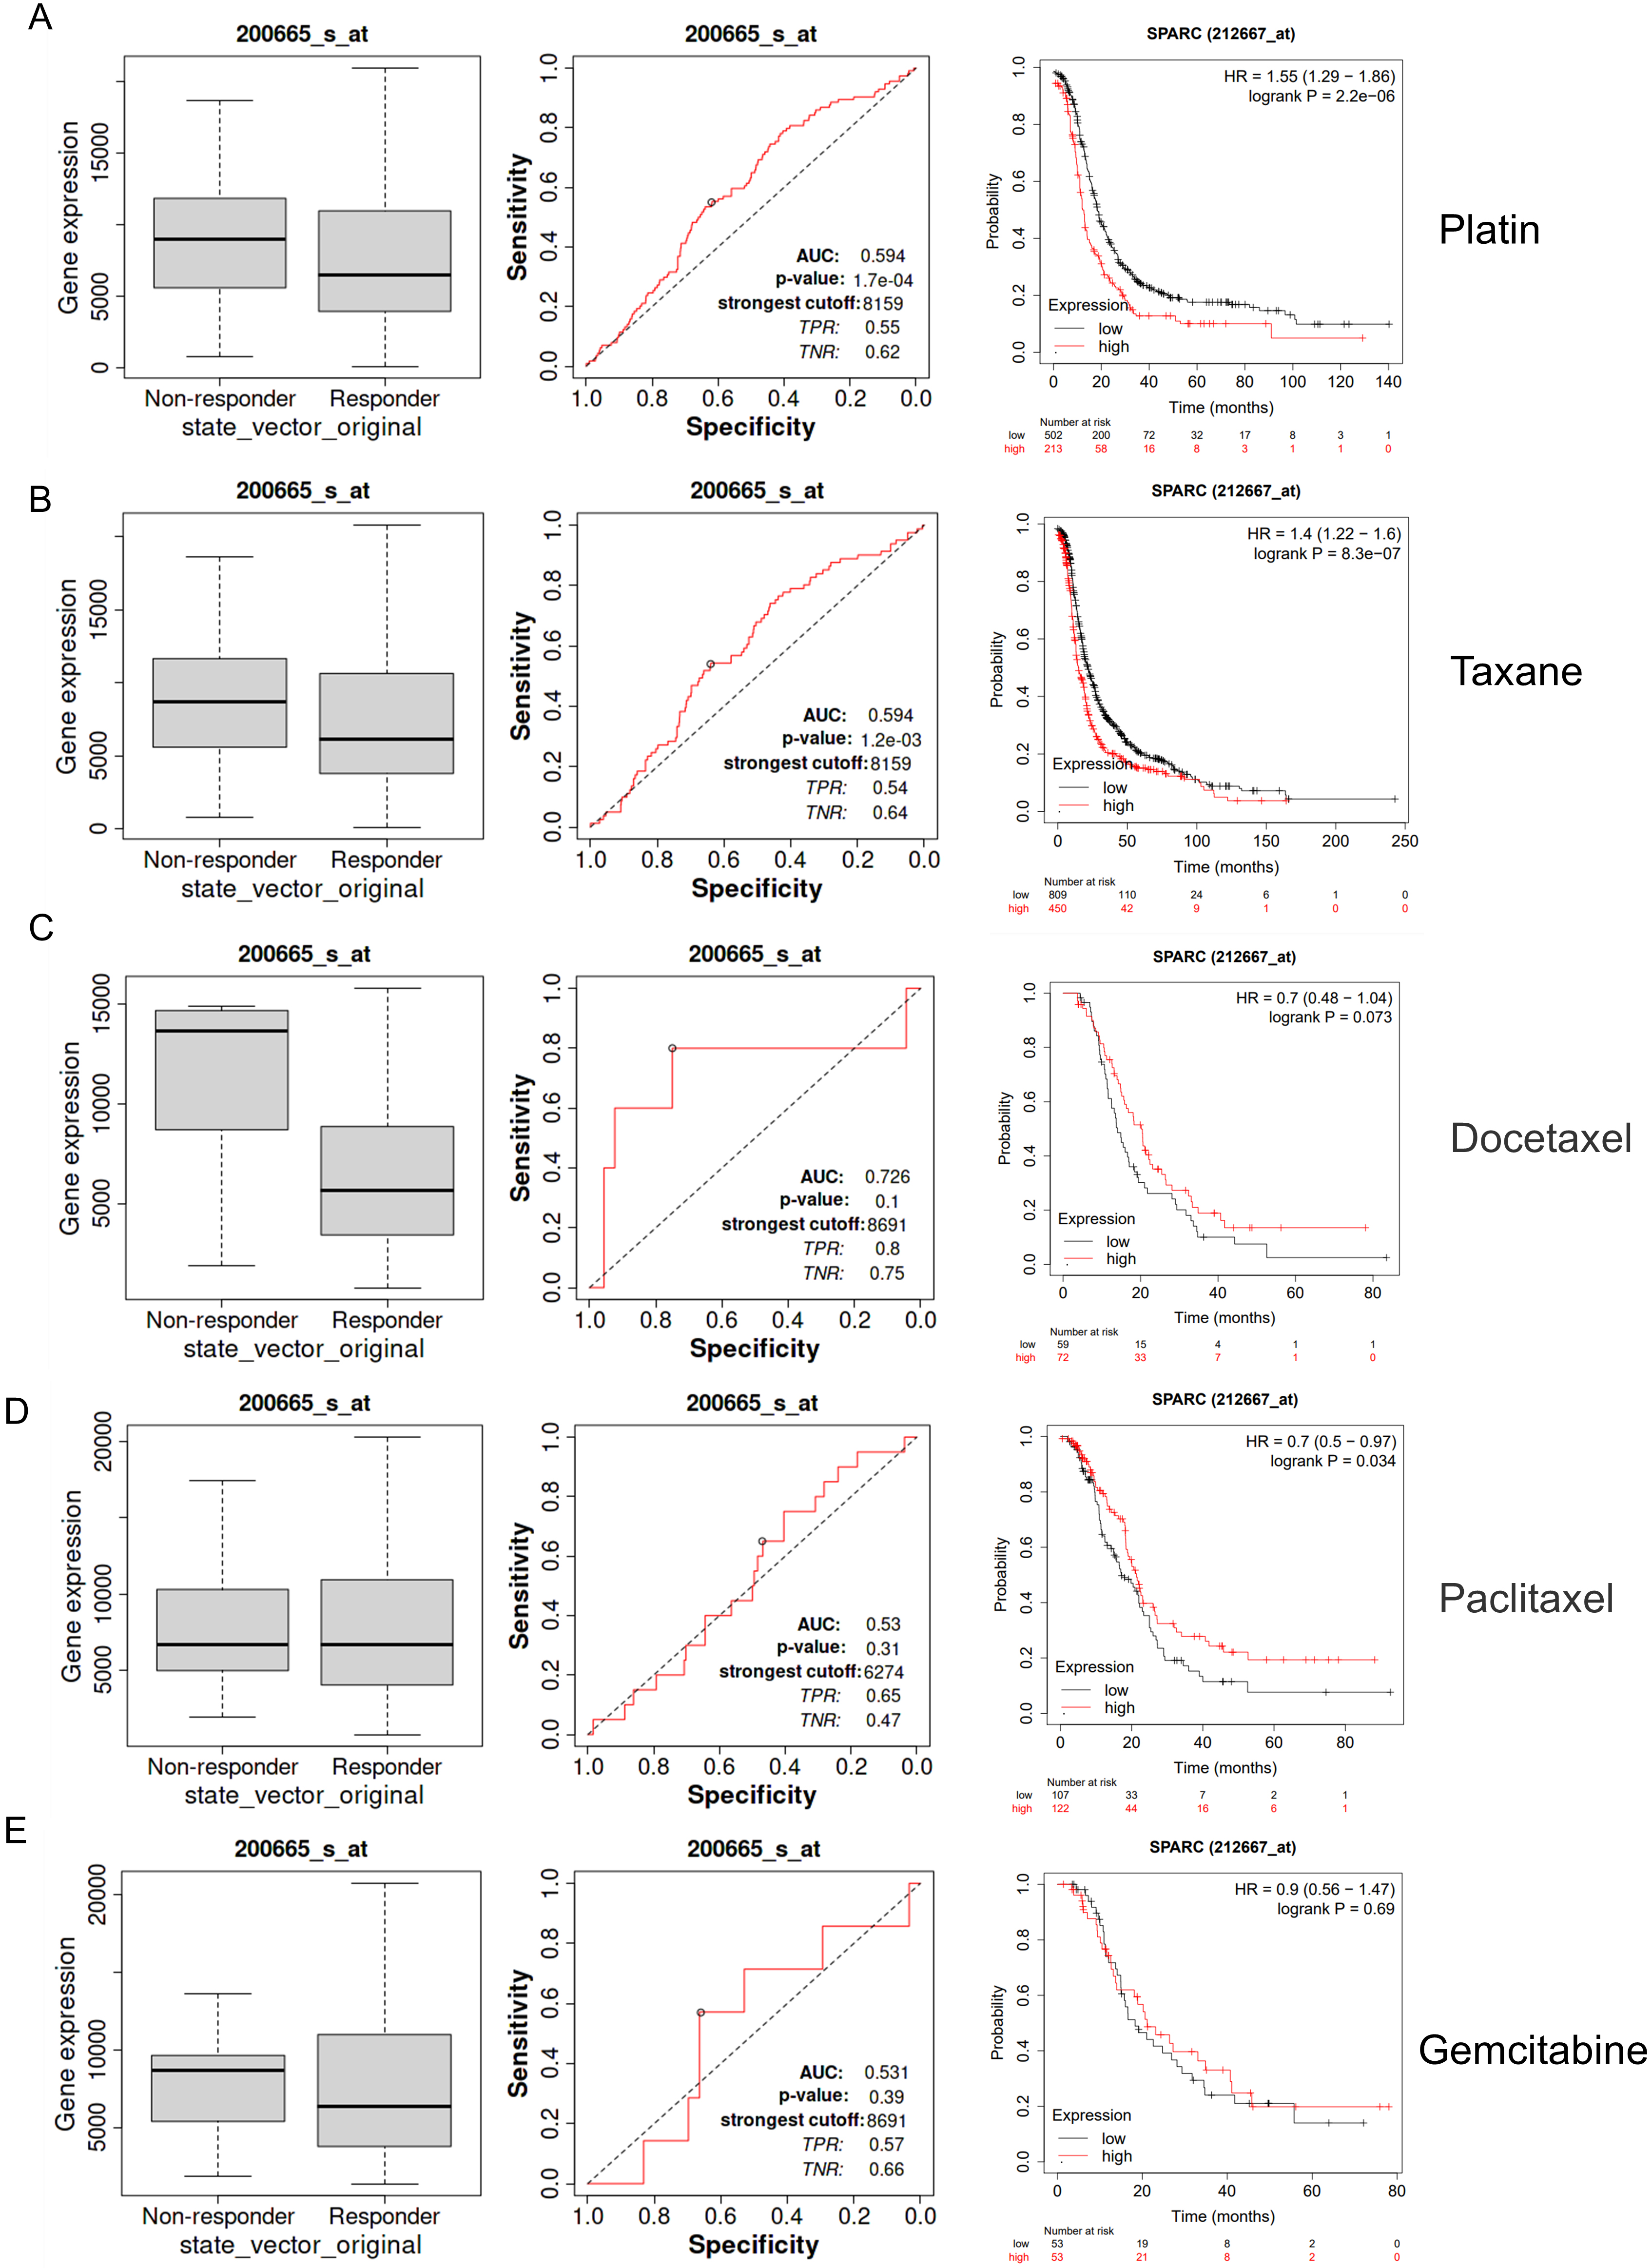 Fig. 3.
SPARC as drug response indicator of ovarian cancer. (A) A box plot of SPARC gene expression in both the non-responder and responder group of Platin treatment. ROC plot and drug based overall survival KM-plot (Best p-value). (B) Taxane. (C) Docetaxel. (D) Paclitaxel. (E) Gemcitabine.
For SKOV3 cells, the CCK-8 test demonstrated that overexpression of SPARC at Day 3 significantly increased cell proliferation (Fig. 4A). For the ID8 cell line, overexpressed SPARC produced a significantly increased proliferation at Days 2 and 3 (Fig. 4B). The cell migration ability was evaluated by Transwell, and the wound-healing assay showed that SPARC overexpression promoted cell movement in both SKOV-3 and ID8 ovarian cancer cells (Fig. 4C,E,F). For cell-colony formation and ovarian-cancer-spheroid formation, increased SPARC level enhanced the cell colony and spheroid-formation numbers in both SKOV-3 and ID8 cells (Fig. 5A,B). For cell-to-matrix adhesion, increased SPARC raised extracellular matrix collagen I, fibronectin, and Poly-L-lysine in ovarian cancer cell lines SKOV-3 and ID8 (Fig. 5D,E). Those in vitro experiments validated the GO biological process enrichment result including terms as “cell adhesion, positive regulate cell migration, positive regulation of ERK1 and ERK2 cascade, cell migration, and cell-matrix adhesion” (Fig. 4D). For KEGG enrichment, the terms “focal adhesion, ECM-receptor interaction, cell adhesion molecules, MAPK signaling pathway, and regulation of actin cytoskeleton” were indicated by those cell phenotypes (Fig. 5C).
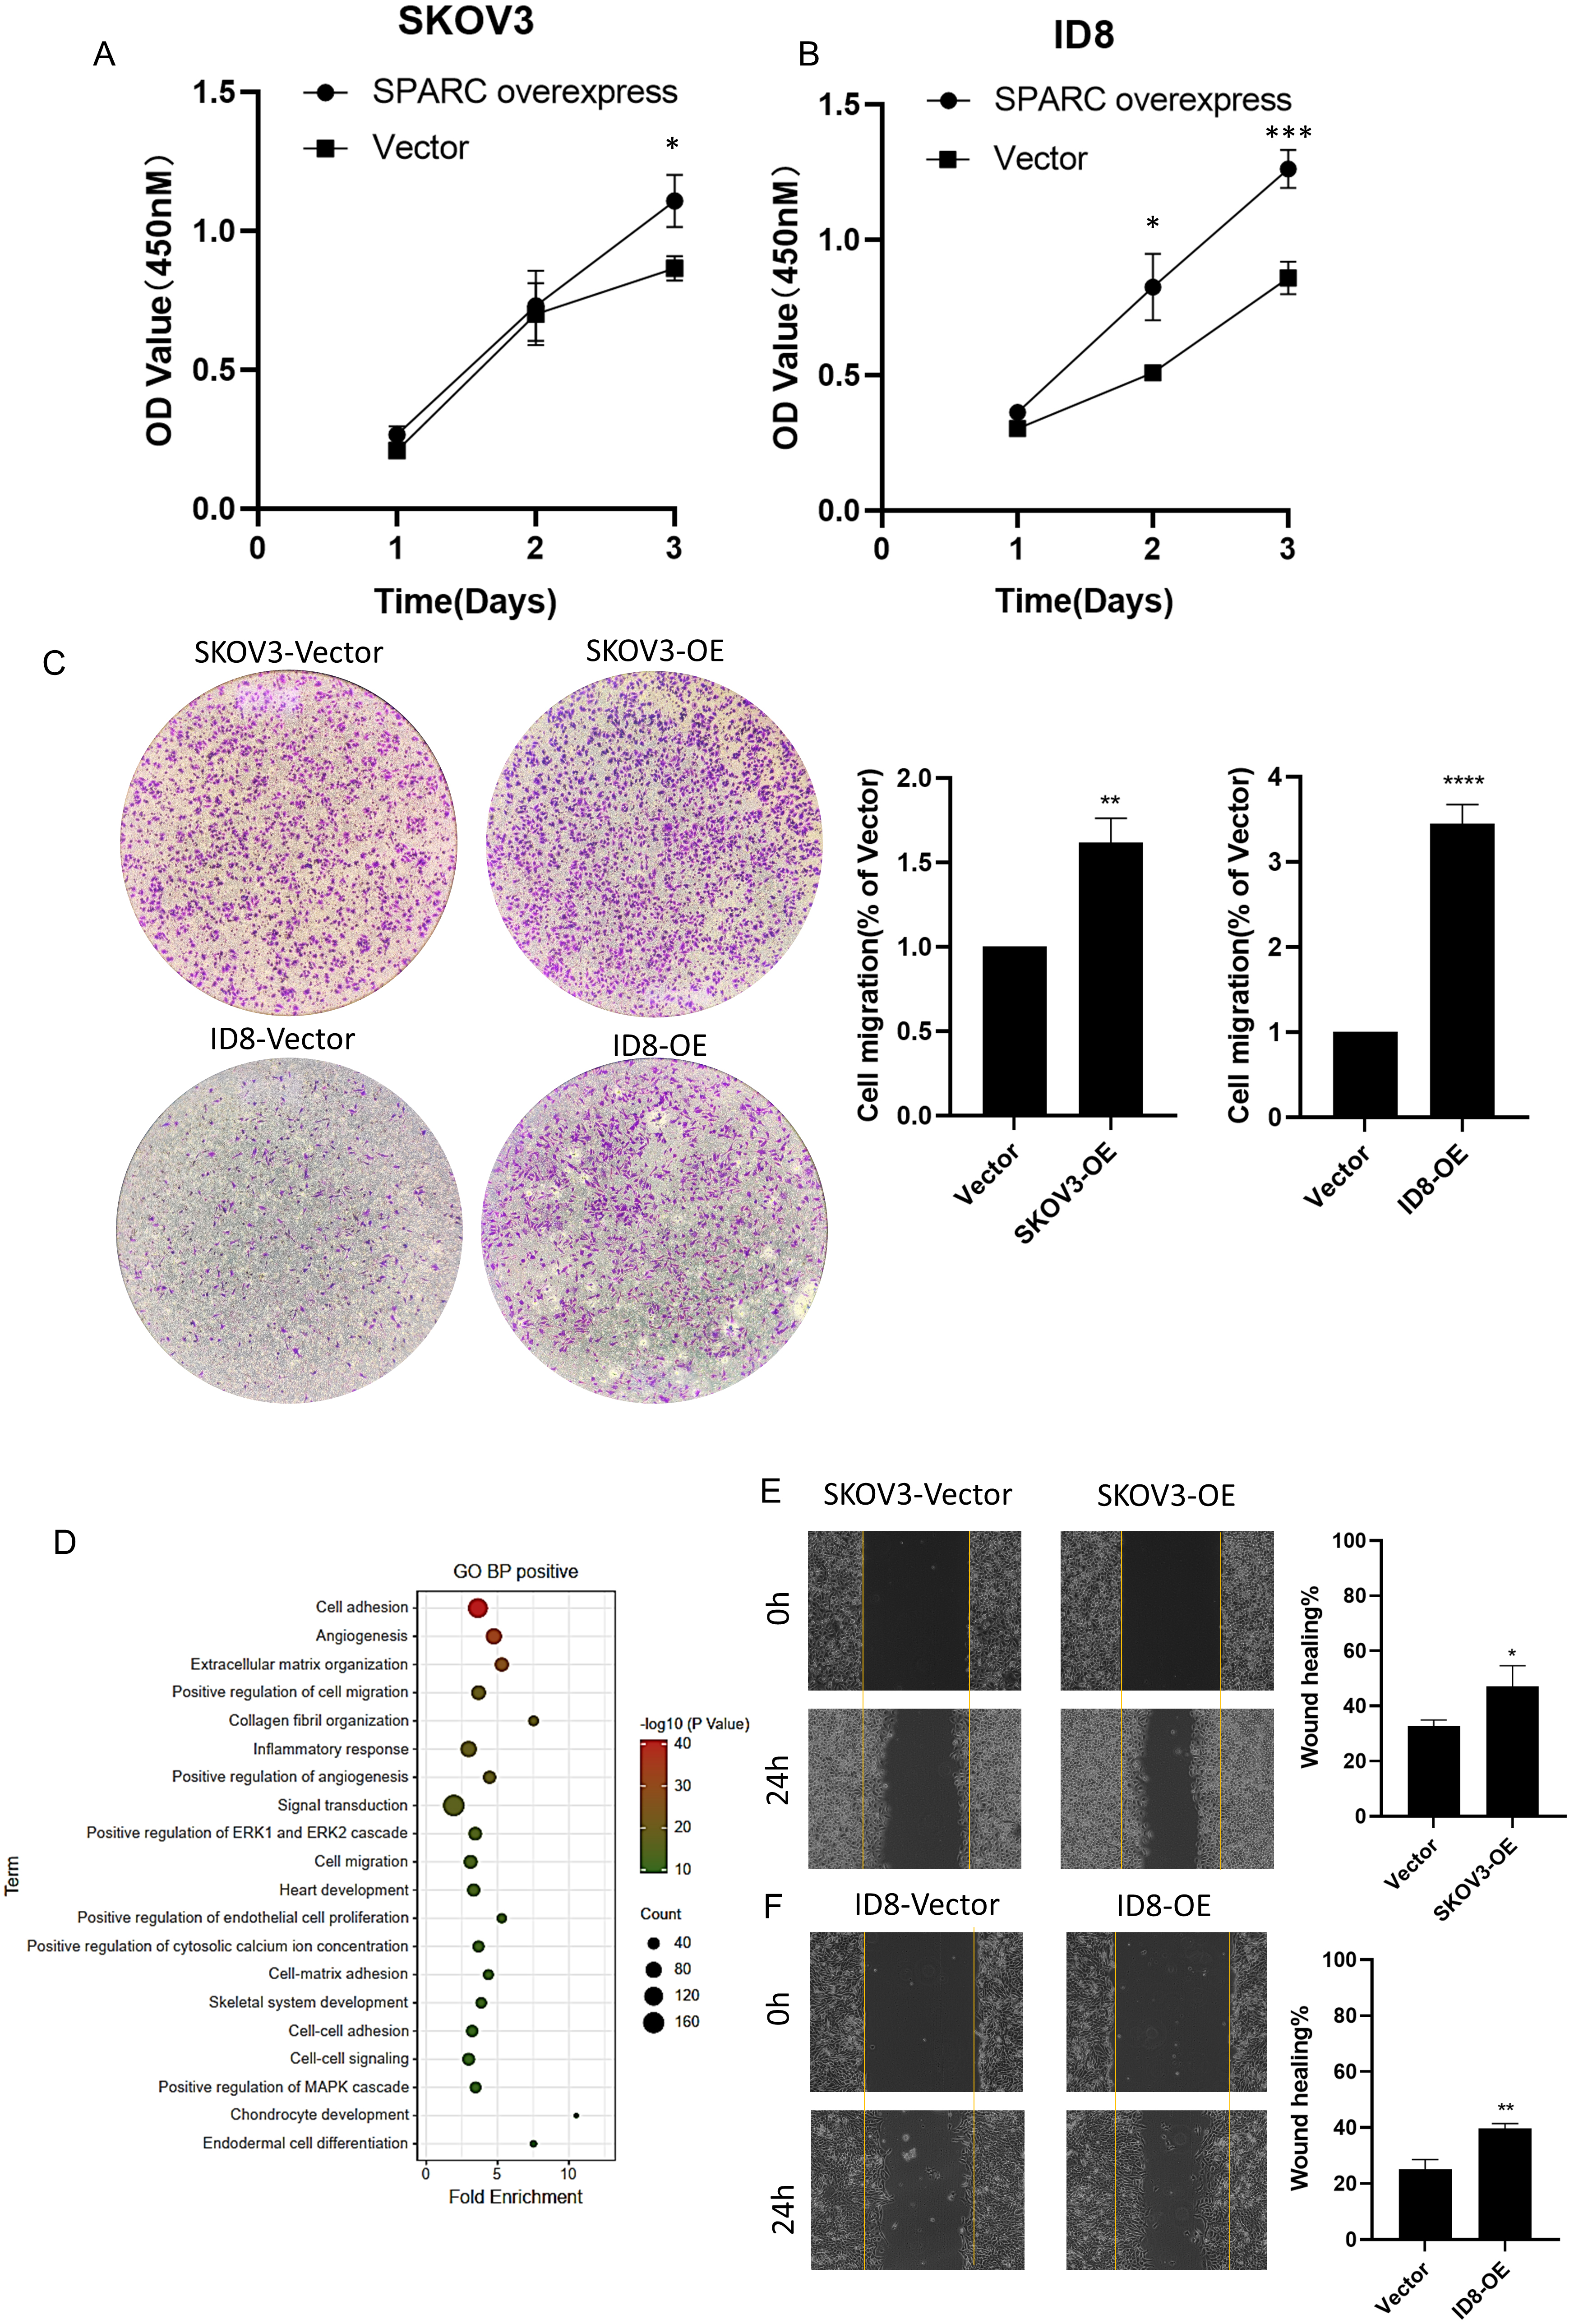 Fig. 4.
SPARC promoting ovarian cancer cell proliferation and
migration. (A) Cell Counting Kit-8 (CCK-8) dot plot of cell proliferation in
SKOV3 cells. *indicates p
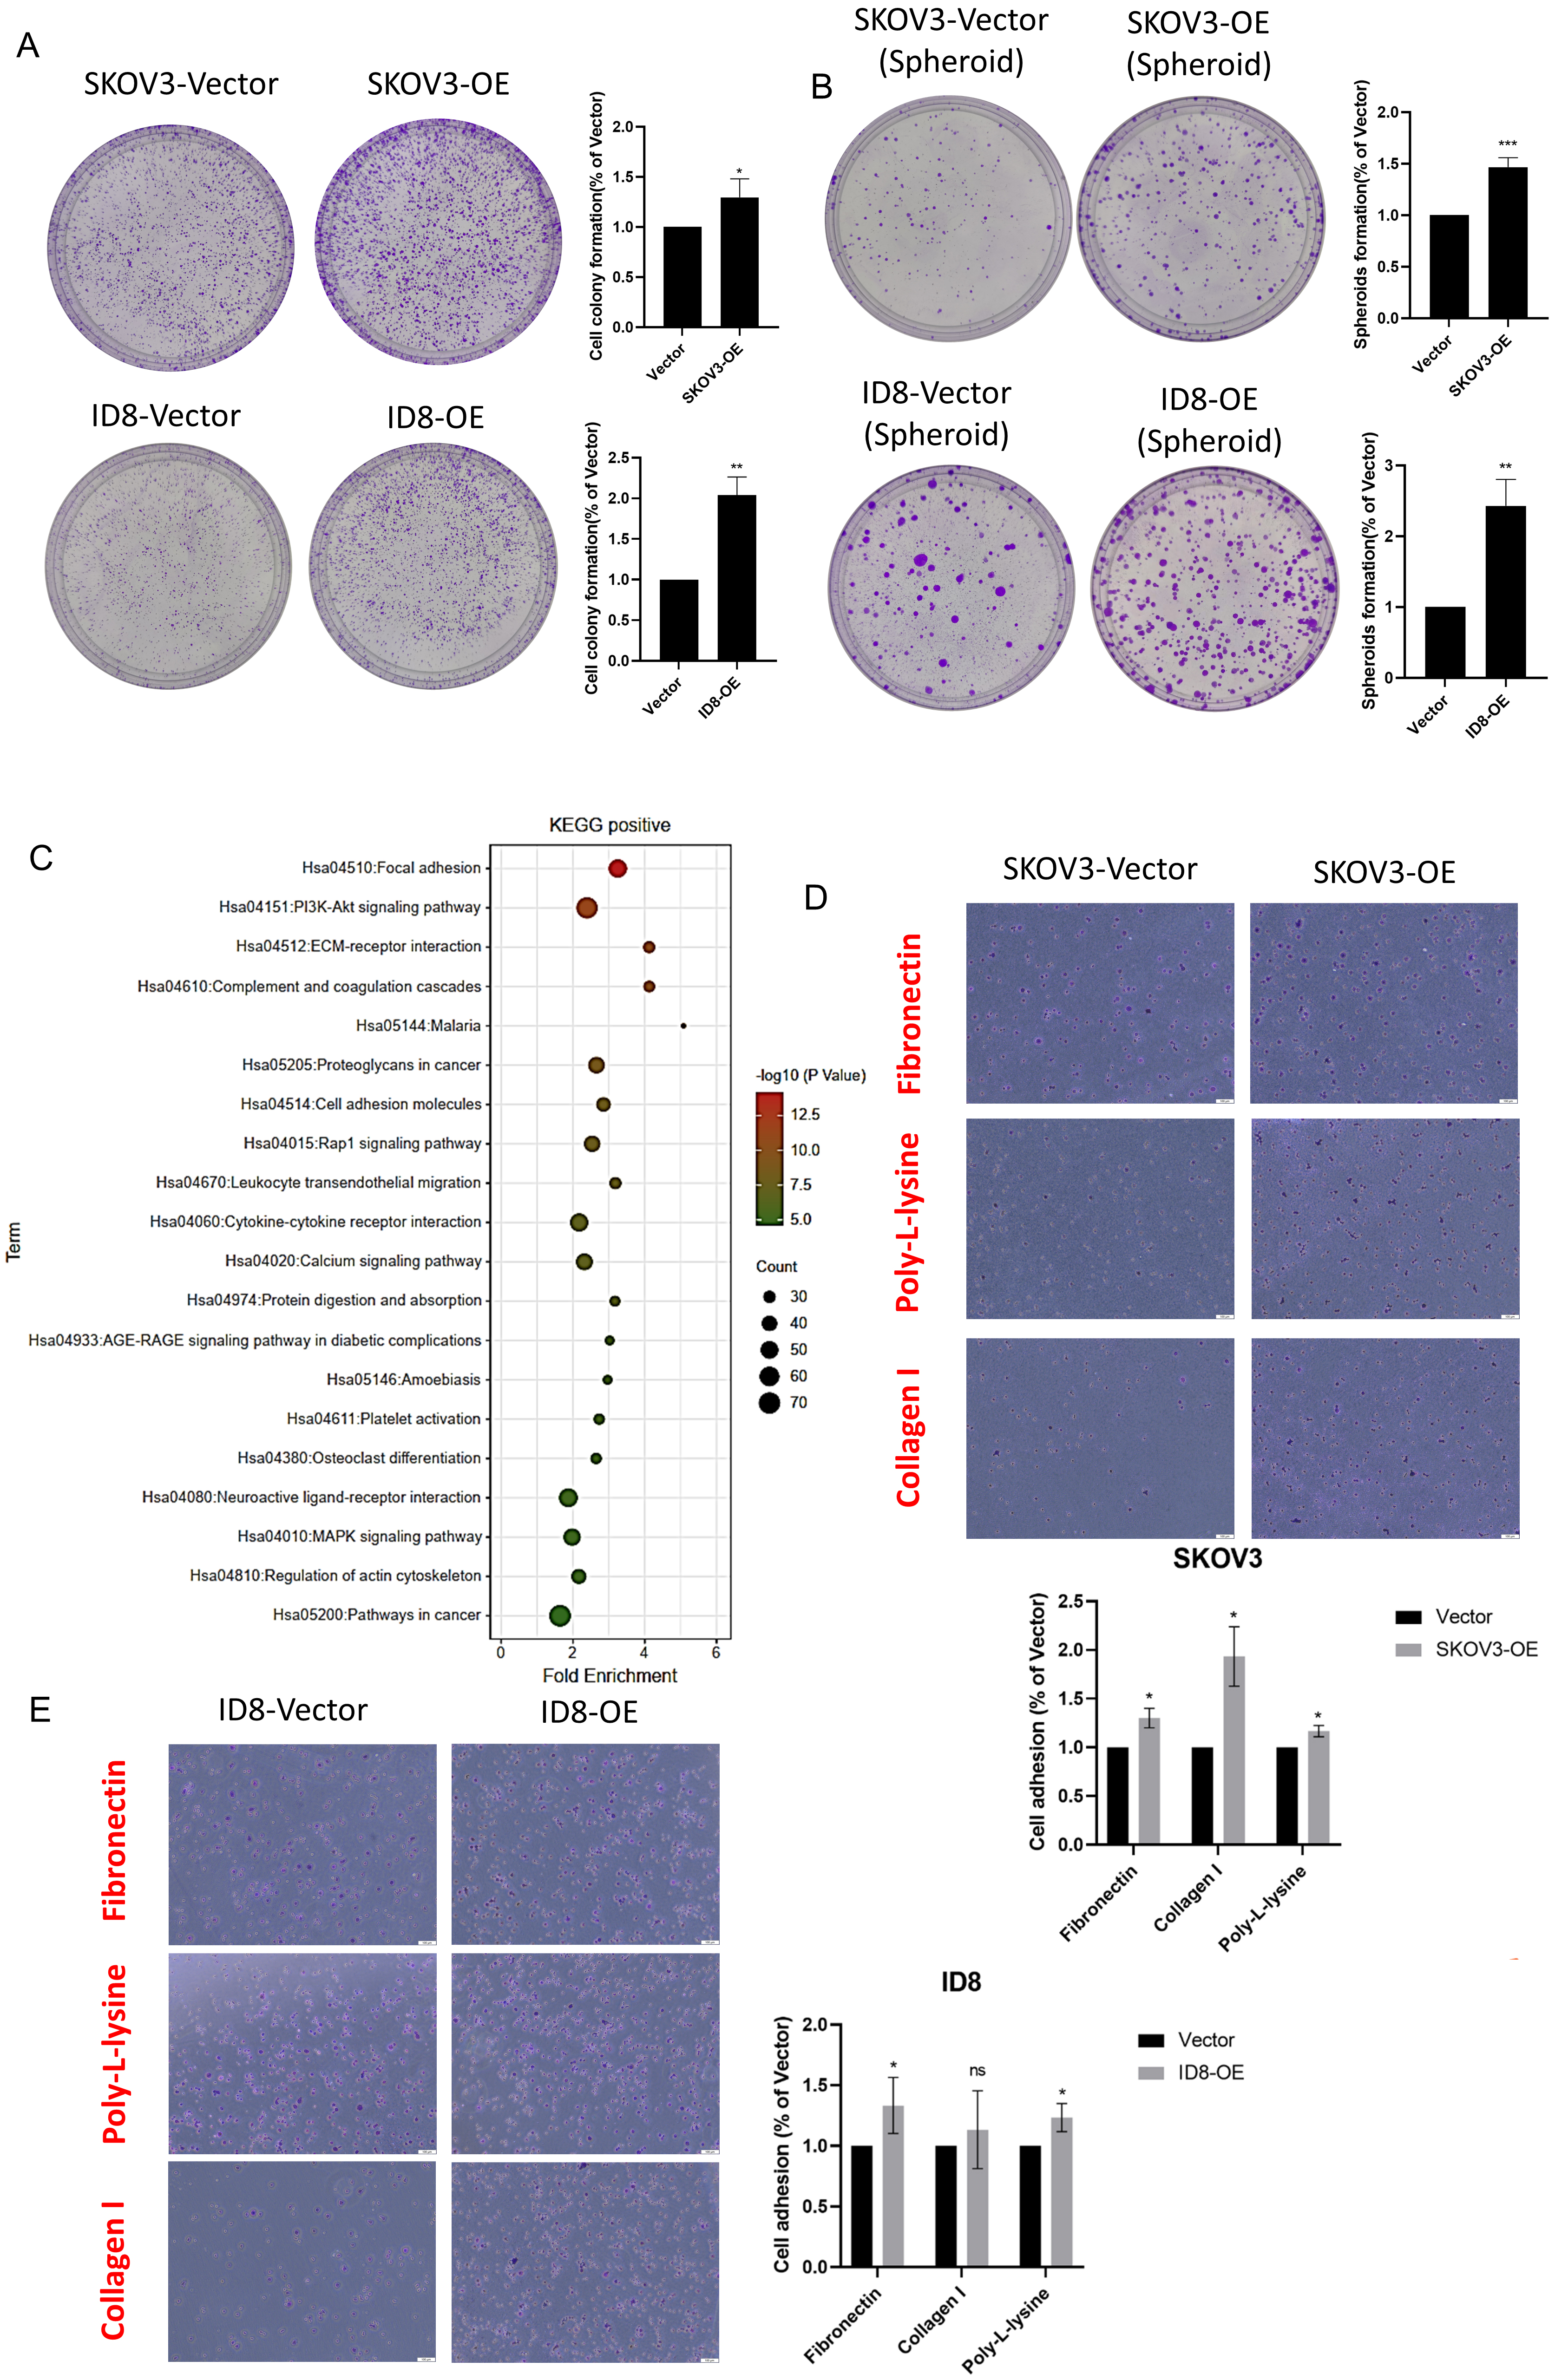 Fig. 5.
SPARC regulating ovarian cancer spheroids formation and adhesion
to matrix. (A) Colony-formation assay results: SPARC increase promoted colony
numbers in SKOV-3 and ID8 cells. (B) Spheroid-formation assay supported SPARC
level was associated with cell survival during metastasis process forming
mediated spheroids. (C) Bubble plot of Kyoto Encyclopedia of Genes and Genomes
(KEGG) enrichment demonstrated major that a signaling pathway was involved. (D,E)
Cell-to-matrix adherence test showed that higher SPARC level regulated SKOV-3 and
ID8 cells adherence capability to extracellular matrix. *indicates p
SPARC level was significantly negatively related to B cell infiltration, with a
Rho = –0.306 and p = 8.8
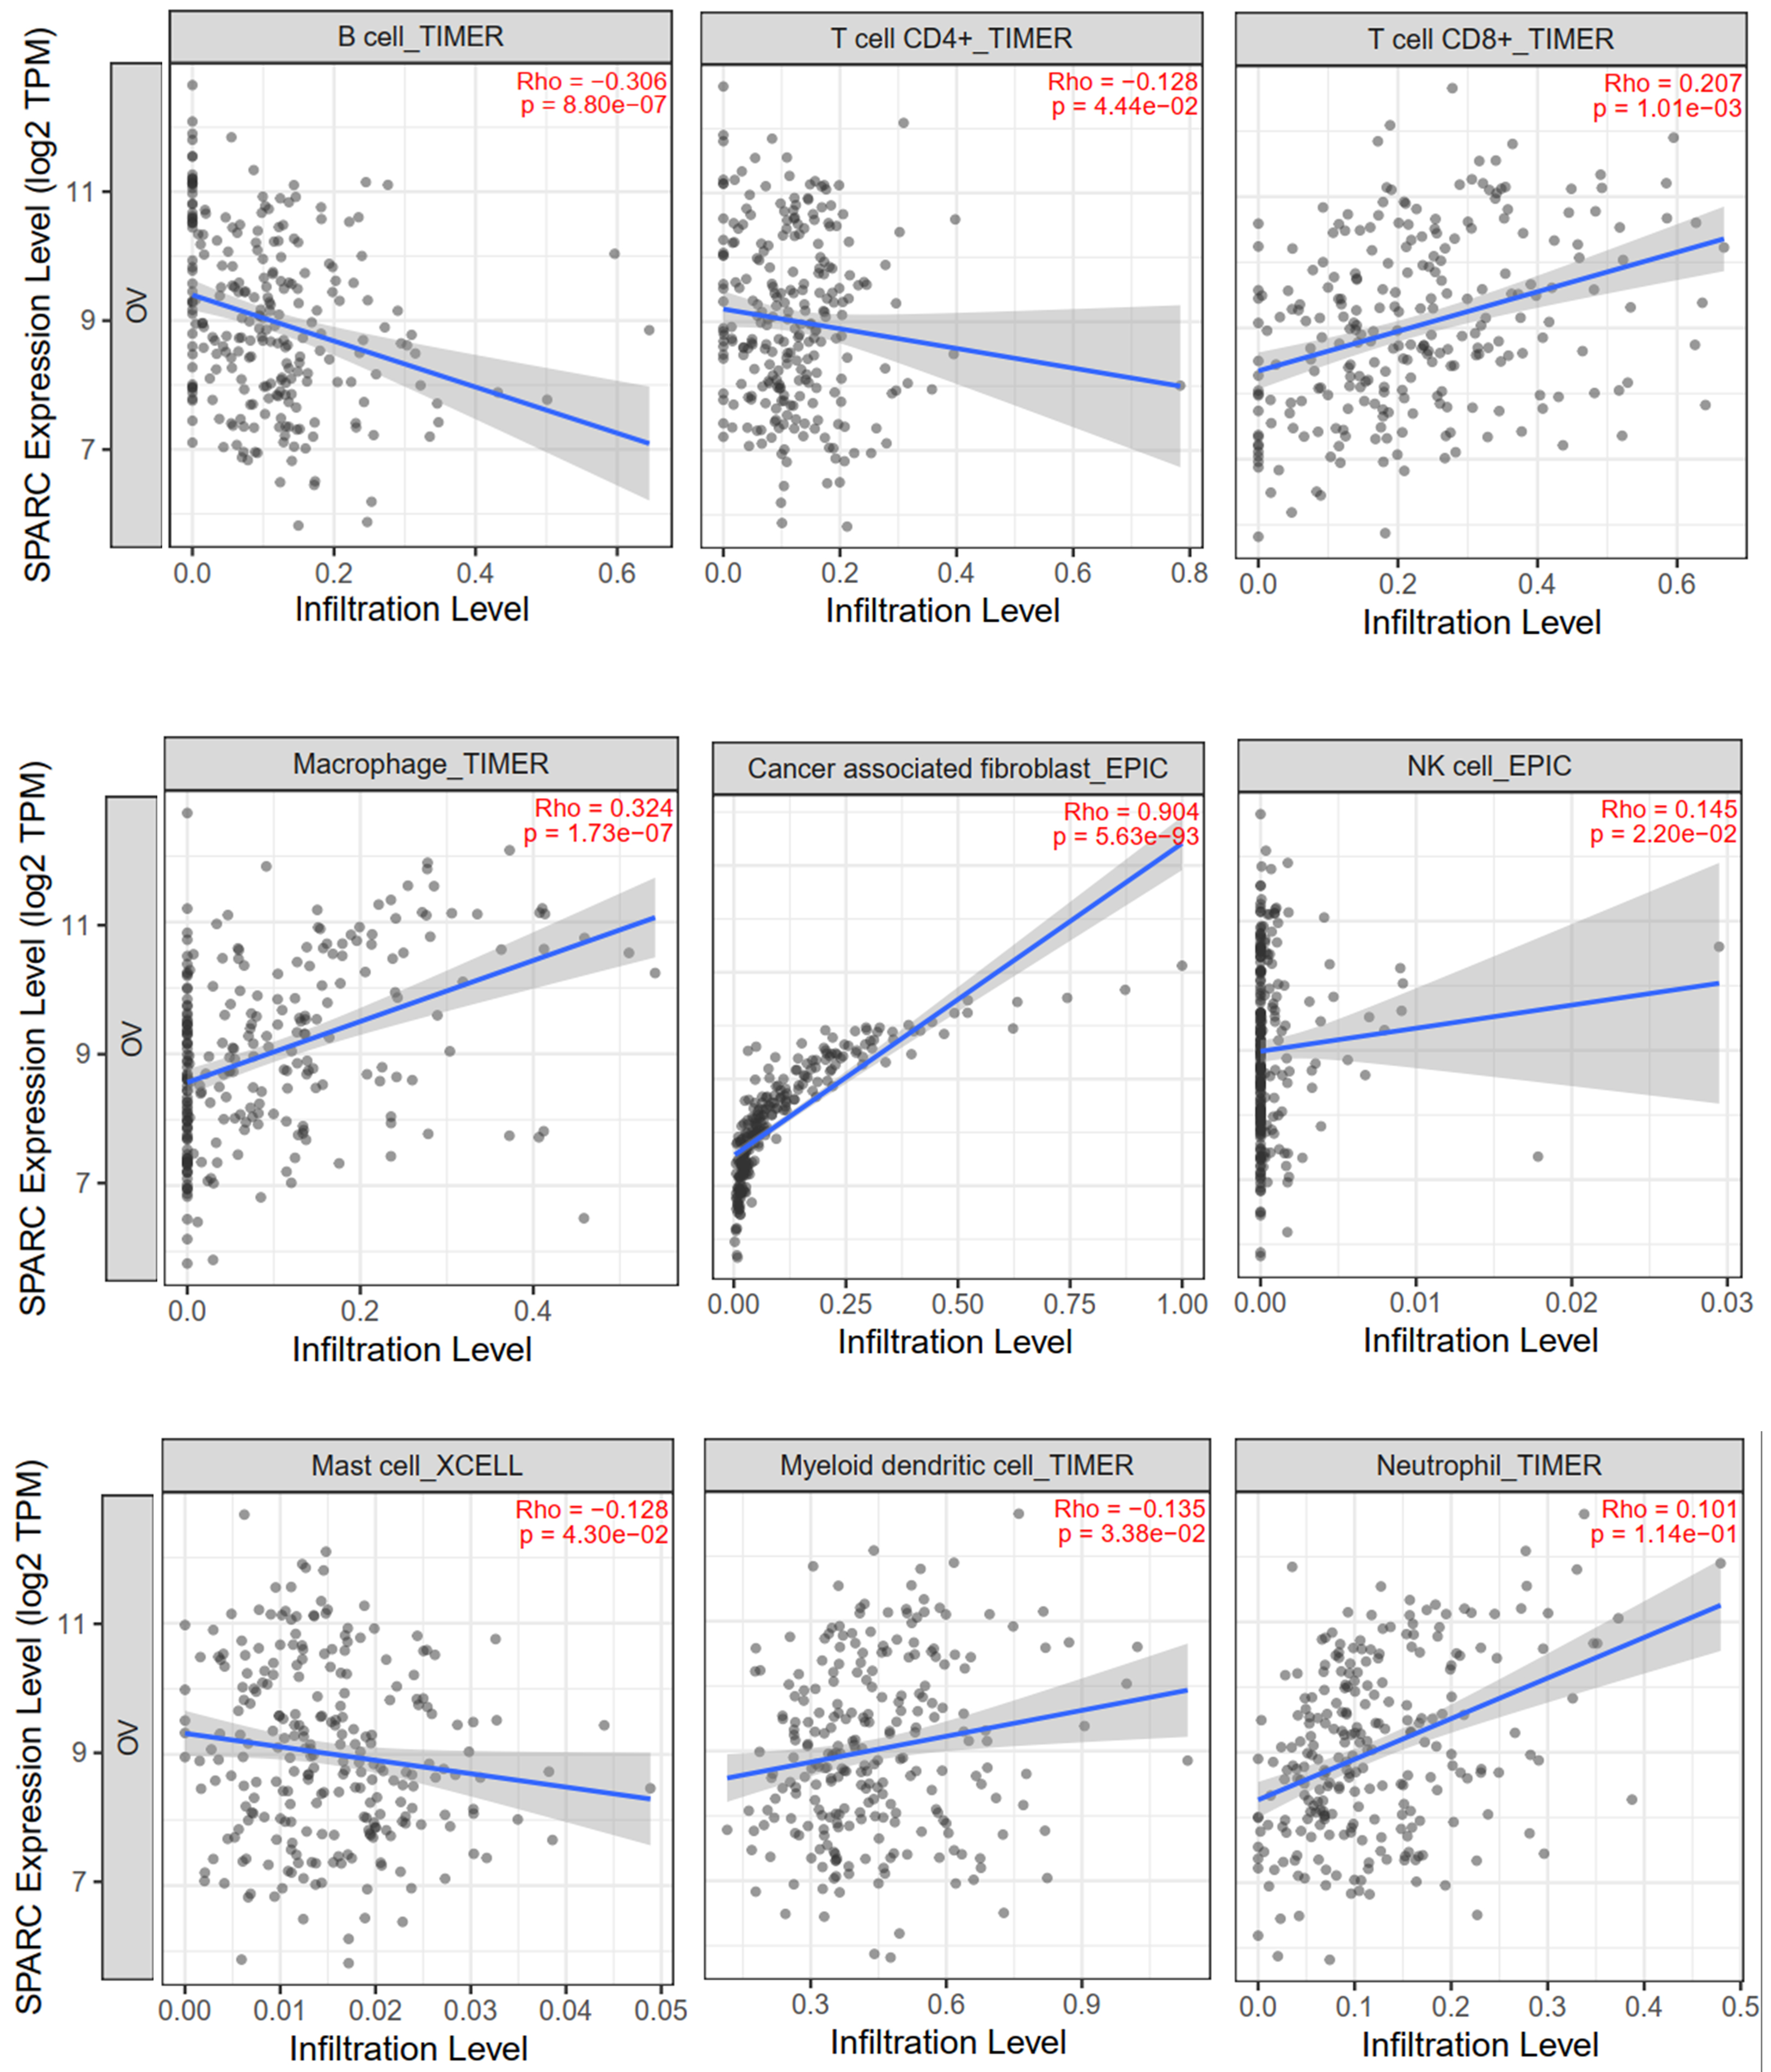 Fig. 6.
SPARC expression related correlation with specific immune cell type infiltration. Rho = Spearman’s correlation.
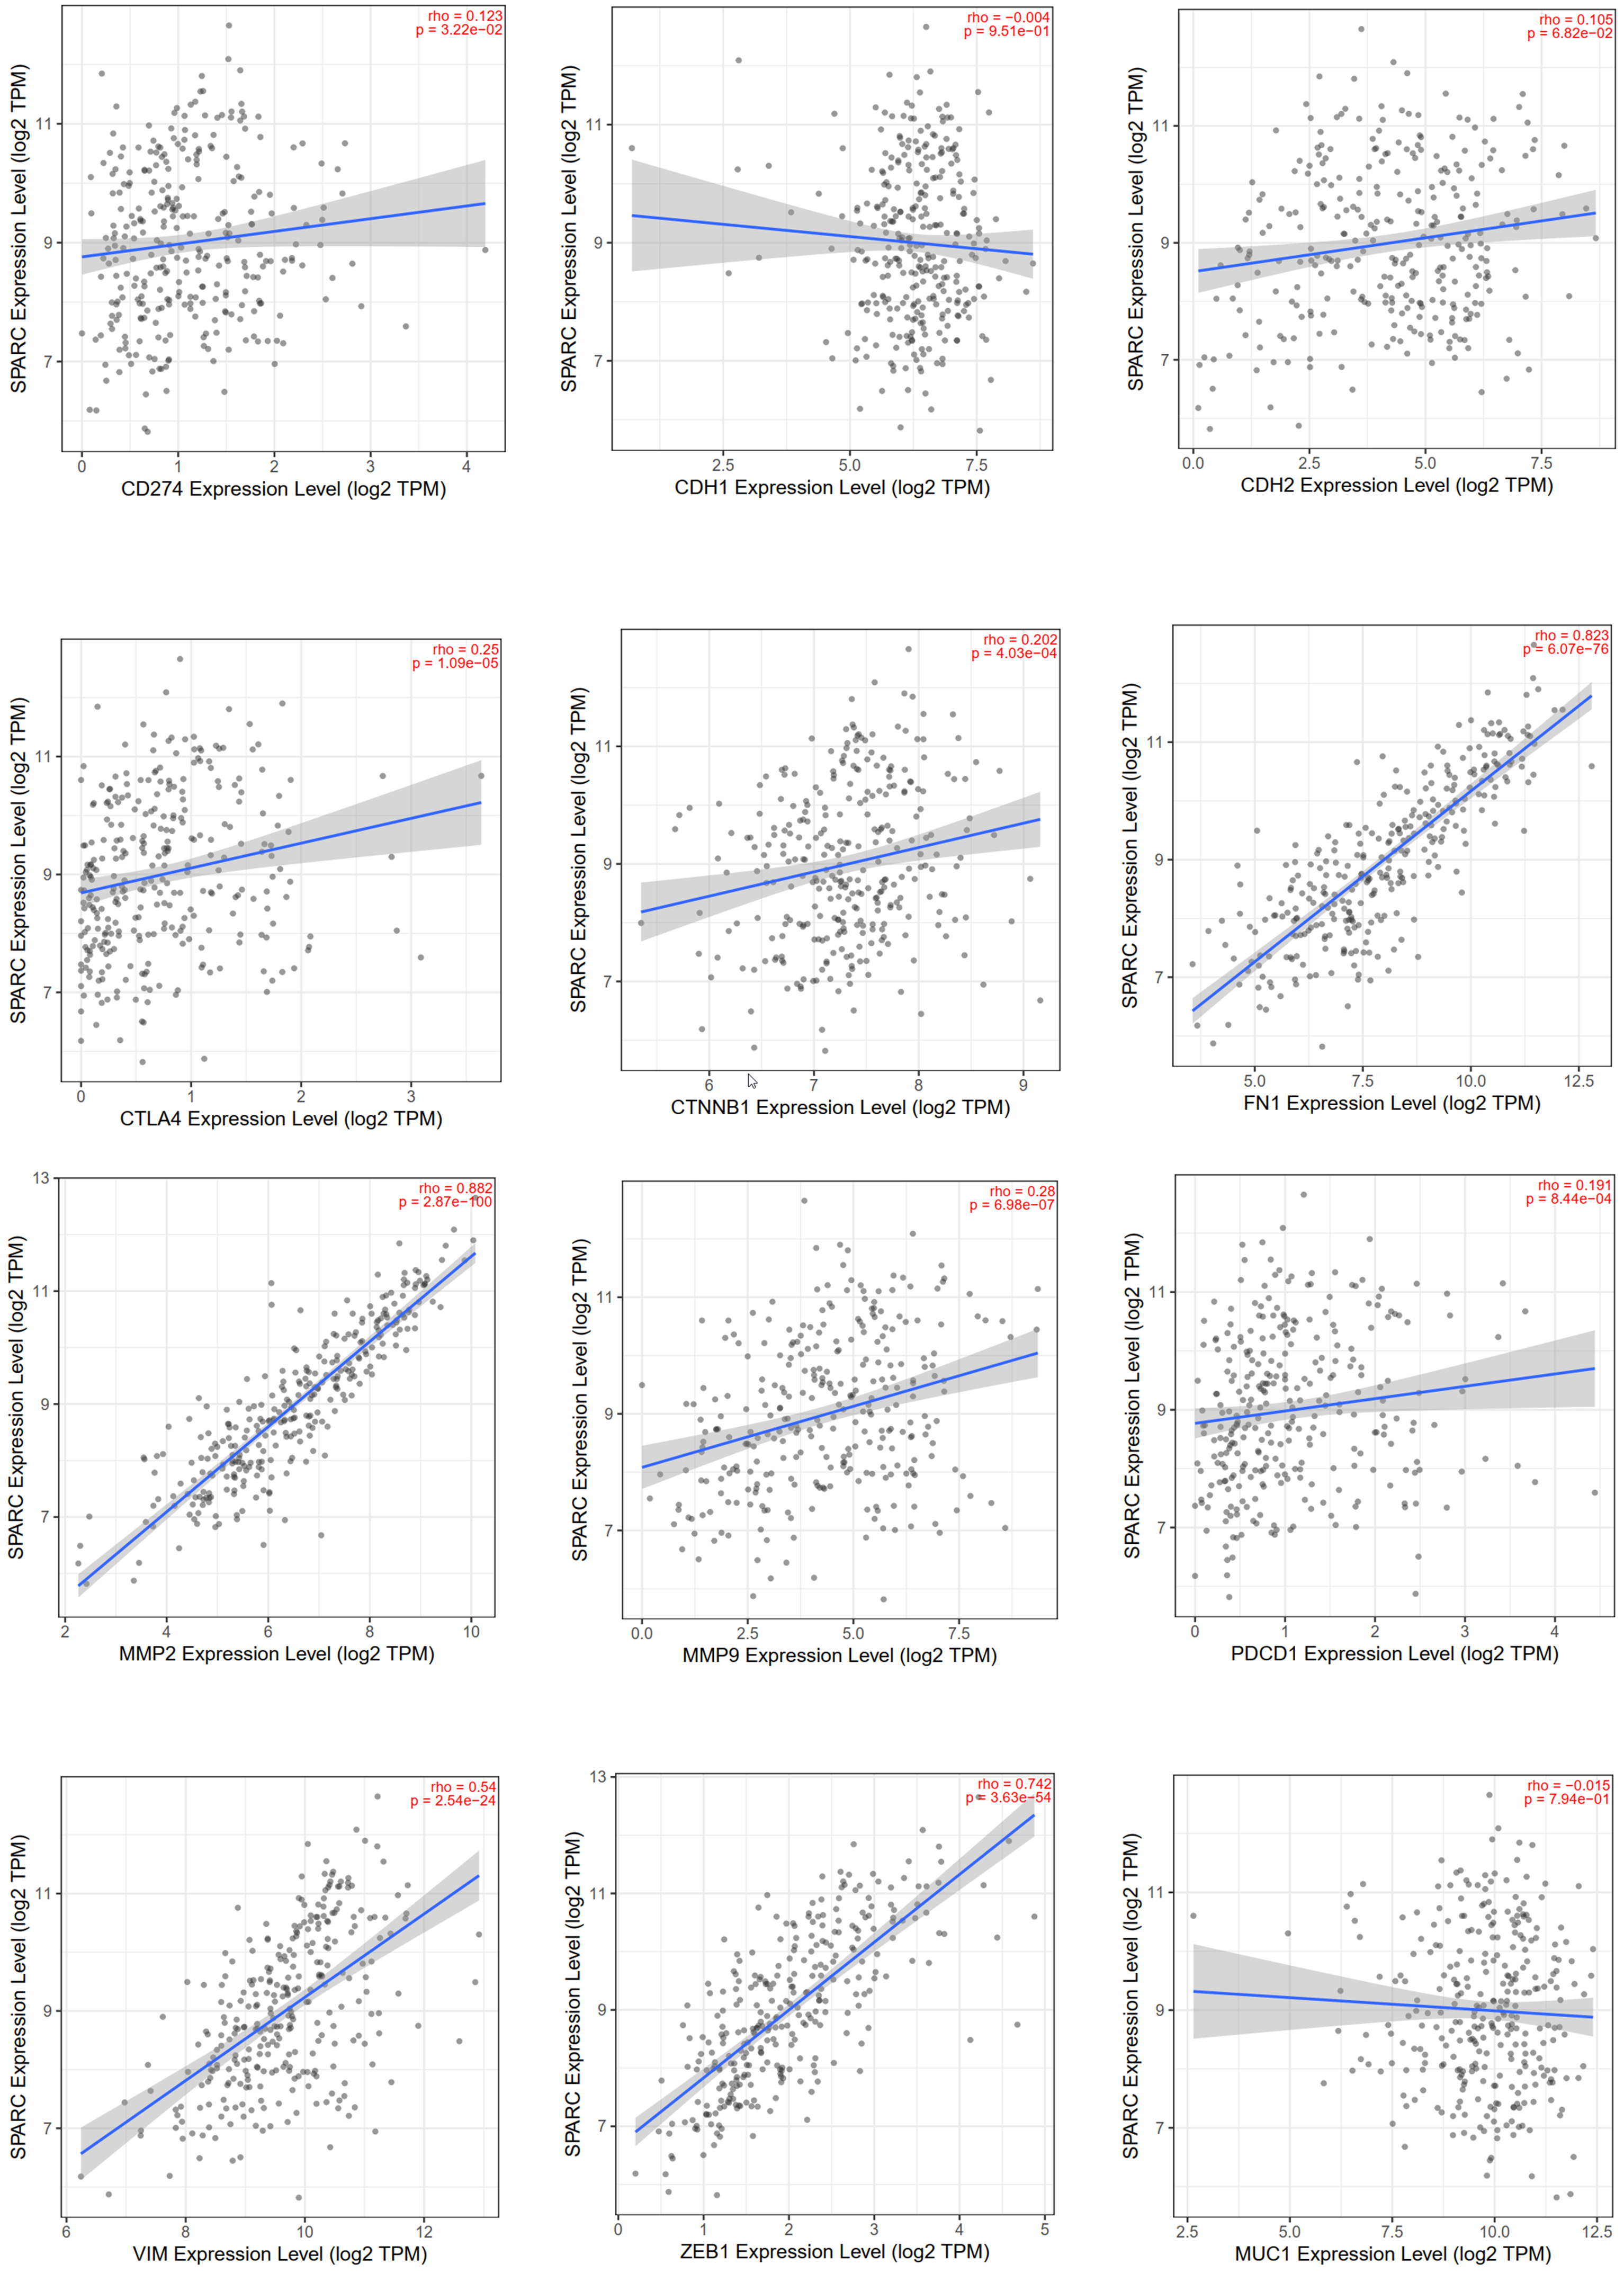 Fig. 7.
The correlation dot plot between SPARC level and epithelial-mesenchymal transition (EMT)/immune checkpoint signature markers. Rho = Spearman’s correlation.
Aside from the ABL- (Abelson Murine Leukemia Viral Oncogene Homolog) targeted drug AZD0530 (Fig. 8), all other drug effect predictions showed negative results, including paclitaxel (n = 26). This may have been due to the small number of patients.
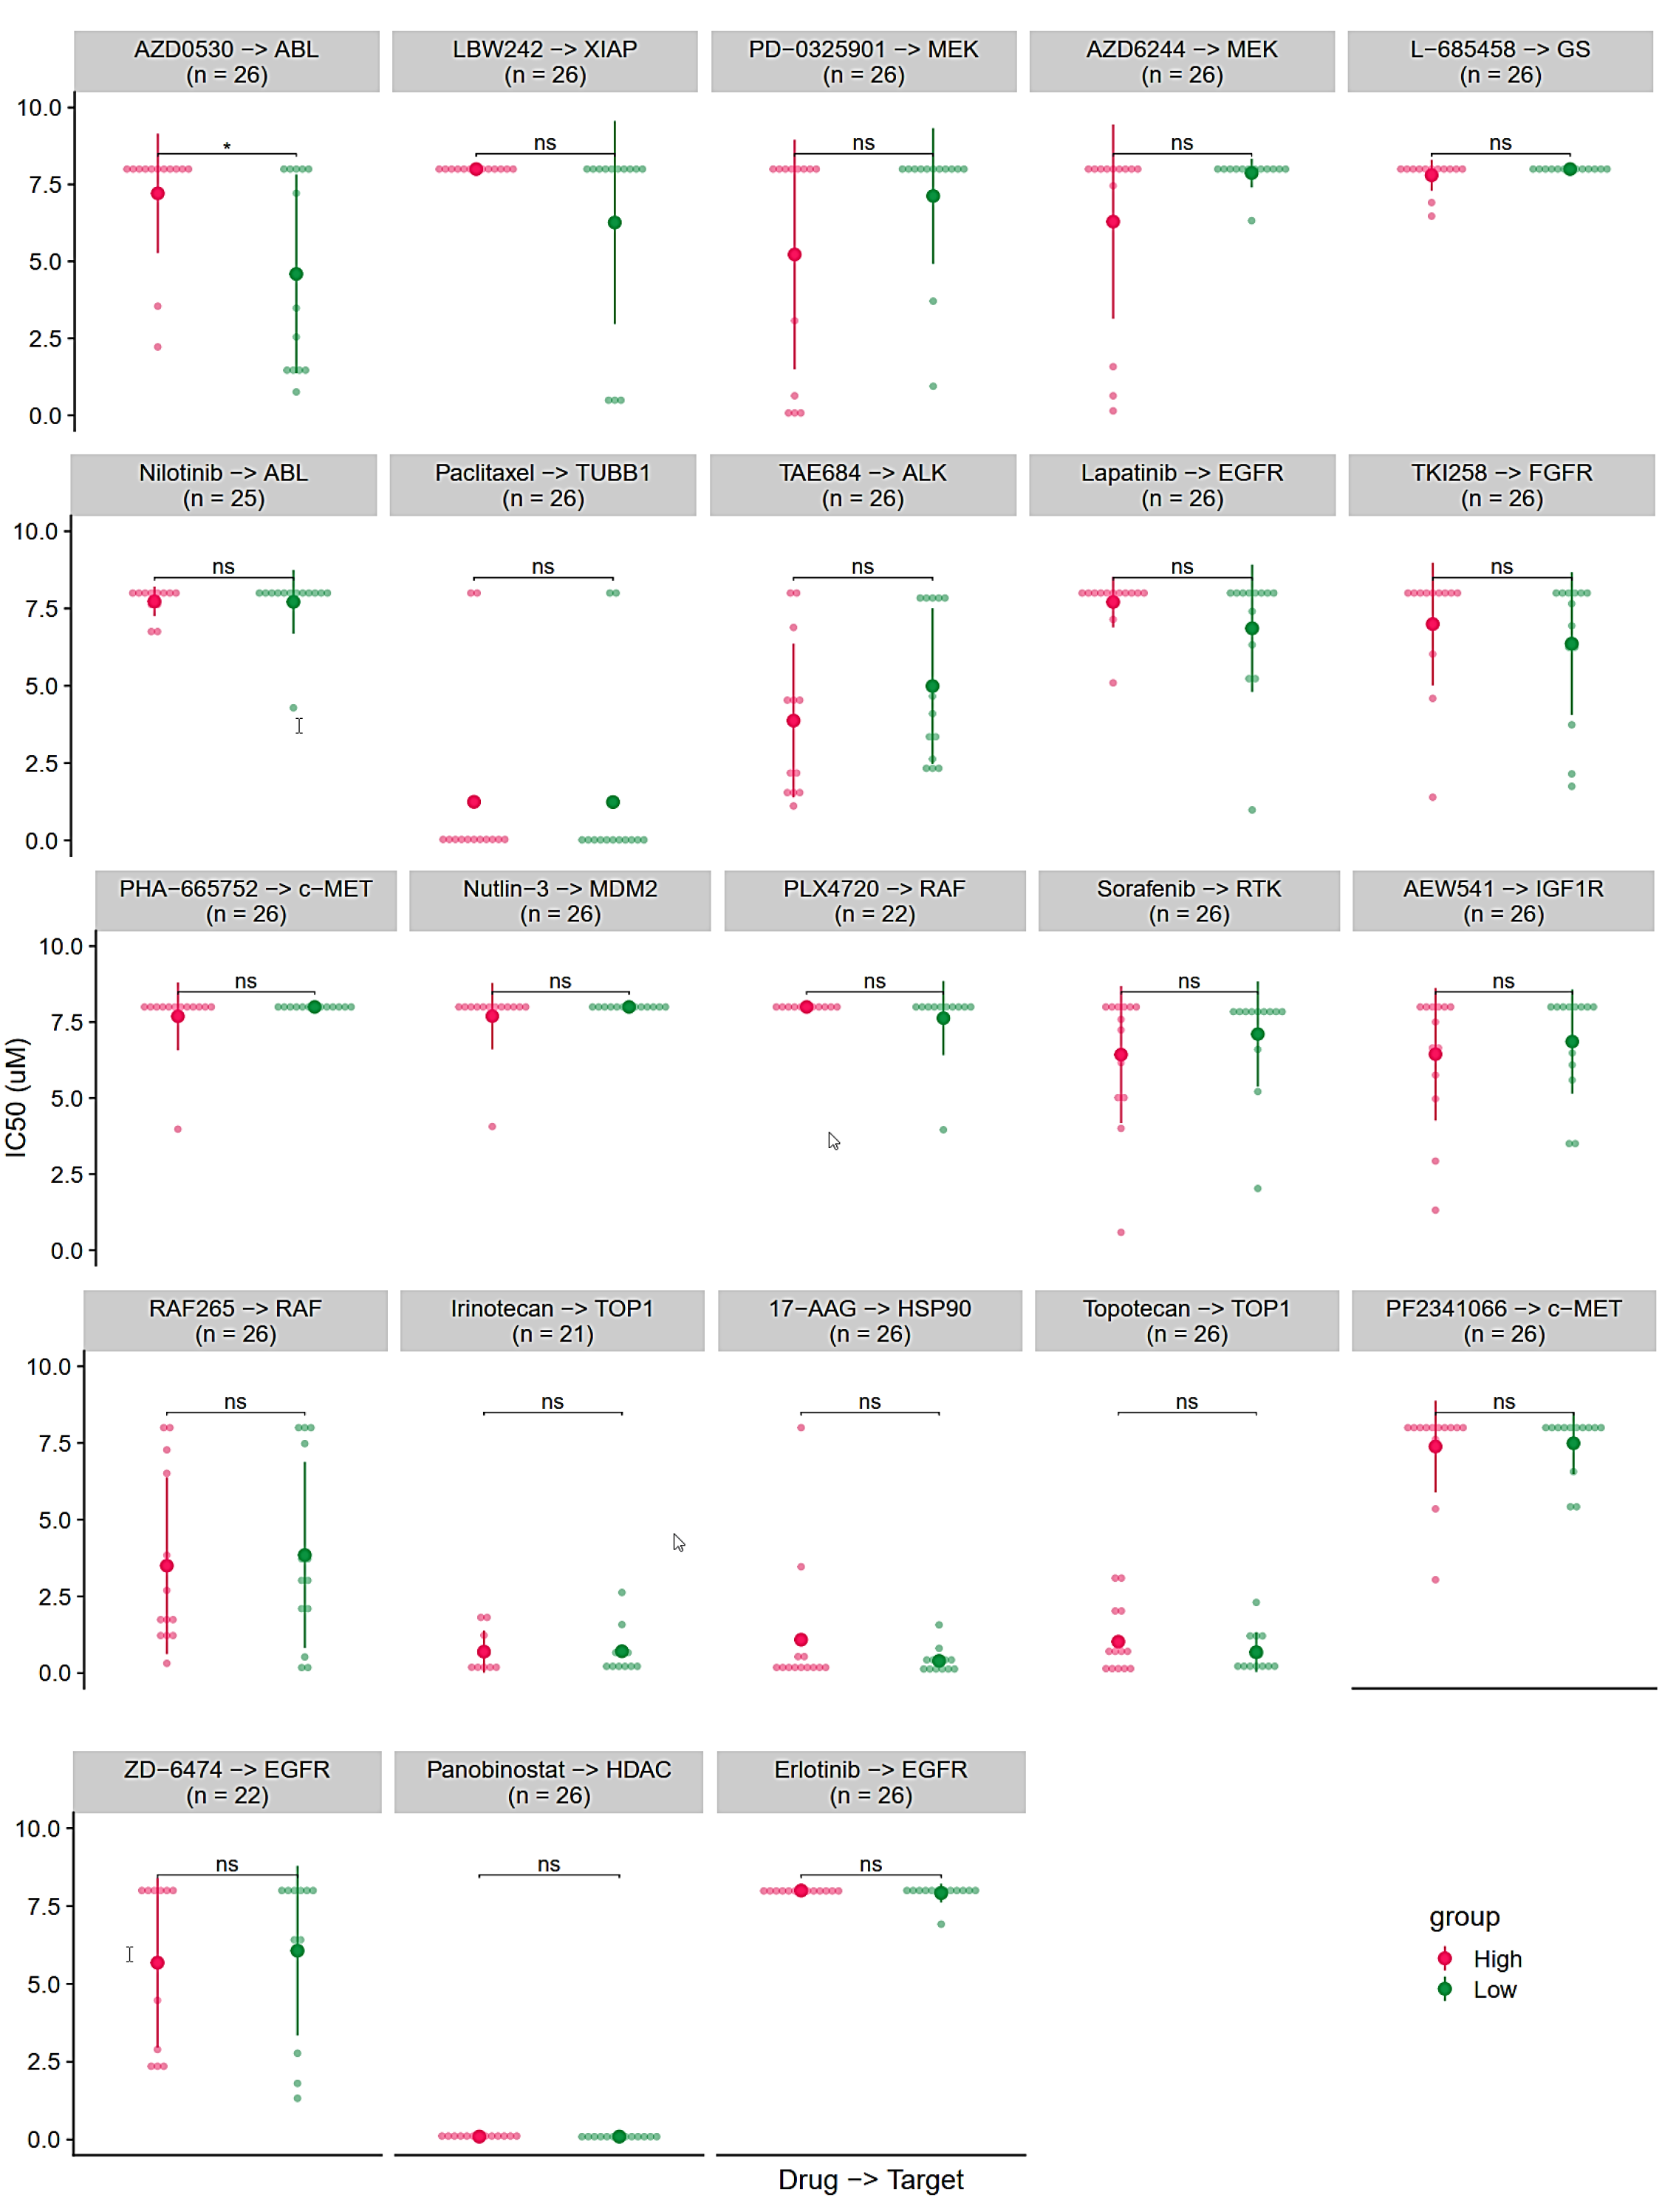 Fig. 8.
Target drugs response prediction result using SPARC expression
level. Red group: Higher expression than median. Green group: Lower expression
than median. *indicated p
Although cancer therapy has improved, ovarian cancer is still the leading cause of female carcinoma-associated death. So far, the major problem is the lack of effective molecular targets and biomarkers. SPARC is differentially expressed in cancers and adjacent tissues. It has been reported that SPARC expression was significantly elevated in liver, prostate, breast, and colorectal cancers. However, the reported role of SPARC is quite unclear based on contextualization [10]. Evidence has shown that increased SPARC could promote cancer cell proliferation and metastasis, and result in worse clinical outcomes for solid neoplasms including ovarian cancer [8, 13, 23].
Our in vitro study findings supported the notion that SPARC acts as an oncogene that functions primarily by increasing the adhesive ability of forming spheroids as well as increasing proliferation in ovarian cancer. SPARC significantly enhances ovarian cancer adhesion to the ECM molecules. It is noteworthy that SPARC promoter hypermethylated usually resulted a decreased of mRNA expression, but compared with normal tissue the mRNA expression of SPARC in tumor was detected increasing, which requires further investigation. There is evidence that expression of SPARC was related to cancer malignancy behaviors. It should be noted that the stromal cells that expressed high levels of SPARC also have inactivation of the SPARC promoter, in turn leading to a worse clinical outcome. Also, SPARC level is related to tumor microenvironment, including immune responses, but the results are quite controversial.
We performed comprehensive bioinformatic analysis based on sequencing data, as well as ROC analysis for drug-based survival prediction, to reveal the integrated role of SPARC in ovarian cancer for prognostic value, drug treatment response, and immune characterized modulating function. Our findings suggest that high SPARC expression level indicates poor clinical outcomes and higher malignancy. We found that SPARC expression level could be used independently as a prognostic marker for overall survival and progression-free survival predictions, which supported previous reports [18]. Additionally, higher expression of SPARC generally could be considered as a poor drug-response indicator for chemical therapy. However, no specific target drugs could be useful for using SPARC as an evaluation drug other than saracatinib (AZD0530).
Our present study has some limitations. In view of the insufficient pathological data, we did not analyze the immunohistochemistry of SPARC expression in the paraffin-embedded samples of ovarian cancer patients. We also did not validate the carcinogenic effects of SPARC in an animal model due to limited time and funds. In future work, we intend to further verify the involvement of SPARC in the PI3K-AKT and MAPK signaling pathways in ovarian cancer cells in vitro, run supplement animal experiments, and further validate pathological specimens.
In general, SPARC, in both our results and in previous reports, should be noted as a novel oncogene prompting cancer cell EMT, and frequently causing metastasis and poor clinical outcomes [9, 13, 15]. In relation to the tumor microenvironment, SPARC enhanced cancer adhesive capability by improving spheroid formation and attachment to the extracellular matrix. Those phenotypes may be supported by PI3K-AKT and MAPK signaling pathways. In addition, the role of SPARC in interaction with immune cell infiltration is still not clear. Therefore, the biological role of SPARC in ovarian cancer merits further in-depth investigation.
SPARC promotes ovarian cancer progression via proliferation, migration, invasiveness, clonality, and stemness, which are related to PI3K-AKT and MAPK signaling pathways. High expression of SPARC in ovarian cancer patients can be used as a marker of poor prognosis and poor drug response. High SPARC expression is positively correlated with immune signatures; the mechanism for this is not clear and requires further investigation.
The datasets used and/or analyzed during the current study are available from the corresponding author on reasonable request.
XG performed literature search, drafted the manuscript and figures; and HT performed the bioinformatic analysis, drafted the manuscript and figures. XL performed the in vitro experiments and drafted the manuscript. PL and JL helped in analysis and interpretation of data and revised the manuscript. SY designed concept of the study and revised the whole manuscript. All authors have read and agreed to the published version of the manuscript.
Not applicable.
We thank all who help us in writing the manuscript.
This study was supported by Research Project of China Primary Health Care Foundation.
The authors declare no conflict of interest.
Publisher’s Note: IMR Press stays neutral with regard to jurisdictional claims in published maps and institutional affiliations.