
- Academic Editor
Background: The valorization of orange peel waste (OPW) through the
extraction of bioactive compounds is a clear example of the circular economy. OPW
contains many value-added compounds, among which bioactive phenolic compounds
(flavonoids and phenolic acids) could be extracted and used for industrial
applications, such as pharmaceuticals or cosmetics. Methods: In this
work, the extraction of phenolic compounds from orange peel was carried out by
conventional (orbital shaker) and assisted (ultrasound and microwave) extraction
techniques using deionized water, 80% (v/v) ethanol in water, and ethyl acetate
as solvents. The effect of temperature, extraction time, and type of technique
was evaluated and discussed following spectrophotometric (total phenolic content
and total flavonoid content) and high-performance liquid chromatography (HPLC)
analyses of the extracts. Results: The most effective extraction in
terms of efficiency was achieved by microwave-assisted extraction using 80%
(v/v) ethanol in water as the extraction solvent, at 373 K for 6 min, which
obtained 7.2
Annually, more than 1.6 billion tons of food waste are produced worldwide [1]. The valorization of food waste through sustainable technologies to produce value-added bioproducts is considered a potential alternative, which can be implemented to address the problems related to waste management within the framework of the circular bioeconomy [2]. In particular, the citrus industry greatly contributes to food waste, with more than 140 million tons of citrus fruits produced annually (FAO-Citrus Fruit Statistics, 2020), generating large amounts of by-products during their processing. The most abundant citrus fruit is orange (Citrus Sinensis), with an annual production of 76 million tons, of which approximately 30% is used for juice processing, leading to up to 20 million tons of solid residue [3]. Traditionally, incineration, landfill, ensiling, or animal feeding have been used for citrus waste management, yet these conventional techniques require high costs and energy and can cause serious health problems and environmental impacts [2, 4, 5]. Therefore, the production of bioproducts from such renewable waste is being explored as a potential valorization strategy to reduce the environmental impact and cost of citrus waste management. Moreover, using the citrus waste generated during processing could help to increase profits in the orange industry [5].
Orange peel waste (OPW) contains a wide variety of value-added compounds, including fermentable sugars, organic acids, pectin, flavonoids, polyphenols, some pigments, and essential oils, such as D-limonene, among others [6, 7]. In this regard, OPW can be used to produce pectin, flavonoids, natural colorants, nutraceutical products, and antioxidant phenolic compounds. The latter compounds (more specifically, flavonoids and phenolic acids) could be used to prevent food oxidation; in addition, their consumption has been associated with multiple health benefits due to their nutraceutical and medical properties [2, 8, 9, 10].
In particular, flavonoids are natural compounds with a stable phenolic structure, which provide strong antioxidant and radical scavenging activities [11] as well as significant biological properties, such as protection against ultraviolet (UV) radiation [12]. Flavonoids are among the main antioxidant molecules and possess a wide range of properties that make them interesting in fighting various diseases, acting as chemotherapeutic, chemo-preventive, and antiangiogenic agents [13]. According to their structure, flavonoids can be classified as flavones (e.g., apigenin, luteolin, rutin), flavanones (e.g., hesperidin, naringin, naringenin), flavonols (e.g., quercetin, kaempferol), isoflavones, and catechins [11, 12, 14, 15]. The main flavonoids present in orange peels are hesperidin, naringin, neohesperidin, narirutin, rutin, and quercetin [16, 17]. Among them, hesperidin is the most abundant flavonoid [12, 18]. Hesperidin is of great interest as it is effectively used as a supplement with pharmaceutical effects because of its significant potential as a therapeutic agent for a wide range of diseases and disorders [19]. In addition, several phenolic acids, such as caffeic acid, chlorogenic acid, trans-ferulic acid, cinnamic acid, and p-coumaric acid, are widely reported as orange peel constituents [9, 20]. Phenolic acids are substances that contain a phenolic ring together with a single carboxylic acid functional group and have several biological functions, such as nutrient uptake, enzyme activity of protein synthesis, or photosynthesis [13]. The growing interest in phenolic acids is attributed to their protective role against oxidative damage diseases, such as coronary heart disease, stroke, and cancers [13]. The levels of these phenolic acids in fruit are higher in the peel than in the pulp, particularly for the hydroxycinnamic acids [8].
Conventional solvent extraction has been widely used to recover the aforementioned bioproducts from natural matrices [21]. However, this traditional technique has several drawbacks, such as the need for long extraction times, which leads to low extraction yields, high energy consumption, safety hazards, and environmental risk, in addition to low-quality extracts due to oxidative degradation [21, 22]. In the development of more environmentally friendly and efficient extraction methods, new technologies such as supercritical fluid extraction, pressurized liquid extraction, ultrasound-assisted extraction, and microwave-assisted extraction have been explored as suitable alternatives to conventional technologies [23]. On the one hand, ultrasound-assisted extraction (UAE) has been shown to decrease the extraction time and increase the efficiency of the process [24]; this improvement is attributed to cavitation bubbles that cause a rupture in the cell membrane, thereby allowing a higher diffusion rate of the solvent into the matrix, improving mass transfer, and releasing bioactive compounds [25, 26, 27]. In addition, previous studies have proven that the use of ultrasound as an assisted extraction technology enhances the antioxidant activity of the extract [28, 29]. Alternatively, microwave-assisted extraction (MAE) has been shown to reduce the required solvent volume and extraction time, while obtaining a high extraction yield [30]. During MAE, the substances are heated up in a targeted and selective way with practically no heat lost [31]. This heat is based on the direct effect of microwaves on the molecules by ionic conduction and dipole moment [32]. In a plant matrix, this phenomenon causes a high pressure inside the cell wall, causing the cell to rupture, which results in the release of solutes from within the matrix [33]. A higher extraction yield is also achieved by the increase in temperature, which favors a faster penetration of the solvent into the cell wall of the plant matrix [34].
Traditionally, bioproducts have been extracted with organic solvents. In this
work, the solvents selected were deionized water (H
This work aimed to evaluate and compare conventional and assisted extraction techniques (orbital shaker, ultrasound bath, ultrasound probe, and microwaves) in the extraction of phenolic compounds from OPW, especially flavonoids and phenolic acids. For this purpose, different extraction conditions were tested as a function of the extraction solvent, the extraction time, or the working temperature. Water, 80% EtOH, and ethyl acetate were used as solvents to evaluate their role in the phenolic extraction yields and selectivity. The total phenolic content (TPC) and total flavonoid content (TFC) of the extracts were measured by spectrophotometric methods. Afterward, the phenolic profiles of the extracts were quantified by high-performance liquid chromatography with diode array detection (HPLC-DAD). In addition to the experimental screening, the energy consumption in the best conditions of each extraction technique was evaluated. The systematic evaluation of the different extraction techniques contributes to the efficient design of the methodology used for the valorization of the naturally occurring phenolic compounds found in OPW, not only in terms of quantification but also for energy efficiency.
About 3 kg of fresh oranges, Citrus Sinensis, of Navel Lane Late variation were purchased from a local store in Madrid (Spain). The oranges were squeezed, and the peels were dried in an oven at 313 K for 24 h, then, ground in a mill until a homogenous powder was obtained. The resultant powder, labeled as orange peel waste (OPW), was stored in a freezer, and maintained at 269 K until experiments were carried out. A schematic diagram of the preparation of the OPW can be observed in Fig. 1.
 Fig. 1.
Representation of the orange peel waste (OPW) preparation.
The solvents used in this work were deionized water, ethanol absolute (CAS
Number: 64-17-5; purity
The Folin–Ciocalteu phenol reagent (FC) (2N) (CAS number: 12111-13-6) and
sodium carbonate anhydrous (CAS Number: 497-19-8; purity
The chemicals used as standards for HPLC analysis were hesperidin (CAS Number:
520-26-3; purity
All the extractions were carried out by adding 0.5 g of OPW to 5 mL of the
solvent (i.e., biomass:solvent ratio = 1:10, in g/mL). In this work, deionized
water (H
Extraction conditions for each technique (orbital shaker, ultrasound, and microwave) were evaluated in terms of extraction time and temperature. The selected values for each variable were based on preliminary assays and the operative limits of each instrument.
For orbital shaker extraction (OSE), an orbital shaker (Labnet VORTEMP 1550
orbital shaker) with controlled temperature and an accuracy of
For ultrasound bath-assisted extraction (UBAE), a bath (Elmasonic S 15 H, Elma) was used with an ultrasound frequency of 37 kHz, power of 35 W, and a controlled temperature. In this case, the extractions were carried out at 333 K for 30 min.
Ultrasound probe-assisted extraction (UPAE) was evaluated using a portable ultrasonic homogenizer UP200Ht (200 W, 26 kHz) (Hielscher Ultrasound technology). The extraction process was carried out using a power of 10 W (based on preliminary tests) and various extraction times of 1.5, 3, and 6 min. Although temperature could not be controlled in this case, it was measured at the end of each experiment.
A microwave reactor (Monowave 400, Anton Paar) equipped with an infrared temperature sensor for temperature control was used in microwave-assisted extractions (MAEs). For the microwave extraction, a hermetically closed vessel was used, with a fixed stirring rate of 1000 rpm. Samples were heated at 333 and 373 K for 1.5, 3, or 6 min.
After all extraction assays were performed, the obtained samples were centrifuged with Unicen 21 Centrifuge (Ortoalresa, Spain) for 10 min at 4200 rpm, to promote phase separation. The extracts were analyzed using different analytical techniques, which are described in the following section.
Total phenolic content (TPC) was determined after extraction by the Folin–Ciocalteu spectrophotometric quantification method, adapted from Cañadas et al. [37]. Briefly, 0.1 mL of the extract and 0.1 mL of the Folin–Ciocalteu reagent were added to a glass vial and thoroughly mixed. After incubating for 3 min in the absence of light, 2 mL of 2% (w/v) sodium carbonate aqueous solution was added to the mix and incubated in the dark for another 30 min. Then, the absorbance of the resulting solution was measured at 765 nm by a JASCO V-730 UV–Vis spectrophotometer (JASCO, Spain). Spectrophotometric analyses were carried out in triplicate using the corresponding tested solvent as a blank.
The TPC values, expressed as mg of gallic acid equivalent (GAE) per g of OPW, were obtained from Eqn. 1:
where [GAE] is the gallic acid equivalent present in the extract expressed as mg
of gallic acid per L, calculated from the calibration curve previously obtained
with standard solutions of gallic acid (in mg/L); V solvent is the amount of
solvent used during the extraction, expressed in L; m OPW is the mass of the
sample used, expressed in g. The results were expressed as TPC (mg GAE/g OPW)
Total flavonoid contents were determined following the procedure reported by
Pękalet al. [38], with slight modifications. In a glass vial, 1 mL
of deionized water was mixed with 0.45 mL of the solvent extract and 0.15 mL of
5% (w/v) of NaNO
The results, expressed as mg of quercetin equivalent per g of OPW, were calculated using Eqn. 2:
where [QE] is the quercetin equivalent present in the extract expressed as mg of
quercetin/L, calculated with the calibration curve measured using standard
solutions of quercetin (representative flavonoid); V solvent is the amount of
solvent used during the extraction expressed in L; m OPW is the mass of the
sample used, expressed in g. The results were expressed as TFC (mg QE/g OPW)
Liquid chromatographical analysis of the most common phenolic compounds found in
OPW (hesperidin, naringin, catechin, rutin, quercetin, gallic acid, caffeic acid,
p-coumaric acid, and trans-ferulic acid [8, 9, 16, 17, 18]) was
performed in a JASCO 4000 Series HPLC system (JASCO, Spain) equipped with a
MD-4015 photo diode array (PDA) detector, using a Fortis C18 column (250 mm
Detection and identification of phenolic compounds (PC) were performed using a PDA detector at the following wavelengths: 271 nm for the detection of gallic acid; 282 nm for the detection of catechin, naringin, and hesperidin; 323 nm for the detection of caffeic acid, p-coumaric acid, and trans-ferulic acid; 370 nm for the detection of rutin and quercetin. The HPLC chromatogram of the target phenolic compounds is presented in Supplementary Fig. 1 (available as Supporting Information).
Quantifying the extraction of the target compounds was carried out from the integration of the peak area and using the calibration curves prepared with standard solutions for each compound. The results, expressed as mg of target compound per g of OPW, were obtained from Eqn. 3:
where [PC] is the concentration of the phenolic compound (in mg PC/mL), measured
by HPLC, and calculated by the calibration curve; V of the solvent is the amount
of solvent used during the extraction, expressed in L; m OPW is the amount of
sample used expressed in g. In all cases, HPLC analyses were performed in
triplicate, and the results were expressed as mg PC/g OPW
First, the compounds of interest were extracted from OPW and evaluated using the orbital shaker to study the effect of temperature on the process. The experiments were performed at 303 and 333 K, and the extraction time was maintained at 60 min. In this case, temperatures higher than 333 K were not tested to avoid possible thermal degradation of phenolic compounds since the extraction time used is quite prolonged. The results obtained from the TPC, TFC, and HPLC analyses of the extracts, for the three solvents evaluated, are shown in Fig. 2, and reported in Supplementary Table 1, available as Supporting Information.
 Fig. 2.
Effect of temperature on the extraction from OPW using the
orbital shaker. (A) Total phenolic content (TPC), total flavonoid content (TFC),
and (B) high-performance liquid chromatography (HPLC) quantification of the
flavonoids and phenolic acids present in the extract. Extraction conditions:
biomass:solvent ratio = 1:10; t
As can be seen in Fig. 2A, in general, TPC and TFC increase alongside temperature, except for water, for which the TFC values are quite similar at both temperatures. These results suggest that a higher temperature enhances the extraction of phenolic compounds from OPW using the orbital shaker. The positive effect of the temperature on the extraction, specifically using 80% EtOH and ethyl acetate as solvents, could be explained due to the reduction in their surface tension and viscosity with temperature, which favors solubility and increases the diffusion coefficients of phenolic compounds [39].
Comparing Fig. 2A,B, it is also possible to observe that the TFC and HPLC analyses show a similar trend, which can be related to the fact that hesperidin (a flavonoid) was the major compound identified in the extracts by HPLC, as can also be seen in Supplementary Table 1, available as Supporting Information. Nevertheless, it is important to remark that only eight phenolic compounds were identified by HPLC analysis (quercetin was not found in any analysis), and therefore, any discrepancies between TFC and HPLC may be due to the extraction of other flavonoids not identified by HPLC.
The increase in TPC values by temperature for water, which does not agree with the values obtained by the TFC and HPLC analyses, could be attributed to the low selectivity of this solvent; in particular, water could be promoting the extraction of other compounds from OPW, such as sugar, short-chain carbohydrates, and/or ascorbic acid [40], which are known to interfere with the Folin–Ciocalteu method due to their reducing capacities [41, 42]. The low selectivity of water was confirmed by HPLC analysis since the presence of gallic acid, (+)-catechin hydrate, and trans-ferulic acid in water extract is remarkable, which does not happen for the other two solvents. The percentage of hesperidin in the aqueous extract represents about 84% of the phenolic compounds identified, which is lower than with 80% EtOH (about 99%) or in ethyl acetate, where only hesperidin was identified (see Supplementary Table 1).
Fig. 2 illustrates that the best extraction efficiency was achieved when using
80% EtOH at 333 K. Specifically, TPC increased from 3.9 to 6.8 mg GAE/g OPW, TFC
increased from 8.8 to 12.5 mg QE/g OPW, and the total phenolic compounds
quantified by HPLC increased from 5 to 29 mg PC/g OPW following the increases in
temperature. The effectiveness of the ethanolic mixture agrees with the results
published by Li et al. [36], who compared the ability of pure
H
In contrast, lower extraction values were obtained when using ethyl acetate, which also increased as the temperature increased (TPC increased from 0.4 to 1.1 mg GAE/g OPW, TFC increased from 2.5 to 4.1 mg QE/g OPW, and total phenolic compounds quantified with HPLC increased from 0.1 to 0.3 mg PC/g OPW). For this solvent, it is important to remark that only hesperidin was identified in the HPLC chromatograms, thereby revealing that the presence of flavonoids and phenolic acids in this extract is limited in comparison with the other studied solvents (8.7–9.4 and 5.3–27.8 mg PC/g OPW for water and 80% EtOH, respectively). These results agree with those published by Safdar et al. [43], who compared 80% EtOH and pure ethyl acetate in the extraction of phenolic compounds from Citrus reticulate L. (25 mg GAE/g with 80% EtOH and 9 mg GAE/g with ethyl acetate). This could be explained due to the hydrophobic character of ethyl acetate, whose capacity to be introduced into the cell wall is lower than the hydrophilic solvents.
Taking all these results into account, the best temperature for stabilization was 333 K and then the effect of extraction time at this temperature was also evaluated using three different times (30, 60, and 90 min). The results for TPC, TFC, and HPLC analysis are shown in Fig. 3 and Supplementary Table 1 (available as Supporting Information).
 Fig. 3.
Effect of time on the extraction from OPW using the orbital
shaker. (A) Total phenolic content (TPC) and total flavonoids content (TFC), and
(B) HPLC quantification of the flavonoids and phenolic acids present in the
extract. Extraction conditions: biomass:solvent ratio = 1:10; T = 333 K;
t
The obtained results show little or no influence of the stirring time on the extraction of phenolic compounds, suggesting that 30 min should be sufficient to achieve equilibrium when these solvents are used. A similar conclusion was also obtained by Vergara-Salinas et al. [44], who found no influence by extraction time, between 5 and 30 min when extracting phenolic compounds from thyme samples using pressured hot water as the solvent. Thus, the choice of a longer time can lead to no significant effect on the extraction efficiency, as suggested by Silva et al. [45]. The decreasing extraction efficiency for phenolic compounds at 90 min using water and 80% EtOH could be attributed to the oxidation of some phenolic compounds by extended exposure to oxidizing factors, such as oxygen and light [46, 47, 48].
The results obtained in this part of the study agree with those trends plotted in Fig. 2, confirming that 80% EtOH is the solvent with the highest extraction capacity (27.8–35.2 mg PC/g OPW) followed by deionized water (8.8–9.5 mg PC/g OPW), and ethyl acetate (0.3–0.4 mg PC/g OPW) from the HPLC results. Then, since longer extraction times do not promote further recovery of phenolic compounds from OPW by OSE, it could be concluded that the best operating conditions for this technique are 333 K and 30 min, thereby avoiding the possible degradation of the phenolic compounds and saving costs by reducing extraction time. Since the operational power of the orbital shaker is 515 W, the energy consumption for the optimal conditions (333 K and 30 min) is 927 kJ.
Extractions by an ultrasonic bath (USBE) were performed using the best conditions established for OSE (333 K and 30 min). The obtained results are reported in Supplementary Table 2, available as Supporting Information, and a comparison between the USBE and OSE results is also plotted in Fig. 4. The best extraction efficiency was also achieved using the 80% EtOH mixture as the solvent but the use of this ultrasonic bath did not improve the extraction process. In fact, the TPC and TFC values were lower for USBE than OSE, while HPLC analysis revealed a small increase in phenolic compounds in water (9.3 to 10.7 mg PC/g OPW) and ethyl acetate (3 to 4 mg PC/g OPW) extracts, although also a significant decrease in phenolic compounds in the 80% EtOH extract (35.2 to 17.4 mg PC/g OPW). In all cases, a higher percentage of hesperidin compared to the other seven phenolic compounds was detected.
 Fig. 4.
Extraction from OPW by orbital shaker (OSE) and an ultrasonic
bath (USBE). (A) Total phenolic content (TPC), total flavonoid content (TFC),
and (B) HPLC quantification of the flavonoids and phenolic acids present in the
extract. Extraction conditions: biomass:solvent ratio = 1:10; t
Although ultrasound energy is commonly applied to intensify extraction by increasing the number of cavitation bubbles, which causes the cell walls to rupture, thereby reducing particle size and improving mass transfer [7, 49], the ultrasonic bath used in this work did not improve the extraction results. This could be due to the fact that this bath only allowed the temperature to be controlled, and no other parameters, such as frequency, power, or distance of the sample to the irradiation surface, known to affect the intensification process [24]. Moreover, the performance of the equipment could also be influenced by the orientation of the sample, sonication volume, and purity of the water used in the bath [26, 50]. It is worth noting that, although there was no significant improvement in the extraction efficiency using USBE, there was a reduction in energy consumption from 927 kJ, when using OSE, to 63 kJ with UBAE.
Since extraction using indirect ultrasound (ultrasonic bath) was not as effective as expected, an ultrasound probe was tested as an alternative for performing the ultrasound-assisted extraction (USPE). After some preliminary assays, the power was set at 10 W since higher power values resulted in solvent evaporation due to higher final temperatures, while the recipient was open. In this case, the extraction time effect was evaluated at 1.5, 3, and 6 min, reaching a maximum final temperature of 333 K. The results of the TPC, TFC, and HPLC analysis are shown in Fig. 5 and Supplementary Table 3 available as Supporting Information.
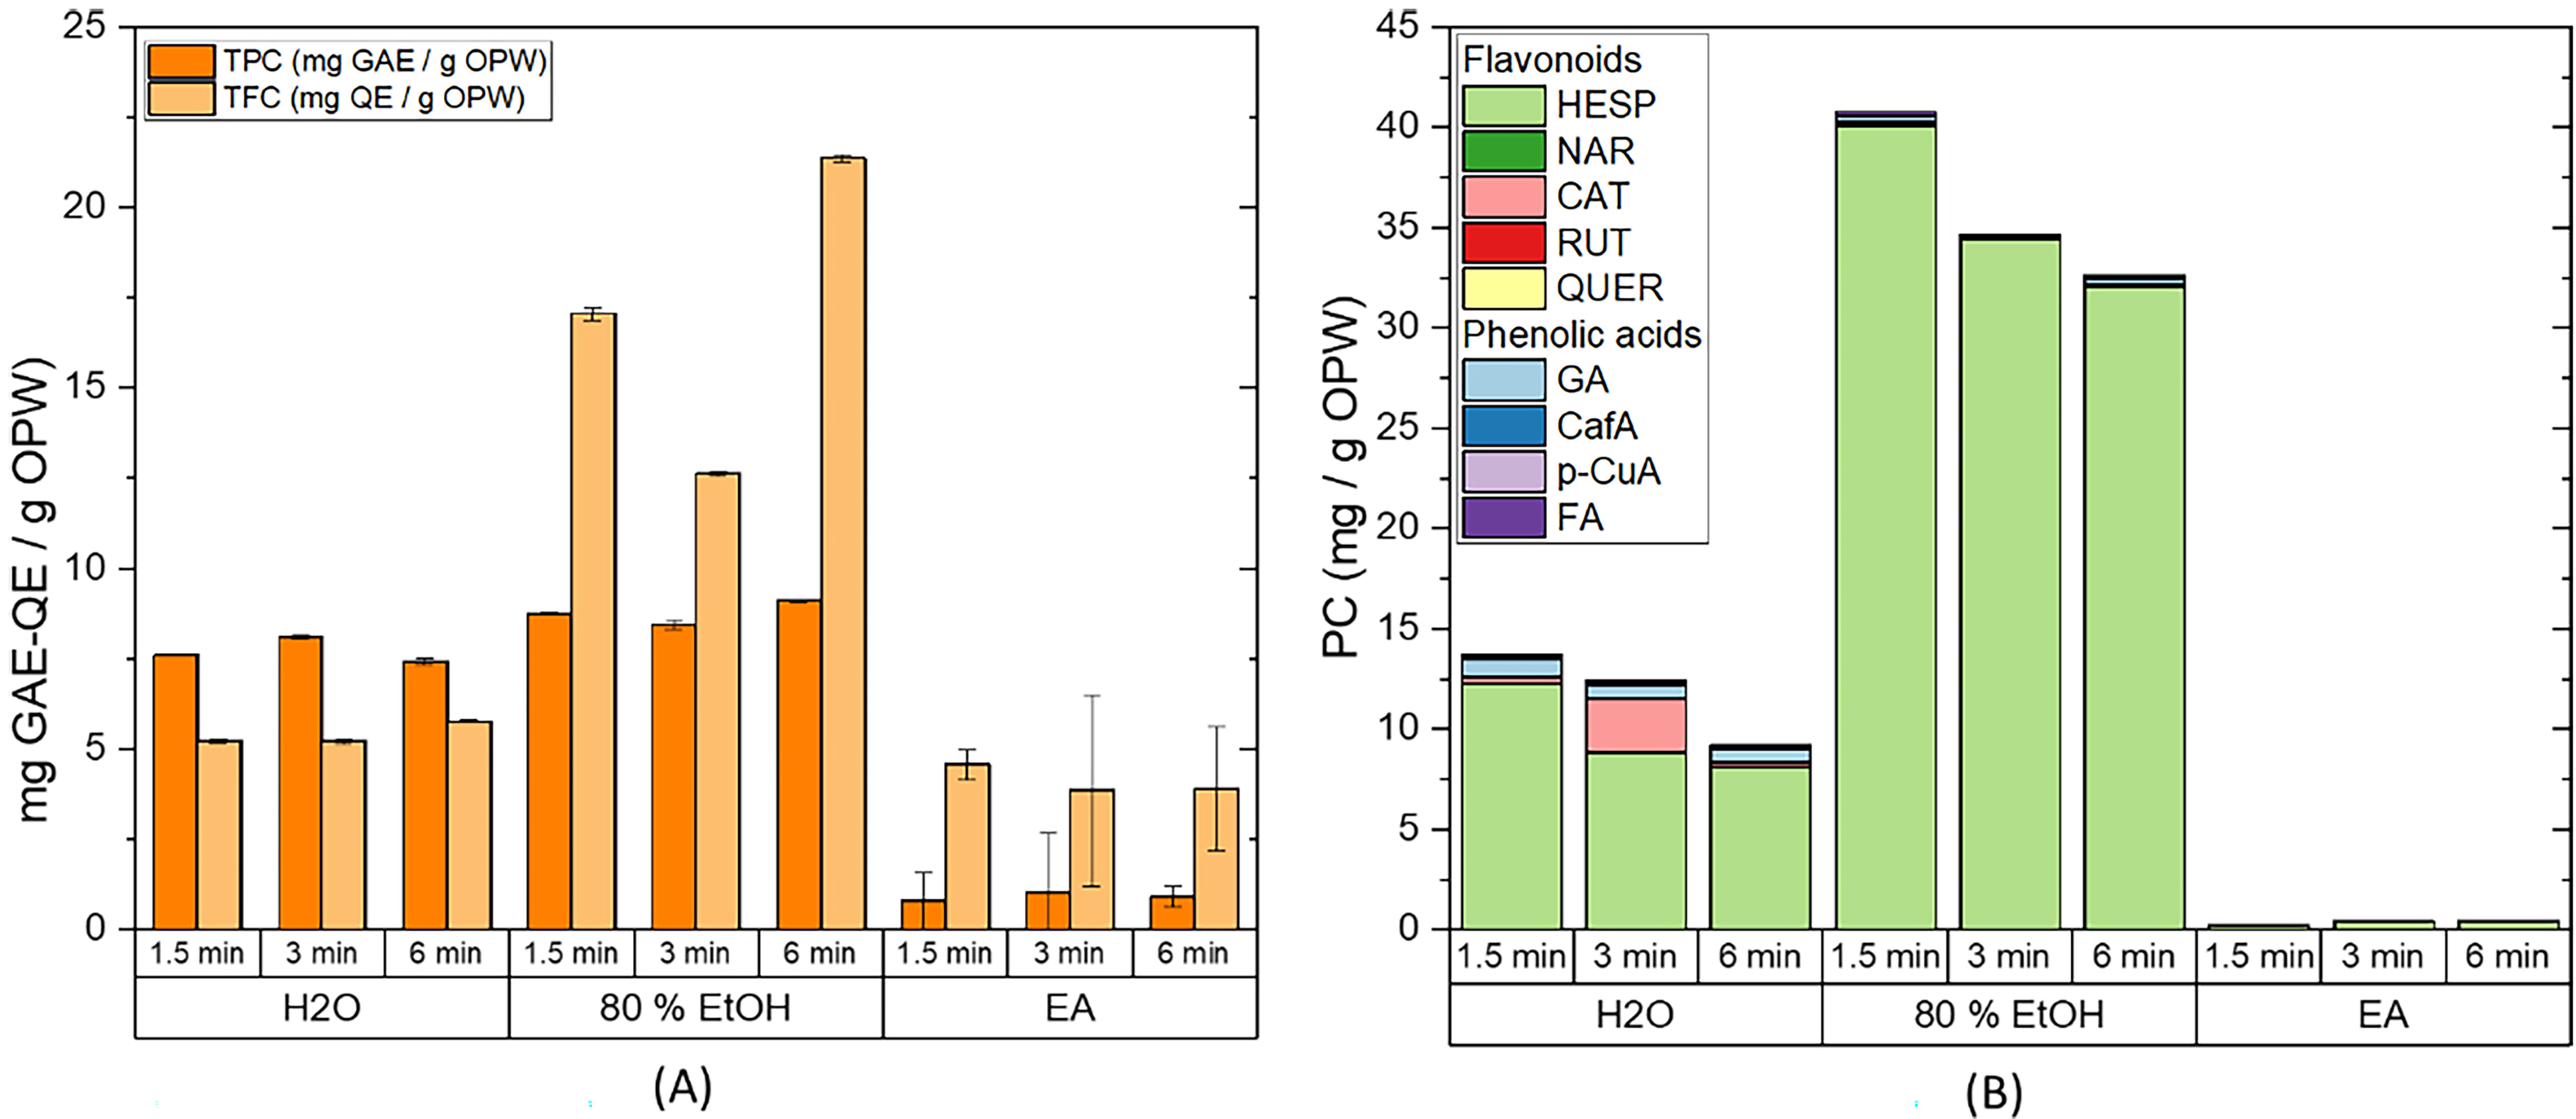 Fig. 5.
Extraction from OPW by ultrasound probe (USPE). (A) Total
phenolic content (TPC), total flavonoid content (TFC), and (B) HPLC
quantification of the flavonoids and phenolic acids present in the extract.
Extraction conditions: biomass:solvent ratio = 1:10; t
Comparing the Figs. 3,5, it is possible to observe that the TPC, TFC, and HPLC results follow a similar trend, yet those obtained by the ultrasonic probe are clearly better. Furthermore, they were obtained at shorter times (30–90 min using an orbital shaker vs. 1.5–6 min for the ultrasound probe). These facts confirm that ultrasound-assisted extraction using a probe instead of a bath improves the extraction of phenolic compounds from OPW since the probe transmits a higher energy to the medium and the mass transfer is improved due to the lack of barriers in the propagation path of ultrasound waves, hence, enabling shorter extraction times [26, 51]. Once again, the best extraction efficiency was achieved using 80% EtOH as solvent.
The HPLC analysis clearly shows a decrease in the extraction of phenolic compounds as time increases, which can be due to the heat generated during the sonication process or the sample oxidation since the vials are opened. This can lead to a change in the characteristics of the medium, resulting in the degradation of the phenolic compounds [51]. Such decreases were not observed in the TPC and TFC values because sonication could also be facilitating the extraction of other compounds that can interfere with the spectrophotometric measurements. Therefore, a time of 1.5 min was considered enough to ensure a high extraction yield and avoid possible degradation of the phenolic compounds. In addition, the energy consumed during USPE (18 kJ) is significantly lower than during the extraction using the bath (63 kJ). Therefore, the direct use of ultrasound as an assisted extraction technique is a better option in terms of extraction and energy efficiency. In brief, ultrasound-assisted extraction using the probe is more efficient than the orbital shaker and ultrasound bath-assisted extraction, as the extraction time can be shortened from 30 min to 1.5 min, achieving better extraction yields.
Subsequently, the best conditions established for USPE (1.5 min and 333 K) were used to test whether microwave-assisted extraction (MAE) could improve the obtained results. Moreover, the study temperature was extended to 373 K to evaluate the effect of temperature and time alongside this type of extraction technology. The obtained results are plotted in Figs. 6,7, and reported in Supplementary Table 4, available as Supporting Information.
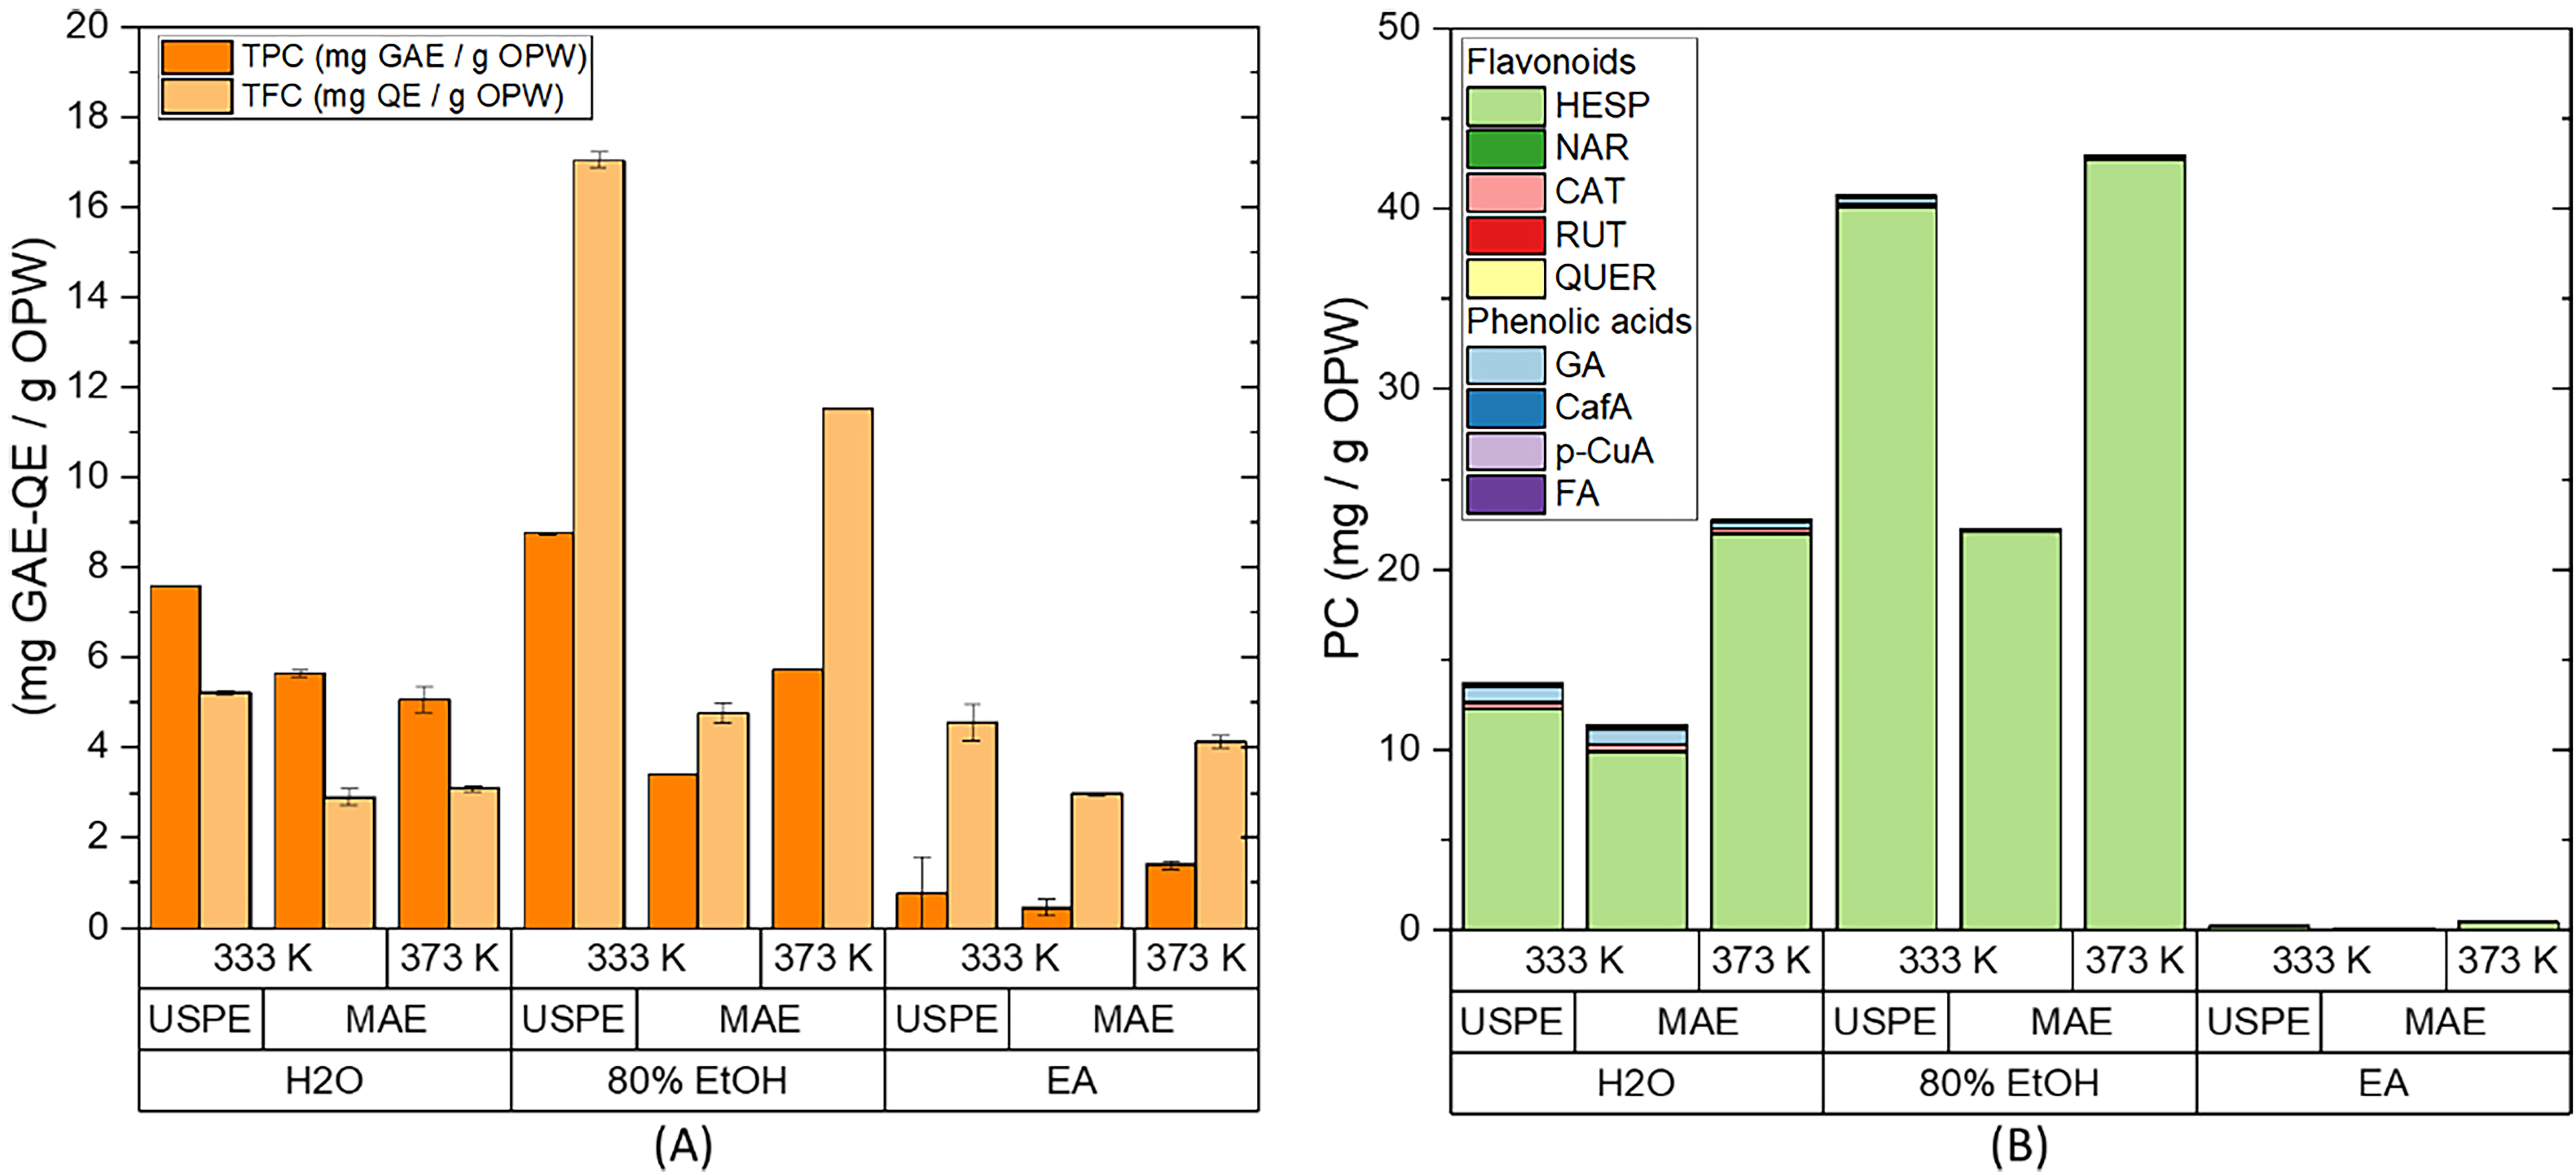 Fig. 6.
Extraction from OPW by ultrasound probe (USPE) and microwaves.
(A) Total phenolic content (TPC), total flavonoid content (TFC), and (B) HPLC
quantification of the flavonoids and phenolic acids present in the extract.
Extraction conditions: biomass:solvent ratio = 1:10; t
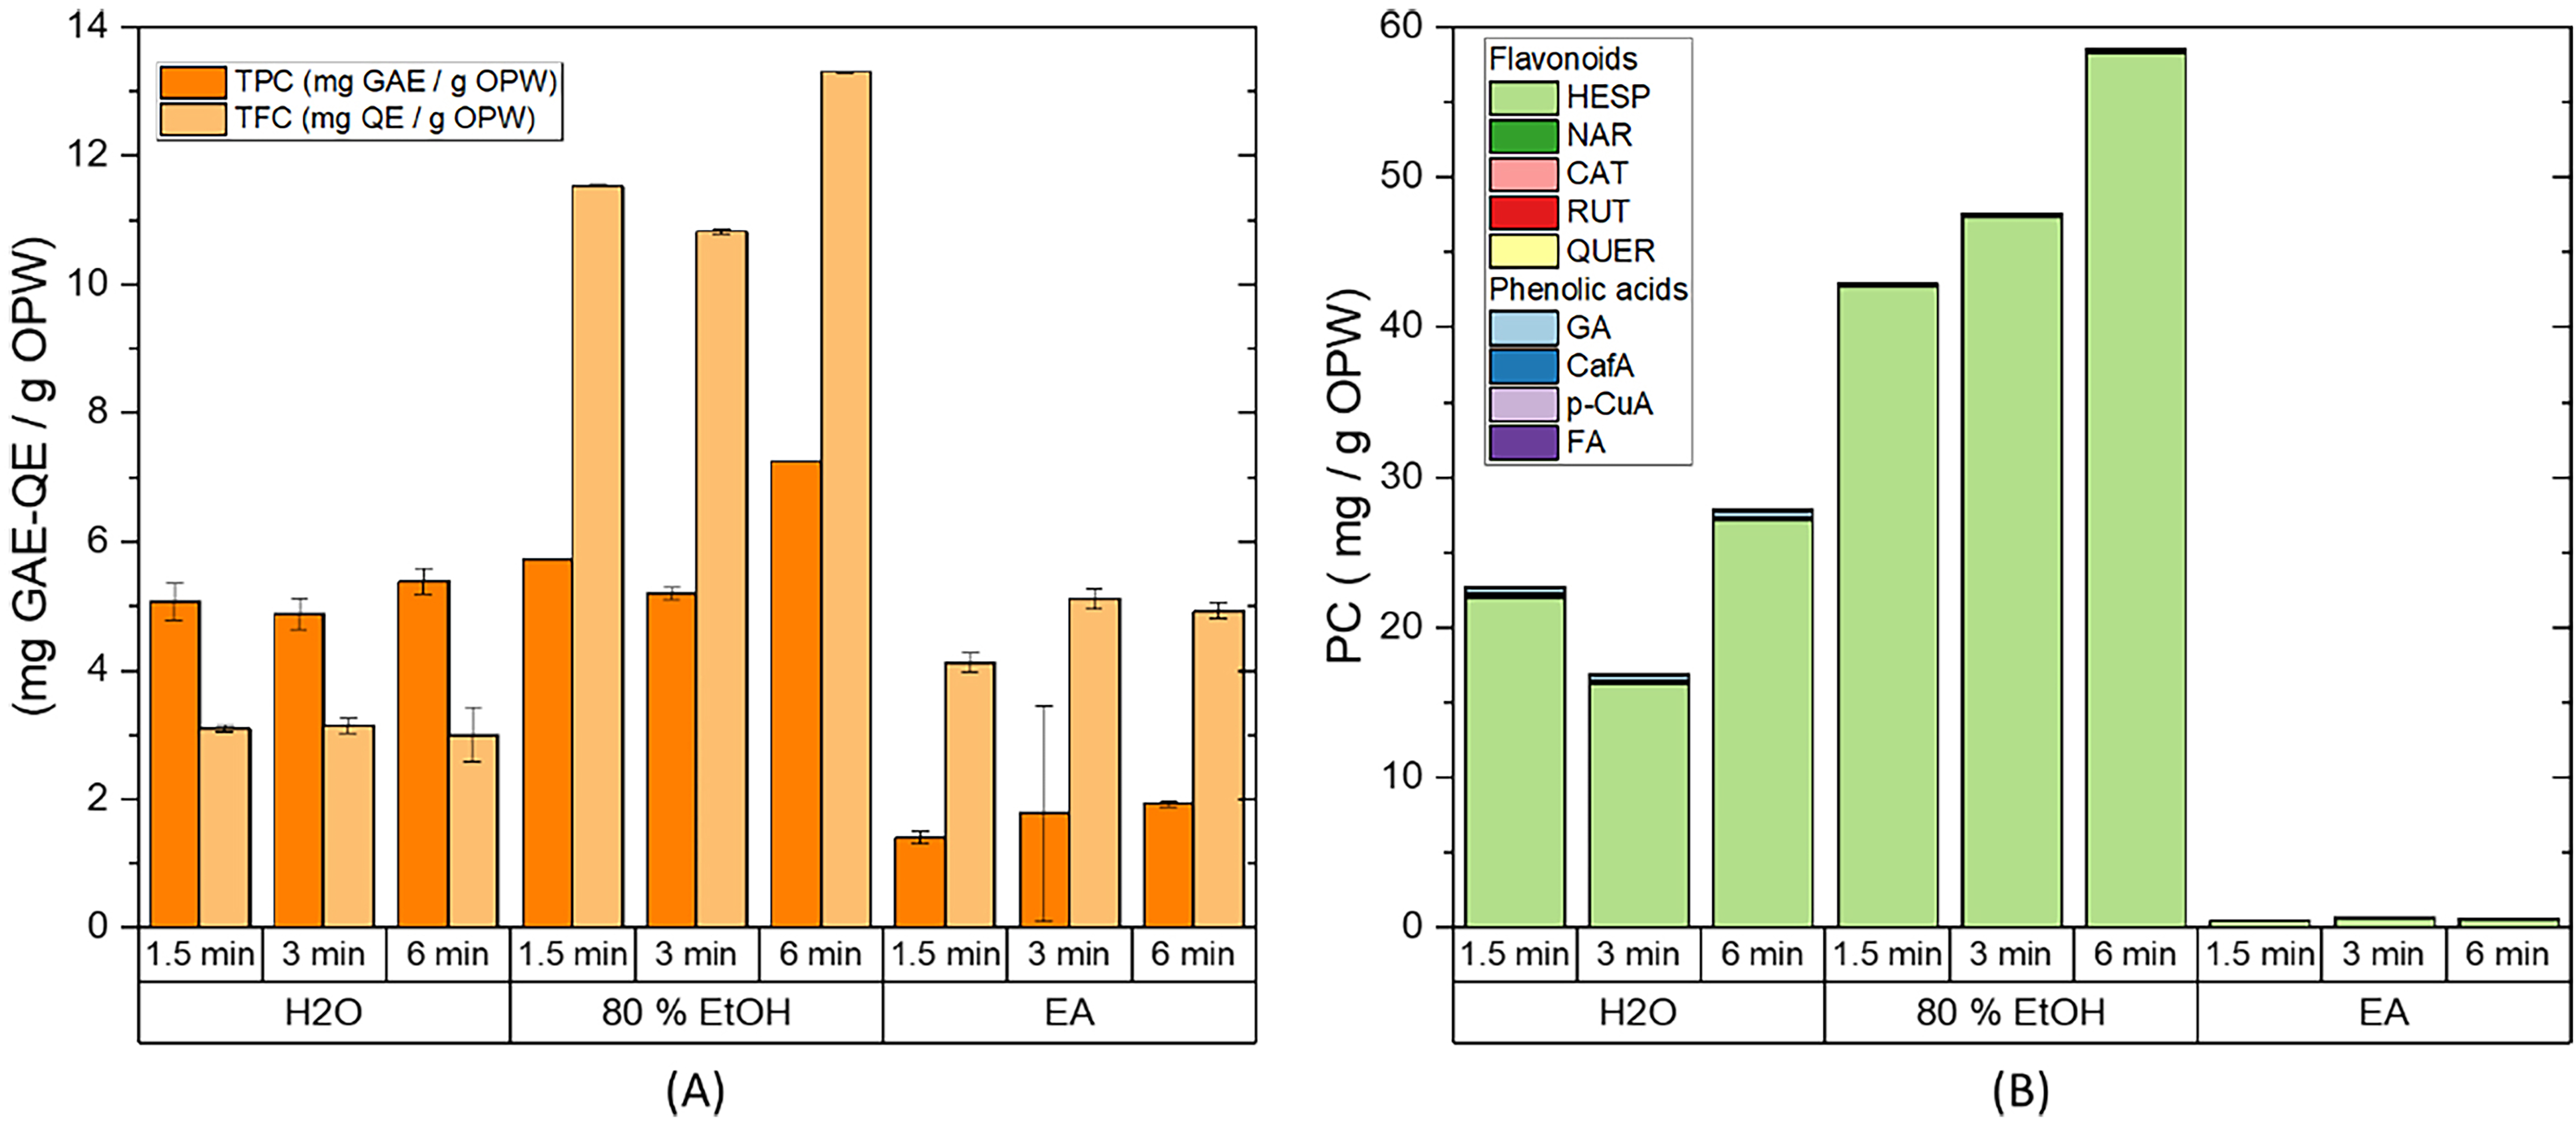 Fig. 7.
Effect of time on the extraction from OPW by microwave-assisted
extraction (MAE). (A) Total phenolic content and total flavonoid content, and
(B) HPLC quantification of the flavonoids and phenolic acids present in the
extract. Extraction conditions: biomass:solvent ratio = 1:10; t
As can be seen in Fig. 6, microwave-assisted extraction at 333 K failed to improve the results obtained by USPE. A possible explanation is that the energy required to increase the temperature up to 333 K is very low; therefore, the effect of the microwaves is also very small. Nevertheless, a significant improvement in extraction efficiency, especially for hesperidin, can be observed from the HPLC analysis when the temperature was set at 373 K (11.4 to 22.8 mg PC/g OPW in water, 22.3 to 43 mg PC/g OPW in 80% EtOH, and 0.1 to 0.4 mg PC/g OPW in ethyl acetate). At 373 K, the required energy is higher and the effect of microwaves on the sample is more relevant, which facilitates the desorption of the compounds from the matrix and the solvent penetration on the matrix by reducing the surface tension and surface viscosity [31]. On the other hand, microwaves accelerated extraction by increasing the temperature and internal pressure in the plant cell walls, which leads to an enhancement in porosity, thereby allowing the solvent to better penetrate [10].
Considering the good results obtained at 373 K, this work was completed by evaluating the effect of time on the MAE (Fig. 7), concluding that MAE efficiency increases with time while achieving the best results using 80% EtOH at 6 min (58.6 mg PC/g OPW). This can be explained by the fact that ethanol is known to be a good microwave absorber, which increases the extraction efficiency [52].
The energy required when using MAE for 6 min with a maximum operating power of 850 W was 306 kJ. The extraction using microwave and 80% EtOH as a solvent, enhanced the efficiency from 35.2 mg PC/g OPW using OSE to 58.6 mg PC/g OPW with MAE; moreover, MAE was able to reduce the energy consumption from 927 kJ to 306 kJ. This demonstrates that MAE is a good alternative to conventional extraction techniques.
This work evaluates the improvement in the extraction of phenolic compounds from orange peel waste (OPW) by ultrasound and microwave-assisted extraction methods compared to traditional extraction by an orbital shaker. Extraction temperature, extraction time, and the solvent used have been studied as operational parameters to optimize the recovery of natural antioxidants from OPW.
After optimizing the orbital shaker extraction, it was concluded that increasing temperatures up to 333 K improved the extraction efficiency, while times longer than 30 min decreased the extraction yields probably due to the degradation of the target compounds. Regarding ultrasound-assisted extraction (UAE), it was found that the use of an ultrasound bath did not improve the extraction yield, while the use of an ultrasound probe enhanced the extraction efficiency. The ultrasound probe allows higher energy to be directly transmitted to the matrix, reducing extraction time from 60 min to 1.5 min. As for the use of microwave-assisted extraction (MAE), it was concluded to be the most effective technique, as the extraction time can be reduced from 60 min to 6 min, while significantly enhancing the recovery of polyphenolic compounds at increasing temperatures, up to 373 K.
Concerning the extraction solvent (i.e., H
Regarding energy consumption, after the optimization of the extraction with each technique, it was concluded that the assisted extraction techniques provide a significant decrease in the energy required to carry out the extraction. In particular, USPE consumed 18 kJ compared to the 927 kJ normally consumed for traditional extraction using the orbital shaker under optimum extraction conditions.
In summary, UAE with a probe and MAE can be considered an efficient extraction technology for the valorization of OPW when 80% EtOH is used as the solvent, whereby it reduces the extraction time by at least 10 times, the energy consumption by 50 times, and increased the extraction efficiency by almost two times.
All data points generated or analyzed during this study are included in this article. Any additional information will be provided upon request to the corresponding author.
BSM, RC, MGM and EJG designed the research study. RC contributed to the conception of the present work. BSM performed the research, analyzed the data and wrote the manuscript. MGM and EJG provided oversight and critical revision of the manuscript. All authors have participated sufficiently in the work to take public responsibility for appropriate portions of the content and agreed to be accountable for all aspects of the work in ensuring that questions related to its accuracy or integrity. All authors read and approved the final manuscript. All authors contributed to editorial changes in the manuscript.
Not applicable.
The authors thank Paula Sánchez Morilla for her help with the analysis of the samples.
This work was financially supported by the Comunidad Autónoma de Madrid (Spain): SUSTEC P2018/EMT- 4348 project, PEJ-2020-AI/AMB-18391 and PEJ-2021-TL/AMB-21722 grants. This work has been also supported by the Madrid Government (Comunidad de Madrid - Spain) under the Multiannual Agreement with Universidad Politécnica de Madrid in the line Excellence Programme for University Professors, in the context of the V PRICIT (Regional Plan of Research and Technological Innovation).
The authors declare no conflict of interest.
Publisher’s Note: IMR Press stays neutral with regard to jurisdictional claims in published maps and institutional affiliations.