


 , Wei-Ta Chen 1,2,3,4,*, Li-Ling Hope Pan 1, Hung-Yu Liu 2,3, Yen-Feng Wang 2,3, Shih-Pin Chen 1,2,3, Kuan-Lin Lai 2,3, Shuu-Jiun Wang 1,2,3
1 Brain Research Center, National Yang-Ming Chiao-Tung University, 11221 Taipei, Taiwan
2 School of Medicine, National Yang-Ming Chiao-Tung University, 11221 Taipei, Taiwan
3 Department of Neurology, Neurological Institute, Taipei Veterans General Hospital, 11217 Taipei, Taiwan
4 Department of Neurology, Keelung Hospital, Ministry of Health and Welfare, 20147 Keelung, Taiwan
Academic Editor: Maysam F. Abbod
Abstract
Introduction: The development of quantitative, objective signatures or predictors to evaluate pain sensitivity is crucial in the clinical management of pain and in precision medicine. This study combined multimodal (neurophysiology and psychometrics) signatures to classify the training dataset and predict the testing dataset on individual heat pain sensitivity. Methods: Healthy individuals were recruited in this study. Individual heat pain sensitivity and psychometric scores, as well as the resting-state electroencephalography (EEG) data, were obtained from each participant. Participants were divided into low-sensitivity and high-sensitivity subgroups according to their heat pain sensitivity. Psychometric data obtained from psychometric measurements and power spectral density (PSD) and functional connectivity (FC) derived from resting-state EEG analysis were subjected to feature selection with an independent t test and were then trained and predicted using machine learning models, including support vector machine (SVM) and k-nearest neighbor. Results: In total, 85 participants were recruited in this study, and their data were divided into training (n = 65) and testing (n = 20) datasets. We identified the resting-state PSD and FC, which can serve as brain signatures to classify heat pain as high-sensitive or low-sensitive. Using machine learning algorithms of SVM with different kernels, we obtained an accuracy of 86.2%–93.8% in classifying the participants into thermal pain high-sensitivity and low-sensitivity groups; moreover, using the trained model of cubic SVM, an accuracy of 80% was achieved in predicting the pain sensitivity of an independent dataset of combined PSD and FC features of resting-state EEG data. Conclusion: Acceptable accuracy in classification and prediction by using the SVM model indicated that pain sensitivity could be achieved, leading to considerable possibilities of the use of objective evaluation of pain perception in clinical practice. However, the predictive model presented in this study requires further validation by studies with a larger dataset.
Keywords
- Pain sensitivity
- Resting-state EEG
- Power spectral density
- Functional connectivity
- Machine learning
- Support vector machine
The International Association for the Study of Pain defined pain as “an unpleasant sensory and emotional experience associated with, or resembling that associated with, actual or potential tissue damage” [1]. In addition, pain is a subjective perceptual phenomenon that is determined by biological, psychological, and social factors. Therefore, quantitative characterization of pain sensitivity may have significant clinical utility in predicting responses to a clinical procedure [2]. Moreover, accumulated evidence suggests that altered pain sensitivity was associated with Alzheimer disease [3, 4], Parkinson disease [5], fibromyalgia [6], and migraine and tension-type headache [7]. Self-reported quantitative sensory testing is the gold standard in pain sensitivity measurement [8]. Thus, research focused on the development of quantitative predictors to aid the evaluation of pain sensitivity is of increasing importance in the clinical management of pain and in precision medicine.
Studies have suggested that pain sensitivity was associated with neuronal activities and multiple functional brain networks. The rating of individual pain using noxious stimulation was linked to cortical activation [9, 10, 11, 12], and pain intensity to heat stimuli was related to gamma oscillation in the medial frontal cortex [12]. In previous studies, during capsaicin-heat pain stimulation, peak alpha frequency over the sensorimotor region was inversely correlated with individual pain intensity [11, 13]. In our recent study, we further confirmed that pain sensitivity is associated with the spontaneous regional oscillatory activities and intrinsic functional network [14]. Taken together, these findings suggest that cortical activation and functional network may reflect individual pain sensitivity and cause individual differences in pain perception. Although neural correlates of pain sensitivity have been investigated, whether these brain signatures could be used to predict individual pain sensitivity remains elusive.
Machine learning involves the use of an algorithm to automatically detect patterns in data and then predict or classify future data; thus, it learns from data without the need for previous knowledge and aims at optimizing the performance of the model. In pain research applications, machine learning uses pain-related data for feature mapping; learning the signatures of pain conditions, types, or disorders; and constructing the prediction model, which can be applied to new data to identify or predict pain phenotypes. In the past decade, machine learning has been used to assess pain elicited by noxious heat in healthy persons with fine performance (85–94% sensitivity and 73–94% specificity) using functional magnetic resonance imaging (MRI) data [15], and classify pain and nonpain conditions with an accuracy of 81% by using whole-brain activities obtained from functional MRI data [16], high and low pain intensities with an accuracy of 86.3% by using laser-evoked potential from electroencephalography (EEG) data [17], baseline and pain threshold conditions with an accuracy of 79.29% by using facial electromyography data [18], and healthy individuals and patients with migraine with an accuracy of 91.4% and 88.7% by using resting-state data of functional MRI [19] and somatosensory evoked potentials of EEG, respectively [20]. As a result, machine learning might have a great potential to predict individual pain sensitivity from pain-related neurophysiological or psychological data.
As resting-state brain activities were associated with individual pain sensitivity in our recent study [14], spontaneous cortical oscillations and intrinsic functional networks might be pivotal mechanisms in the regulation of pain processes. Therefore, this study combined multimodal (neurophysiology and psychometrics) signatures, which might better represent pain complexity, and built a multivariate machine-learning model, which learns from the features of psychometric scores (from demography and questionnaires), spontaneous brain oscillatory powers (from within-electrode EEG analysis), and resting-state functional connectivity (FC, from between-electrode EEG analysis), to noticeably classify the training dataset and predict the testing dataset on individual heat pain sensitivity derived from the heat pain threshold (HPT).
This study recruited healthy individuals who did not have a medical or family history of pain disorders and had not experienced any significant pain condition during the past year. All participants were right-handed, denied having any history of systemic or major neuropsychiatric disease, and had normal physical and neurological examination results as well as normal brain MRI results. Participants taking any medication on a daily basis were excluded. All participants underwent scheduled pain sensitivity measurements and EEG recordings, and their degrees of psychometric factors were assessed (detailed in 3.2 and 3.3).
The Institutional Review Board of National Yang-Ming University approved the study protocol (YM108044F), and each participant provided written informed consent.
Pain sensitivity measurement was obtained in the pain examination room (with a
constant room temperature of 20
Regarding psychometric measurements, we evaluated sleep efficiency (in %) derived from the ratio of the total sleep time to time in bed (multiplied by 100 to yield a percentage) using the Pittsburgh Sleep Quality Index (PSQI); the extent of catastrophic thinking due to pain according to three components, namely rumination, magnification, and helplessness, determined using the Pain Catastrophizing Scale (PCS); the degree to which the participants appraised situations in their lives as stressful on the Perceived Stress Scale; anxiety and depression by using the Hospital Anxiety and Depression Scale (HADS); and the quantification of stress by analyzing life events using Recent Life Changes Questionnaire.
EEG recording (Brain Products GmbH, Munich, Germany) was conducted for 5 min with a digitization rate of 1000 Hz; participants were instructed to close their eyes but remain awake and relaxed and perform no explicit task, which eliminated the artifacts of eye movement and revealed that the intrinsic cortical activities were associated with pain sensitivity in our recent study [14]. The recording was stopped and then rerun if a participant fell asleep. All the subjects were asked not to consume caffeine 48 h before the EEG assessment [21]. Electrooculography activity was simultaneously acquired for offline artefact elimination. Scalp EEG was collected from an EEG cap housing a 64-electrode BrainVision actiCAP system, which covered the whole brain according to the extended international 10–20 system [22]. Active circuits for impedance conversion, achieving outstanding signal quality even with higher impedances compared with conventional passive electrodes, are integrated directly in the actiCAP slim electrodes. All electrodes were referenced online to an electrode placed at the Fz and a common ground set at the FPz site. The EEG signal was amplified and digitized using a BrainAmp DC amplifier linked to Brain Vision Recorder software (version 2.1, Brain Products GmbH, Munich, Germany).
In the preprocessing stage, a bandpass filter of 1–40 Hz was applied to all
data to remove the DC drift and 60-Hz power noise. Then, to eliminate nonbrain
artefacts from the resting-state EEG data, apparent eye contaminations were
manually removed through visual inspection; moreover, identified heartbeat and
eye blinking events from electro-cardiographic and electro-oculographic data were
used to define the projectors through principal component analysis separately.
The principal components meeting the artifact’s sensor topography were then
manually excluded through orthogonal projection [23]. To obtain the
electrode-based resting-state oscillations and FC, the spontaneous activities of
each electrode were further analyzed as follows [14, 24, 25, 26]. First, oscillatory
power in each electrode was estimated using the Welch method (window duration: 3
sec with 50% overlap) and defined as absolute power spectral density (PSD).
Moreover, the oscillatory power was spectrally normalized through the division of
power at each frequency band by the total power, which adequately reduce the
interindividual variability of the oscillatory magnitude [27]. Second, the
amplitude envelope correlation analysis [28], which orthogonalized the signals to
remove zero-lag interactions [29], was used to calculate the FC between
electrodes and then the full 63
On the basis of prior findings, which suggested that pain perception is associated with central modulation; distributed cortical involvement; and the interaction of sensory, cognitive and affective processes, multimodal signatures including the psychometric data (Psy) and functional EEG activities within and between brain regions would accurately manifest the underlying neurophysiological mechanism. Thus, the extraction of these features is desirable to establish the predictive model and obtain high classification accuracy. In our study, all individual’s data were split into training and testing datasets, and the extracted features were organized in three data types: Psy obtained from psychometric measurements, and PSD and FC derived from resting-state EEG analysis (Fig. 1).
 Fig. 1.
Pipeline of data processing and machine learning model. (a) Feature extraction of resting-state EEG data and feature selection from demographic, psychometric, and neurophysiological data. (b) Classification using training dataset and validation using testing dataset. PSS, perceived stress scale; PCS, pain catastrophizing scale; HADS, hospital anxiety and depression scale. Demo, demographic data.
Feature selection is a process of selecting a subset of features from the
original set of extracted features to increase the classification performance
with a compact feature subset, which might reduce computational complexity and
diminish irrelevant features. Therefore, we applied a feature selection procedure
by using the univariate analysis (independent t test) for the
high-sensitivity versus low-sensitivity factor to obtain the most discriminative
features for classification (Fig. 1). In this study, for Psy and PSD, the feature
index with significant difference between groups (p
The kernel functions and parameters for all classification analyses are listed in Table 1. To avoid the overfitting problem, model training processes were based on a five-fold leave-one-out cross-validation technique, which were unbiased in the sense that the training features were selected from each test case. The performance of each classification model was evaluated based on accuracy, sensitivity, and specificity, as well as the area under the receiver operating characteristics curve (AUC). Here, sensitivity and specificity represent the proportion of low-sensitive and high-sensitive participants, respectively, correctly classified.
| SVM | Kernel function | Kernel scale |
| Linear SVM | Linear | auto |
| Quadratic SVM | Quadratic | auto |
| Cubic SVM | Cubic | auto |
| Fine Gaussian SVM | Gaussian | 3 |
| Medium Gaussian SVM | Gaussian | 12 |
| Coarse Gaussian SVM | Gaussian | 48 |
| KNN | No. of neighbors | Distance weight |
| Fine KNN | 1 | equal |
| Medium KNN | 10 | equal |
| Coarse KNN | 100 | equal |
| Cosine KNN | 10 | equal |
| Cubic KNN | 10 | equal |
| Weighted KNN | 10 | squared inverse |
| SVM, support vector machine; KNN, K-nearest neighbor; No., number. | ||
After the reconstruction and evaluation of classification models from the training dataset, these models were further validated to determine whether identified features can be generalizable across different populations. First, the testing dataset was correspondingly applied to preprocessing and analysis, and then feature selection was performed based on the discriminative feature index from the training dataset. The discriminative features of Psy, PSD, and FC in the testing dataset were used in the trained classification models to differentiate between participants with low-sensitivity and high-sensitivity. The labels of the testing dataset were blinded, and the classification models were applied to the discriminative features without any model training procedure. The predictive accuracy and AUC were obtained for each model. Additionally, to estimate the statistical significance of predictive accuracy, statistical significance of the observed classification accuracy was estimated using nonparametric permutation tests (1000 times).
This study included 85 healthy participants who were divided into
high-sensitivity (n = 43) and low-sensitivity (n = 42) groups according certain
criteria. Demographic and psychometric profiles are summarized in Table 2. The
groups did not differ significantly in terms of age, sex, height, or weight. In
terms of the psychometric data, sleep efficiency, perceived stress, and recent
life changes were similar between groups. However, pain catastrophizing (PCS),
anxiety (HADS_A), and depression (HADS_D) scores were higher in the
high-sensitivity group than in the low-sensitivity group (all p
| Group | p-value | ||
| High-sensitivity | Low-sensitivity | ||
| N | 43 | 42 | |
| Demographics | |||
| Age (years) | 28.6 |
30.1 |
0.393 |
| Gender | 24F/19M | 25F/17M | 0.827 |
| Height (cm) | 166.3 |
166.6 |
0.829 |
| Weight (kg) | 65.5 |
62.7 |
0.326 |
| Clinical scores | |||
| EFF (%) | 91.3 |
89.1 |
0.292 |
| PCS | 7.5 |
4.4 |
0.032* |
| PSS | 23.7 |
21.0 |
0.11 |
| HADS_A | 4.8 |
2.9 |
0.004** |
| HADS_D | 3.3 |
1.9 |
0.022* |
| RLCQ | 162.9 |
128.6 |
0.263 |
| HPT | 40.4 |
46.1 |
|
| High-sensitivity, Low heat pain threshold; Low-sensitivity, High heat pain
threshold; F, Female; M, Male; EFF, Sleep efficiency; PCS, Pain catastrophizing
score; PSS, Perceived stress scale; HADS, Hospital anxiety and depression score;
A, Anxiety; D, Depression; RLCQ, Recent life changes questionnaire; HPT, Heat
pain threshold. *p | |||
The spatial distribution of spectral power in high-sensitivity and
low-sensitivity groups and differences in the statistical topographic mappings of
PSD between high-sensitivity and low-sensitivity groups in different frequency
bands are illustrated in Fig. 2. Regarding the absolute PSD (Fig. 2a), in the
alpha, beta, and gamma bands, larger spectral powers were observed in the
high-sensitivity group than in the low-sensitivity group (p
 Fig. 2.
Power spectral density between groups. (a) Normalized
spectral power density in low-sensitivity and high-sensitivity groups. (b)
Difference of absolute and normalized power spectral density between subjects
with low- and high-sensitivity. Dashed circle indicates the electrode with
significant difference between groups (p
Differences in resting-state FC between groups are statistically illustrated
with adjacency matrices from delta to gamma bands (Fig. 3a). In general,
decreased FC values in the high-sensitivity group in delta, theta, beta, and
gamma bands were observed between specific connections in comparison with those
in the low-sensitivity group, indicating that decreased oscillatory connectivity
characterized the intrinsic functional connections in participants with
high-sensitivity. By contrast, increased alpha FC values were noted in
participants with high-sensitivity. Fig. 3b shows the consensus map of
discriminative features, which represents the significant difference between
groups (p
 Fig. 3.
Functional connectivity between groups. (a)
Statistical difference of electrode–electrode functional connectivity in each
frequency band between participants with low- and high-sensitivity. Electrode
position illustrates the arrangement of each electrode. The table shows the
electrode name corresponding to each number. (b) The consensus map exhibits the
significant functional connectivity difference between subjects with low- and
high-sensitivity (p
Using one type of discriminative feature (Psy, PSD, or FC), the performance of
models with different kernel functions for each type of input features is shown
in Fig. 4. With Psy, the best model (fine Gaussian support vector machine [SVM])
among all training models had an accuracy of 55.4% and AUC of 0.63. With PSD,
the best model (medium Gaussian SVM) had an accuracy of 73.8% and AUC of 0.79.
With FC, the best models (accuracy
 Fig. 4.
Classification using one type of features. Model performance using psychometric, PSD, or FC features. Psy, psychometric data; PSD, power spectral density; FC, functional connectivity; SVM, support vector machine; AUC, area under the curve.
Using a combination of two types of discriminative features, the classification
performance was also examined in the training process (Fig. 5). Using the
combination of Psy and PSD (total 85 features), coarse Gaussian SVM achieved the
best accuracy of 73.8% and AUC of 0.79. As for the combination of Psy and FC
(148 features), linear (accuracy = 90.8%, AUC = 0.97), quadratic (accuracy =
93.8%, AUC = 0.97), and cubic (accuracy = 92.3%, AUC = 0.96) SVM had the finest
performance. For the combination of PSD and FC (227 features), the classification
exhibited the accuracy of
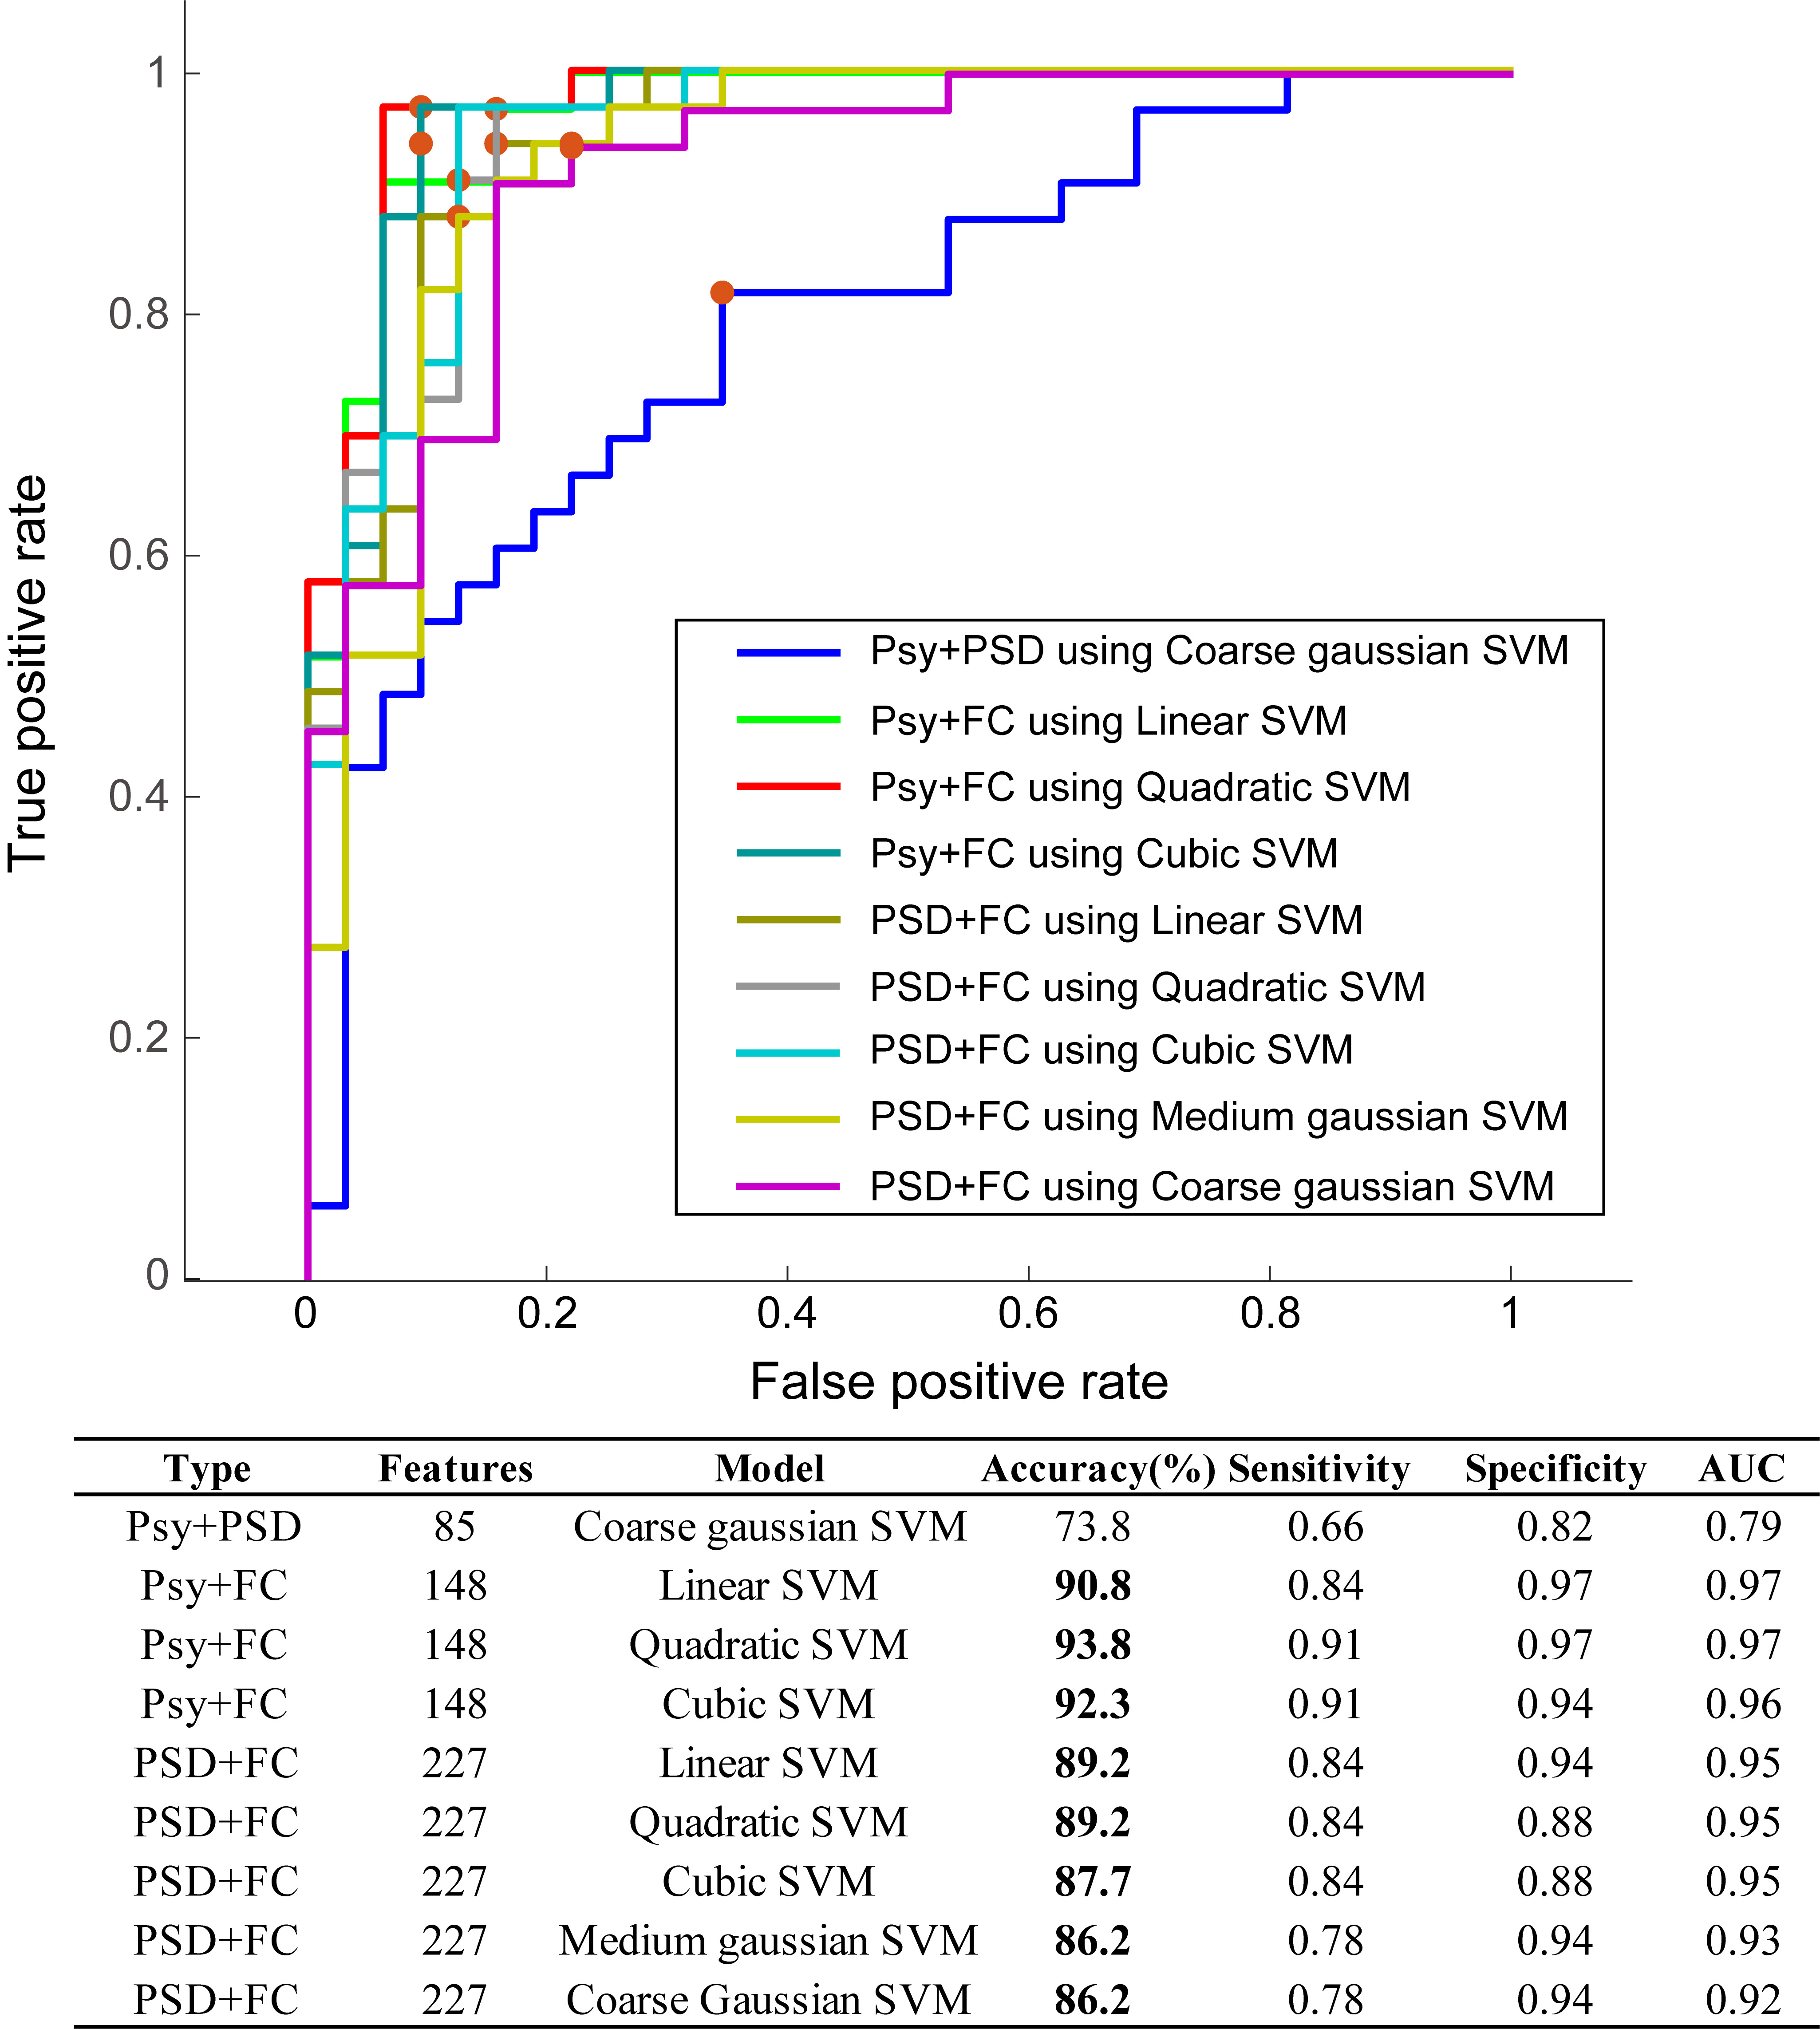 Fig. 5.
Classification using two types of features. Model performance using combined features using two of psychometric, PSD, or FC. Psy, psychometric data; PSD, power spectral density; FC, functional connectivity; SVM, support vector machine; AUC, area under the curve.
The performance of the combination of all three types of discriminative features
(total 230 features) was investigated using the training dataset (Fig. 6). SVM
model achieved an accuracy of
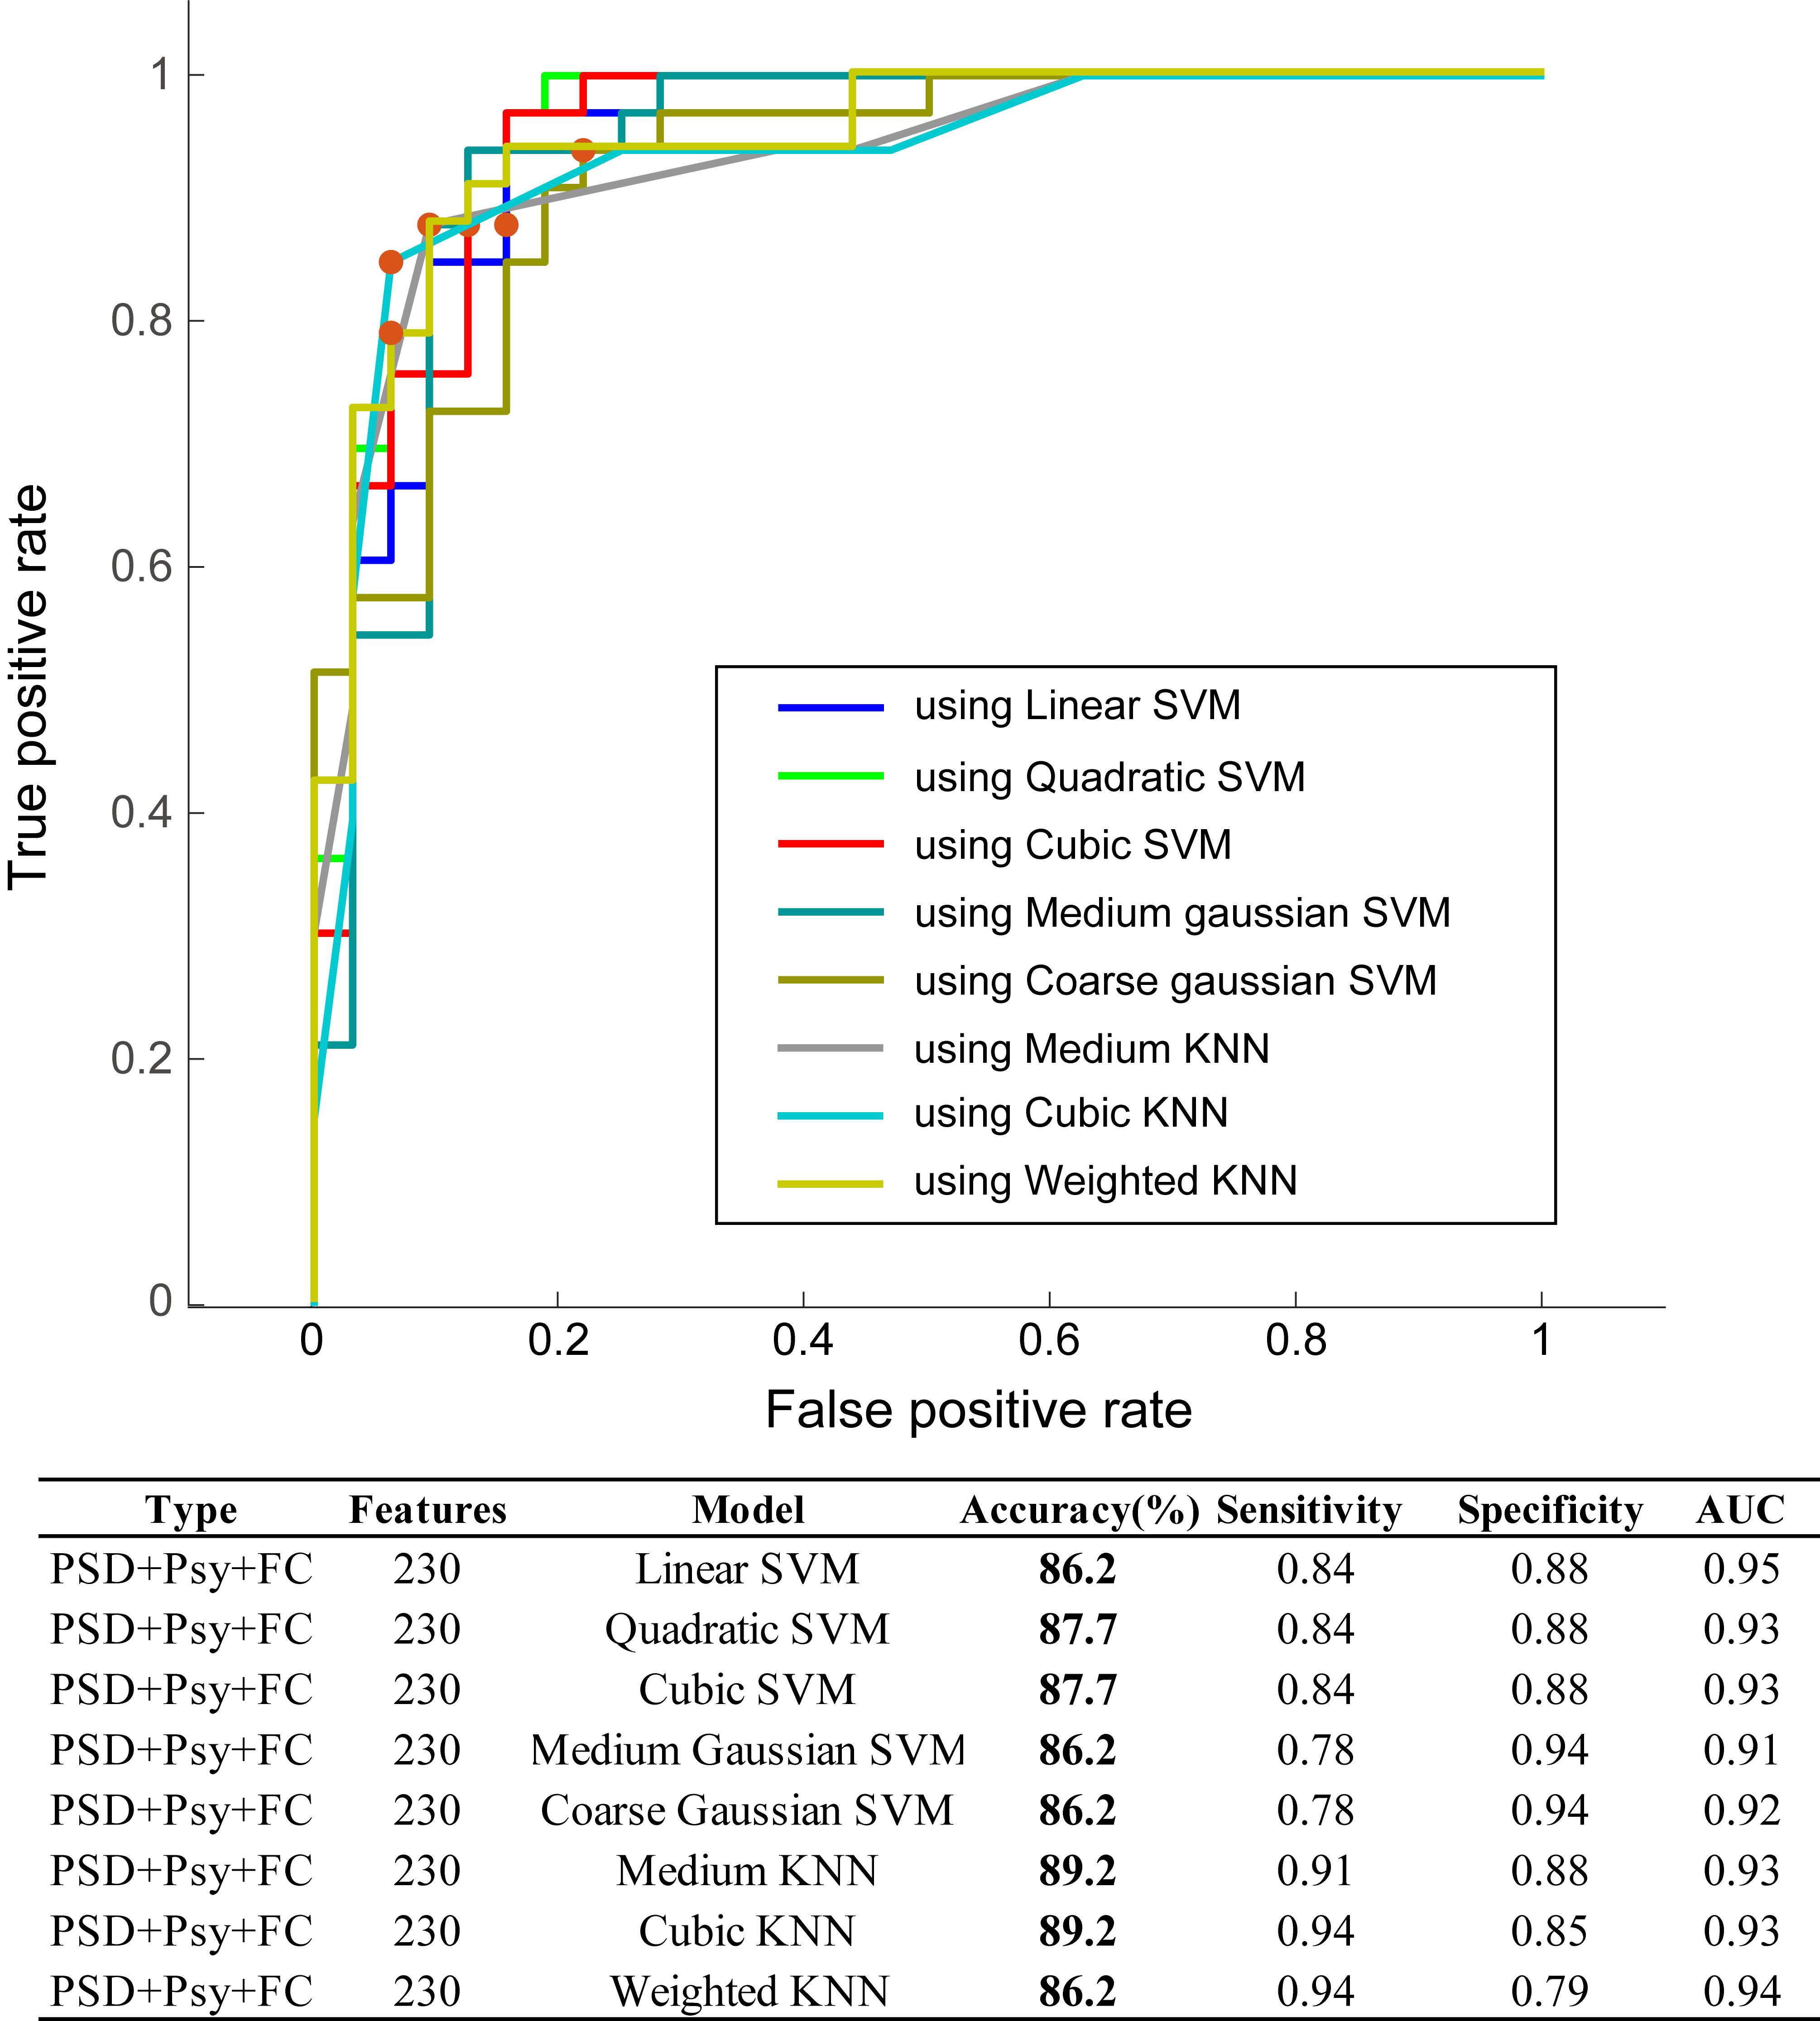 Fig. 6.
Classification using all three features. Model performance using psychometric, PSD, and FC features. Psy, psychometric data; PSD, power spectral density; FC, functional connectivity; SVM, support vector machine; AUC, area under the curve.
We further tested the generalizability of the discriminative features and
trained models by using a testing dataset of 10 high-sensitive participants and
10 low-sensitive participants. Between groups, no clear difference was observed
for the factors of age (high: 28.7
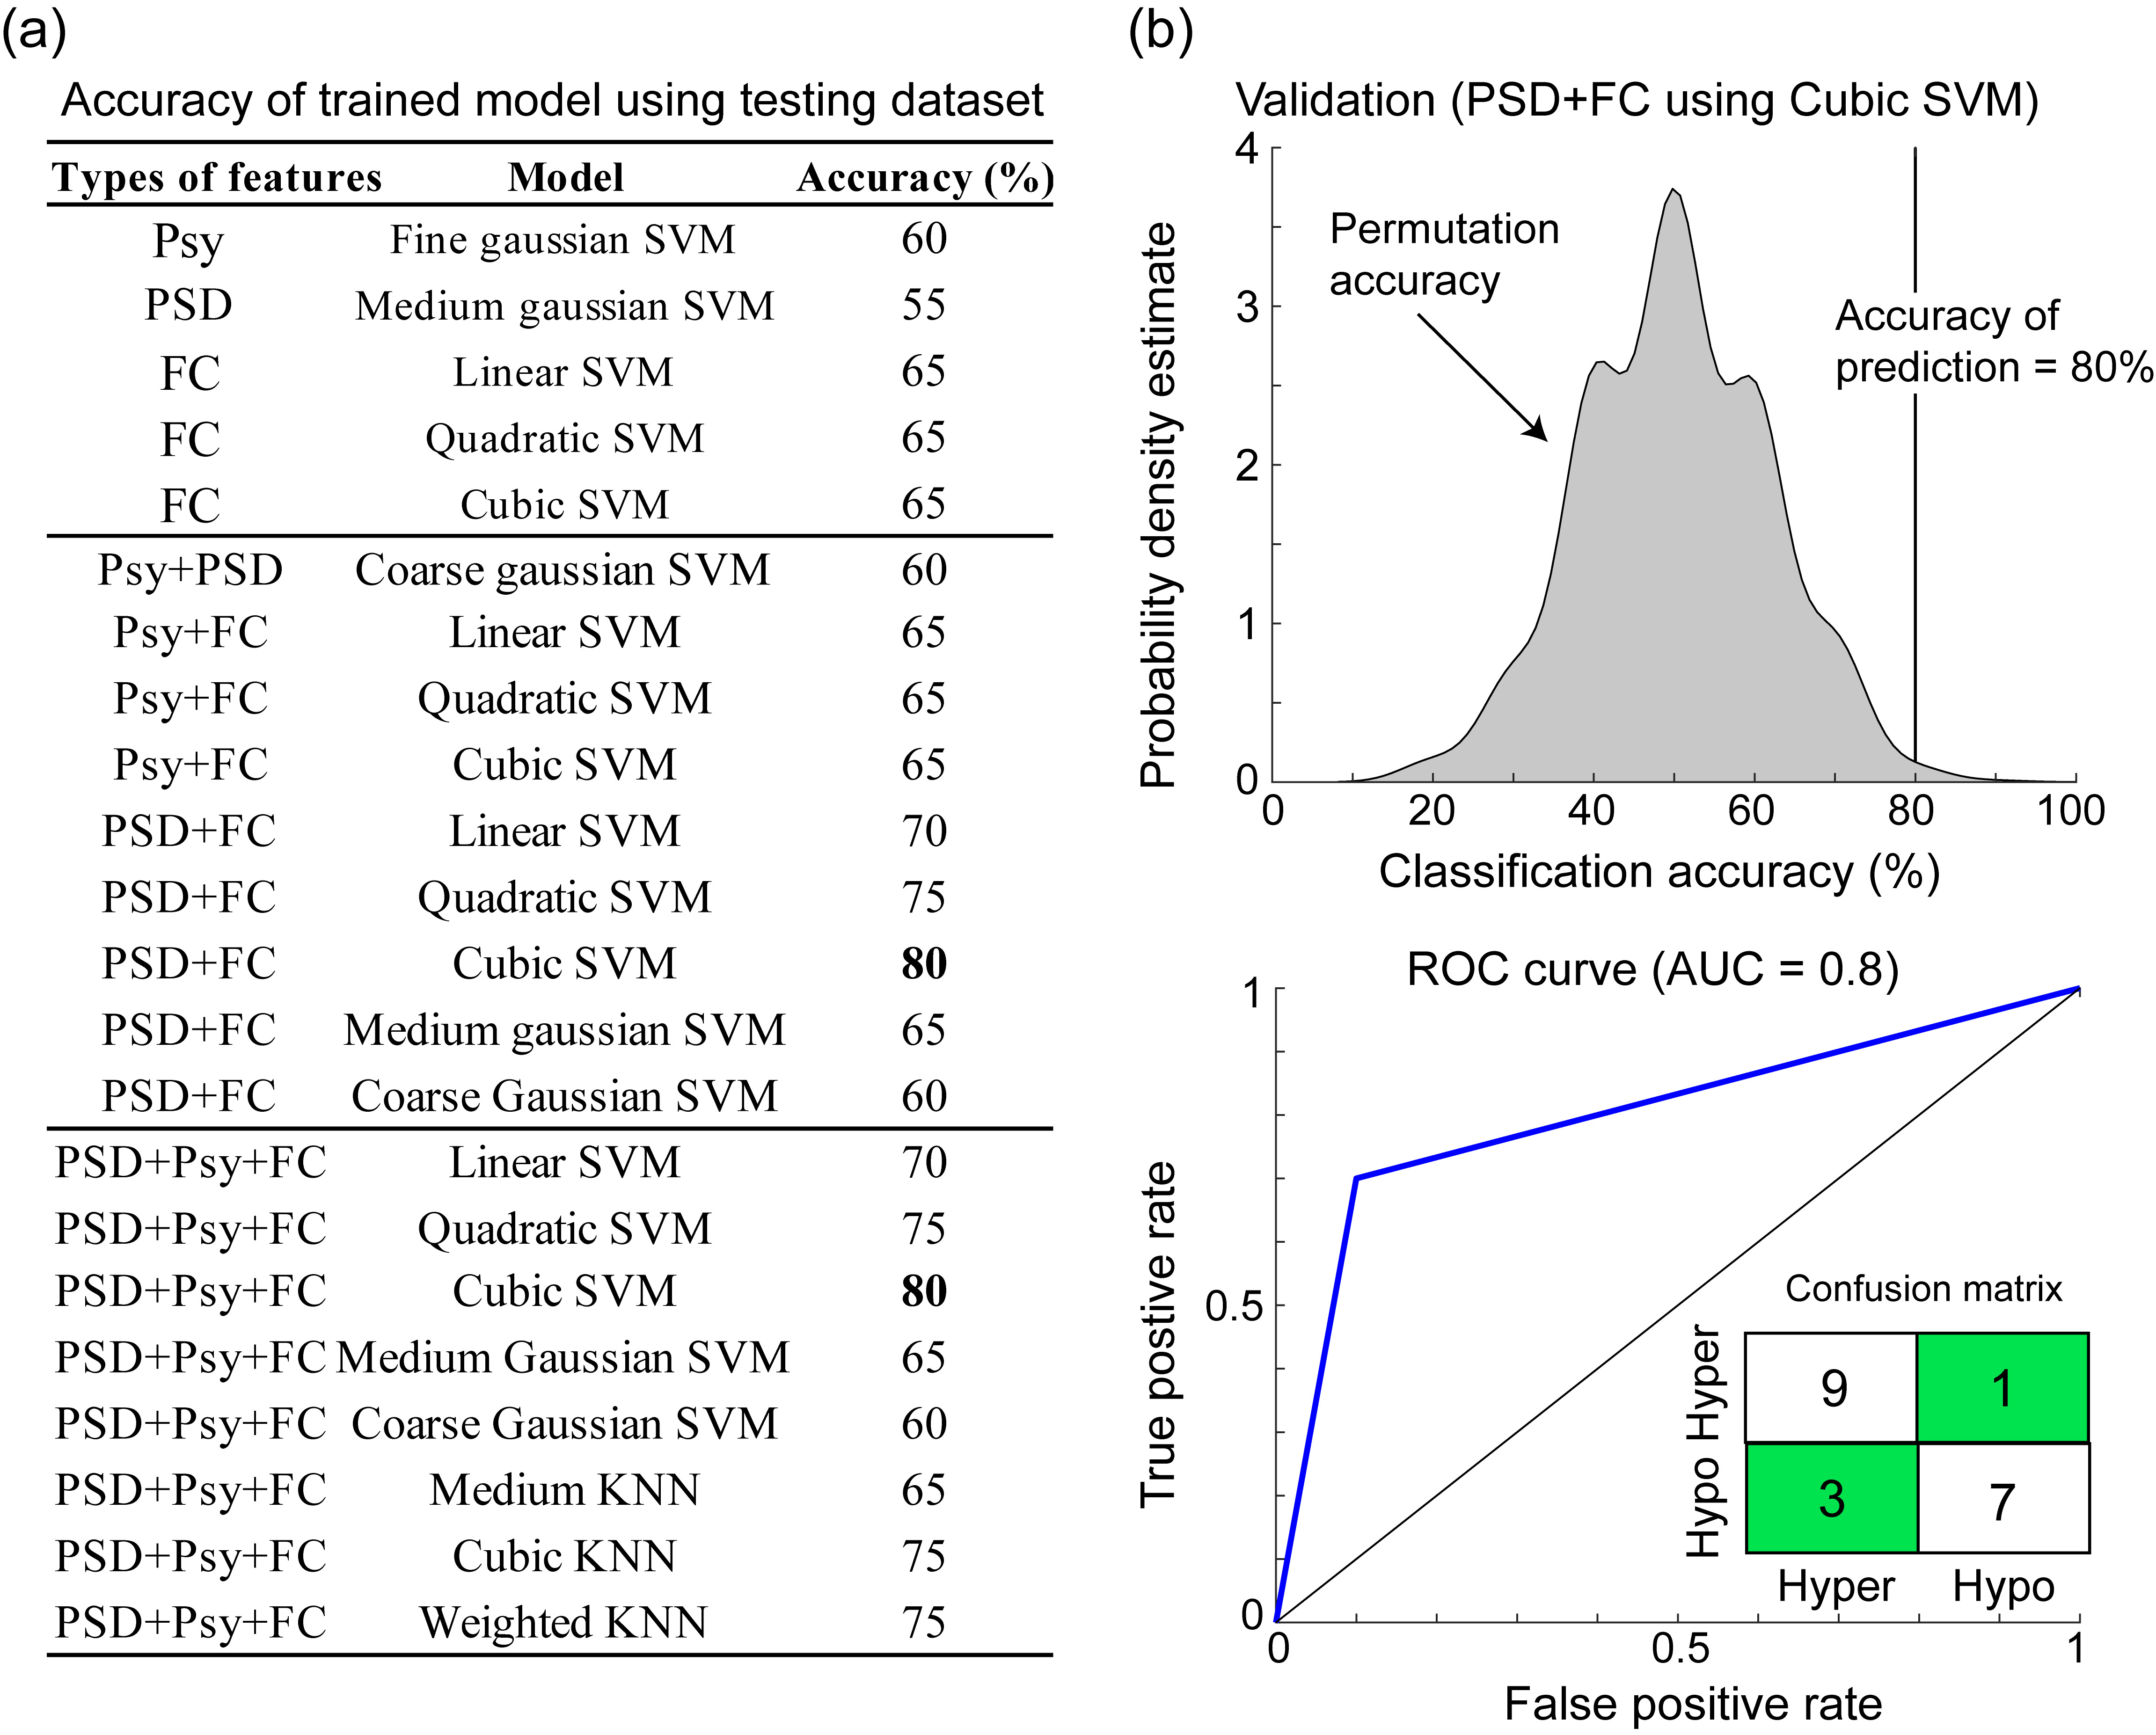 Fig. 7.
Validation of trained models using testing dataset. (a) The accuracy of all trained model using independent testing dataset. (b) Permutation test of accuracy (80%) using cubic SVM (p = 0.001) and the receiver operating characteristic curve (ROC) with AUC of 0.8. Psy, psychometric data; PSD, power spectral density; FC, functional connectivity; SVM, support vector machine; KNN, k-nearest neighbor; AUC, area under the curve; low, low-sensitivity; high, high-sensitivity.
In this study, we identified the resting-state oscillations and functional networks that can serve as brain signatures for the classification between patients with high- and low-sensitivity to heat pain. Using the machine learning algorithms of SVM with different kernels, we obtained an accuracy of 86.2%–93.8% in classifying individuals with thermal pain high-sensitivity or low-sensitivity; moreover, using the trained model of the cubic SVM, an accuracy of 80% was achieved in the prediction of the pain sensitivity of an independent dataset consisting of PSD and FC features obtained from resting-state EEG.
In feature selection, traditional procedures of the independent t test were performed to obtain discriminative features used in classification and validation models. Regarding psychometric scores, individuals with pain high-sensitivity had augmented anxiety and depression scores consistently in prior studies, suggesting a correlation of pain perception threshold with emotional factors [32, 33]. Moreover, heighted PCS was noted in high-sensitive individuals, echoing the notion that catastrophizing might have a significant impact on pain perception [34, 35]. With regards to the features of PSD and FC, differences in oscillatory power and FC distributed among cortical regions had frequency-specific characteristics. This finding was corroborated with oscillations at different frequencies to the routing of information flow of pain processes in the brain [36]. Furthermore, individual pain sensitivity might result from the integration of sensory, affective, and cognitive states, implying that oscillatory connectivity in the multiple functional networks could underpin pain sensitivity [14].
In pain sensitivity classification, using one type of feature, the discriminative features of FC exhibited better accuracy and AUC compared with those of Psy and PSD, indicating FC within multiple networks effectively represent the underlying central pain process mechanism [14]. Moreover, pain sensitivity might involve sensory, affective, and cognitive processes [37]. Features from Psy or PSD could reflect the partial processing of the central pain perceptual mechanism and lead to unsuitable classification of performance. As for the combination of two types of features from psychometrical scores and oscillatory powers, the performance was still unsatisfactory (accuracy of 73.8% and AUC of 0.79), which supported our notion that not the local neuronal oscillatory activities but synchronizations between multiple brain regions were engaged in the underlying mechanism of pain sensitivity. In addition, these findings suggested that emotional factors might not play a dominant role in the regulation of pain sensitivity. Correspondingly, as all the types of features were used in the classification model, the performance was comparable with that of PSD and FC. Notably, in the classification models using two types of features, the SVM model with different kernel functions had satisfactory accuracy and AUC, whereas using all types of features for classification, both SVM and KNN exhibited good performance. These findings could postulate that the SVM model is recommended for establishing the algorithms in identifying pain sensitivity. Taken together, we suggested that pain sensitivity might be classified from the SVM model, particularly using the features of resting-state brain oscillations and FC.
Machine learning is vulnerable to overfitting and may cause confounding with noise or irrelevant features. Hence, in addition to successfully learning the features and classifying the actual data, the models should be used to predict new datasets. Remarkably, in this study, the trained SVM model with PSD and FC features was validated using an independent testing dataset, and the results revealed satisfactory performance (accuracy of 80%) in identifying whether the patient was high-sensitive or low-sensitive. In accordance with the training classification results, this study further confirmed that the features of PSD and FC with cubic SVM algorithm could predict pain sensitivity, and the neurophysiological data could be the pivotal signatures of pain perception processes [14]. Furthermore, this finding is in line with the increased attention of brain-based biomarkers in predictive modeling [38]. Combining multimodal parameters for prediction was suggested to be a compelling approach to pain prediction in clinical practice [39]. In general, the pain sensitivity classification and prediction model established in this study could eventually be applied in clinical practice and could objectively evaluate pain sensitivity without the presence of subjective ratings. Furthermore, although satisfactory accuracy (80%) of the validation, future investigations including the genetic factors [40, 41] or vital signs (heart rate variability or respiration) [42, 43, 44] might further improve the performance.
This study has several limitations. First, this study confirmed that machine learning algorithms could classify and predict individuals with high-sensitivity and low-sensitivity. On the basis of these findings, in future, the regression learning model might be used to examine varied degrees of pain sensitivity in larger samples other than just the classification of high- or low-sensitivity. Second, the generalizability of the present findings to pain sensitivity with respect to other sensory modalities (e.g., cold pain, punctate pain, or pressure pain) remains undetermined, which could be further investigated using a comparative study across sensory modalities. Third, the future investigations of this classification technique on the clinical applications are warranted including the discrimination between those experiencing from not experiencing actual pain, and the evaluation of pain severity. Finally, the predictive model presented in this study must be validated using a large dataset, eventually working toward clinical application.
Neural oscillations and intrinsic functional connectivity from resting-state EEG data could represent the underlying signatures of pain sensitivity. Accurate classification and prediction of pain sensitivity by using the SVM model led to considerable possibilities of objective evaluation of pain perception in clinical practice.
FJH, WTC and SJW conceived and design the work and wrote the article. FJH, WTC, LLHP, HYL, YFW, SPC, KLL and SJW acquired the data. FJH, WTC, LLHP, HYL, YFW, SPC, KLL and SJW analyzed the data and participated in the discussion and provided the comments. All of the authors have read and approved the manuscript.
The Institutional Review Board of National Yang-Ming University approved the study protocol (YM108044F), and each participant provided written informed consent.
We would like to thank the study participants for actively participating. This work was supported by the Brain Research Center, National Yang Ming Chiao Tung University, from the Featured Areas Research Center Program within the framework of the Higher Education Sprout Project by the Ministry of Education of Taiwan.
This work was funded by the Ministry of Science and Technology of Taiwan (MOST 109-2314-B-075 -050 -MY2 to WT Chen, 108-2321-B-010-001, 108-2321-B-010-014-MY2, and 110-2321-B-010-005 to SJ Wang, and 108-2221-E-010-004 and 109-2221-E-003-MY2 to FJ Hsiao).
The authors declare no conflict of interest. SJW reports grants and personal fees from Norvatis Taiwan, personal fees from Daiichi-Sankyo, grants and personal fees from Eli-Lilly, personal fees from Allergan, personal fees from Pfizer, Taiwan, personal fees from Bayer, Taiwan, outside the submitted work.