
- Academic Editor
†These authors contributed equally.
Background: Obesity is a worldwide concern due to its global rapid
expansion and remarkable impact on individual’s health by predisposing to several
other diseases. About twice as many women as men suffer from severe obesity and,
in fact, there are stages in a woman’s life when weight gain and adiposity can
result in greater damage to health. For example, obesity triples the chance of a
woman developing gestational diabetes. Many hormones promote the metabolic
adaptations of pregnancy, including progesterone, whose role in female obesity is
still not well known despite being involved in many physiological and
pathological processes. Methods: Here we investigated whether
progesterone treatment at low dose can worsen the glucose metabolism and the
morpho functional aspects of adipose tissue and pancreas in obese females. Mice
were assigned into four groups: normocaloric diet control (NO-CO), high-fat and
-fructose diet control (HFF-CO), normocaloric diet plus progesterone (NO-PG) and
high-fat and -fructose diet plus progesterone (HFF-PG) for 10 weeks. Infusion of
progesterone (0.25 mg/kg/day) was done by osmotic minipump in the last 21 days of
protocol. Results: Animals fed a hypercaloric diet exhibited obesity
with increased body weight (p
Obesity is characterized by the increased fat accumulation in white adipose tissue (WAT) depots. While the number of cases has almost tripled since 1975 [1] around the world, life expectancy has decreased around 5 to 20 years in obese people [2]. About twice as many women as men suffer from severe obesity, which reveals sex differences in obesity prevalence [3]. The etiology of the disease is complex, involving factors such as increased physical inactivity and high caloric intake [1] that culminate in an imbalance between intake and expenditure of calories [2]. Besides the excessive calorie intake, the quality of calories consumed is also determinant [4] since there is a relationship between chronic consumption of a high-fat and -fructose diet with an increase in body weight, inflammatory status, and insulin resistance [5, 6]. In several countries, the total sugar intake ranges between 14–25% in adults [7].
Individuals with obesity are more likely to be affected by cardiovascular diseases [8], cancer [9], dyslipidemia, diabetes, and insulin resistance [10]. The WAT expansion is accompanied by impaired vascularization, local hypoxia facilitating adipocyte necrosis, fibrosis, and reduced lipid storage capacity, which may result in ectopic fat accumulation in the pancreas, liver, or muscles, leading to insulin resistance [11]. In addition, increased production of inflammatory molecules and decreased secretion of insulin sensitizers such as adiponectin are observed in hypertrophied adipocytes of people with obesity, resulting in damage to the metabolic organs’ functions and control of energy metabolism [12]. Obesity also increases the demand for insulin secretion leading to higher islet area/pancreas area ratio in mice [13] and impairs the islet function inducing apoptosis and disarray in its cells [14]. Chronically hyperglycemia and hyperlipidemia trigger beta cell dysfunction and death [15, 16] and the excess of glucose and lipids in association (glucolipotoxicity) induces progressive beta cell failure in mice [15].
There are stages in a woman’s life when weight gain and adiposity can result in greater damage to health. For example, obesity triples the chance of a woman developing gestational diabetes compared to non-obese women [17]. Pregnancy per se requires metabolic adaptations in the maternal organism, which are orchestrated by several hormones, including progesterone. Besides progesterone’s roles in physiological adaptations of pregnancy [18], including insulin resistance during this period [19], this hormone regulates several cellular processes in other tissues. In that sense, the apoptotic effect of progesterone on beta cells and islets in vitro [20] and its action as an important counter regulator of lactogenic stimulating activity in islets [21] has been shown. In addition, progesterone has also been used as a pharmacological strategy to treat clinical conditions such as assisted reproduction, anovulatory menstrual cycles, contraception during lactation [22] and to prevent preterm birth [23]. In women receiving the oral contraceptive pill, the reduction in insulin sensitivity is attributed to progesterone [24]. On the other hand, estradiol but not progestin treatment, lower plasma very low-density lipoptrotein-triglyceride concentrations by increasing their plasma clearance in healthy postmenopausal women [25]. Although progesterone and adiposity are regulators of glycemic metabolism, the role of progesterone in female obesity is not yet clearly established. Thus, we investigated whether progesterone treatment at low dose can worsen the glucose metabolism and the morpho functional aspects of adipose tissue and pancreas in obese females.
Female post-weaned C57BL/6J mice, obtained from the Medical School of the
University of São Paulo, were assigned into four groups, according to body
weight: normocaloric diet control (NO-CO; n = 11), high-fat and -fructose diet
control (HFF-CO; n = 10), normocaloric diet plus progesterone (NO-PG; n = 8) and
high-fat and -fructose diet plus progesterone (HFF-PG; n = 13). The groups NO-CO
and NO-PG were fed a AIN93G chow (Pragsoluções Biociências, Jaú,
Brazil) and the groups HFF-CO and HFF-PG were fed a AIN93G chow added with
fructose (24%) and lard (31%) (Table 1), that produces a high similarity of
metabolic and hormonal alterations associated with human obesity [26]. The amount
of casein in both diets did not differ, which is in accordance with AIN-93G
rodent diets published [27]. Animals were kept under the same housing conditions
(12 h light/12 h dark cycle, temperature 22
| Normocaloric diet | High-fat and -fructose diet | |
| g/kg of diet | ||
| Cornstarch | 397.5 | 20.0 |
| Casein | 200.0 | 200.0 |
| Dextrinized cornstarch | 132.0 | 20.0 |
| Sucrose | 100.0 | 62.5 |
| Soybean oil | 70.0 | 50.0 |
| Fiber | 50.0 | 50.0 |
| Mineral mixture | 35.0 | 35.0 |
| Vitamin mixture | 10.0 | 10.0 |
| L-cystine | 3.0 | 3.0 |
| Choline bitartrate (41.1% choline) | 2.5 | 2.5 |
| Fructose | 0.0 | 239.0 |
| Lard | 0.0 | 308.0 |
| tert-Butylhydroquinone | 0.014 | 0.014 |
| Kcal/g | 3.90 | 5.34 |
The animals were weighed weekly on a digital scale (Gehaka/model BG4001, São Paulo, Brazil), on the same day and time. In addition to body weight evolution, we calculated body weight gain by the difference between final body weight (week 10) and initial body weight (week 1). The 24 h food intake was determined weekly throughout the study in groups of mice that were housed in the same cage.
In the seventh week of protocol, NO-PG and HFF-PG animals received the subcutaneous implantation of osmotic minipump (model 1004; Alzet, Cupertino, CA, USA) for constant infusion of progesterone in a low dose (0.25 mg/kg/day), diluted in DMSO (100%), for 21 days [28]. For the implantation procedure, animals were anesthetized with ketamine (100 mg/kg body weight) and xylazine (10 mg/kg body weight). The SHAM groups (NO-CO and HFF-CO) underwent the same surgical procedure without the pump insertion. We followed manufacturer’s instructions to measure residual volume inside the pump, thus assessing the correct infusion parameters.
Glucose tolerance test (GTT) and insulin tolerance test (ITT) were performed at week 10 of protocol on awake animals after a 6 hour fast. For GTT, glycemia was determined at 15, 30, 60 and 90 min after intraperitoneal infusion of the glucose load (2 g/kg body weight). After 72 h from the GTT, the ITT was performed with insulin (0.75 U/kg body weight) injected as an intraperitoneal bolus, and glycemia was determined 5, 10, 15, 20, 25 and 30 min after injection. The values obtained between 5 and 30 min were used to calculate the rate constant for plasma glucose disappearance (kITT) according to the method proposed by Bonora et al. [29]. Fasting glycemia was determined from time point 0 of GTT, before glucose infusion. Glucose concentration was determined in tail blood samples using a glucometer (AccuChek Advantage Roche Diagnostics®; Rotkreuz, Zug, Switzerland).
In the last week of the protocol, the animals were acclimated in the Oxylet
Calorimetry System (Panlab, Barcelona, Spain) and measurements were made during
rest. First, the animals were fasted (2 h) and then oxygen consumption volume
(VO
After the rest measurement, the maximal exercise capacity was assessed by a
graded progressive test without inclination until the animal reached exhaustion.
Initial treadmill speed was 0.8 cm/s, increasing by 3 cm/s every 2 minutes, until
the animal could not maintain the running pattern and keep continuous contact
with the shock grid for 5 seconds [30]. VO
Forty-eight hours after the last glycemic test, the animals were killed with an intraperitoneal injection of thiopental sodium (3 mg/100 g body weight), followed by exsanguination. The animal was weighed and then the subcutaneous (inguinal) and visceral (retroperitoneal) white adipose tissue (WAT) pads (subscapular white adipose tissue (SC-WAT) and subscapular white adipose tissue (RP-WAT), respectively), interscapular brown adipose tissue (iBAT), pancreas, liver, kidneys and left ventricle were harvested and weighed. Then, the blood was maintained 30 minutes at room temperature for coagulation until the moment of its centrifugation at 4 °C and 12.000 rpm for 10 minutes. Aliquots of serum were stored in freezer –80 °C for adiponectin analysis.
Serum adiponectin concentration was determined in duplicate using enzyme-linked immunosorbent assay (ELISA) kit, following the manufacturer’s guidelines (RAB1115 — Sigma, St Louis, MO, USA). Results were normalized by total serum protein determined by the BCATM protein assay kit (ThermoFischer Scientific, Waltham, Massachusetts, USA).
The morphology of adipocytes was measured on paraffin sections of SC-WAT and
RP-WAT (3 µm) stained with hematoxylin and eosin (Sigma-Aldrich, St.
Louis, Missouri, USA). Digital images from 50 adipocytes per animal were obtained
using a light microscope (Axio. A1 Observer, Zeiss, Jena, Germany) at
400
Additionally, three sequential sections (5 µm) of the splenic
portion of pancreas were included in paraffin and subsequently stained with
hematoxylin and eosin. The images of pancreatic islets and pancreas were acquired
in a digital light microscopy (Axio observator. A1, Zeiss, Jena, Germany), at
400
Pancreatic islets were isolated by the collagenase digestion method, as previously described by Lacy and Kostianovsky [36]. In short, after distension via pancreatic duct injection of Hanks solution added with 0.07% collagenase (type V), pancreas was removed and digested in a shaking water bath at 37 °C. Pancreatic islets were isolated from animals of all experimental groups and used in the static insulin secretion.
Groups of 10 isolated islets were pre-incubated for 30 min at 37 °C in 500 µL of Krebs-Henseleit solution (KH) containing 0.2% bovine serum albumin and 2.8 mM glucose. Subsequently, the islets were incubated for 60 min in KH (0.2% albumin) plus 5.6- or 16.7-mM glucose. After incubation, the solution was frozen at –20 °C for subsequent measurement of islet insulin secretion. For total insulin content, islets were disrupted in an alcohol-acid HCl aqueous solution (52 ethanol: 17 water; 1 hydrochloric acid v/v), sonicated (three pulses of 5 s) to release the insulin content inside the islets, and the islet lysate solution was also frozen at –20 °C [37]. These samples of insulin secretion and insulin content were measured by enzyme-linked immunosorbent assay (ELISA) using a commercial kit (Millipore Corporation, Billerica, USA). Results are expressed as the ratio of insulin secretion/insulin content
All values are expressed as mean
All animals started the protocol weighing around 16 g, without statistical
difference. Hypercaloric diet efficiently increased body weight compared to
normocaloric diet (p
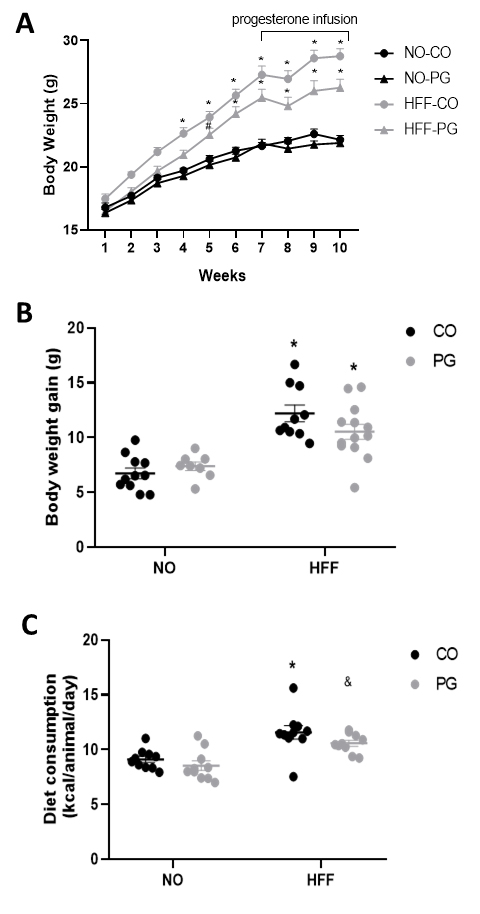 Fig. 1.
Body weight and diet consumption. (A) Body weight evolution,
(B) Body weight gain, and (C) Diet consumption (kcal/animal/day). Data are
presented as means
Table 2 shows the weights of tissues and organs corrected by the body weight
measured at the time of death procedure. The weight of SC-WAT and RP-WAT were
higher in HFF-CO and HFF-PG compared with NO-CO and NO-PG groups (p
| NO-CO | NO-PG | HFF-CO | HFF-PG | |
| SC-WAT (mg/g) | 19.41 |
17.95 |
37.56 |
30.25 |
| RP-WAT (mg/g) | 4.63 |
4.55 |
12.47 |
12.79 |
| iBAT (mg/g) | 2.91 |
3.33 |
2.58 |
2.22 |
| Pancreas (mg/g) | 20.14 |
23.05 |
20.40 |
16.65 |
| Liver (mg/g) | 49.04 |
47.69 |
35.97 |
37.54 |
| Kidneys (mg/g) | 9.96 |
9.78 |
7.91 |
7.77 |
| Left Ventricle (mg/g) | 3.16 |
3.16 |
2.56 |
2.77 |
Data are presented as mean
For SC-WAT, RP-WAT, iBAT, liver, kidneys and left ventricle: NO-CO (n = 11), NO-PG (n = 8), HFF-CO (n = 10), HFF-PG (n = 13). For pancreas: NO-CO (n = 7), NO-PG (n = 3), HFF-CO (n = 7), HFF-PG (n = 9).
NO-CO, normocaloric diet control; NO-PG, normocaloric diet plus progesterone; HFF-CO, high-fat and -fructose diet control; HFF-PG, high-fat and -fructose diet plus progesterone; SC-WAT, subscapular white adipose tissue; RP-WAT, subscapular white adipose tissue; iBAT, interscapular brown adipose tissue.
Through the analysis of metabolic parameters at rest performed by indirect
calorimetry, we observed that the values of VO
| Resting | NO-CO | NO-PG | HFF-CO | HFF-PG |
| VO |
34.77 |
35.16 |
37.28 |
32.59 |
| VCO |
27.15 |
28.33 |
23.90 |
27.01 |
| RER | 0.78 |
0.80 |
0.71 |
0.85 |
| EE (kcal/kg/day) | 244.43 |
246.80 |
234.21 |
226.38 |
| CHO oxidation (mg/min/kg) | 75.61 |
69.06 |
110.01 |
61.60 |
| Lipid oxidation (mg/min/kg) | 14.40 |
11.42 |
22.35 |
9.33 |
| Running test | ||||
| Exercise performance (min) | 24.25 |
27.25 |
23 |
23.43 |
| Max. velocity (cm/s) | 31.25 |
36.13 |
29.75 |
29.86 |
| VO |
53.03 |
47.95 |
43.57 |
42.83 |
| VCO |
47.23 |
47.20 |
39.56 |
38.53 |
| RER | 0.89 |
1.05 |
0.93 |
0.91 |
| iVO |
29.86 |
34.44 |
28.29 |
29.46 |
| EE (kcal/kg/day) | 375.12 |
345.73 |
326.4 |
303.67 |
| CHO oxidation (mg/min/kg) | 89.70 |
66.66 |
71.25 |
71.21 |
| Lipid oxidation (mg/min/kg) | 9.69 |
1.25 |
6.69 |
7.18 |
Data are presented as mean
VO
The HFF-CO and HFF-PG groups exhibited significantly higher fasting glycemia
(HFF-CO: 143.10
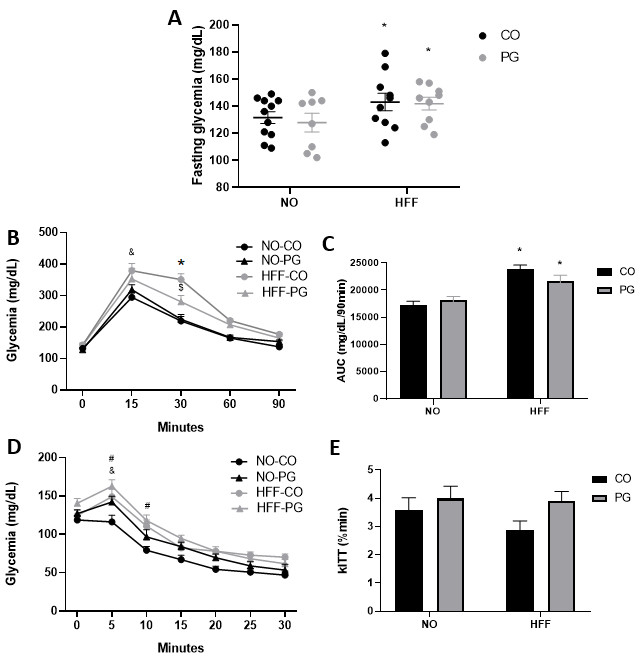 Fig. 2.
Glycemic Metabolism. (A) Fasting glycemia. (B)
Glycemic Curve obtained in glucose tolerance test (GTT). (C) Area under curve.
(D) Glycemic Curve obtained in insulin tolerance test (ITT), and (E) kITT. Data
are presented as means
Morphometric analysis of RP-WAT by histology slides stained with hematoxylin and
eosin (Fig. 3A) showed that adipocytes area from the HFF-CO and HFF-PG groups
were, respectively, 141.2% and 130.5% larger than NO-CO and NO-PG groups
(p
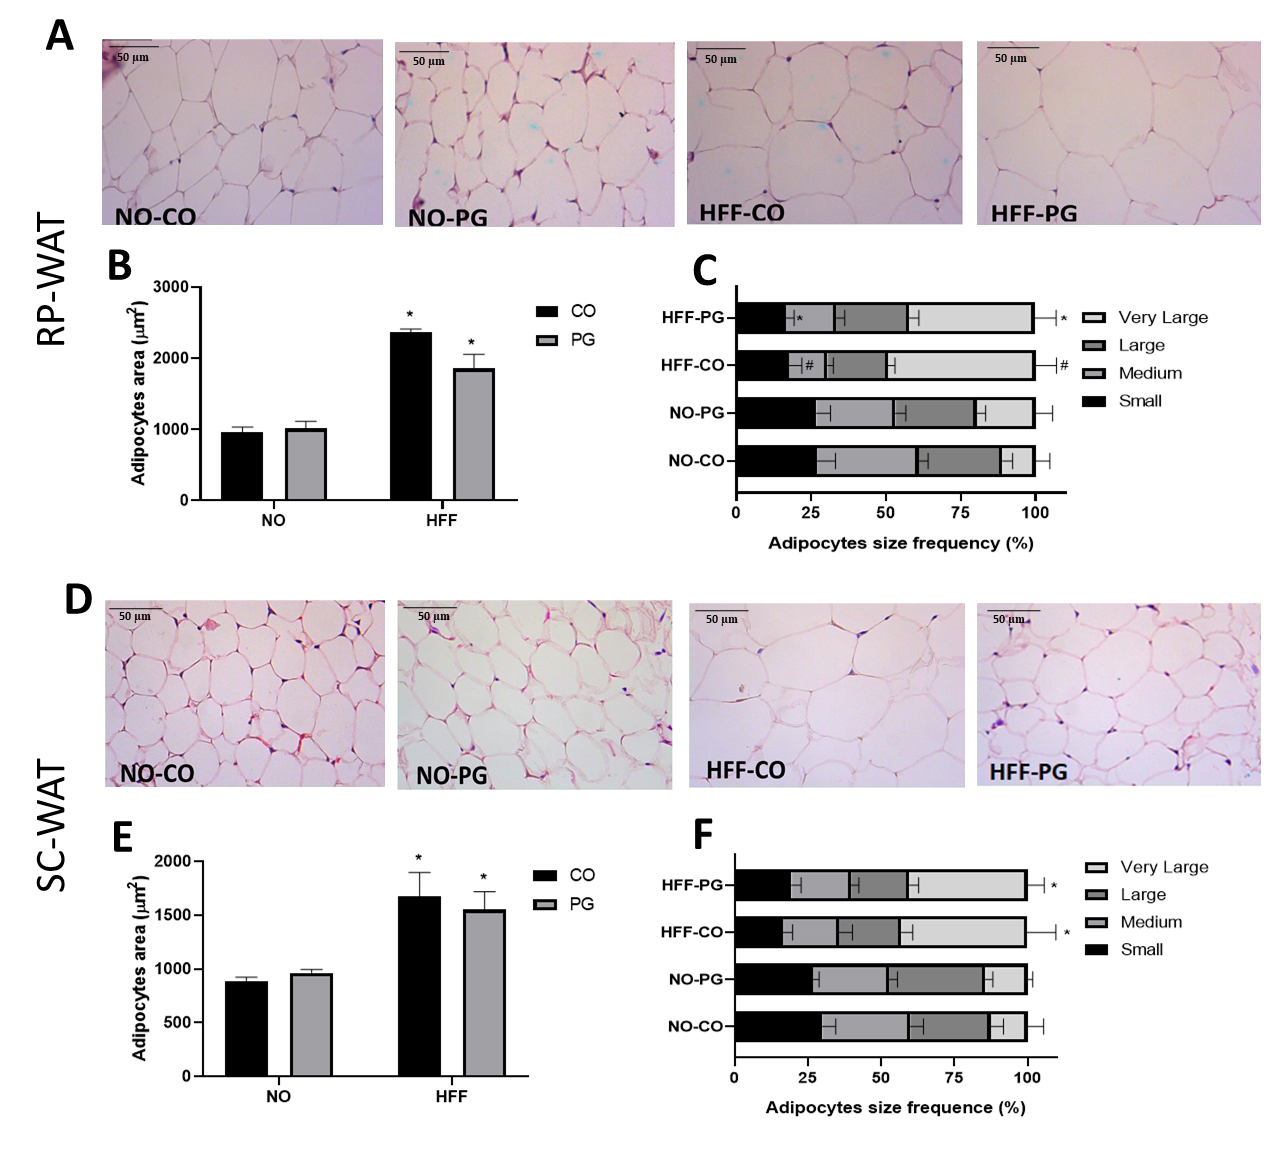 Fig. 3.
Histological analysis of adipose tissue. (A) Representative
photomicrographs of histological sections of RP-WAT stained with hematoxylin and
eosin (400
| RP-WAT | NO-CO | NO-PG | HFF-CO | HFF-PG |
| Diameter (µm) | 36.36 |
38.03 |
50.77 |
48.99 |
| Volume (pL) | 35.27 |
42.42 |
102.81 |
95.28 |
| Mass (µg) | 0.03 |
0.04 |
0.09 |
0.09 |
| Adipocyte number | 1.6 |
1.6 |
1.6 |
1.7 |
| SC-WAT | NO-CO | NO-PG | HFF-CO | HFF-PG |
| Diameter (µm) | 31.51 |
33.10 |
43.60 |
41.85 |
| Volume (pL) | 22.91 |
25.95 |
52.29 |
48.58 |
| Mass (µg) | 0.02 |
0.02 |
0.05 |
0.04 |
| Adipocyte number | 11 |
9 |
9 |
9 |
Data are presented as mean
For RP-WAT: NO-CO (n = 7), NO-PG (n = 5), HFF-CO (n = 8), HFF-PG (n = 8). For SC-WAT: NO-CO (n = 8), NO-PG (n = 6), HFF-CO (n = 5), HFF-PG (n = 8).
Serum adiponectin concentration was lower in HFF groups than NO groups
(p
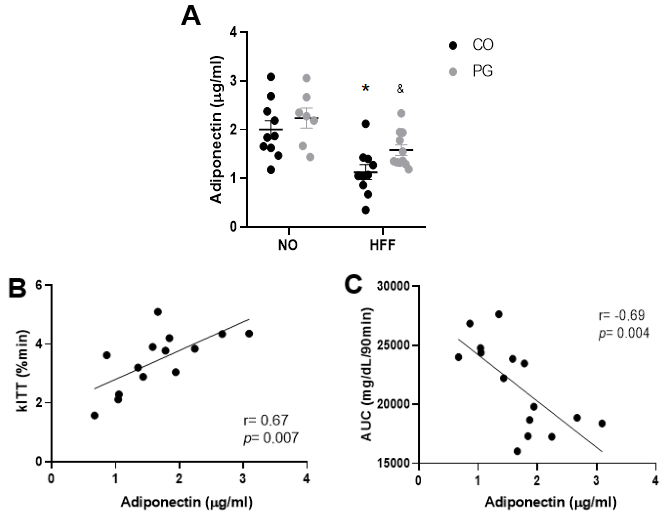 Fig. 4.
Adiponectin and glucose metabolism. (A) Serum
adiponectin concentration, (B) Correlation of adiponectin and kITT and (C)
Correlation of adiponectin and AUC. Data are presented as means
Representative pancreatic tissue of the four groups stained with hematoxylin and
eosin for morphometric measurements of the islets are shown in Fig. 5A. The total
area of the pancreatic islets was not statically
different among groups (Fig. 5B), not even when we normalized this variable by
the total area of the pancreas (islet/pancreas ratio) (Fig. 5C). Additionally, no
significant difference was observed in the percentage of islets
considered small, medium, large and very large in the pancreas of animals in each
group (Fig. 5D). Table 5 summarizes some other morphometric parameters measured
in pancreatic islets such as number of islets/mm
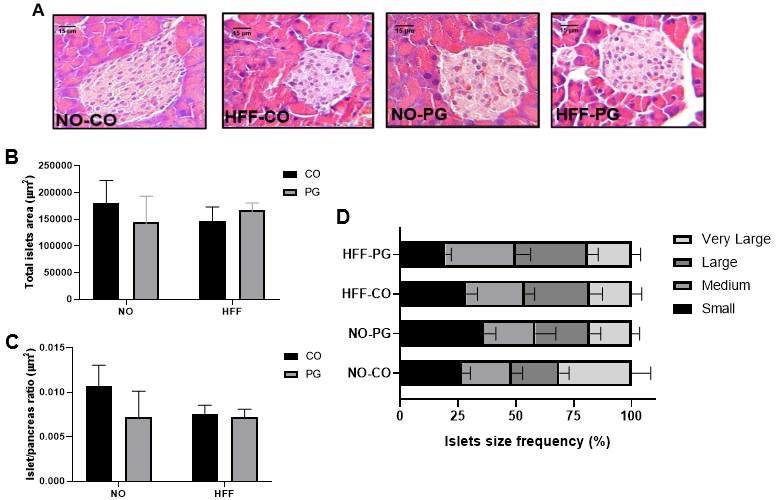 Fig. 5.
Histological analysis of pancreas. (A) Representative
photomicrographs of histological sections of pancreatic islets stained with
hematoxylin and eosin (400
| NO-CO | NO-PG | HFF-CO | HFF-PG | |
| Islets/mm |
1.21 |
1.04 |
1.11 |
1.08 |
| Perimeter (µm) | 328.29 |
276.98 |
294 |
293.84 |
| Minor Axis (µm) | 75.67 |
71.61 |
70.48 |
72.46 |
| Major Axis (µm) | 114.95 |
92.74 |
100.09 |
100.65 |
| Aspect Ratio | 1.54 |
1.34 |
1.45 |
1.40 |
| Circularity | 0.79 |
0.84 |
0.81 |
0.83 |
Data are presented as mean
To obtain a clear picture of WAT and pancreatic islets dynamics, we correlated morphometric parameters from these tissues of the four groups and a positive correlation was found between islet/pancreas ratio to RP-WAT adipocytes area, RP-WAT adipocytes volume and RP-WAT adipocytes mass (Fig. 6). No correlation was found in SC-WAT and pancreatic islets parameters.
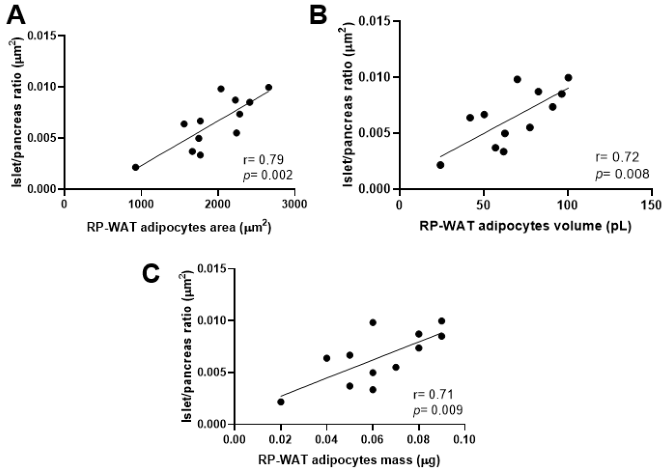 Fig. 6.
Correlations of islet/pancreas ratio and RP-WAT morphometry. (A) Correlation of islets/pancreas ratio and adipocytes area. (B) Correlation of islets/pancreas ratio and RP-WAT adipocytes volume and (C) Correlation of islets/pancreas ratio and RP-WAT adipocytes mass. Data were analyzed by Pearson’s correlation test.
Fig. 7A shows that islets incubated with basal glucose concentration (5.6 mM)
did not present significant difference in insulin secretion. When islets were
incubated at high glucose concentration (16.7 mM), the hypercaloric diet
abolished glucose-stimulated insulin secretion, even in HFF-PG group (p
= 0.03; Fig. 7B). In that scenario, we investigated which factors could be
associated with this reduced insulin secretion, and the correlation analysis with
all groups showed that insulin secretion/insulin content reduces according to
SC-WAT adipocytes area (Fig. 7D). Although, in this study, we did not find a
positive correlation between glucose-stimulated insulin secretion and serum
adiponectin concentration (p = 0.07) (Fig. 7C), this correlation was
obtained by Nakamura et al. [38] in a study with humans that illustrates
the complex crosstalk between pancreatic
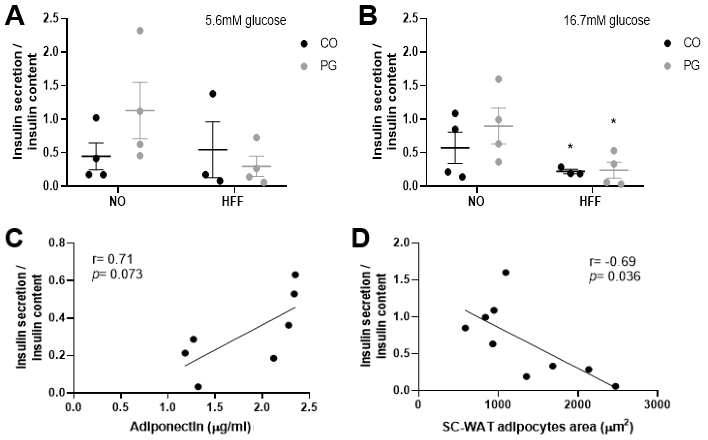 Fig. 7.
Insulin secretion analysis. (A) Insulin
secretion/insulin islets content after islets incubation with 5.6mM glucose. (B)
Insulin secretion/insulin islets content after islets incubation with 16.7mM
glucose. (C) Correlation of insulin secretion/insulin content in 16.7 mM and
adiponectin and (D) Correlation of insulin secretion/insulin content in 16.7 mM
and SC-WAT adipocytes area. Data are presented as means
Obesity, increasingly prevalent in women of reproductive age, can be especially harmful at certain stages of a woman’s life, such as pregnancy. We studied the morpho functional aspects of adipose tissue and pancreas of obese female mice treated with low dose of progesterone, and we did not observe any change at this dose in body weight gain, adiposity or adiponectin secretion, nor in morphometry of islets, except in circularity, that was improved in HFF-PG group. Although fasting glycemia did not change among HFF-CO and HFF-PG groups, the results from the glycemic curve in GTT and AUC revealed that progesterone treatment attenuated glucose intolerance induced by hypercaloric diet in HFF-PG group.
Hervey and Hutchinson [39] showed that infusion of progesterone (5 mg/day)
increased female rat body weight, with greater amounts of corporeal water and
fat. In turn, Holmberg et al. [40] found that repeated exposure to 20
mg/kg of allopregnanolone (a progesterone metabolite that has been implicated in
evoking hyperphagia), over 5 days induced body weight gain in rats fed on a
high-fat diet. Here, progesterone (0.25 mg/kg/day) did not worsen body weight
gain and adiposity induced by hypercaloric diet in HFF-PG group, possibly due to
the lower concentration of the hormone used in the treatment. The body weight
gain is a result of the energy balance, which is determined by the difference
between energy intake and energy expenditure. Considering that HFF-CO and HFF-PG
groups had higher daily caloric consumption, and that resting energy expenditure
measured by indirect calorimetry (VO
Obesity is associated with chronic inflammatory state, metabolic dysfunction,
and increased cardiovascular risk [12]. Low levels of cardiorespiratory fitness
have been associated with higher risk of morbidity and mortality from chronic
degenerative diseases, including coronary artery disease, systemic arterial
hypertension, diabetes mellitus type 2 and some types of cancer [41]. In our
study, we found that HFF-CO and HFF-PG groups showed reduction in aerobic
capacity as measured by VO
The hypercaloric diet consumption impaired the glycemic metabolism as demonstrated by greater fasting glycemia in the HFF-CO and HFF-PG groups. However, contradicting previous evidence that progesterone induced insulin resistance [43, 44], our results showed that progesterone treatment attenuated glucose intolerance induced by obesity in the HFF-PG group. A study with ovariectomized diabetic rats showed that the animals lose insulin sensitivity progressively, however, when these animals received progesterone their insulin sensitivity was higher than in the non-hormone-treated groups. However, at the end of the experiment, high doses of progesterone drastically reduced such sensitivity in these female diabetic rats [45], showing a possible dose-dependent effect of progesterone. In the present study, despite we did not measured progesterone level after the treatment, we used progesterone infusion rate (0.25 mg/kg/day) based on previous study [28], which was considerably lower compared to dosages used in other studies such as 5, 10 or 20 mg/kg [40] and 3 mg/kg of progesterone [44]. Together, these results suggest that it is essential to consider the progesterone concentration when thinking about its effects on glycemic metabolism.
The increased RP-WAT and SC-WAT adipocytes area, diameter, and mass in the HFF-CO and HFF-PG groups, without change in adipocyte number, reveals that the higher adiposity was due to hypertrophy and not hyperplasia of adipocytes. In fact, when the adipocyte size was distributed into quartiles, the frequency of very large adipocytes was higher in RP-WAT and SC-WAT in both HFF-CO and HFF-PG groups. It has been shown that progesterone stimulates fat storage in females [46]. In addition, it is known that insulin and the adipokine acylation-stimulating protein (ASP) are the most potent fat storage hormones [47]. Thus, the non-worsening of adiposity in HFF-PG may be explained by the ASP resistance induced by obesity. This is supported by the fact that ASP levels follow the progesterone levels in eutrophic women [47]; that, in obese females ASP levels were higher than in obese males [48], and that high levels of ASP may also reflect ASP resistance as observed during pregnancy [47, 49]. Further studies are still necessary to clarify this issue.
There is a remarkable predisposition to insulin resistance and
In face of insulin resistance, pancreatic
Gonzalez et al. [55] studying female mice observed rises in
Taken together, our results showed that a low dose of progesterone does not worsen the effects of hypercaloric diet in glycemic metabolism, morphology and function of adipose tissue and pancreatic islets in female animals. These results may improve the understanding of the mechanisms underlying the pathogenesis of obesity in women and eventually open new avenues for therapeutic strategies and better comprehension of the interactions between progesterone effects and obesity.
Datasets used and/or analyzed for this study are available from the corresponding author upon appropriate request.
MPS was responsible for the accompaniment and treatment of the animals, glycemic tests, calorimetry tests, analyses related to the pancreas, article writing and corrections to the publication. LFRC was responsible for the accompaniment and treatment of the animals, glycemic tests, calorimetry tests, analyses of adipose tissues, and article writing. MMF was responsible for the accompaniment and treatment of the animals, glycemic tests and calorimetry tests. LFM assisted with the glycemic tests, animal death procedure, and samples collection. BV performed calorimetry tests. EAVB performed islet isolation and insulin secretion assay. ALVA contributed to implantation of mini-pumps and dosage of insulin and adiponectin by ELISA. ROP collaborated to obtain the histology results, contributing with the methodological adjustments to each type of tissue and discussing the results obtained in the process. MMR contributed to the diet elaboration and data discussion. PF supported in histology analyses and discussion of the experimental design. FSE contributed in project elaboration, experimental design, data discussion, manuscript revision and corrections to the publication. AKAM was responsible for obtaining financial support, experimental design conception, data discussion, and writing and revision of the manuscript. All authors contributed to editorial changes in the manuscript. All authors read and approved the final manuscript. All authors have participated sufficiently in the work to take public responsibility for appropriate portions of the content and agreed to be accountable for all aspects of the work in ensuring that questions related to its accuracy or integrity.
The animal study was reviewed and approved by Ethics Committee of School of Arts, Sciences and Humanities of University of São Paulo (protocol number 003/2018).
We thank Professors Angelo R. Carpinelli and José E. Krieger for providing laboratory support. Likewise, we would like to thank Isabel Marques and Fernanda Barrence for their technical support, and Cynthia Walser for the careful review of the English in this manuscript.
This study was supported by São Paulo Research Foundation (FAPESP) under the process number 18/22361-9.
The authors declare no conflict of interest.
Publisher’s Note: IMR Press stays neutral with regard to jurisdictional claims in published maps and institutional affiliations.