
- Academic Editor
Background: Acute kidney injury (AKI) is a leading cause of early
post-transplant kidney damage. Furthermore, acute tubular necrosis (ATN) is
appointed as the most prevalent form of AKI, a frequent multifactorial process
associated with high morbidity and mortality, yet giving rise to delayed graft
function (DGF) and, ultimately, allograft dysfunction. Common factors such as
prolonged cold ischemia time, advanced donor age, cadaveric versus living donor,
donor history of hypertension, as well as donation after cardiac death have all
been deemed risk factors for ATN. With the increasing number of older cadaveric
and cardiac donors in the donation process, ATN could have a detrimental impact
on patient welfare. Therefore understanding the underlying process would benefit
the transplant outcome. We aimed to prospectively monitor several T cell subsets
in a cohort of kidney transplant recipients (KTrs) to investigate whether there
is an adaptive immune-mediated involvement in the ATN process. Methods:
Peripheral blood was collected from 31 KTrs at different time points within the
first-year post-transplantation for in vitro stimulation with
Concanavalin-A (Con-A) in a humidified 5% CO
Kidney transplantation has become a routine procedure to rescue patients with end-stage renal disease (ESRD), resulting in good overall one-year survival [1, 2, 3]. However, despite the continuous improvement in the clinical management of kidney transplant (KT) recipients (KTrs), acute kidney injury (AKI) remains a common cause of post-transplant kidney damage in this population. The most common cause of AKI is acute tubular injury (ATI), a frequent multifactorial process following KT. Biopsies obtained one-week after transplantation often show widespread tissue damage causing detachment of the basement membrane and tubular dysfunction with typical signs of denuded tubules with mitotic figures, that in most cases resolve thanks to the high regenerative ability of the kidney [4, 5]. However, little is known about the relationship between histological parameters of acute renal damage and transplant outcome. However, it has been directly linked with delayed graft function (DGF) after renal transplantation [6, 7], and to some extent, the morphological characteristics of ATI immediately after KT correlates with graft function following DGF recovery [5]. Nevertheless, this arsenal of traditional diagnostic and clinical tools provides little to no information about the cause. However, the higher incidence of ATN in pre-sensitised re-transplanted patients has led to the hypothesis that, in some cases, DGF may be mediated by an immunological insult [8, 9, 10].
Several factors can trigger ATI, some of which are directly associated with both donors as well as organ retrievals, such as a prolonged cold ischemia time, older donor age, cadaveric vs. life donor, donor history of hypertension, donor serum creatinine levels (dsCr), or donation after cardiac death [11, 12, 13]. The main clinical manifestation in patients suffering post-transplant ATI is oliguria, which in some cases may require dialysis for a certain period (several days to months).
Traditionally studies have determined ATN as a relatively innocent complication of renal transplantation; therefore, recommendations were to avoid discarding kidneys in patients that might suffer from this complication as the medical community did not find a rise in mortality nor allograft loss in patients [14], albeit more recent research in this field has shown otherwise. Indeed, ATN might not, by itself, jeopardise the short- and long-term outcome of transplantation. However, some forms of acute injury of the graft may eventually cause other complications such as graft rejection, fibrosis, and even graft dysfunction [15, 16]. In this scenario, it is important to discover what pathogenic mechanisms are involved in acute tubular damage to propose them as surrogate markers of transplant outcome or even use them as potential therapeutical targets to diminish the deleterious effect they may cause.
Few biomarkers can be used to predict early post-transplant DGF, of which dsCr stands as the primary; though useful, it is otherwise unspecific on its own. Recent research has attempted to address the scarcity of its specificity by bringing in other biomarker technologies ranging from molecular biology to soluble plasma proteins covering both donor and recipient characteristics. In this instance, albeit donor-derived cell-free DNA (dd-cfDNA) proved its feasibility unequivocally as a surrogate biomarker for the diagnosis of active as well as subclinical kidney rejection [17, 18, 19, 20], it failed to accomplish identifying patients with either DGF or ATI [21, 22]. In contrast, a few studies have indicated that donor factors can be used as predictors of DGF. In this case, donors’ immune-derived mediators such as interleukin 2 (IL-2) along with terminal serum creatinine and blood glucose levels showed, in a recent study conducted by Zhao S. et al. [23], an average positive predictive value to DGF. Furthermore, other molecules indicative of tubular injury were eventually tested as surrogate markers of DGF both at the expression level using the recipient’s protocol renal biopsies (mRNA-based studies) and in their soluble/secreted forms in peripheral blood/urine, respectively. Donors’ urinary levels of neutrophil gelatinase-associated lipocalin (NGAL), liver-type fatty acid-binding protein (L-FABP), interleukin 18 (IL-18), and kidney injury molecule 1 (KIM-1) were assessed at the time of organ procurement. Although NGAL was the only marker showing higher sensitivity and specificity to diagnose severe ATI, its discriminatory values were modest [24]. Nevertheless, all these donor proteins showed differential expression and, more importantly, their levels do not respond equally to all forms of stimuli, thus triggering different biological pathways [24, 25], which may allow a more accurate definition of AKI.
Many studies have been conducted to understand the poor sensitivity and specificity values that sCr levels display assessing early post-transplant kidney damage. The current trend in this topic focuses on the donor, and despite all the efforts, the utmost tested markers have shown minimal capacity in the diagnosis of either DGF or ATI thus far.
Currently, there is an increasing number of cadaveric non-heart-beating donors, which might incorporate known risk factors that could increase the incidence of DGF. As AKI will have a detrimental impact on patients’ post-transplant outcomes, it is importance to determine putative biomarkers capable of predicting the occurrence of ATI in recipients rather than donors. The recipient’s immune response to the graft is pivotal, delivering long-lasting organ survival and better transplant outcomes. Thus far, acute rejection (AR) reflects the gold alloimmune process conditioning graft survival, and therefore, to date, the vast majority of research focuses on the patient alloresponse against the graft to elucidate this phenomenon. However, current research has not focused on the patient immune responses implicated in the development of post-transplant ATN.
Recently, our group reported that liver transplant recipients who developed
acute cellular rejection (ACR) within the first-month post-transplant had a
significant increase of percentages from two different subsets of activated T
lymphocytes than those with stable graft function. Indeed, as liver recipients
who reject showed higher percentages of activated CD4
To this purpose, our group concentrated on the recipient’s immune system
throughout the implementation of a functional assay allowing us to characterise
several T lymphocyte subsets following in vitro stimulation that could
meet our primary hypothesis of this research, specifically, recipient’s T
lymphocytes mediate reactions to the graft leading to post-transplant ATN. This
functional assay can assess the activation status of both CD4
This novel approach was applied in this study to prospectively monitor the
recipient’s CD4
The primary endpoint of this study was to investigate whether, in the course of DGF, due to ATN, there is an immune-mediated insult to the allograft delivered by the recipient’s T lymphocytes. To this purpose, we established the biopsy-proven diagnosis of ATN following transplantation in KTrs as the clinical outcome of DGF.
Thirty-one consecutive first-time KTrs were enrolled in this unicentre prospective observational study at the Immunology Department of the Clinical University Hospital “Virgen de la Arrixaca” (HUVA) in Murcia, Spain. Additionally, 17 healthy volunteers were also included as controls. For patients and control subjects, a sample consisting of 10 mL of whole peripheral blood was drawn in a sodium heparin container by venipuncture phlebotomy. This protocol of blood extraction was followed at different time points within the first-year post-transplantation (first and second-week; first, second, third and sixth-month; first-year) as shown in Fig. 1. Socio-demographic data (age, sex) from donors and recipients, alongside clinical, pathological and immunological data were collected in a unified database. Post-transplant complications were also registered (AR, opportunistic infections).
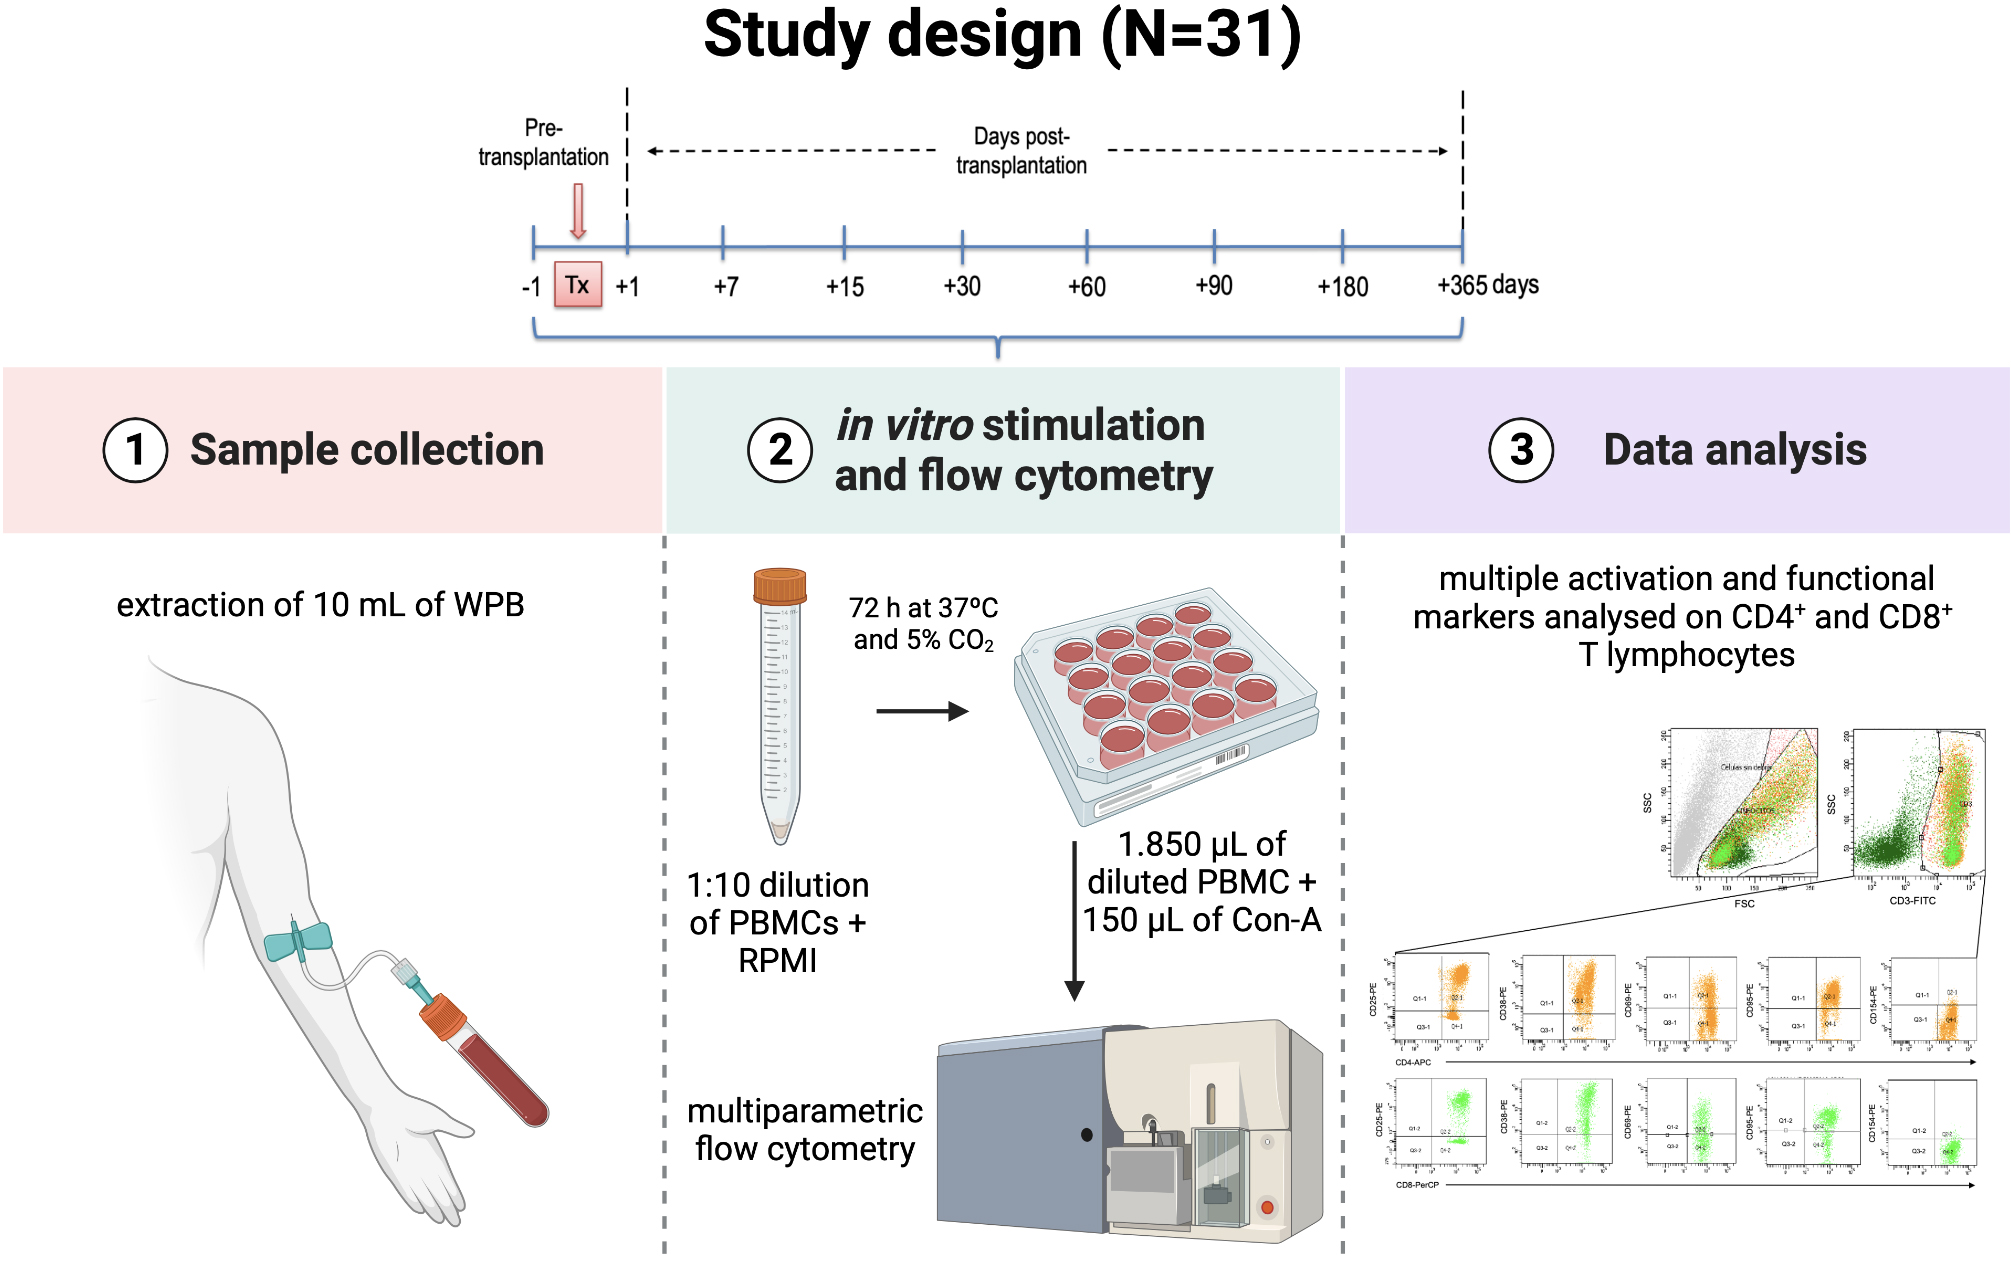 Fig. 1.
Study design. Kidney transplant recipients enrolled in this prospective observational study were appointed for sample collection at different time points during the first-year post-transplantation. Following blood extraction, samples were activated in vitro using polyclonal stimulus to assess T lymphocytes for several surface markers using multi-parametric flow cytometry.
Inclusion criteria for participation in the study were as follows: ABO match, first-time kidney transplant, immunosuppressive therapy based on tacrolimus (TRL) with or without mycophenolate mofetil (MMF), as well as HIV-negativity. Paediatric, re-transplant, or simultaneous kidney-pancreas or liver-kidney transplant patients were excluded.
All patients gave informed consent for their samples to be manipulated and stored for current and future research before recruitment to the study. The study was conducted following the Declaration of Helsinki, and the protocol was approved by the Ethics Committee of the Clinical University Hospital “Virgen de la Arrixaca” (HUVA) (PI15/01370).
Patients enrolled in this study were prospectively monitored for percentages of
CD4
Upon in vitro stimulation, cell cultures were prepared for multi-colour
stain using a combination of mouse anti-human monoclonal antibodies (MoAb) (BD® Biosciences BD, San Jose, CA, USA).
Stimulated samples were incubated with a panel of MoAb according to the
manufacturer’s instructions following erythrocyte lysis by adding 2 mL of
1
The recipients enrolled in the present study were classified into two study groups named as follows, with acute tubular necrosis (ATN) or without ATN (NoATN). Seven patients (22.6%) experienced DGF due to ATN within the first-year post-transplantation and were therefore included in the ATN study group, whereas the remaining patients (n = 24, 77.4%) were included in the NoATN study group. At our institution, KTrs experiencing DGF with oliguria are subjected to a “for-cause biopsy”. Socio-demographic, clinical, and immunological characteristics, as well as the outcomes, were compared between the two groups.
In this context, renal allograft biopsies are commonly evaluated by experienced pathologists based on the current Banff classification [30, 31, 32]. There is no current definition of ATI endorsed by the Banff classification. Currently, ATI is included as a diagnosis in Banff diagnostic category 6, which is characterised by the lack of other apparent causes but histological evidence of acute tissue injury in the context of a diagnosis of acute or active ABMR with antibody-mediated changes [30]. Therefore, ATI was diagnosed from patient biopsies with DGF clinically manifested as oliguria that did not show antibody-mediated changes but others unrelated to acute or chronic rejection. Variable tissue changes used to diagnose ATI were described as vacuolisation, brush border loss, and pyknotic nuclei of tubular epithelial cells with signs of tubular dilatation with or without tubulitis, or the presence of any of the following, interstitial inflammation, glomerulitis, tubular atrophy, and luminal casts [33, 34].
KTrs received immunosuppression therapy based on our institution’s standard practice of care. Accordingly, induction therapy consisted of either rabbit anti-thymocyte globulin or anti-CD25 monoclonal antibody-based therapy. Therefore thymoglobulin was provided to high-immune-risk patients, whereas basiliximab was given to low-immune-risk patients. From our data, 87.1% (n = 27) received basiliximab and 12.9% (n = 4) received thymoglobulin.
Maintenance immunosuppression therapy was based on the administration of either tacrolimus (TRL, Prograf®, Astellas Pharma, United Kingdom) with a target dose of 5 mg/day or mycophenolate mofetil (MMF, CellCept®, Roche Pharma, Switzerland) with a target dose of 2000 mg/day. All patients in this study were under the same immunosuppressive conditions. Additionally, KTrs also received methylprednisolone as the main corticosteroid-based therapy (Dacortin® 20 mg/day). Steroids were gradually reduced to 5 mg/day from day 1 until day 90 post-transplantation. Due to the number of side effects associated with glucocorticoids, patients with stable graft function were weaned from steroids at the sixth-month post-transplantation. A total of 90.3% (n = 28) of KTrs received double immunosuppression therapy based on TRL and MMF, whereas the remaining patients were on a monotherapy regimen, either with TRL (3.2%, n = 1) or MMF (6.5%, n = 2).
Demographic, clinical, and immunological data were collected in a unified database (Microsoft Access 11.0; Microsoft Corporation, Seattle, WA, USA), and statistical analysis was performed using the SPSS 20.0 software (SPSS Inc., Chicago IL, USA). The Kolmogorov–Smirnoff test was used to assess whether the demographic and clinical patient data, as well as the percentages and MFI data of the T lymphocyte subsets adjusted to parametric distribution. All variables were distributed nonparametrically. Therefore, quantitative data were presented using the median with an interquartile range of 25 and 75, whereas qualitative data were presented as absolute and relative frequencies.
Pearson’s X
Receiver operating characteristic (ROC) curves were used to identify the optimal
cut-off points for those surrogate biomarkers deemed significant to stratify
patients at high risk of ATN. Cut-off points were calculated based on the best
Youden-index (sensitivity + specificity-1) [35]. The area under the ROC curve
(AUC) was analysed as follows, an area of 0.6–0.7 was considered acceptable; an
area of 0.7–0.8, excellent; and an area of
Any demographic, clinical, and immunological variable statistically significant
at the univariate pre-transplant cross-sectional analysis as well as any known
variable with clinical importance, was finally assessed in a backward stepwise
multivariate logistic regression [37]. Multivariable logistic regression analysis
was applied to confirm positive associations. Relative hazard ratios (HR) and
their 95% confidence intervals (CI) were calculated to estimate the likelihood
of the occurrence of ATN. A level of p
Within the first-year post-transplantation, 22.6% of KTrs (n = 7) were diagnosed with DGF due to biopsy-proven ATN versus 77.4% (n = 24) who did not. Furthermore, from the ATN group, only one patient (14.3%) additionally developed AR, whereas 25% (n = 6) of recipients from the NoATN group did not reject the allograft during the study. Nevertheless, neither the presence nor the absence of ATN was correlated with the occurrence of AR in our cohort of patients (p = 0.551, OR = 1.750, 95% CI = 0.251–12.207 and OR = 0.875, 95% CI = 0.598–1.280, respectively).
Overall, the median [IQR] donor age was 55 [42–61], and the median [IQR]
recipient age was 53 [41–59] with no significant impact on ATN (p =
0.679 and p = 0.125, respectively) despite age being previously
associated with DGF and ATN. However, some intrinsic and extrinsic immunological
and clinical characteristics of the patients differed significantly from the ATN
and NoATN study groups. For instance, the presence of preformed anti-HLA
antibodies (42.9% vs. 16.7%, p = 0.012, OR = 3.750, 95% CI =
1.295-10-862), and the maximum (6.42
| Variables | Total KTr | ATN | NoATN | p value |
| (N = 31) |
(n = 7) |
(n = 24) | ||
| Donor age, median [IQR]* | 55 [42–61] | 54 [47–69] | 56 [41–61] | 0.679 |
| Recipient age, median [IQR]* | 53 [41–59] | 57 [49–61] | 53 [40–59] | 0.125 |
| Recipient gender (male/female), n (%) | 24 (77.4)/7 (22.6) | 5 (71.4)/2 (28.6) | 19 (79.2)/5 (20.8) | 0.667 |
| Pre-transplant sensitisation |
24 (77.4)/7 (22.6) | 4 (57.1)/3 (42.9) | 20 (83.3)/4 (16.7) | 0.012 |
| Maximum PRA, median [IQR]** | 0 [0–7] | 7 [0–14] | 0 [0–0] | 0.005 |
| Current PRA, median [IQR]** | 0 [0–4] | 0 [0–9] | 0 [0–0] | 0.032 |
| HLA-A mismatch (0/1/2) | 2 (6.5)/17 (54.8)/12 (38.7) | 1 (14.3)/4 (57.1)/2 (28.6) | 1 (4.2)/13 (54.2)/10 (41.7) | 0.574 |
| HLA-B mismatch (0/1/2) | 4 (12.9)/15 (48.4)/12 (38.7) | 2 (28.6)/2 (28.6)/3 (42.9) | 2 (8.3) /13 (54.2)/9 (37.5) | 0.287 |
| HLA-DRB1 mismatch (0/1/2) | 6 (19.4)/18 (58.1)/7 (22.6) | 2 (28.6)/5 (71.4)/0 (0) | 4 (16.7)/13 (54.2)/7 (29.2) | 0.257 |
| Total lymphocyte (%), median [IQR] | 10.6 [4.6–21.7] | 10.6 [4–13] | 10.5 [4.7–23.9] | 0.028 |
| Total lymphocyte (cells/mm |
870 [500–1540] | 1000 [500–1600] | 850 [523–1480] | 0.129 |
| Total leukocyte (×10 |
8.4 [5.9–12.8] | 10.9 [7.3–13.3] | 7.9 [5.7–12.7] | 0.847 |
| Induction therapy (Thymoglobulin/Basiliximab), n (%) | 4 (12.9)/27 (87.1) | 0 (0)/7 (100) | 4 (16.7)/20 (83.3) | 0.550 |
| Post-transplant treatment (TRL+MMF/MMF or TRL), n (%) | 28 (90.3)/3 (9.7) | 6 (85.7)/1 (14.3) | 22 (91.7)/2 (8.3) | 0.019 |
| Dose of TRL (mg/day), median [IQR] | 13 [10–16] | 11 [10–14] | 13.5 [9.8–16.3] | 0.262 |
| Dose of MMF (mg/day), median [IQR] | 2000 [800–2000] | 2000 [500–2000] | 2000 [1800–2000] | 0.006 |
| Serum creatinine (mg/dL), median [IQR] | 5.9 [4.5–7.3] | 7.3 [5.5–8.9] | 5.4 [4.2–6.8] | 0.000000143 |
| Glomerular filtration rate (mL/min/1.73 m |
61 [54–76] | 40 [32–47] | 68 [60–78] | 0.00012 |
| Dialysis time (years), median [IQR] | 3 [2–5] | 4 [2–6] | 3 [2–5] | 0.132 |
| Acute Rejection (No/Yes), n (%) | 24 (77.4)/7 (22.6) | 6 (85.7)/1 (14.3) | 18 (75)/6 (25) | 0.551 |
N, total number of individuals; n, number of patients in each group; ATN, acute tubular necrosis study group; NoATN, non-acute tubular necrosis study group; KTr, kidney transplant recipients; IQR, interquartile range; PRA, panel reactive antibody; HLA, human leukocyte antigen; TRL, tacrolimus; MMF, mycophenolate mofetil; DSA, donor-specific antibodies.
*Age is expressed in years.
**PRA is expressed in %.
As ATN is most frequently diagnosed within the first days following surgery, we
focused our stratification analysis on different CD4
 Fig. 2.
Stratification analysis in KTrs within the first-month
post-transplantation. (A) Differences in the percentage of
CD4
The expression, measured as MFI, of the different surface markers, did not
differ much from what we observed regarding the distribution of T cell subsets.
Mean MFI values were calculated for the different T lymphocyte subsets and used
in the analysis. Albeit not seen as statistically significant following the
univariate stratification analysis, the expression of CD25 on CD8
 Fig. 3.
Stratification analysis in KTrs within the first-month
post-transplantation. (A) Differences in the MFI of CD8
Following the univariate stratification analysis, we carried out a study to validate, from the pool of significant T lymphocyte subsets, those of importance as surrogate biomarkers for ATN in KTrs within the first-month post-transplantation.
The AUC analysis showed that out of all CD4
 Fig. 4.
ROC curve analysis within the first-month
post-transplant. (A) AUC
In addition, the expression of CD95 on CD4
The specificities, sensitivities, and positive and negative predictive values of the four different predictive models for ATN are depicted in Table 2.
| Kidney transplant recipients (N = 31) | Cut-off |
Sensitivity (95% CI) | Specificity (95% CI) | PPV (95% CI) | NPV (95% CI) | p value |
|---|---|---|---|---|---|---|
| Surrogate biomarker for ATN | ||||||
| Surface markers on CD8 | ||||||
| CD8 |
1015.20 | 45.83 (25.55–67.18) | 84.85 (73.90–92.49) | 52.38 (34.92–69.28) | 81.16 (74.62–83.06) | 0.002 |
| CD8 |
2489.05 | 32.65 (19.95–47.54) | 87.80 (73.80–95.92) | 76.19 (56.18–88.87) | 52.17 (46.53–57.76) | 0.022 |
| CD8 |
4257.28 | 40.74 (22.39–61.20) | 84.13 (72.74–92.12) | 52.38 (34.69–69.50) | 76.81 (70.41–82.18) | 0.011 |
| Surface markers on CD4 | ||||||
| CD4 |
1581.98 | 65.00 (40.78–84.61) | 88.57 (78.72–94.93) | 61.90 (43.99–77.08) | 89.86 (82.89–94.18) | 0.0000587 |
| Lymphocyte ratio | ||||||
| CD4 |
0.32 | 57.14 (37.18–75.54) | 96.77 (88.83–99.61) | 88.89 (66.35–97.01) | 83.33 (76.48–88.49) | 0.005 |
PPV, positive predictive value; NPV, negative predictive value; ATN, acute tubular necrosis; KTr, kidney transplant recipients; MFI, mean fluorescence intensity; 95% CI, 95% confidence interval.
Recipients who experienced ATN had significantly lower glomerular filtration
rates (GFR) compared with those who displayed stable allograft function within
the first-month post-transplantation (Fig. 5A, 32.71
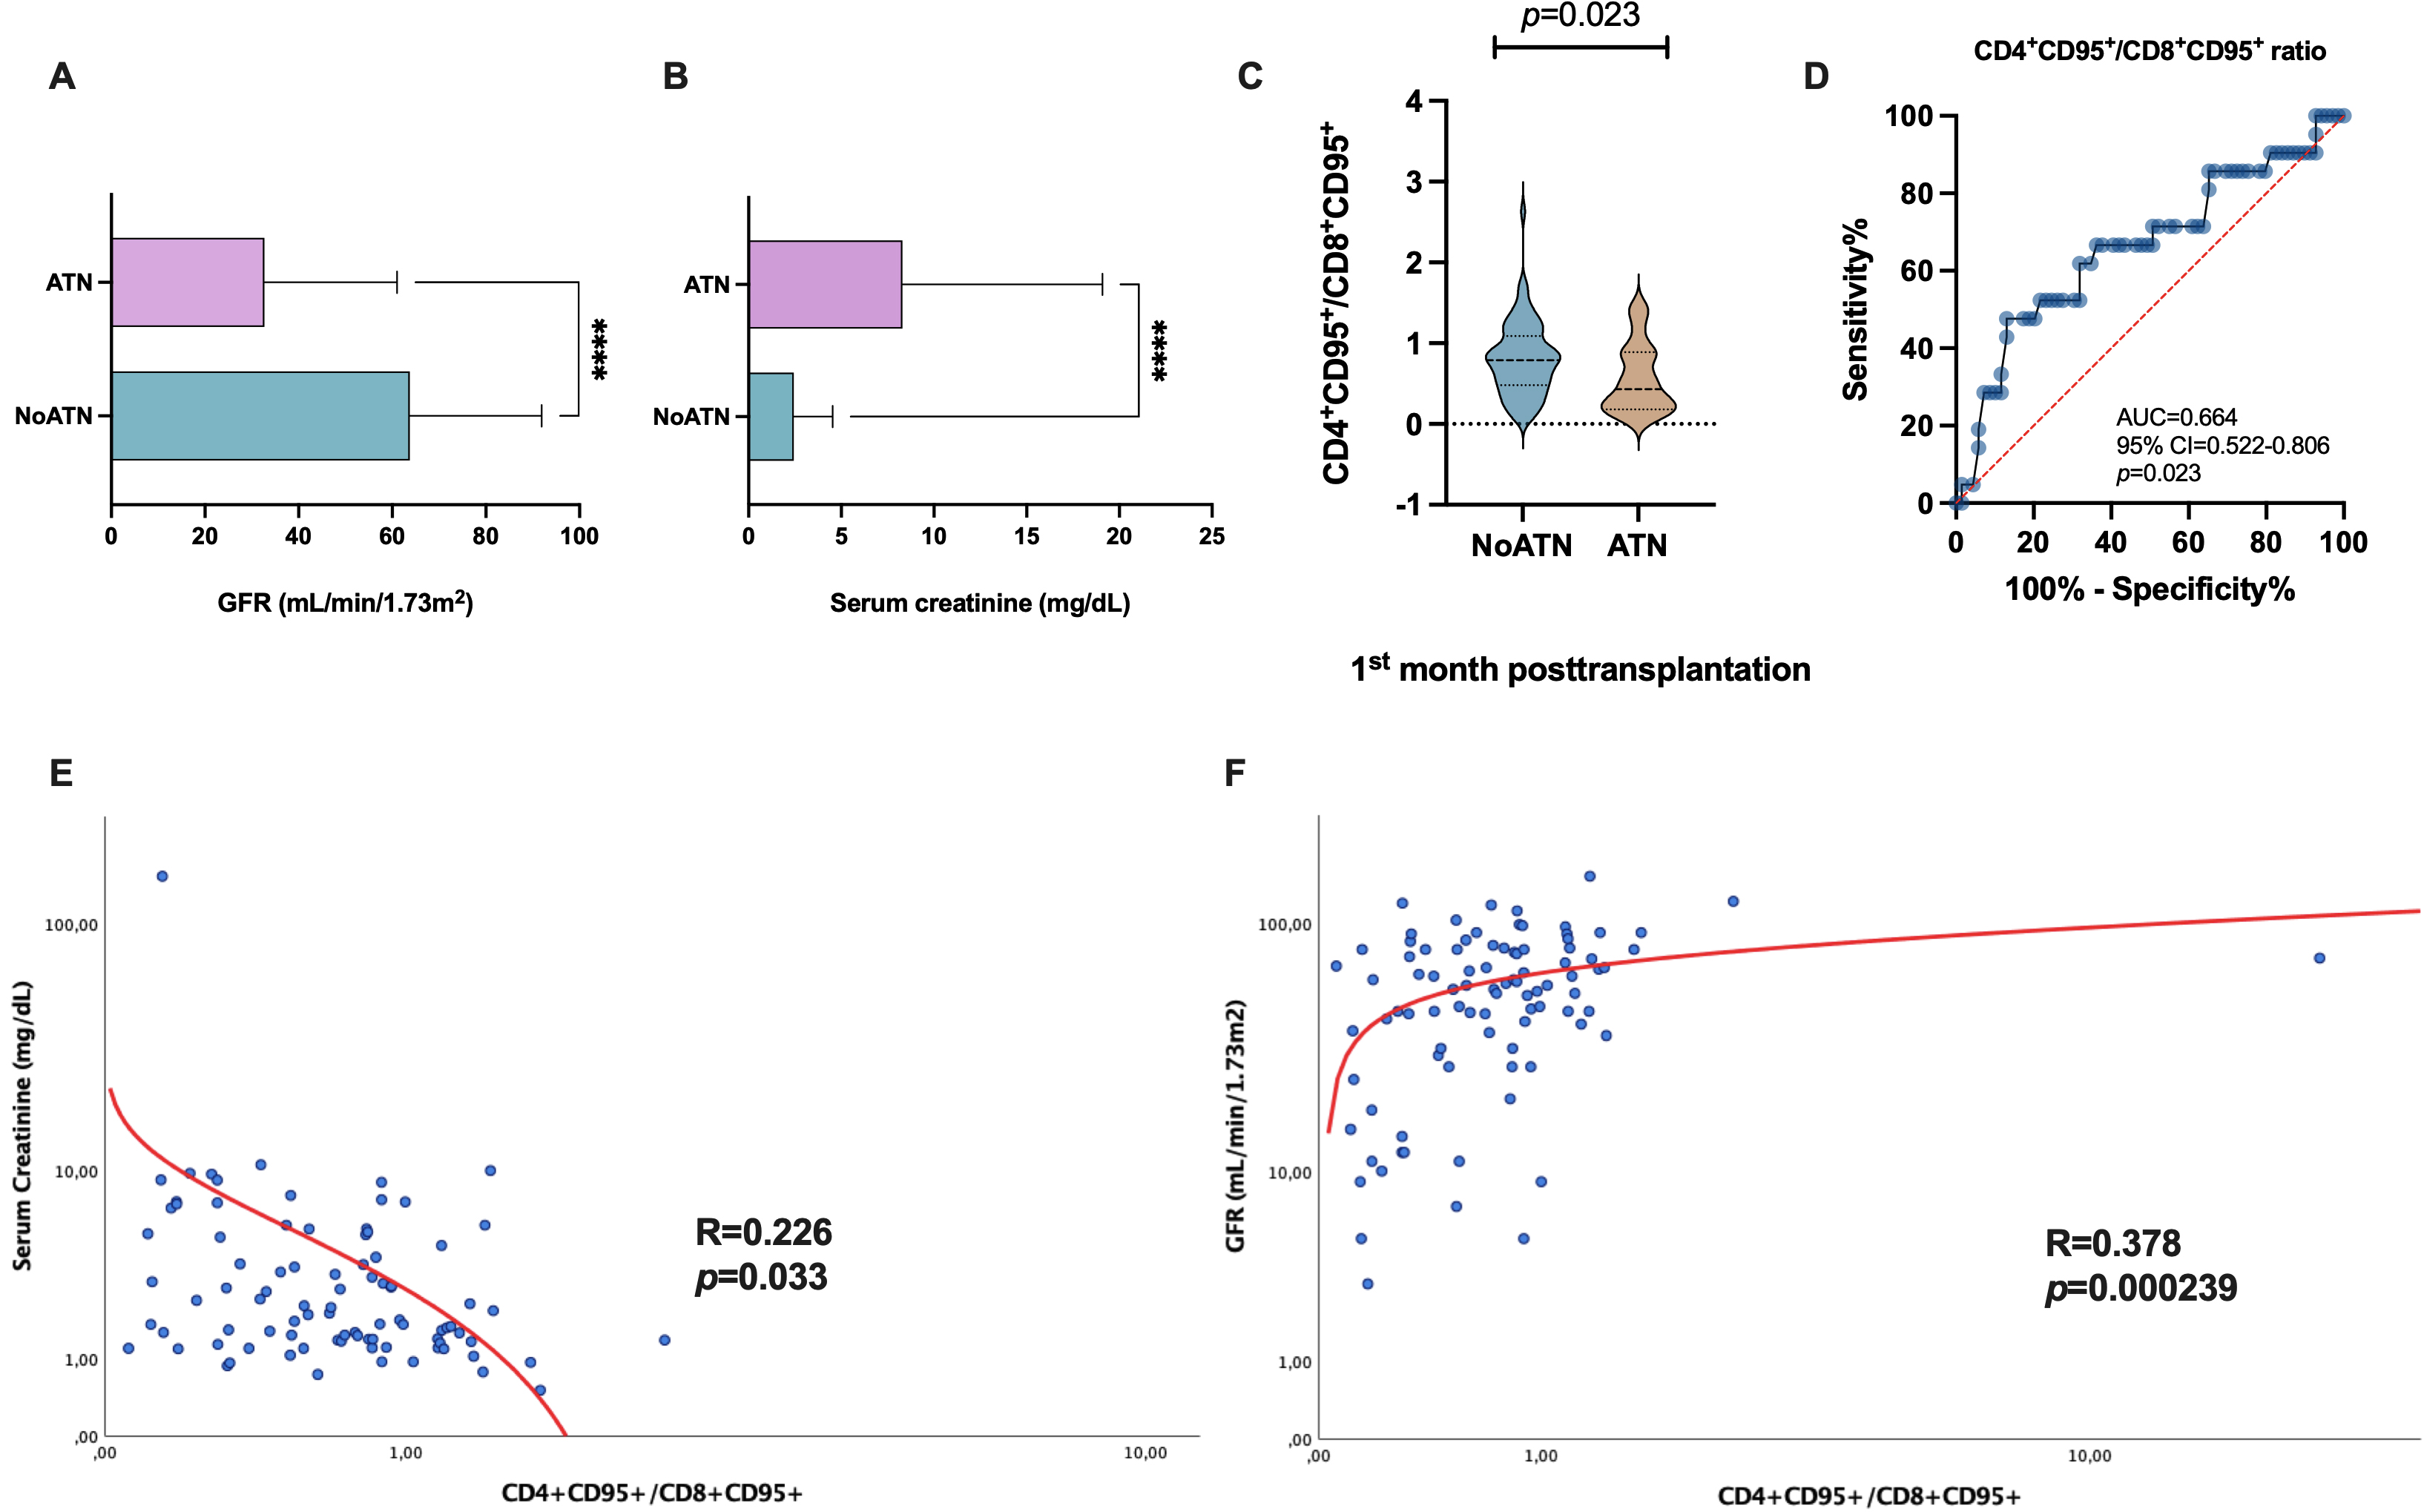 Fig. 5.
Analysis of the allograft function and its association with T
lymphocytes. (A) Differences in the GFR (mL/min/1.73 m
Interestingly, we calculated the ratio of
CD4
Furthermore, we assessed the CD4
Correlation analysis showed that the CD4
Following the stratification analysis, we then analysed whether the differences
showed by CD8 T cell subsets between patients with ATN and stable graft function
could be used to stratify them into two different groups based on the MFI
expression of CD25, CD69 and CD95 in CD8 T cells to ascertain the risk of ATN.
ROC curve analysis was applied to find the best cut-off values for
CD8
An MFI
Following univariate analysis, those patients and donor characteristics of clinical importance that showed, by any means, an association with poor allograft function within the first-month post-transplantation were input into a multivariate logistic regression model to ascertain their independency as risk factors for ATN. Certainly, various variables kept their statistical significance toward a poorer outcome by influencing the odds of developing ATN.
From the multivariate analysis, 45.3% of the variation in the development of ATN in KTrs cannot be explained by our predictors (covariables). Our regression model accurately predicted ATN development with high sensitivity and specificity, showing that 95.65% of patients from the low-risk pool did not develop ATN, whereas 80.95% of KTrs stratified as high risk indeed developed ATN within the first-month post-transplantation. Donor age had a protective effect on the risk of ATN, showing that for each year increase in donor age, the recipient was 0.847 times less likely to develop ATN compared with patients transplanted with younger donors (HR: 0.847, 95% CI = 0.728–0.984, p = 0.003). Similarly, regarding renal function measured as GFR, a protective effect was also observed. Particularly, patients who maintained stable allograft function in the first-month after transplantation had a 6.2% reduction in the relative risk of ATN (HR: 0.938, 95% CI = 0.882–0.997, p = 0.039). Furthermore, serum creatinine showed a significant detrimental effect on the primary outcome, as recipients with higher levels were 1.08% more likely to develop ATN following transplantation (HR: 0.938, 95% CI = 0.882–0.997, p = 0.039).
Regarding the immunologic characteristics of the patients, several variables contributed independently to the odds of developing ATN within our predictive model. There were independent pre- and post-transplant variables that affected the risk associated with ATN. Recipients with preformed anti-HLA antibodies were 5.726 times more likely to develop ATN than those without antibodies (HR: 5.726, 95% CI = 1.313–24.977, p = 0.020).
The most important variables we aimed to analyse were the different T lymphocyte
subsets to determine any possible underlying immune-mediated pathogenic mechanism
causing acute tubular allograft injury. In this respect, we were able to evaluate
their potential use as surrogate biomarkers of ATN and, indeed, our predictive
model significantly correlated three out of the four T lymphocyte subsets as
independent factors contributing to increased risk of ATN. Thus, KTrs with
CD8
| Variables | B coefficient | HR | 95% CI | p value |
|---|---|---|---|---|
| Donor age (years) | –0.167 | 0.847 | 0.728–0.984 | 0.030 |
| Serum creatinine (mg/dL) | 1.073 | 2.923 | 1.543–5.536 | 0.001 |
| Glomerular filtration rate (mL/min/1.73 m |
–0.064 | 0.938 | 0.882–0.997 | 0.039 |
| Pretransplant sensitisation (Yes) | 1.745 | 5.726 | 1.313–24.977 | 0.020 |
| CD8 |
1.651 | 5.212 | 1.295–20.975 | 0.020 |
| CD4 |
2.516 | 12.376 | 3.104–49.339 | 0.000363 |
| CD8 |
1.306 | 3.693 | 1.928–14.689 | 0.034 |
ATN, acute tubular necrosis; KTr, kidney transplant recipients; HR, hazard ratio; 95% CI, 95% confidence interval; MFI, Median Fluorescent Intensity.
The present study sought to determine whether ATN had an immune-mediated
outbreak in which the recipient T lymphocytes played a central role in its
presentation. Thirty-one first-time KTrs were enrolled in this single-centre
longitudinal observational study for T lymphocyte surveillance. Our research
group previously validated an in vitro assay that allowed us to assess
the degree of expression of several surface markers (CD25, CD38, CD69, CD154, and
CD95) on CD4
Of the 31 KTrs enrolled in this study, 22.6% (n = 7) were diagnosed with DGF
due to ATN over the first-month post-transplantation. The diagnosis of ATN
following KT relies on changes in specific biochemistry parameters associated
with renal function, such as serum creatinine concentration and GFR, that could
be accompanied by acute reductions in urine output along with the histological
assessment of the allograft [7, 39]. Our results showed that, in the ATN group,
serum creatinine concentration was significantly higher than that observed in the
NoATN group. Similarly, GFR significantly differed from ATN vs NoATN study
groups. Despite the controversy among authors to use both as biomarkers of acute
injury, mainly derived from their lack of specificity, the classical assessment
of creatinine and GFR of allograft function provided promising results in our
predictive multivariate logistic regression model, supporting their continued
use. Both parameters correlated significantly with our proposed
CD4
Using univariate analysis, the presence of preformed anti-HLA antibodies in wait-listed ESRD patients correlated significantly between the ATN versus NoATN groups and was confirmed as an independent factor contributing to a 5.726-fold increased risk to our primary outcome. Furthermore, albeit not significant in the multivariate logistic regression predictive model, both maximum PRA and current PRA at the time of transplantation were significantly higher in ATN than NoATN in the univariate analysis. These data are consistent with current trends that anti-HLA antibodies appear as an independent risk factor for DGF and ATN earlier after transplantation in KTrs [10]. Both PRA and pre-sensitisation status of ESRD patients are well-established factors used by nephrologists to stratify as high or low immunological risk hence a more aggressive induction therapy is provided before transplantation, reducing the possibility of earlier immune-mediated complications [40, 41].
Post-transplant immunosuppression was shown to influence the development of ATN. There was a significantly increased percentage of KTrs from the NoATN group receiving double maintenance therapy compared with the ATN group (78.6% vs 21.4%) during the first-year post-transplant. Additionally, MMF dose (mg/day) was another clinical parameter that significantly affected the development of ATN, whereby the NoATN group had received an overall higher dose than KTrs with acute allograft injury. These results will require further investigation, as the initial post-transplant immunosuppression regime and induction therapy might benefit KTrs by reducing AR and ATN. Current practice aims to avoid earlier complications arising from alloimmune recognition of the donor’s graft, and the vast majority of patients are treated with the calcineurin inhibitor TRL as the primary agent in combination with MMF. As of yet, these drug combinations appear to work well as rejection prophylaxis, but their effect in preventing ATN requires further investigation in future larger and multicentric prospective studies.
To our knowledge, this is the first time an investigation outlines the
involvement of the patient’s adaptive immune system in earlier post-transplant
ATN, whereby T lymphocytes were assessed in whole peripheral blood samples
throughout the first-year post-transplantation at different time points. During
the first-month post-transplant, patients who developed ATN showed a
significantly higher percentage of CD8
Our results also showed that patients who experienced ATN had increased
expression of specific surface activation markers. We observed that CD25 and CD69
were notably overexpressed on CD8
Cell apoptosis can be triggered by the TNF receptor superfamily member CD95
(Fas, APO-1, TNFRSF6) as a prototypical death receptor expressed by a wide
variety of cell types when bound to its natural ligand, CD95L (CD178/TNFSF6)
[45]. It is of particular importance that the partnership made by CD95/CD95L not
only induces apoptosis but it has now also been established that CD95 has
multiple non-apoptotic activities [46, 47]. An important anti-apoptotic function
in which CD95 participates is the induction of relative cellular resistance to
CD95-mediated apoptosis by the upregulation of its surface expression. Other
pathways of induced cell apoptosis implicate activated CD8
Consistent with current literature, we were able to characterise that KTrs who
developed ATN during the first-month post-transplant had a higher proportion of
activated cytotoxic CD8
Beyond the aforementioned limitations of our study, we performed an appropriate study design by including comprehensive prospective immune surveillance at various time points using an already validated functional in vitro immunophenotypic assay that reduces potential cofounders. However, the small number of patients included due to the relatively short follow-up period will require a larger cohort and longer surveillance to validate our preliminary results.
To our knowledge, this is the first study addressing the role of CD8
The datasets used and/or analyzed during the current study are available from the corresponding author on reasonable request
FB and MM, conceptualization and designed the research study. RA and VJC, performed the research and implemented the methodology. FB, RA and MRMQ, biomarker determination and data acquisition. JDLPM and SL, provided help and advice on patient clinical data and management. FB and IL, analyzed the data. FB and AM, statistical analysis. MRMQ and AM, clinical data. FB, VJC, and RA wrote-preparation of the draft manuscript. FB and MM revised and edited the final version of the manuscript. FB and MM, supervision of the project. MM, visualization, project administration, and funding acquisition. All authors contributed to editorial changes in the manuscript. All authors read and approved the final manuscript. All authors have participated sufficiently in the work and agreed to be accountable for all aspects of the work.
All patients gave their informed consent for their samples to be manipulated and stored for current and future research before they were recruited to the study. The study was conducted following the Declaration of Helsinki, and the protocol was approved by the Ethics Committee of the University Hospital “Virgen de la Arrixaca” (HUVA) (PI15/01370).
All figures included in this manuscript were created with GraphPad Prism 9.5.0. and BioRender.com (https://www.biorender.com/).
Our work was possible thanks to the support of the “Instituto de Salud Carlos III” (ISCIII), Spanish Ministry of Economy and Competitiveness. The authors who participated in this study reported the grant P19/01194 while conducting the study. This study was also co-funded by the European Regional Development Fund (ERDF) with the principle of ‘A manner to build Europe’.
The authors declare no conflict of interest.
Publisher’s Note: IMR Press stays neutral with regard to jurisdictional claims in published maps and institutional affiliations.