
- Academic Editor
Background: Clinical indexes are often selected as relevant factors for constructing prognostic models of tongue squamous cell carcinoma (TSCC) patients, while factors related to therapeutic targets are less frequently included. As Apigenin (API) shows anti-tumor properties in many tumors, in this study, we construct a novel prognostic model for TSCC patients based on Apigenin-associated genes through transcriptomic analysis. Methods: The effect of Apigenin (API) on the cell characteristics of TSCC cells was measured by several phenotype experiments. RNA-seq was executed to ensure differentially expressed genes (DEGs) in squamous cell carcinoma-9 (SCC-9) cells after API treatment. Furthermore, reverse transcription quantitative polymerase chain reaction (RT-qPCR) and immunohistochemistry were performed to verify the expression of API-related genes. Then, combined with the gene expression data and relevant individual information of TSCC samples acquired from The Cancer Genome Atlas (TCGA), an API-related model was built through Lasso regression and multivariate Cox regression. A receiver operating characteristic (ROC) curve and a nomogram and calibration curve were created to forecast patient outcomes to improve the clinical suitability of the API-related signature. The relationships between the two risk groups and function enrichment, immune infiltration characteristics, and drug susceptibility were analyzed. Results: We demonstrated that API could inhibit the malignant behavior of TSCC cells. Among API-related genes, TSCC cells treated with API, compared to the control group, have higher levels of transmembrane protein 213 (TMEM213) and G protein-coupled receptor 158 (GPR158), and lower levels of caspase 14 (CASP14) and integrin subunit alpha 5 (ITGA5). An 7 API-associated gene model was built through Lasso regression and multivariate Cox regression that could direct TSCC prognostic status and tumor immune cell infiltration. In addition, we acquired 6 potential therapeutic agents for TSCC based on the prognostic model. Conclusions: Our research suggested the inhibition effect of API on TSCC cells and provided a novel prognostic model combined with therapeutic factors that can guide the prognosis of TSCC and clinical decision-making in TSCC.
Apigenin (4
TSCC, which is associated with an aggressive phenotype and poor prognosis, is one of the most widely diagnosed forms of oral cancer [14, 15, 16]. In addition to functional problems such as impaired speech, chewing, and swallowing, TSCC may also cause cosmetic changes, which can reduce patients’ quality of life [17, 18]. Currently, the treatment of TSCC includes surgery, chemotherapy, radiotherapy, or comprehensive treatment depending on the patient’s condition [4]. Although great improvement has been made in cancer diagnosis and therapy, the mortality of TSCC is still high [19]. Previous data have shown that the 5-year survival rate for patients with advanced TSCC is under 50%. Hence, more effective targets and therapies are desperately needed for TSCC [20]. And it’s necessary to build new methods to predict TSCC prognosis.
Nowadays, prognostic models are being used extensively in predicting tumor prognosis. Multiple factors are included in the prognostic modeling because using some single prognostic factor alone is not accurate enough [21]. Among these factors, clinical biochemical and imaging indicators are the main components. Previous studies have demonstrated that in patients with N-type breast cancer, prognostic models can provide evidence for withholding chemotherapy when the prognosis is favorable [22]. In metastatic biliary tract cancer, prognostic models based on clinical-laboratory parameters can help to accurately risk-stratify patients and make treatment-related decisions [23]. Moreover, prognostic models using the neutrophil-to-lymphocyte ratio (NLR) and 18F-FDG PET standardized uptake values can identify patients with pancreatic cancer into 4 prognostically distinct risk groups [24]. However, the analysis of high-throughput data and the incorporation of therapeutic factors as prognostic factors in the construction of prognostic models are rare. Indeed, such an approach is more likely to assess the impact of treatment on the disease and to regulate the dose and duration of drug administration.
In this study, we aimed to prove the potential role of API in TSCC and explore a novel TSCC prognosis model. The prognostic model, based on API-associated genes, was effective in guiding TSCC prognosis and immune microenvironment.
Firstly, API-related differentially expressed genes (DEGs) in squamous cell carcinoma-9 (SCC-9) cells were identified through RNA-seq and a preliminary analysis was conducted on the molecular mechanism of possible action of Apigenin. Next, combined with relevant individual information of TSCC patients from The Cancer Genome Atlas (TCGA) databases, 7 API-related genes were found to create a prognostic model and to survey the underlying mechanisms of TSCC patients [25]. The low- and high-risk groups were constructed to estimate patients’ outcomes by accurately predicting their overall survival (OS) from TSCC. Furthermore, this model was used to classify the tumor microenvironment (TME) and drug sensitivity of TSCC patients in different risk groups. A schematic of the analysis workflow is demonstrated (Fig. 1).
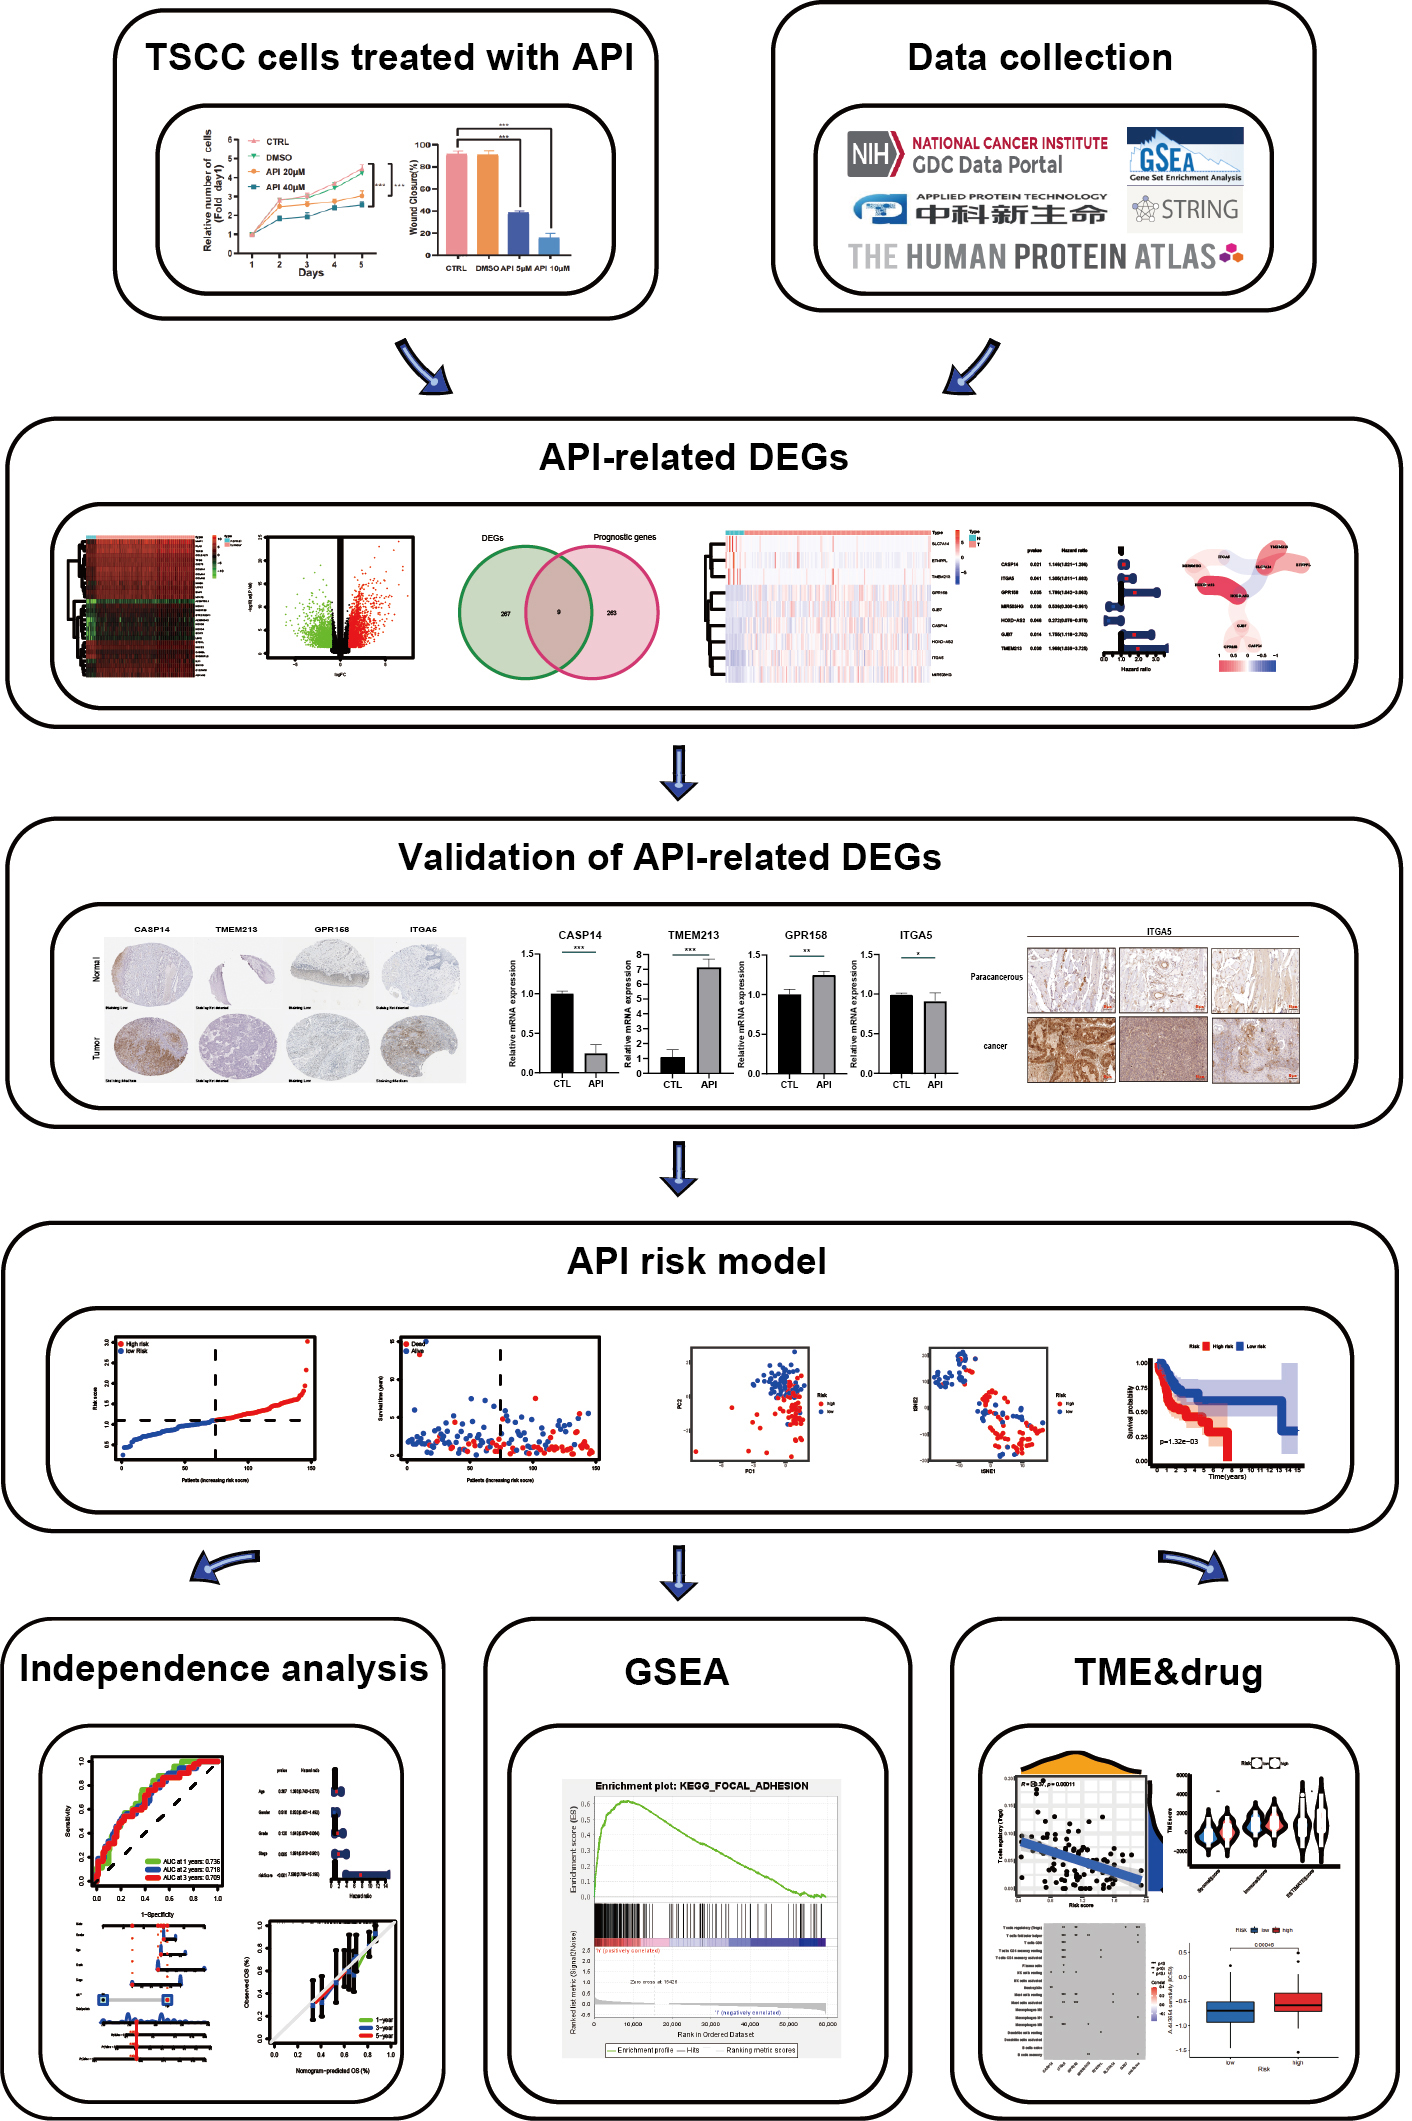 Fig. 1.
Analysis workflow. TSCC, tongue squamous cell carcinoma; API, apigenin; DEGs, differentially expressed genes; GSEA, gene set enrichment analysis; TME, tumor microenvironment.
The TSCC cell lines SCC-9 and CAL-27 were purchased from the
American Type Culture Collection (ATCC). For culturing, SCC-9 cells were grown in
DMEM-F12 maintained at 37 °C with 5% CO
The semi-inhibitory concentration (IC50) of API was calculated by the Cell
Counting Kit-8 (CCK-8) assay (BA00208, Bioss, Beijing, China). In brief, 100 µL of SCC-9 and CAL-27
cells growing exponentially at a concentration of 5
SCC-9 and CAL-27 cells (3
Using a 200 µL pipette tip, a scratch was made in the center of
each well. Each well was washed 3 times with PBS to remove cell debris. Then, the
residual cells were treated with or without 20 µM API for 24 h. The
migrating cells were imaged at 0 or 24 h by using a Leica inverted microscope
(DMI8, Leica, Solms, Germany; magnification, 50
In the invasion assay, transwells were pretreated with matrigel (1:8). Following
the suspension of SCC-9 and CAL-27 cells in serum-free medium (10
Six-well plates were used to cultivate SCC-9 and CAL-27 cells (1000/well). 20 µM API was applied to the cells. And every three days, the culture medium was changed. After 10 days of incubation, cells were immobilized with 4% paraformaldehyde. Then, the cells were followed by 10 minutes of crystal violet staining. A digital camera was used to record colony images, and colonies with more than 50 cells each were tallied.
Sections were cut from formalin-fixed, paraffin-embedded adjacent noncancerous
tissues and cancer tissues. The sections were routinely deparaffinized,
rehydrated, antigen-retrieved, and blocked with 3% hydrogen peroxide.
Thereafter, primary antibodies for ITGA5 (1:200, Proteintech) were incubated on
the sections overnight at 4 °C, followed by secondary antibodies that were
HRP-labeled. The sections were stained with hematoxylin and then with
diaminobenzidine. Unaware of any clinical information about our patients, two
skilled pathologists independently evaluated and scored the stained sections
based on the degree of staining and the ratio of tumor cells with a positive
stain. The staining intensity has been separated into four groups: 0 for no
staining, 1 for mild staining, 2 for moderate staining, and 3 for intense
staining. The proportion of positively stained tumor cells was classified
depending on the following criteria. 0 (5% positive cancer cells), 1 (5–25%
positive cancer cells), 2 (26–50% positive cancer cells), 3 (
Transcriptome RNA sequencing data from SCC-9 cells treated with or without 20 µM API for 24 hours were provided by Applied Protein Technology. RNA-seq data of TSCC patients obtained from the TCGA contained 148 TSCC samples and 15 normal tissue samples. Clinical data in 147 samples, including age, sex, tumor grade, and survival status, were also gathered from the TCGA. Besides, data from 58 additional samples were downloaded on the Gene Expression Omnibus database (https://www.ncbi.nlm.nih.gov/geo/) (ID: GSE111395, GSE75540), which later was used a as test cohort.
The “limma” package, containing p as well as false discovery rate
(FDR)
Receiver operating characteristic (ROC) curve analysis was performed using the “survival”, “survminer”, and “timeROC” packages. The 1-year, 3-year, and 5-year OS were determined by ROC curves to estimate the anticipation capacity of the model. The relationship between clinical data acquired from the TCGA and API-related gene expression was analyzed with Cox regression analyses. Moreover, the results were visualized through forest maps.
The input data were split into high- and low-risk groups obtained by risk
scoring, and the underlying molecular pathways in API-related genes were further
analyzed. Gene set enrichment analysis (GSEA) was performed by GSEA software
(version 4.3.2, Broad Institute, UC San Diego, CA, USA). Simulated value = 1000,
p-value
Each sample in the high- or low-risk group was analyzed to compute the number of 22 types of immune cells infiltrating the tumors. Furthermore, the CIBERSORT method was used to assess the correlation between patient risk scores and immune cell density [25]. The risk score was determined to explore the connection between API-related genes and 22 levels of immune cell infiltration. Additionally, between the high- and low-risk groups, the immune status and stromal scores were evaluated by the ESTIMATE algorithm [29].
To explore drug sensitivity in the low- and high-risk groups, IC50 values of TSCC treated with multidrug treatment were determined through the “prophetic” software package.
Based on the Human Protein Atlas, each API-related DEG used to build a prognostic model was subjected to immunohistochemistry imaging to further confirm the protein expression of these genes.
Total RNA was obtained from SCC-9 cells treated with or without 20 µM API via TRIzol (Invitrogen, Carlsbad, CA, USA). Then, complementary DNA (cDNA) was generated using the Verso complementary DNA synthesis kit (Invitrogen, Carlsbad, CA, USA). Sequences of primers for detecting target genes are described in Table 1.
| Variables | TCGA cohort |
| CASP14 (forward primer) | CTGGTGGATGTGTTCACGAAGAGG |
| CASP14 (reverse primer) | AGGGTGCTTTGGATTTCAGGGTTC |
| TMEM213 (forward primer) | GCAGAAGCAAGCAGCAGCAAC |
| TMEM213 (reverse primer) | ATCCAGCCGTACTCGTCCACTC |
| GPR158 (forward primer) | CTGCGGAGGAGCCAAGAAAGC |
| GPR158 (reverse primer) | ATCTGGGTGGTGCCTGGGTTC |
| ITGA5 (forward primer) | CATCGCTCTCAACTTCTCCTTGGAC |
| ITGA5 (reverse primer) | CGGCTCTTGCTCTGATAATGTAGGG |
| GAPDH (forward primer) | GTCAGTGGTGGACTGACCT |
| GAPDH (reverse primer) | TGCTGTAGCCAAATTCGTTG |
qPCR, quantitative polymerase chain reaction; TCGA, The Cancer Genome Atlas.
During data collection, gene expression was calculated through Student’s
t-test. Survival analysis was determined using the R survival package.
In addition, the log-rank test was used to test the survival rate of each group.
The Kaplan‒Meier curve was utilized to predict the survival probability of the
high- and low-risk groups in the data. Independent forecast factors of OS were
employed through univariate and multivariate Cox regression. Moreover, the
correlation of the two subgroups in the tumor immune microenvironment, including
immune cells and immune pathways, was assessed employing the Mann–Whitney test.
Additionally, the correlation coefficient was measured by Spearman analysis. R
version 4.1.0. (The R Foundation for Statistical Computing, Boston, MA, USA) was
used for all statistical analyses, and the p-value was
To determine the API (Fig. 2A) IC50 value of the TSCC cell line, SCC-9, and CAL-27 cells were treated with API at progressively higher concentrations (0, 2, 4, 8, 16, 32, 64, 128 µM) for 24 hours (Fig. 2B). As shown in Fig. 2B, the IC50 value was approximately 35.16 µM in SCC-9 cells and 39.21 µM in CAL-27 cells based on the CCK8 assay. Cell proliferation was also evaluated using the CCK8 assay (Fig. 2C,D). The effect of API on the migratory capacity of SCC-9 and CAL-27 cells was then clarified by wound-healing assay. Our data showed that API could decrease gap closure at concentrations of 20 µM (Fig. 2E,F). Meanwhile, we also verified that API could effectively suppress cell migration and invasion by transwell assay (Fig. 2G,H). Furthermore, the colony-formation assays demonstrated that API could effectively inhibit clonogenic capacity in SCC-9 and CAL-27 cells (Fig. 2I,J). Our results show that API could markedly suppress cell proliferation, migration, and clonogenic ability of SCC-9 and CAL-27 cells.
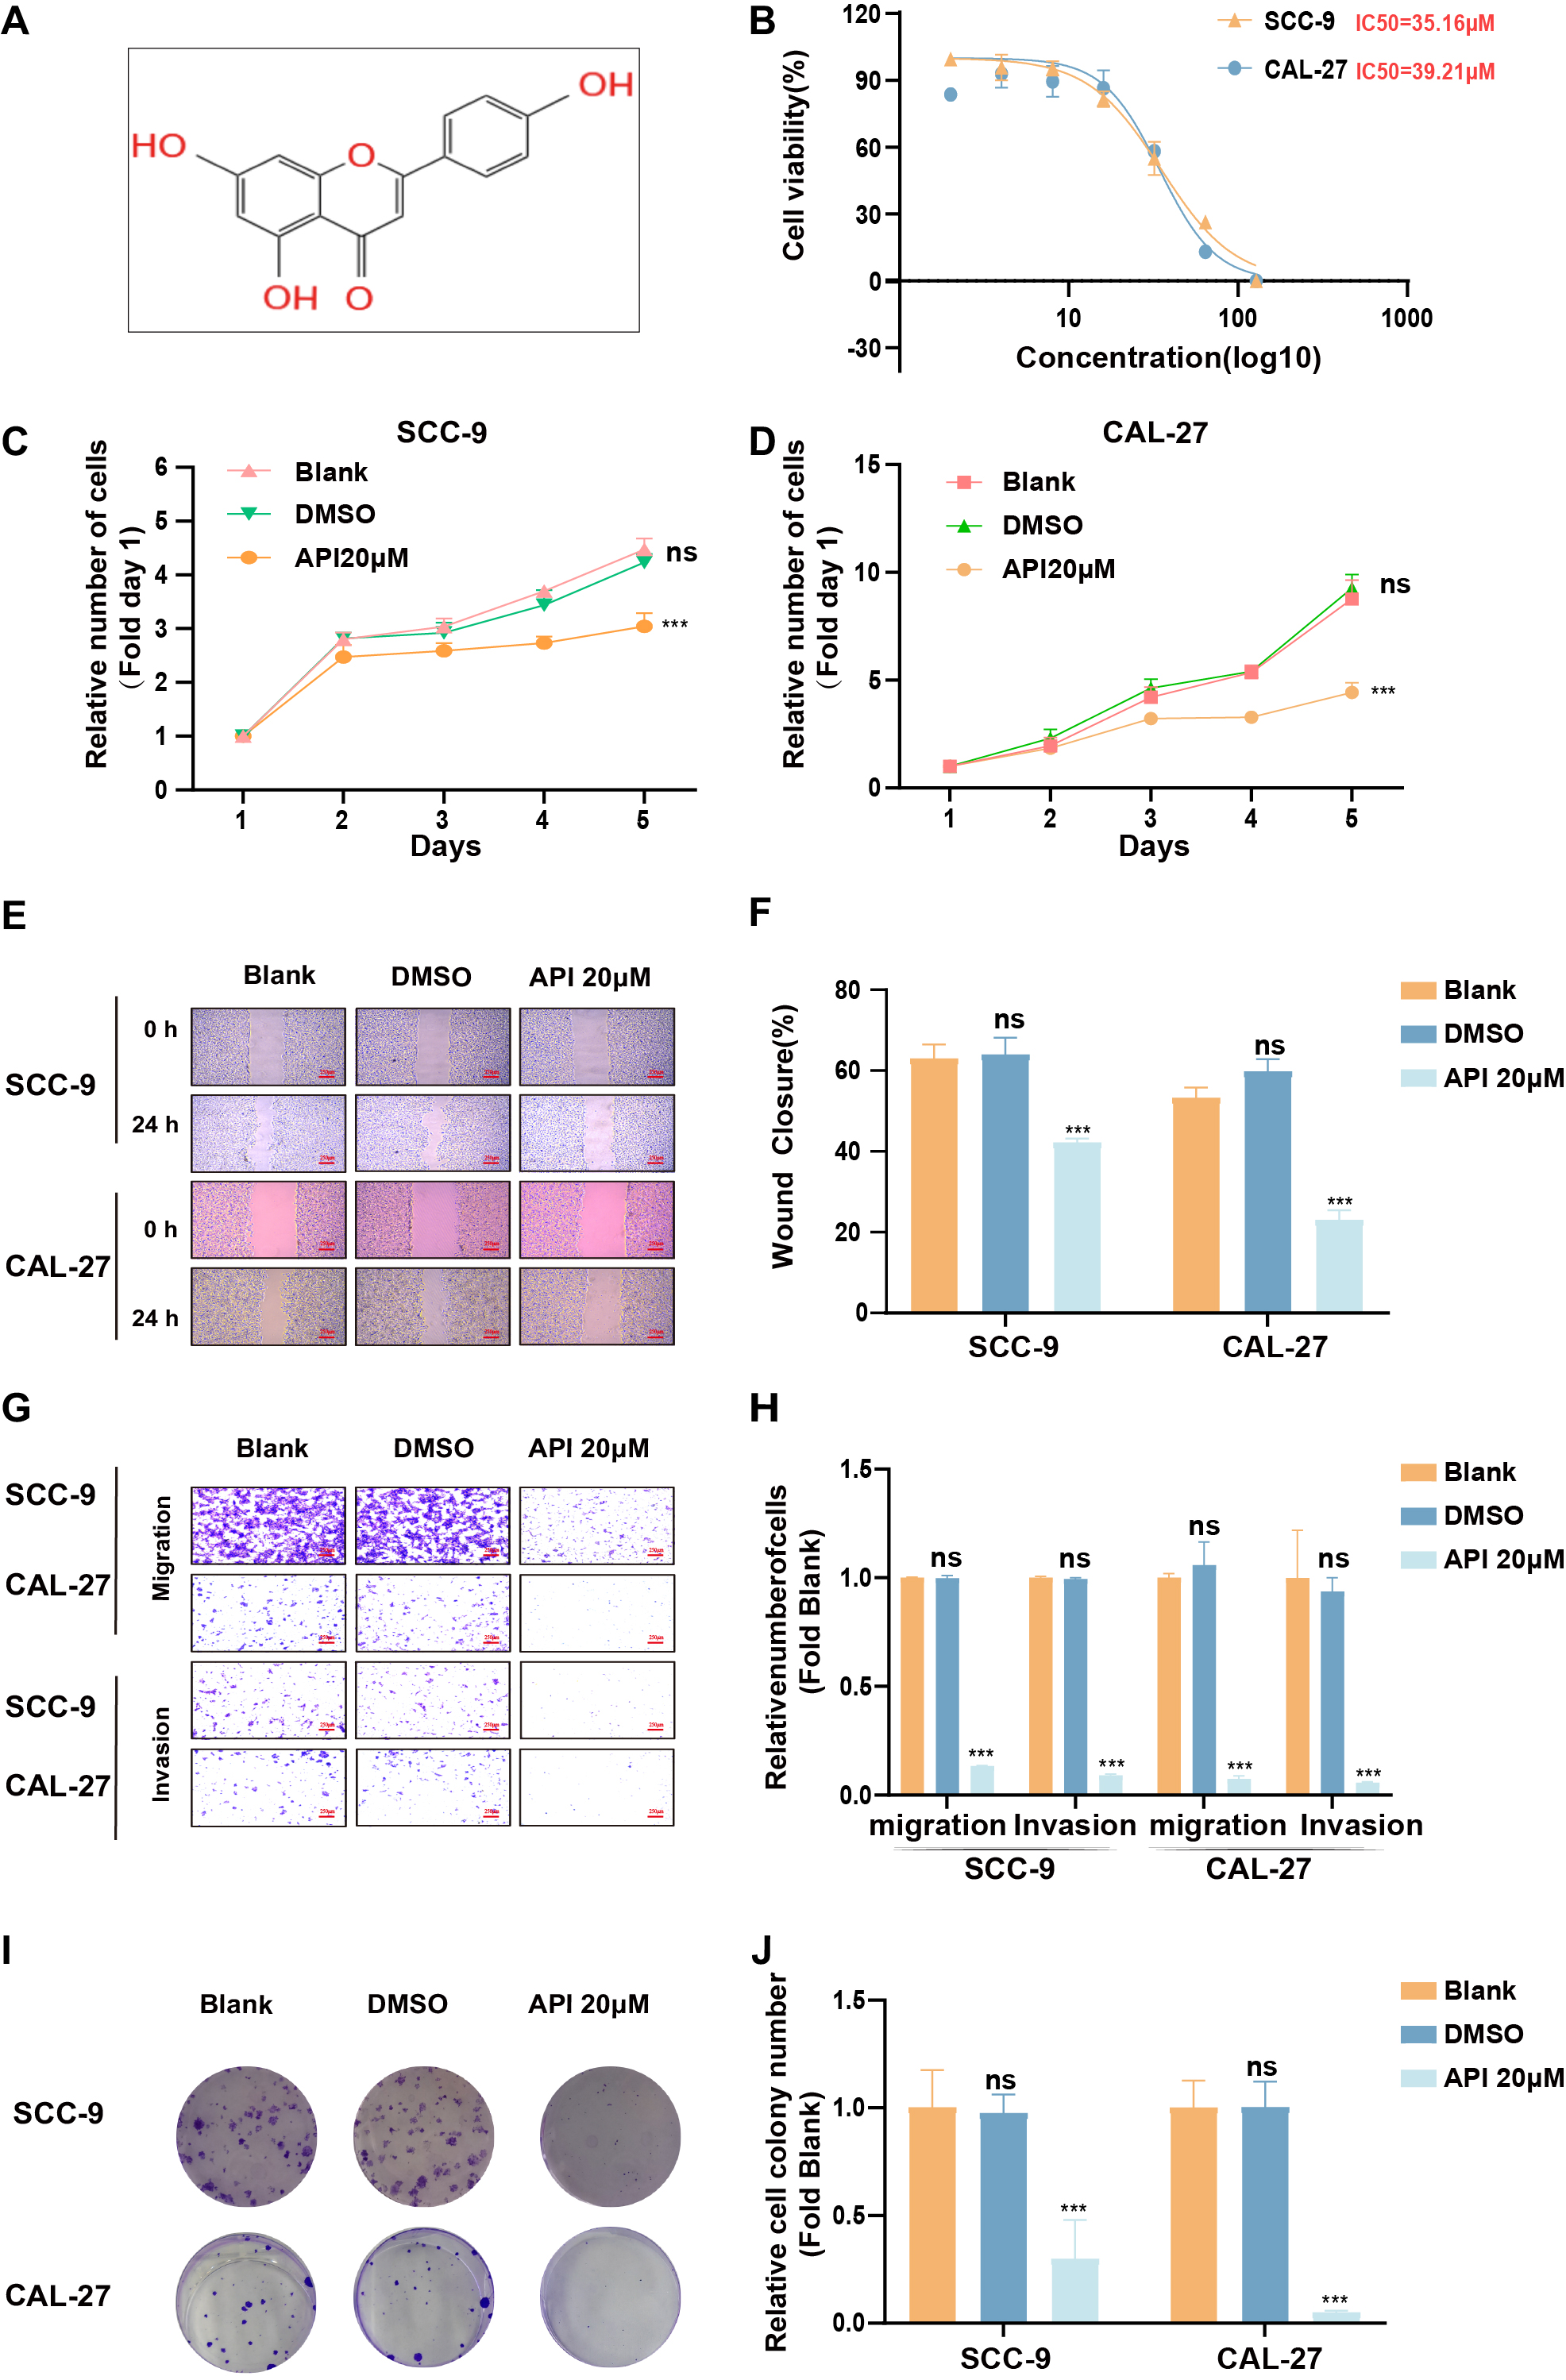 Fig. 2.
Apigenin (API) reduced Tongue squamous cell carcinoma (TSCC)
cell characteristics. (A) Chemistry architecture of API. (B) The IC
To explore the underlying molecular mechanism of how API restrains the
malignancy of TSCC, we obtained the results of API-treated and untreated groups
of DEGs through transcriptome RNA sequencing (Fig. 3A,B). Then, we also analyzed
DEGs in RNA-seq data between TSCC samples and normal tissue samples from the TCGA
(Fig. 3C,D). The individual information of these TSCC patients was generalized in
Table 2. Integrated analyses were performed to demonstrate relationships between
DEGs in SCC-9 cells and DEGs in the RNA-seq group or the prognosis-related group
with
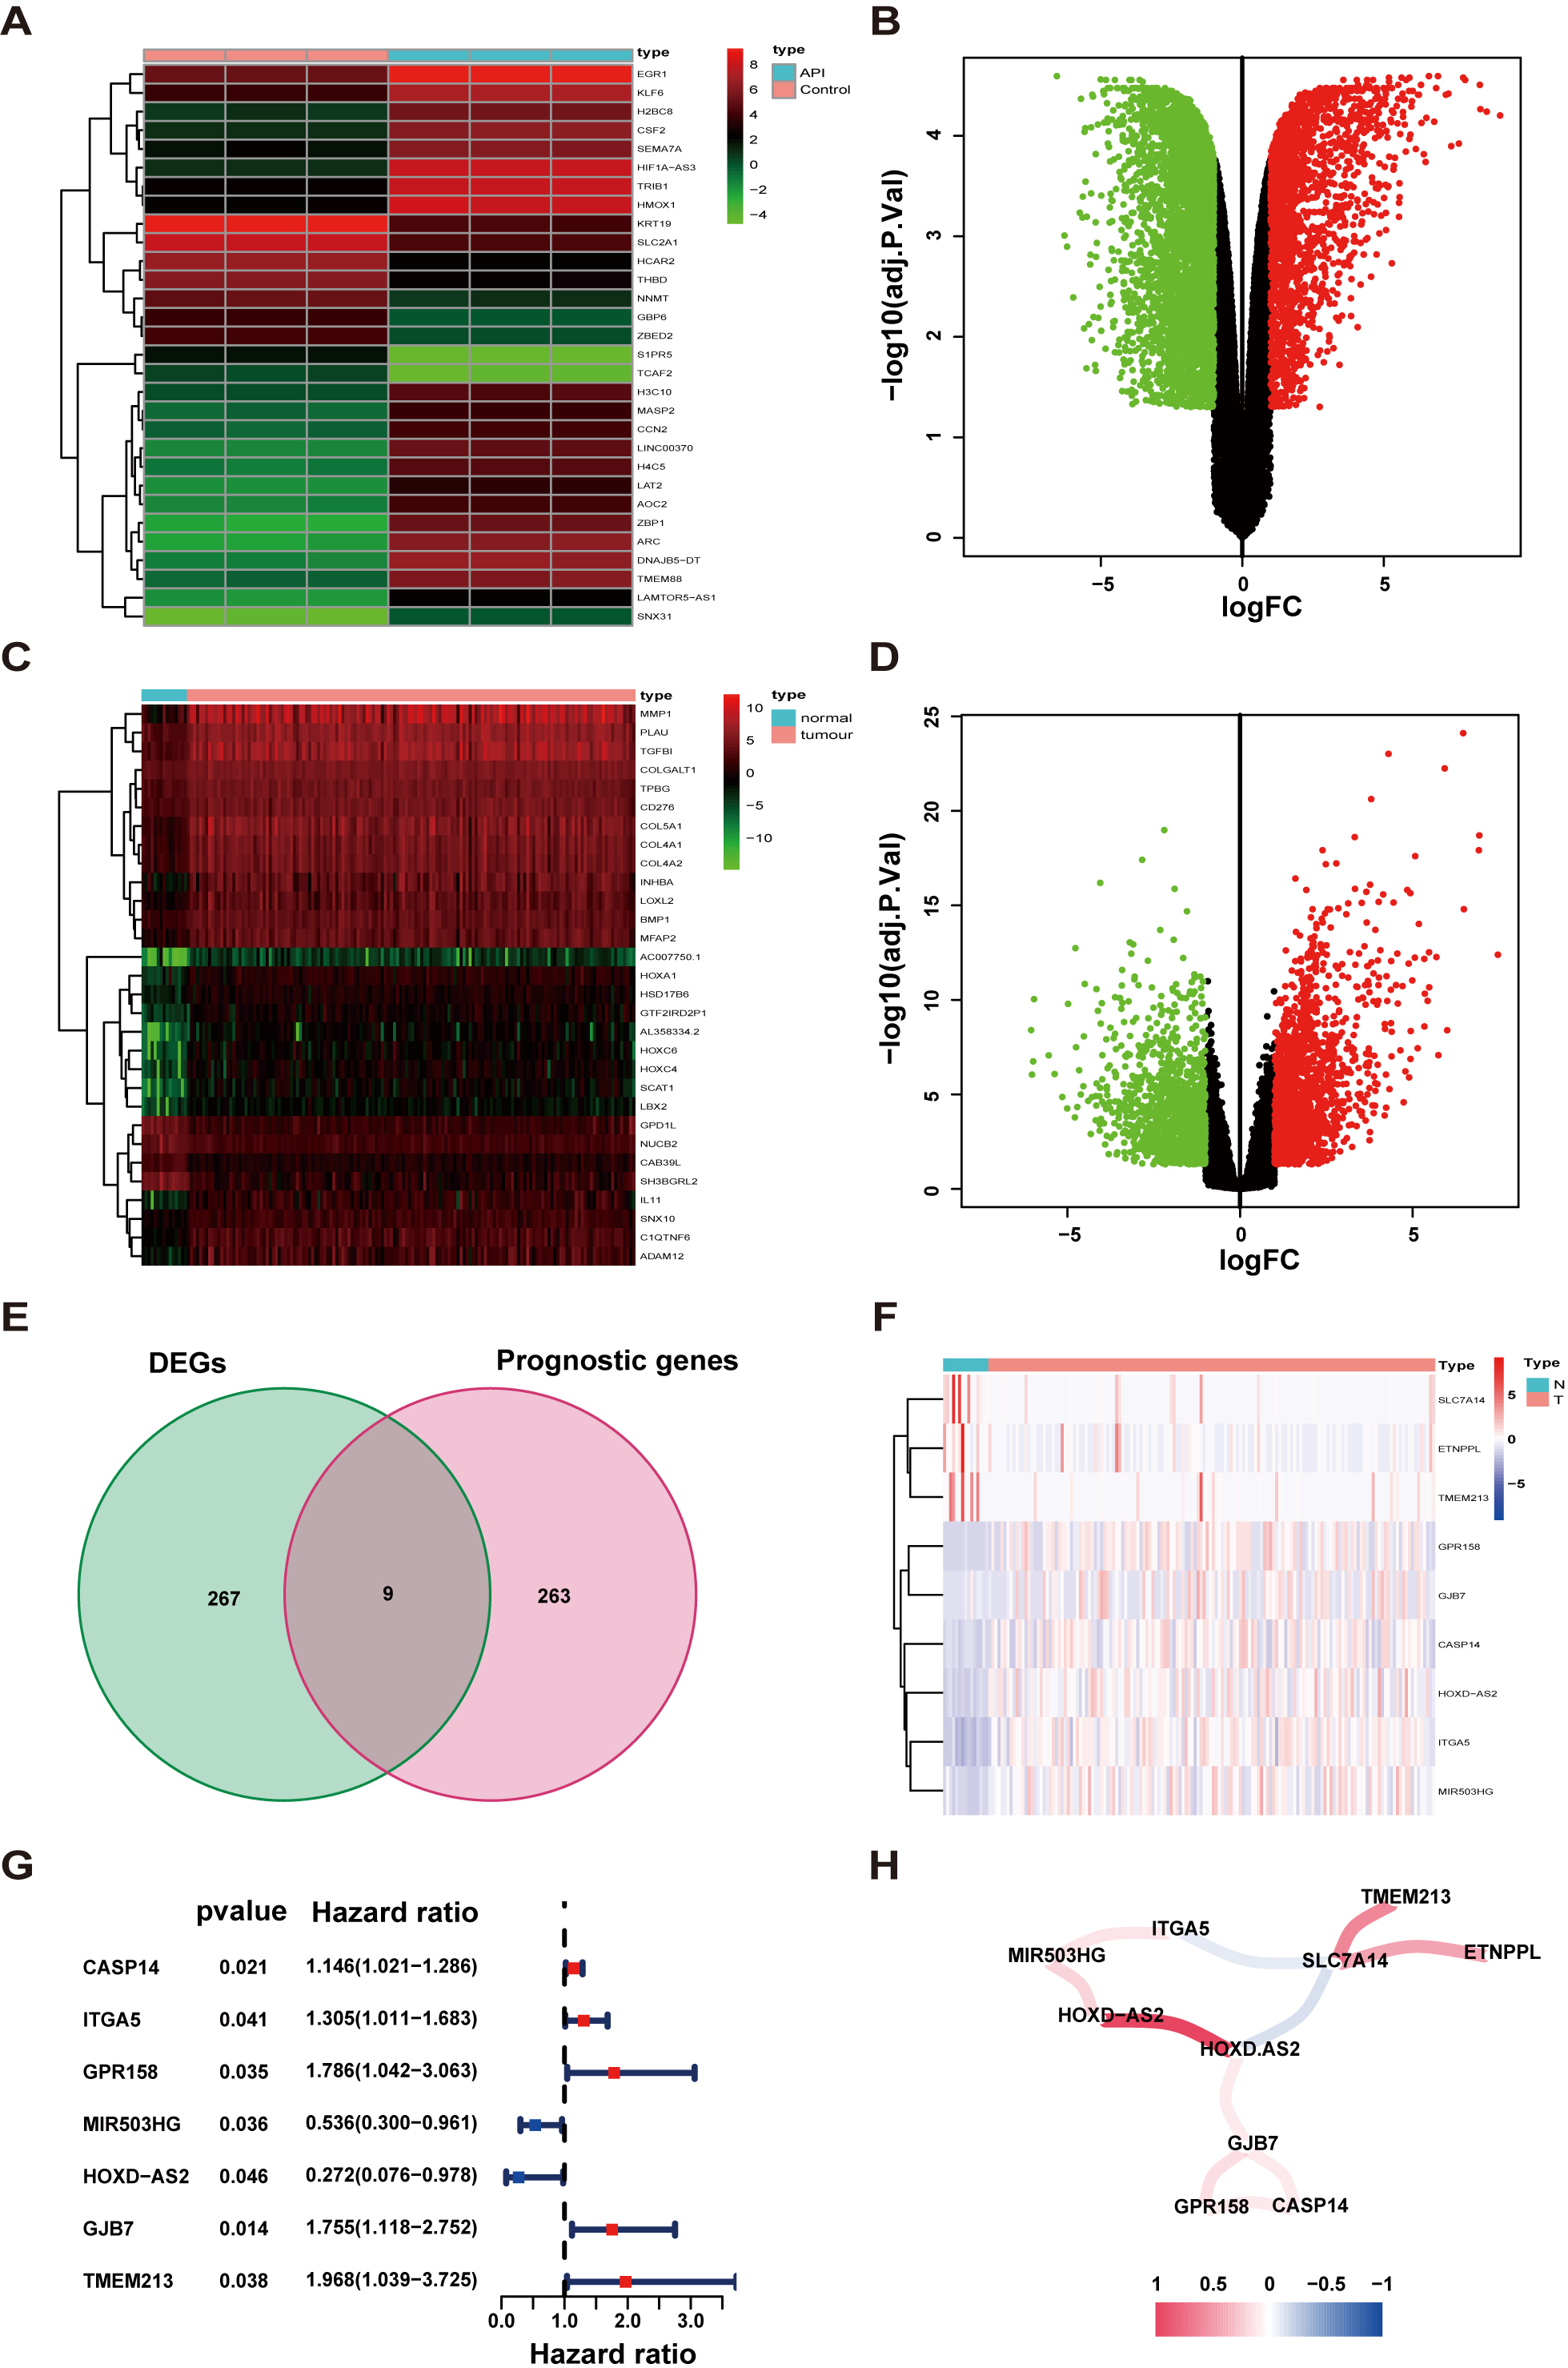 Fig. 3.
Determination of prognostic API-related differentially expressed genes (DEGs). (A,B) Heatmap and volcano plot of API-related DEGs. (C,D) Heatmap and volcano plot of TSCC-related DEGs. (E) Venn diagram to determine API-related DEGs that were associated with overall survival (OS). (F) The expression of 9 overlaying key genes in tissues. (G) Through univariate Cox regression analysis, Forest plots display the relationship between OS and gene expression. (H) The network of prognostic API-related genes (red and blue lines represent positive and negative relativities, respectively). Darker colors represent stronger associations. FC, fold change.
| Variables | TCGA cohort | |
| No. of patients | 156 | |
| Age (years) | ||
| 78 (50%) | ||
| 78 (50%) | ||
| Gender (%) | ||
| Female | 50 (32.1%) | |
| Male | 106 (67.9%) | |
| Grade | ||
| 1 | 20 (12.8%) | |
| 2 | 99 (63.4%) | |
| 3 | 28 (17.9%) | |
| 4 | 4 (2.5%) | |
| Unknown | 5 (3.1%) | |
| Stage | ||
| I | 13 (8.3%) | |
| II | 24 (13.5%) | |
| III | 35 (22.4%) | |
| IV | 65 (41.5%) | |
| Unknown | 19 (12.1%) | |
| Survival status | ||
| Alive | 97 (62.1%) | |
| Dead | 59 (37.8%) | |
TSCC, tongue squamous cell carcinoma.
In the Human Protein Atlas database, only 4 genes (CASP14, TMEM213, GPR158, and ITGA5) of this prognostic model have been analyzed immunohistochemically. As displayed in Fig. 4A, the protein expression of these four genes was shown to be different in normal tissues than in tumor tissues (Fig. 4A).
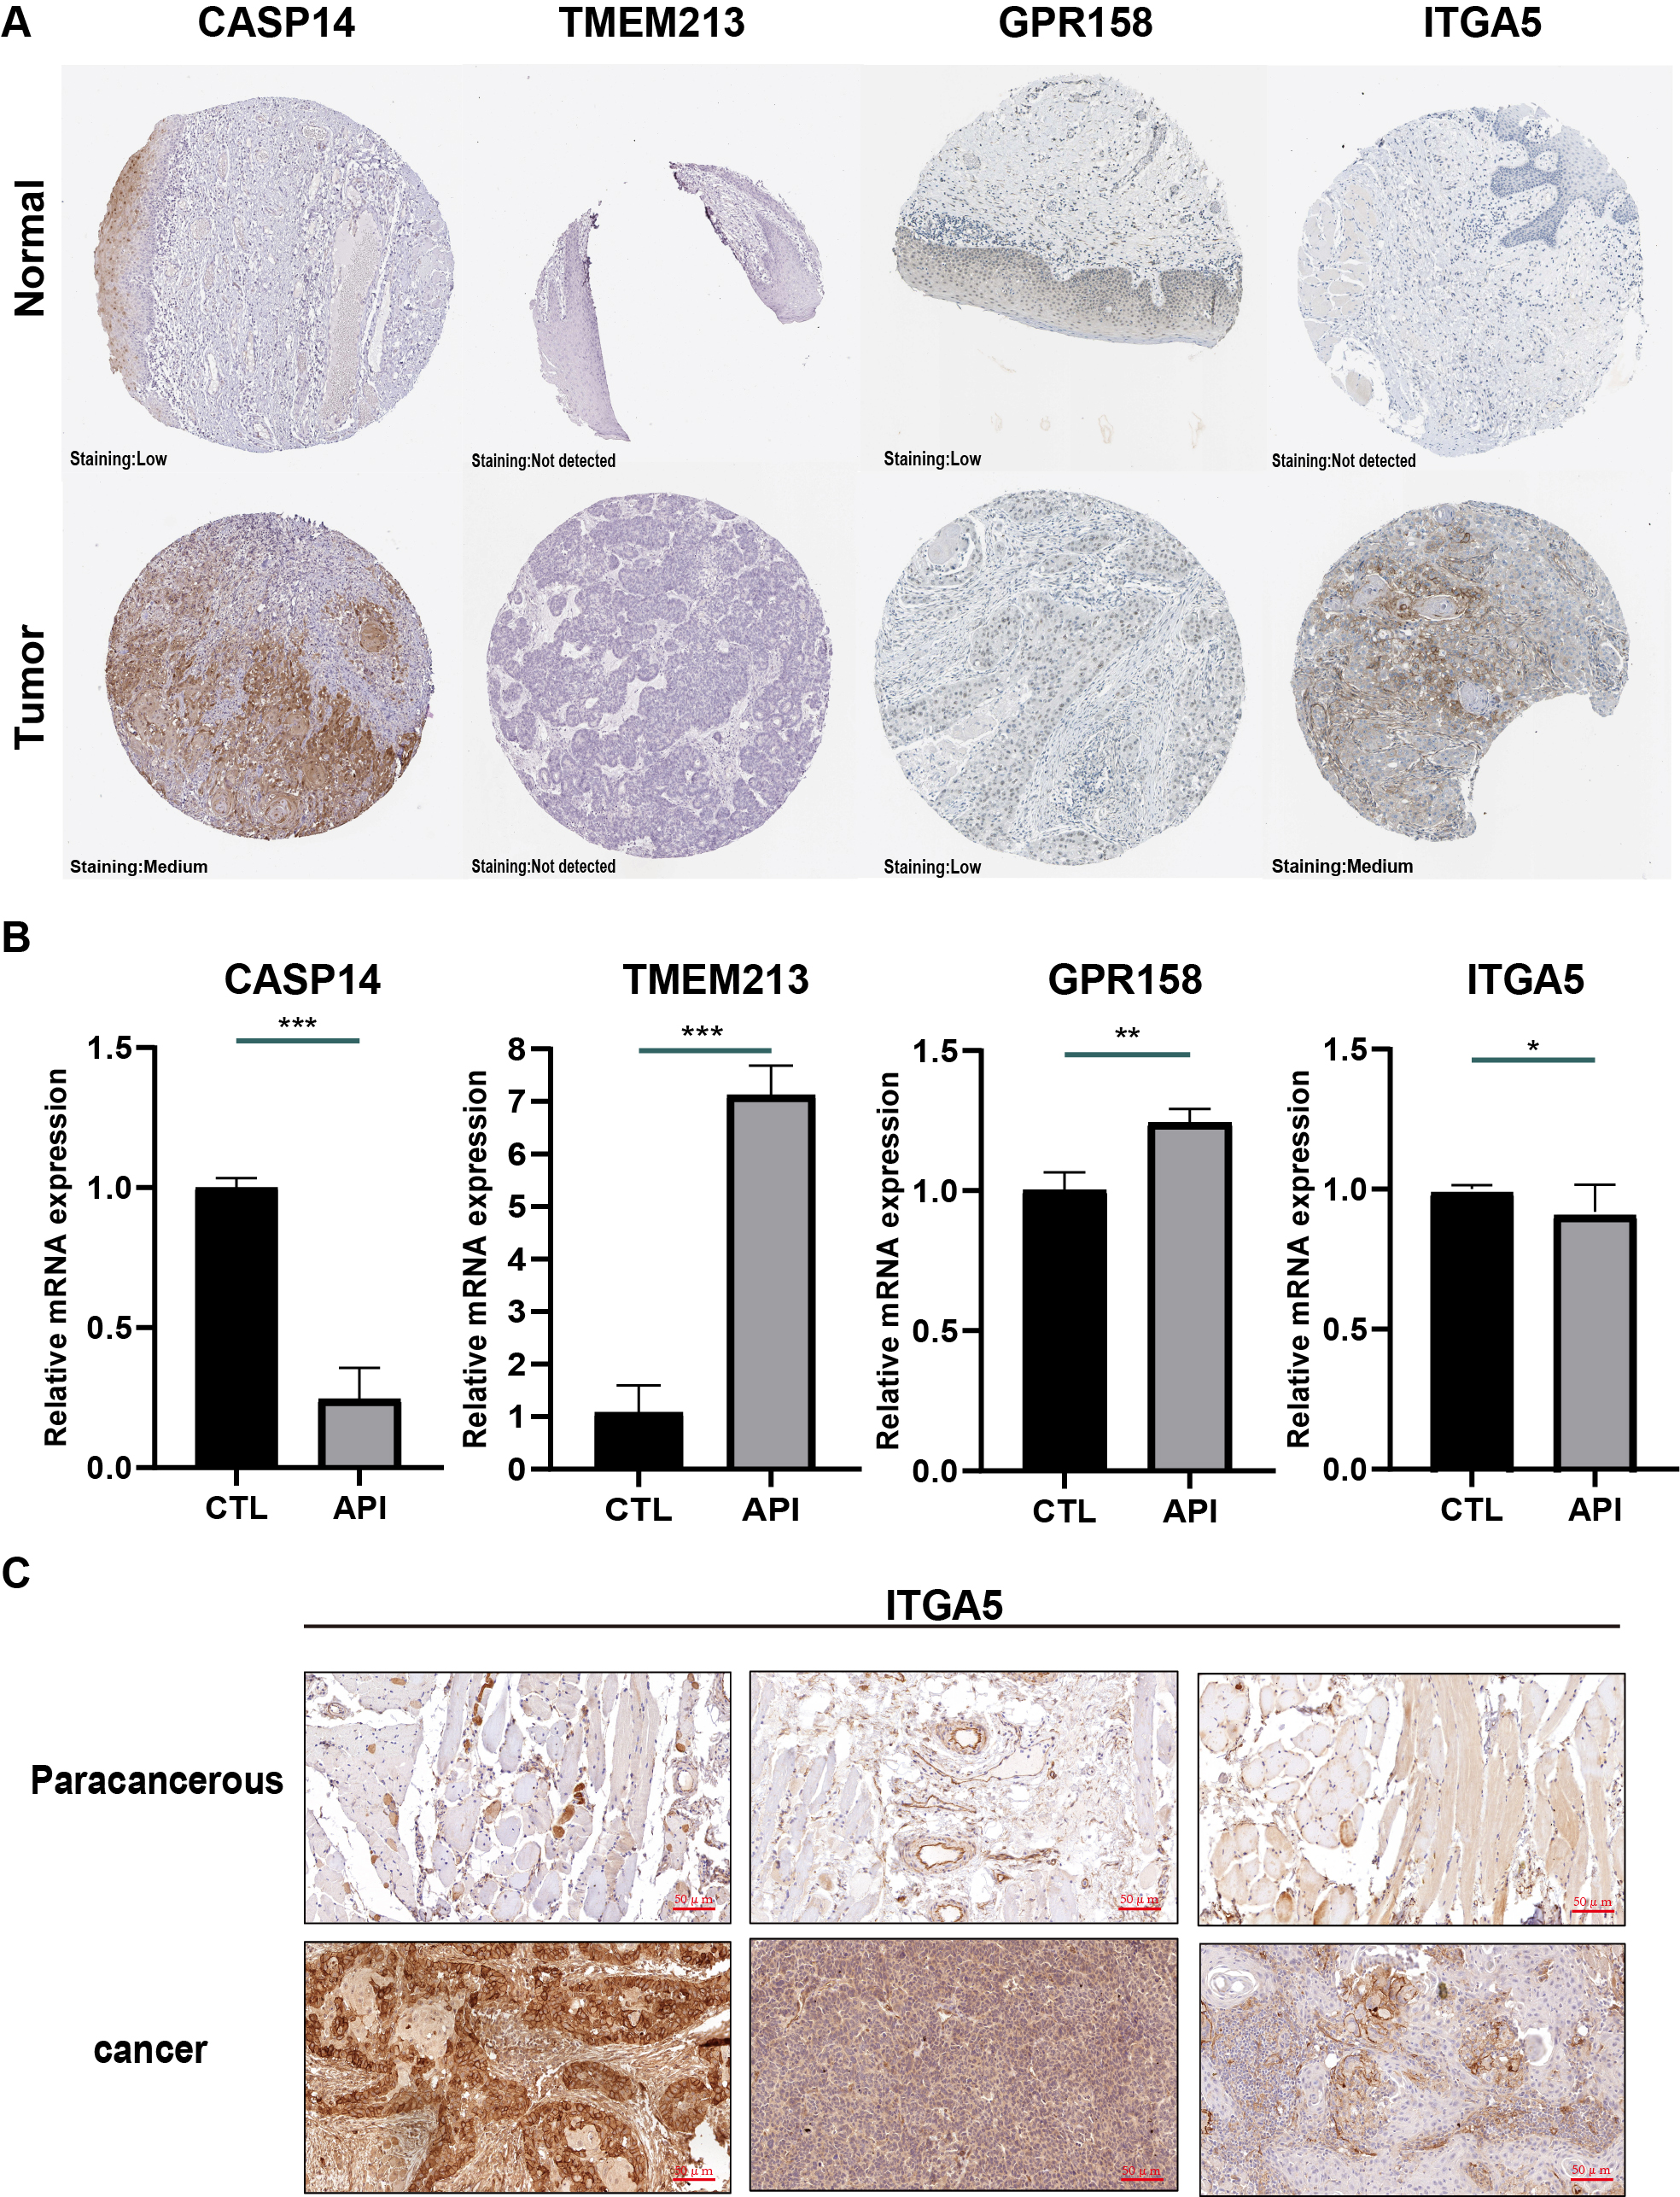 Fig. 4.
Validation of genes in this prognostic model. (A)
Immunohistochemistry results of tissue samples from the Human Protein Atlas
database (image available from v15.proteinatlas.org). (B) mRNA levels of caspase 14 (CASP14), transmembrane protein 213
(TMEM213), G protein-coupled receptor 158 (GPR158), integrin subunit alpha 5
(ITGA5) in SCC-9 cells. (*p
To validate these 4 genes in SCC-9 cells, RT-qPCR was utilized to evaluate their mRNA expression. These SCC9 cells were treated with or without 20 µM API for 24 hours. According to the results, TMEM213 and GPR158 mRNA levels were increased in the API group. In comparison with the CTRL group, the mRNA expression of CASP14 and ITGA5 was downregulated (Fig. 4B). In these 4 genes, ITGA5 and CASP14 are oncogenes, and API inhibits their expression. Since HR in ITGA5 is much higher (Fig. 3G), we further confirmed that ITGA5 was enhanced in tumor tissues than in paracancerous tissues through IHC (Fig. 4C).
Then, a prognostic model was constructed from the 7 genes noted above using
LASSO Cox regression analysis. The risk score formula is listed below [26]: e
(0.070
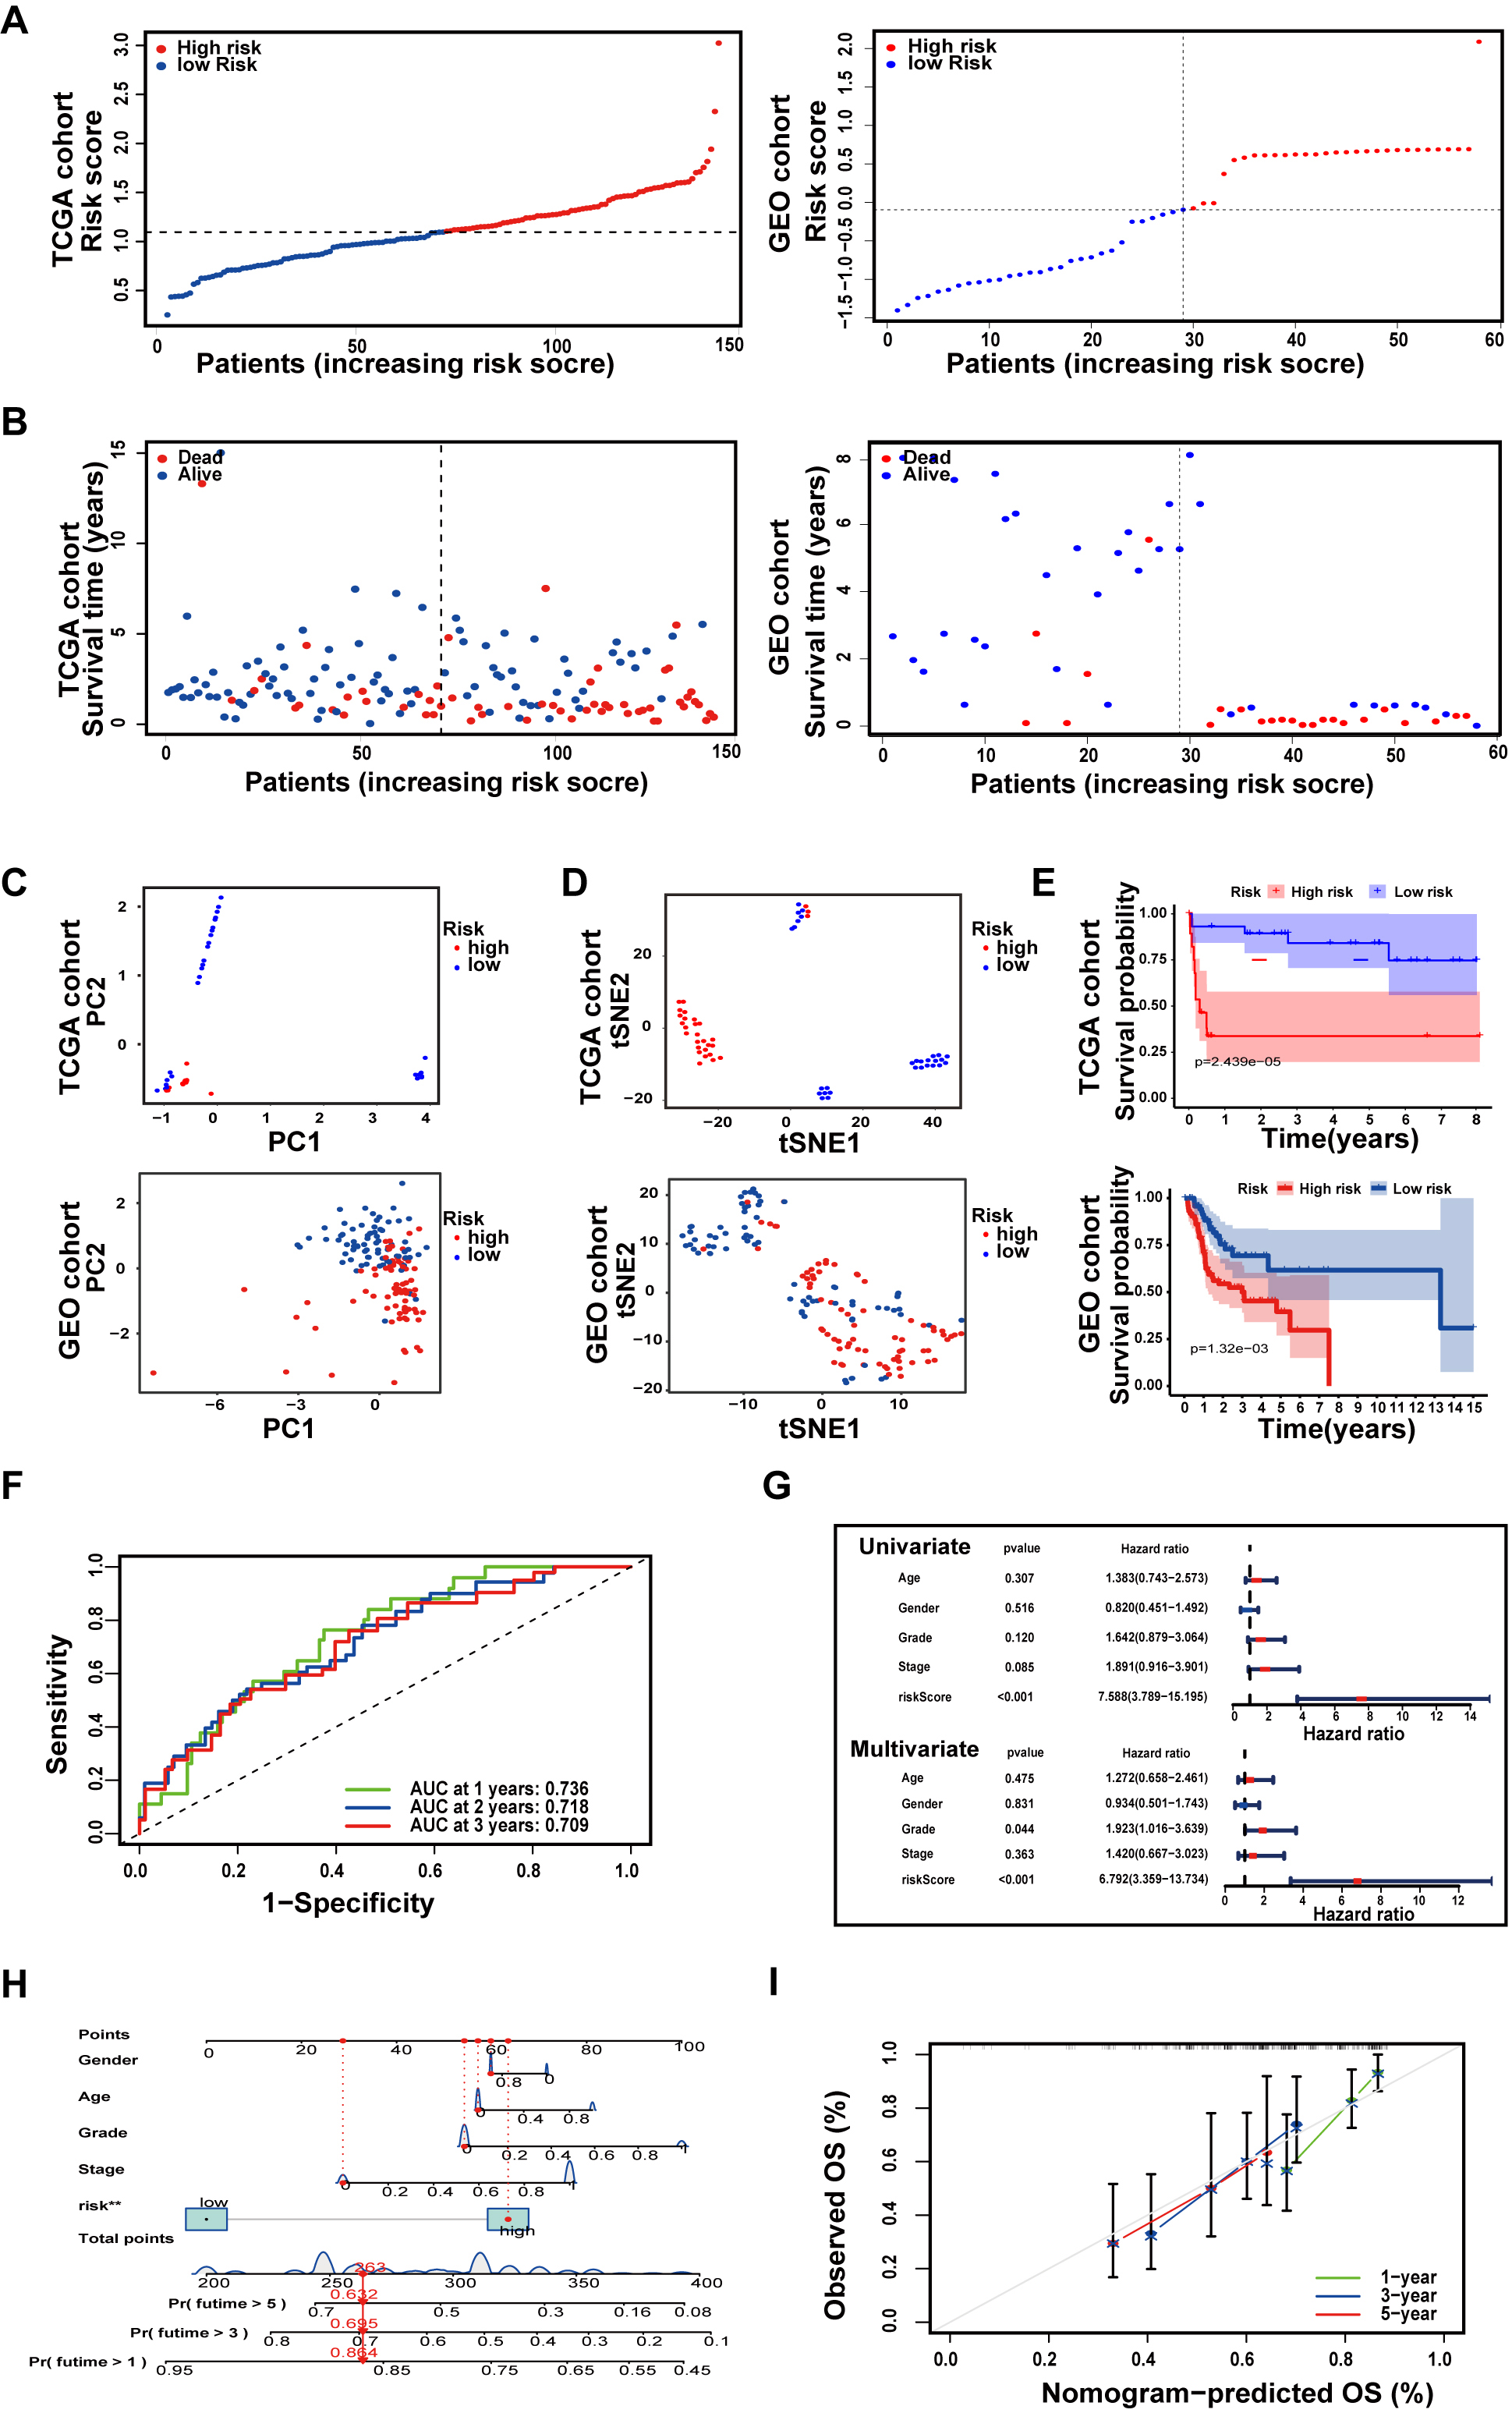 Fig. 5.
Establishment and Validation of an API-related prognostic model. (A) The distribution of TSCC patients with risk scores in the The Cancer Genome Atlas (TCGA) cohort and Gene Expression Omnibus (GEO) cohort. (B) The locations and OS status of TSCC patients with different risk scores in the TCGA cohort and GEO cohort. (C) Principal component analysis (PCA) plot of the prognostic model. (D) t-SNE analysis of the prognostic model. (E) Kaplan‒Meier survival curve of TSCC patients. (F) ROC curves demonstrate the predictive validity of risk scores. (G) Forest plots for univariate and multivariate Cox regression analysis of patients in TCGA. (H) Nomogram predicting 1-, 2-, and 3-year OS in TSCC patients. (I) Calibration curves for consistency testing between forecasted and real OS.
Subsequently, to verify the reliability of the model established in the TCGA cohort, the patients from the GEO cohort were also placed in either a high- or low-risk group by the median value obtained as the same formula as that in the TCGA cohort (Fig. 5A). And from Fig. 4B, Patients in the low-risk group were more probably to own a longer OS (Fig. 5B). Similar to the outcome received from the TCGA cohort, PCA and t-SNE analysis revealed that the distribution of patients in two subgroups was in discrete directions (Fig. 5C,D). In addition, patients in the high-risk group had worse survival rates compared to the low-risk group (Fig. 5E).
After eliminating samples with inconclusive clinical information, ROC analysis was utilized to calculate AUCs. As revealed in Fig. 5F, the AUCs of the 7-gene model for 1-, 2-, and 3-year survival were 0.736, 0.718, and 0.709, respectively. The risk score was proven to be a stand-alone forecaster of OS in TSCC patients through univariate and multivariate Cox regression analyses (Fig. 5G). Then, all associated clinical factors for patients in the TCGA were used to build a predictive nomogram for OS (Fig. 5H). The red dot represents the total clinical characteristics score in a TSCC patient from the TCGA, which is 263 points. This red dot also indicates that the survival probabilities in this patient for 1, 3, and 5 years were 85.4, 69.5, and 53.2%, respectively. The 1-, 3-, and 5-year OS of TSCC patients were also evaluated using calibration curves (Fig. 5I).
Aiming to determine the function of API-related prognostic genes, GSEA was utilized to diagnose relative underlying pathways between the low- and high-risk groups. Based on the results, the enriched pathways in the high-risk group were mostly specialized in focal adhesion, ECM receptor interaction, viral myocarditis, regulation of actin cytoskeleton, leishmania infection, and coagulation cascades (Fig. 6A). The enriched mechanisms of the low-risk group were Parkinson’s disease, oxidative phosphorylation, Huntington’s disease, Alzheimer’s disease, seven amino acid metabolism, and one carbon pool by folate (Fig. 6B).
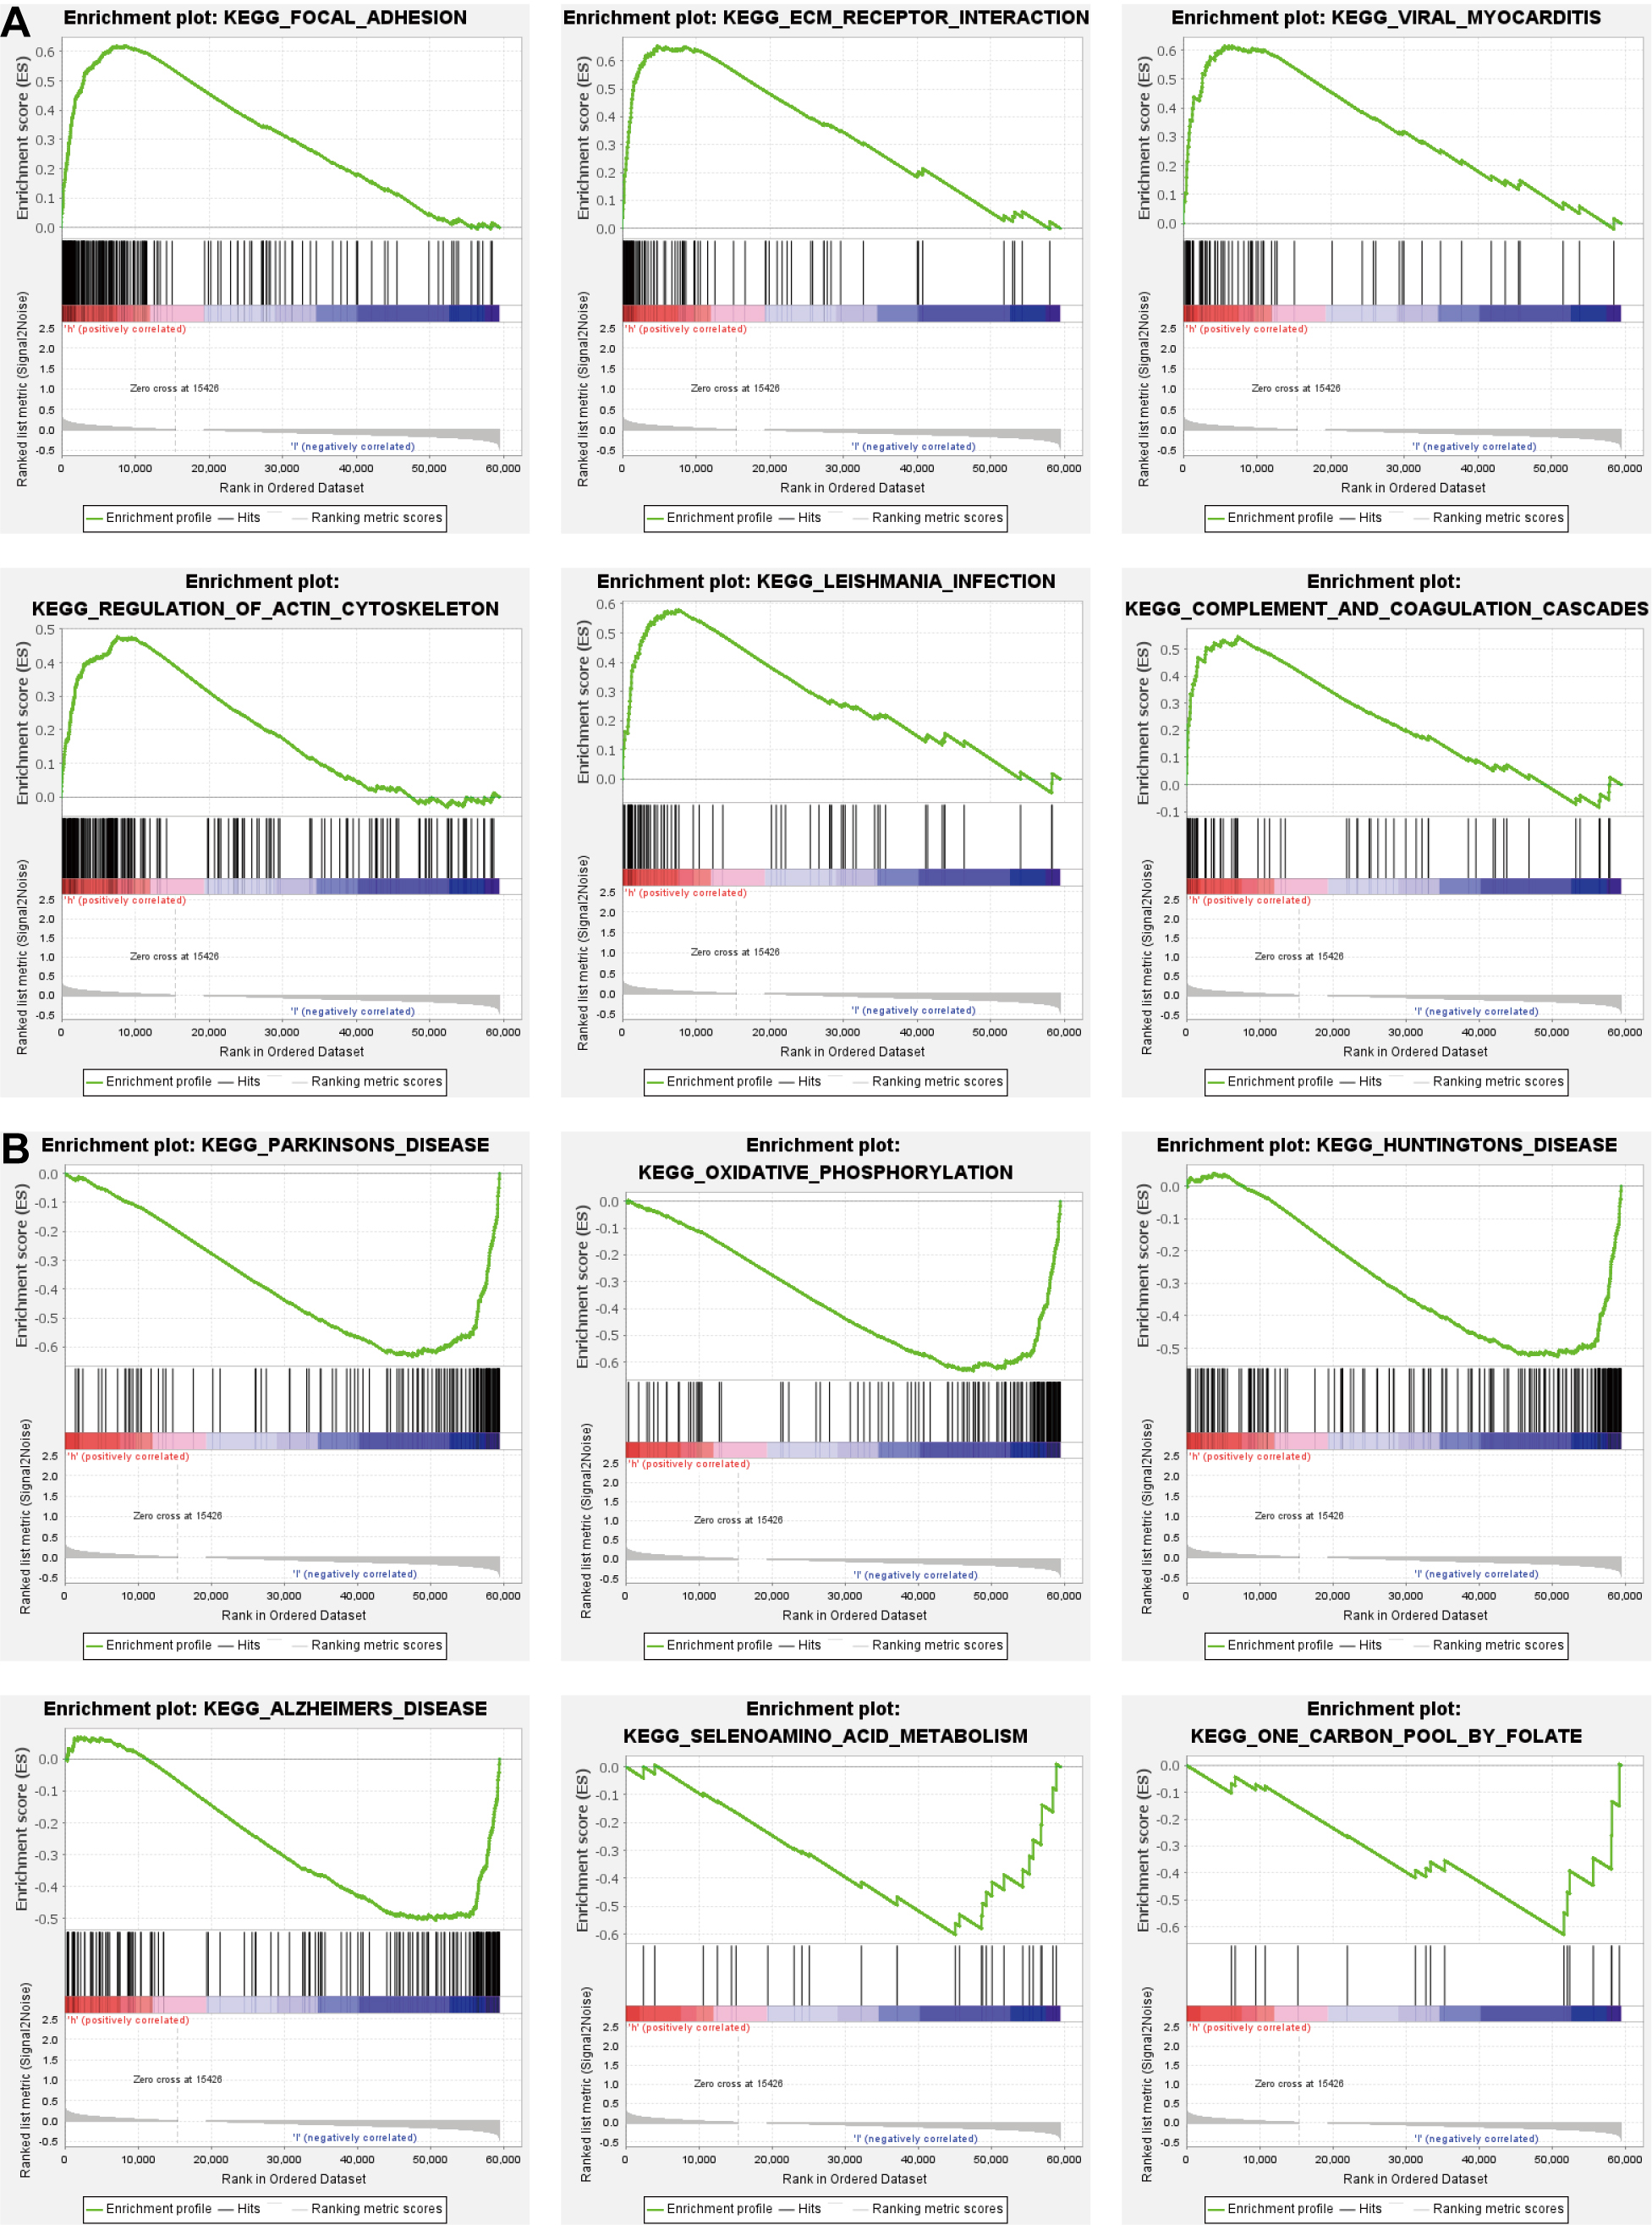 Fig. 6.
Functional analysis based on the prognostic model. (A,B) Mechanisms dramatically enriched in high- (A) and low-risk groups (B) through gene set enrichment analysis (GSEA).
As shown in Fig. 7A, the risk score was linked to regulatory T cells (Tregs), follicular helper T cells, CD8 T cells, resting mast cells, memory B cells, and M1 macrophages (Fig. 7A). In addition, a correlation between the 7 genes and the number of immune cells was also observed. The results showed that some immune cells were easily affected by these 7 genes (Fig. 7B). Additionally, T cells can be inhibited by stromal activation of the TME. The tumor stroma and ESTIMATE scores were much lower in the low-risk group than in the high-risk group (Fig. 7C).
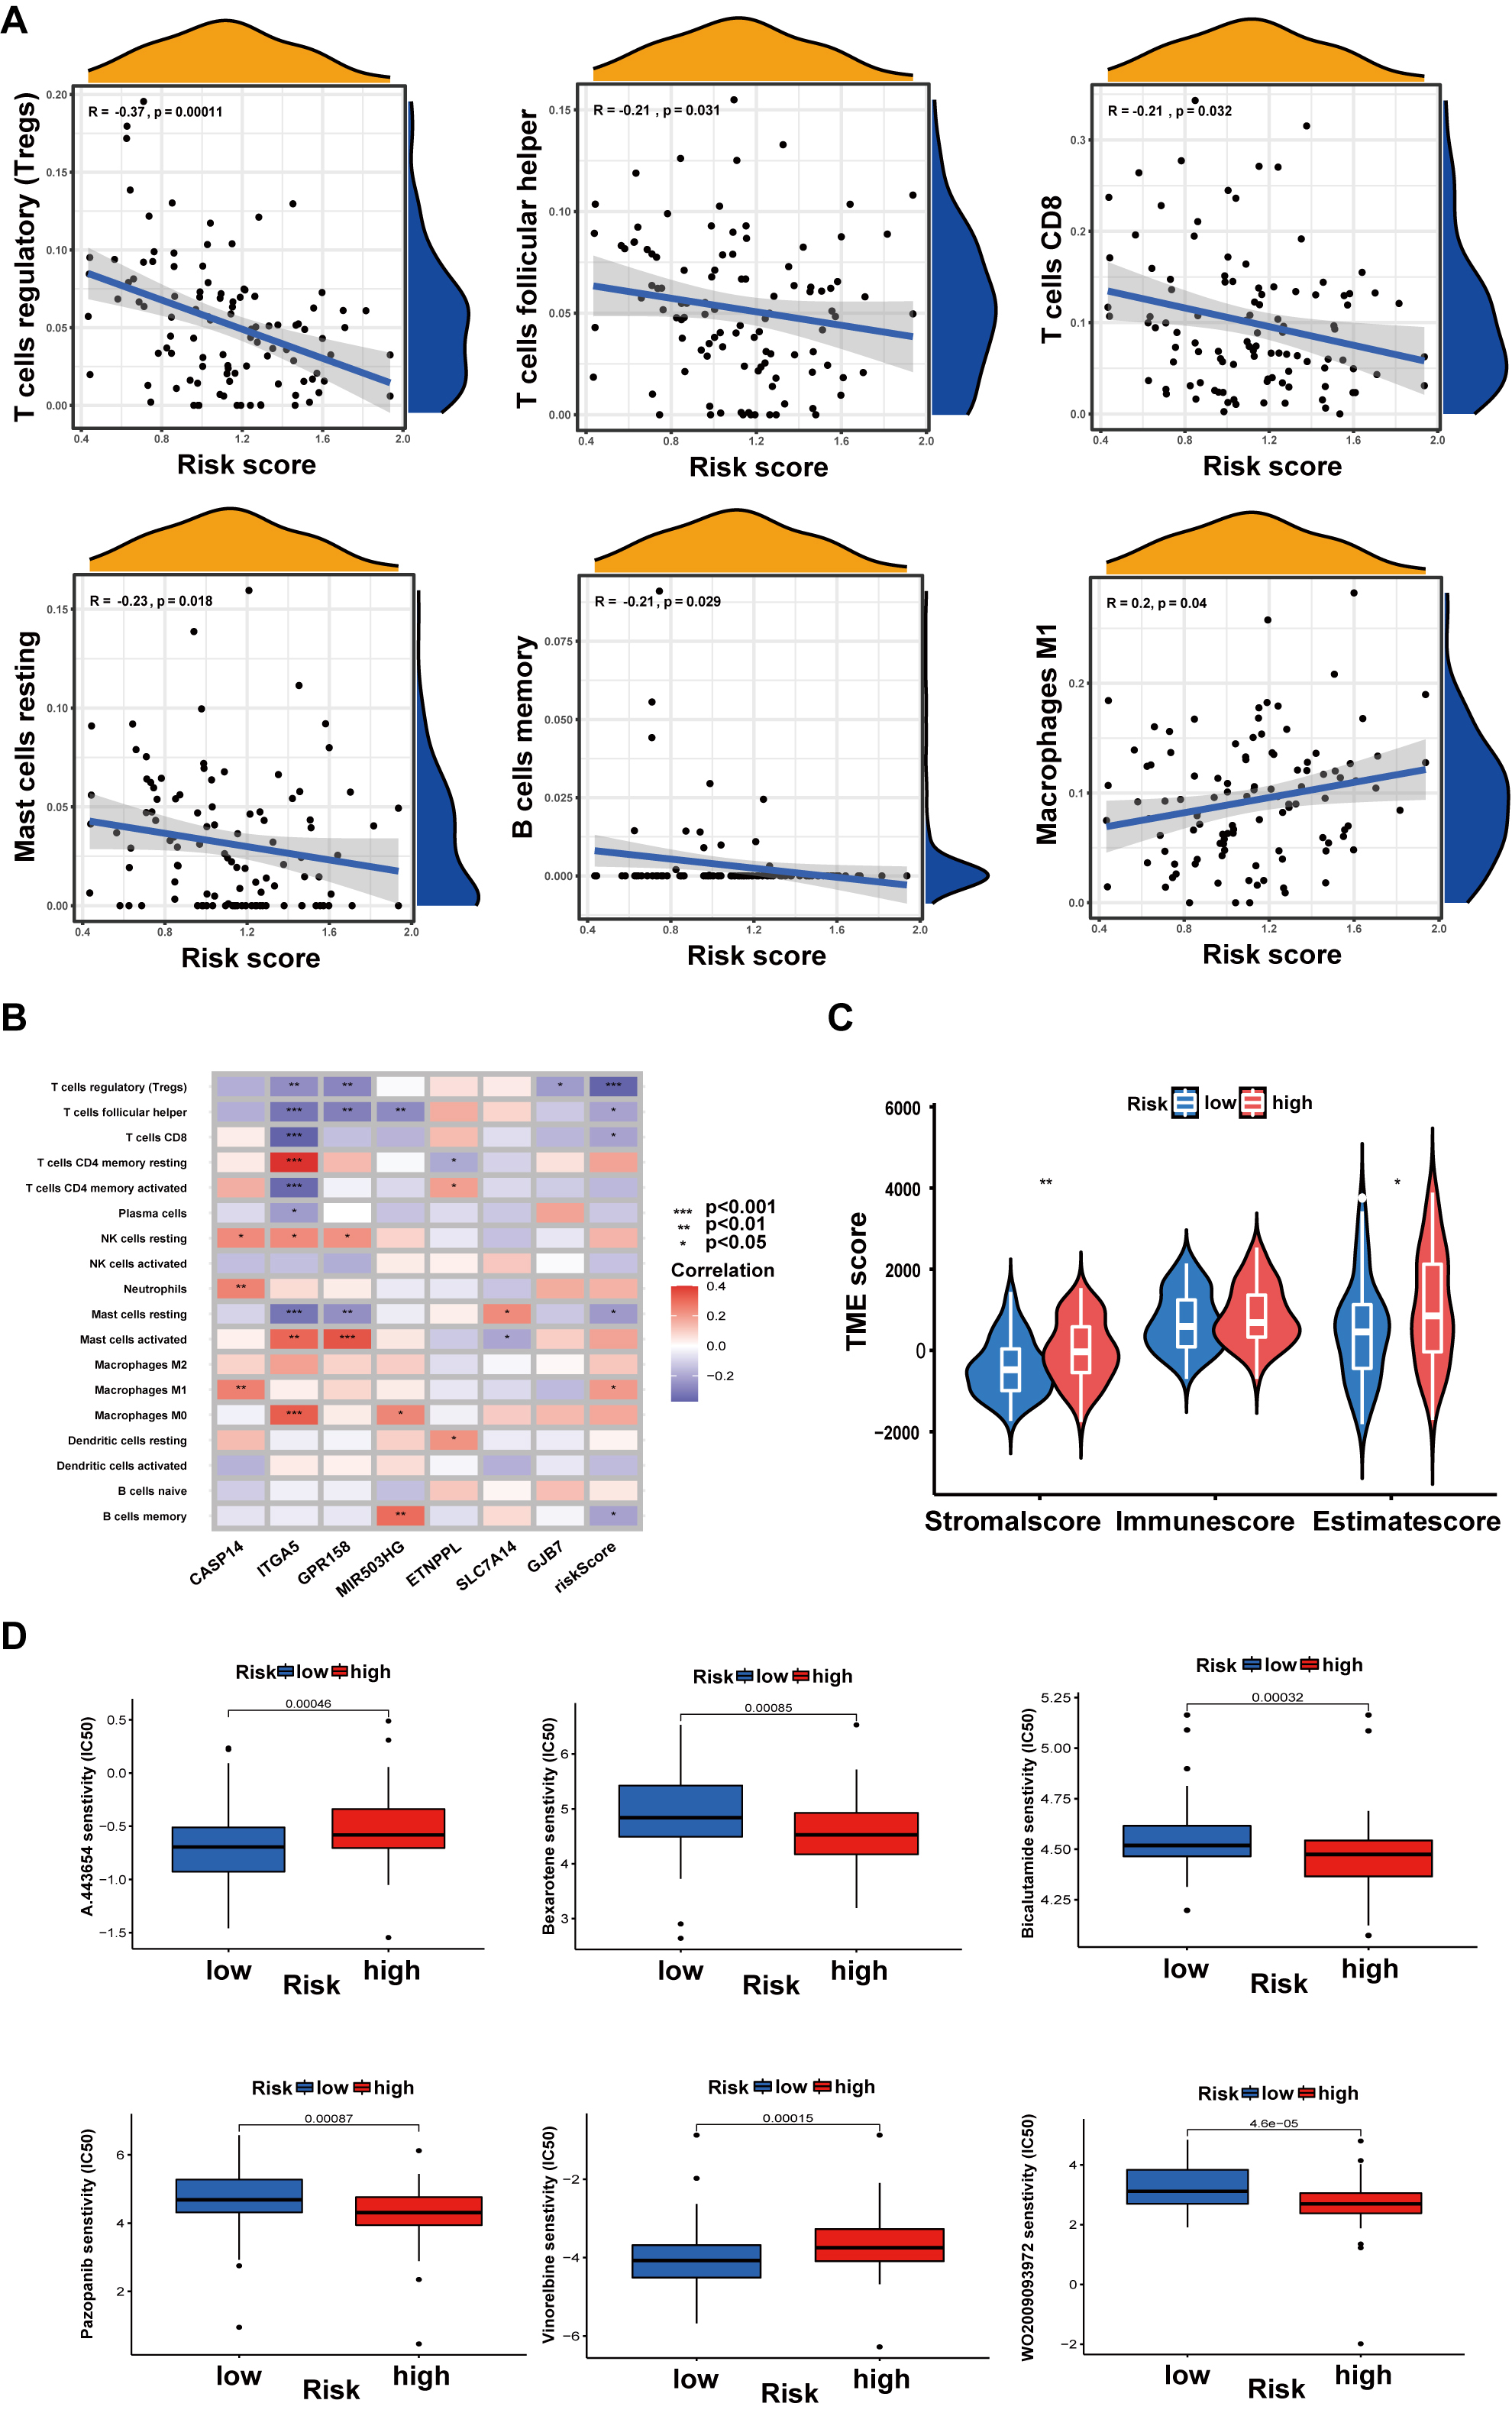 Fig. 7.
Relationship between risk score and tumor microenvironment (TME)
or Drug susceptibility. (A) Relations between risk score and immune cell types.
(B) Seven genes in the prognostic model were associated with the number of immune
cells. (C) Relationships between risk score and TME scores. (D) Drug
susceptibility. Data are shown as the mean
A drug susceptibility test was performed to analyze the effect of anticancer drugs in different risk groups. In the high-risk group, the results indicated that the IC50 values of bexarotene, bicalutamide, pazopanib, and WO2009093972 were much lower. The chemotherapeutic agents in the high-risk group, including A443654 and vinorelbine, had higher IC50 values than those in the low-risk group (Fig. 7D).
Previous studies have demonstrated that API has various biological functions,
including antitumor, anti-inflammatory, and antioxidant activities [30].
Regarding antitumor function, a recent study pointed out that API could induce
apoptosis in the A431 cell line by downregulating sulfiredoxin expression [31].
In addition, in the KRAS-mutant NSCLC model, API could effectively reduce the
proliferation ability [32]. Moreover, under hypoxic conditions in gastric cancer
cells, API initiates autophagic cell death through inhibition of HIF-1
In the present work, we first proved that API can efficiently reduce cell proliferation and migration in TSCC cells, which provides new drug options for clinical treatment. Then, through RNA-seq data and the GEO database, we identified 7 key API-related prognostic genes (CASP14, TMEM213, GPR158, MIR503HG, HOXD-AS2, GJB7, and ITGA5). These genes all displayed potential as prognostic biomarkers. In terms of CASP14, alterations in CASP14 expression could lead to tumor pathogenesis and progression [33]. It was discovered that CASP14 expression was decreased in some malignant cancers. In addition, high expression of TMEM213 could promote the development of renal cell carcinoma [34]. Regarding GPR158, a study revealed that GPR158 is essential in prostate cancer growth and progression [35]. In vascular disease, MIR503HG deficiency enhanced the conversion of endothelial cells to mesenchymal cells [36]. In vivo, silencing of lncRNA HOXD-AS2 prevents glioma cell proliferation, and its expression level relates to tumor grade and prognosis in GBM [37]. Additionally, GJB7 was found to be mutated in gastric and colorectal cancers [38]. ITGA5, a member of the integrin alpha chain family, has been shown to function in promoting cancer cell infiltration and migration [39]. In breast cancer, high expression of ITGA5 in tumor cell-derived extracellular vesicles can increase metastasis probability [40]. In our research, ITGA5 was performed as an oncogene with higher HR value and elevated in TSCC tumor tissues compared to paraneoplastic tissues of patients. Previous studies show that ITGA5 could effectively promote TSCC cell proliferation and migration [41], which is consistent with our findings.
Next, we demonstrated a novel independent prognostic model based on these 7 key
API-related prognostic genes. At present, there are some other prognostic models
for TSCC patients. Prognostic models incorporating age, tumor nodal metastasis
(TNM) stage, erythrocytes, platelets, and platelet-to-lymphocyte ratios can be
effective in improving the accuracy of OS prediction for TSCC [42]. Besides,
prognostic models that include the variables of inflammatory response, tumor
outgrowth, and depth of infiltration are strongly associated with TSCC lymph node
metastasis and recurrence and can be used as predictors of survival in patients
with TSCC [43]. Additionally, some researchers have developed prognostic models
using 11 key predictor genes through Cox and LASSO analysis of The Cancer Genome
Atlas and the GSE65858 database (on overall survival) [44]. The risk model had a
better prognosis than other clinical features. However, there are no prognostic
models in TSCC that incorporate treatment-associated genes into the construct
system at this time. We integrated API-associated genes into the TSCC prognostic
modeling system, which can better evaluate the ability of API to influence the
prognosis of patients. Our study also found that the risk score based on this
prognostic model was closely correlated with immune cells and the TME, which
means that API may inhibit SCC-9 cellular activity by affecting immune cells. The
TME, composed of various cellular and noncellular actors, has been demonstrated
to impact cancer progression and the outcomes of cancer therapy [45]. Cancer
immune escape is an active process that regulates immune responses with the help
of immunosuppressive cells [46, 47]. And TSCC patients mostly suffer from
CD8
In summary, several limitations were present in this study. First, the data in this research were mostly obtained from TCGA databases, and more real-world data are needed to validate their accuracy. Second, the API-associated genes obtained in this study that can guide TSCC prognosis, immune microenvironment, and combination drug therapy need to be further investigated for their biological functions.
In conclusion, our research validated the efficacy of API in inhibiting cancer progression using in vitro experiments. Furthermore, we incorporated therapeutic factors with disease occurrence and progression factors to construct a fusion of innovative prognostic models for TSCC tumor patients. The API-related prognostic model was well-predicting patient OS and the immunological status of the TME. In addition to API, we identified six drugs that may be potentially efficacious in the treatment of TSCC. The results of this study have the potential to improve clinical outcomes and overall survival in patients with TSCC.
TSCC, Tongue squamous cell carcinoma; API, Apigenin; DEGs, differentially expressed genes; ROC, Receiver operating characteristic; TCGA, The Cancer Genome Atlas; TME, tumor microenvironment; ATCC, American Type Culture Collection; IC50, The semi-inhibitory concentration; CCK-8, the Cell Counting Kit-8; FDR, false discovery rate; OS, overall survival; PCA, Principal component analysis; t-SNE, t-distributed stochastic neighbor embedding; GEO, the Gene Expression Omnibus; M, Kaplan–Meier; FBS, fetal bovine serum; IHC, Immunohistochemistry; GSEA, Gene set enrichment analysis; cDNA, complementary DNA.
The datasets generated and/or analysed during the current study are available in the Gene Expression Omnibus database (https://www.ncbi.nlm.nih.gov/geo/); [GEO accession: GSE111395 (https://www.ncbi.nlm.nih.gov/geo/query/acc.cgi?acc=GSE111395), and GSE75540 (https://www.ncbi.nlm.nih.gov/geo/query/acc.cgi?acc=GSE75540)].
FQ designed the study. JL and CF made contributions to the data analyses. JL drew up the manuscript. GZ and CS accomplished statistical analysis for the data. FY and WG conducted molecular experiments. JD performed the experimentation on animals. JX and CL processed figures and tables. FQ undertook support for the project. All authors have browsed and agreed with the final manuscript. All authors contributed to editorial changes in the manuscript. And all authors have participated sufficiently in the work and agreed to be accountable for all aspects of the work.
This study has been reviewed and approved by the ethics institution committee of Gaoxin Branch of the First Affiliated Hospital of Nanchang University (No. [2024]01), Nanchang, China, and compliance with the declaration of Helsinki.
Not applicable.
This study was supported by the grants from National Natural Science Foundation of China (No. 81960495), the Jiangxi Provincial Natural Science Foundation (No. 20212ACB206029), and the Nanchang Key Laboratory of Tumor Gene Diagnosis and Innovative Treatment Research (No. 2021-NCZDSY-009).
The authors declare no conflict of interest.
Publisher’s Note: IMR Press stays neutral with regard to jurisdictional claims in published maps and institutional affiliations.