
- Academic Editor
Background: World Health Organization (WHO) grade 4 adult-type diffuse
glioma is the most malignant primary tumor of the brain. Nucleolar protein 14
(NOP14) is recognized to contribute significantly to the assembly of
small ribosomal subunits. However, the specific involvement of NOP14 in diverse
cancers remains poorly understood, particularly its role in adult-type diffuse
glioma, which has yet to be elucidated. Methods: A total of 20
adult-type diffuse glioma samples with varying WHO stages were collected. The
protein level of NOP14 was detected using immunohistochemistry. Additionally,
NOP14 expression in LN229 and U251 cell lines and collected clinical tissue
samples was quantified using the Western blot technique. Furthermore, the
correlation between NOP14 and clinicopathological features, survival
rates, matrix and immune scores, and immune components was investigated using
data from the Cancer Gene Atlas database. Results: NOP14
exhibited high expression in adult-type diffuse glioma patients, with the highest
expression observed in the LN229 cell line. Moreover, elevated NOP14
expression was significantly correlated with poorer overall survival and
demonstrated an association with unfavorable pathological features in a cohort of
703 glioblastoma (GBM) patients. Evidence of a connection between NOP14
and the tumor microenvironment was presented. Elevated NOP14 was linked
to the infiltration of CD8
Approximately 80% to 85% of malignant brain tumors in adults are gliomas [1]. Gliomas exhibit a diffuse infiltration of the brain parenchyma, with an annual incidence of approximately 6.4 per 100,000 people [2]. The World Health Organization (WHO) Classification of central nervous system (CNS) tumors, Version 5, serves as an international standard for the classification of brain and spinal cord tumors. In this classification, adult diffuse gliomas are identified as a specific type [3]. Among these gliomas, WHO grade 4 adult diffuse glioma represents the most malignant type of primary brain tumor. Unfortunately, even with the current standard therapy (consisting of maximum surgical resection and concurrent chemotherapy with temozolomide), the median survival remains less than 15 months [3].
The human nucleolar protein 14 (NOP14) gene, located on chromosome 4p16.317, encodes a nuclear protein that is responsible for processing 18s ribosomal RNA precursors, maturation, and synthesizing 40s ribosomal subunits [4]. Milkereit et al. [5] discovered that the depletion of NOP14 expression led to a decrease in the number of 20s versus 27sA2 ribosomal RNA precursors while causing an increase in the levels of 35s versus 23s precursor ribosomal RNA. Furthermore, Kühn et al. [6] demonstrated that the NOP14 protein facilitated the incorporation of Noc4p into processing bodies of the ribosomal small subunit by forming a complex with Noc4p-NOP14p. This complex then actively participated in the processing and maturation of the ribosomal small subunit and ribosomal RNA [6].
Previous studies have demonstrated the association between NOP14 and the occurrence, development, invasion, and metastasis of breast cancer, melanoma, straight colon cancer, and pancreatic cancer [7, 8, 9, 10]. Despite this, little research has been conducted on the role of NOP14 in adult-type diffuse glioma. Du et al. [7] discovered that NOP14 was upregulated in pancreatic ductal adenocarcinoma (PDAC) and metastatic tissues. They identified mutp53 as a functional target of NOP14 and showed that upregulation of NOP14 increased mutp53 mRNA stability, promoting tumor invasion and metastasis. Additionally, NOP14 overexpression stimulated cell motility, while its inhibition reduced the invasive capacity of PDAC cells. NOP14 has been identified as one of the hub genes and a potential biomarker for colorectal cancer development [8]. On the other hand, Meng et al. [8] demonstrated the downregulation of NOP14 in invasive breast cancer, inhibiting its progression. Similarly, NOP14 has been found to suppress the function and stemness of melanoma stem-like cells by inactivating the Wnt/beta-catenin signaling pathway [9, 10]. Hence, the function of NOP14 appears to vary depending on the specific type of cancer, acting as an oncogene in some tumors and a tumor suppressor gene in others. Nonetheless, the precise function and mechanism of NOP14 in human malignant tumors, including its correlation with prognosis and immune infiltration in glioma, remain largely unknown, establishing the need for further exploration.
Our study elucidates the crucial role of NOP14 in facilitating invasion
and migration in vitro while also revealing the perturbed immune status
in adult-type diffuse glioma, characterized by the exclusion of CD8
Twenty adult-type diffuse glioma specimens were collected through surgical resection at the 3201 Hospital, Affiliated with Xi’an Jiaotong University, from January 2021 to July 2022. The tissue specimens were routinely fixed in 10% neutral formalin and subsequently embedded in paraffin. Screening criteria: ① Patients with an initial diagnosis of glioma; ② Patients with no prior history of other associated malignancies or surgeries; ③ Patients with relatively comprehensive pathology-related data.
The study received approval from the Ethics Committee of the 3201 Hospital (approval number 2022082). All participants provided written informed consent. The clinical characteristics of the patients are presented in Supplementary Table 1.
Four fresh adult-type diffuse glioma tissues and four non-tumor brain tissue
specimens obtained through internal decompression of brain injury were collected
as controls. All samples were stored according to the standard in a liquid
nitrogen tank for 40 minutes in vitro. Protein extraction was conducted, followed
by the concentration determination utilizing the bicinchoninic acid assay (BCA)
method. The denatured protein was placed on ice and subjected to electrophoresis.
Then, the membrane was probed with the NOP14 primary antibody (1:2000,
Proteintech Group, Rosemont, IL, USA) and
All adult-type diffuse glioma samples were prepared following standard procedures, completely fixed with 10% neutral formalin, dehydrated, embedded, and then continuously sectioned at a thickness of 3 µm. The sections were dried and subjected to pretreatment using a DAKO PT Link automated immunohistochemical preconditioning system. Then, the sections were treated utilizing an AutostainerLink 48 (agilent.com.cn) fully automated immunohistochemical staining instrument. The rabbit monoclonal antibody against NOP14 (1:2000, Proteintech Group) was acquired from Proteintech Group Company. For external control, HepG2 cells were utilized as the positive control, phosphate-buffered saline (PBS) was substituted for the primary antibody as the negative control (NC), and red blood cells within the blood vessels served as the internal control.
The mRNA expression data of NOP14 and clinical data of glioblastoma (GBM) patients were obtained from the TCGA database (https://cancergenome.nih.gov/), and the data was processed utilizing R software (v3.6.3) and Perl (R Foundation for Statistical Computing, Vienna, Austria). The dataset included 701 patients diagnosed with GBM and 5 normal brain tissue samples. The glioma patients were categorized into high-expression and low-expression groups based on the median NOP14 mRNA expression.
The Strawberry Perl software integrated the NOP14 expression data from the TCGA-GBM dataset with tumor stage, histological grade, tumor size, and survival time of patients with GBM. The relationship between NOP14 and tumor stage was tested utilizing the Kruskal (KS) test. The difference in survival between high and low NOP14 expression groups was evaluated utilizing the Kaplan-Meier method. The predictive value of NOP14 was assessed utilizing multivariate Cox regression.
The gene expression data was classified into high and low groups using the
median value of NOP14 expression in the TCGA-GBM dataset. Gene Set
Enrichment Analysis (GSEA) software
(gsea-msigdb.org)
was utilized for c2.cp. Kegg.v7 in Molecular Tabel database (Molecular Signature
Database, Msig-DB). The 2.symbols.gmt data set was utilized as a set of
functional genes for conducting a signaling pathway enrichment analysis of
NOP14. The single gene enrichment results of NOP14 were
filtered based on the absolute normalized enrichment score (NES) values of 1. O,
NOM p-val
The relationship between NOP14 expression and the extent of immune cell
infiltration, including neutrophils, macrophages, B cells, CD4
The Tumor Immune Single-cell Hub (TISCH) database (http://tisch.comp-genomics.org/) integrated single-cell sequencing data from 27 cancers [11]. In this study, the Glioma_GSE148842 dataset was selected to test the NOP14 expression in individual cells within the GBM microenvironment, with the results visualized using a heatmap.
Human normal astroglial cells (HA1800) were grown in an RPMI 1640 medium
containing 10% fetal calf serum (FCS). Human glioma cell lines U87, U251, and
LN229 were cultivated in high glucose Dulbecco’s Modified Eagle Medium (DMEM)
with 10% FCS. All cell lines were validated by short tandem repeat (STR) profiling and tested negative for mycoplasma. All cells were kept at 37 °C with 5% CO
NOP14 F: 5
The cells were seeded into six-well cell culture plates one day prior to
transfection, with a density of 6
Cells from the NC and NOP14-siRNA groups were seeded onto 6-well plates
and cultured at 37 °C in a 5% CO
The cells were washed twice with PBS and subjected to serum-free DMEM starvation
for 12 hours. The treated cells were harvested utilizing trypsin digestion. A
single-cell suspension was then prepared and seeded in the Transwell upper
chamber (8 µm, 24-well insert; 5
Single-cell suspensions of the NC, NOP14-si1, and NOP14-si2 groups were seeded in 6-well plates (1000 cells per well). The cells were cultured in the incubator for 10 days after 24 hours. After fixation with 4% paraformaldehyde, the cells were counterstained with crystal violet. Clones of 50 cells were observed and counted under a microscope to construct the growth curve.
The statistical significance of the included data was determined by employing
either Student’s t-test (for pairwise comparisons) or two-way ANOVA (for
comparisons between multiple groups). Data are presented as fold-changes,
reported as mean
As illustrated in Fig. 1A,B, the expression of NOP14 was markedly
elevated in glioma cell lines (U87, U251, LN229) compared to the normal astrocyte
HA1800 (Fig. 1A,B). Similarly, tissue samples collected from 4 cases exhibited a
high NOP14 in tumor tissue (Fig. 1C,D). Moreover, we tested
NOP14 expression in various grades of glioma (n = 20). As the glioma
grade level increased, there was an observed increase in NOP14
expression in glioma immunohistochemical staining. Our results showed a
significant upregulation of NOP14 expression in glioma tissues compared
to non-glioma tissues (all p
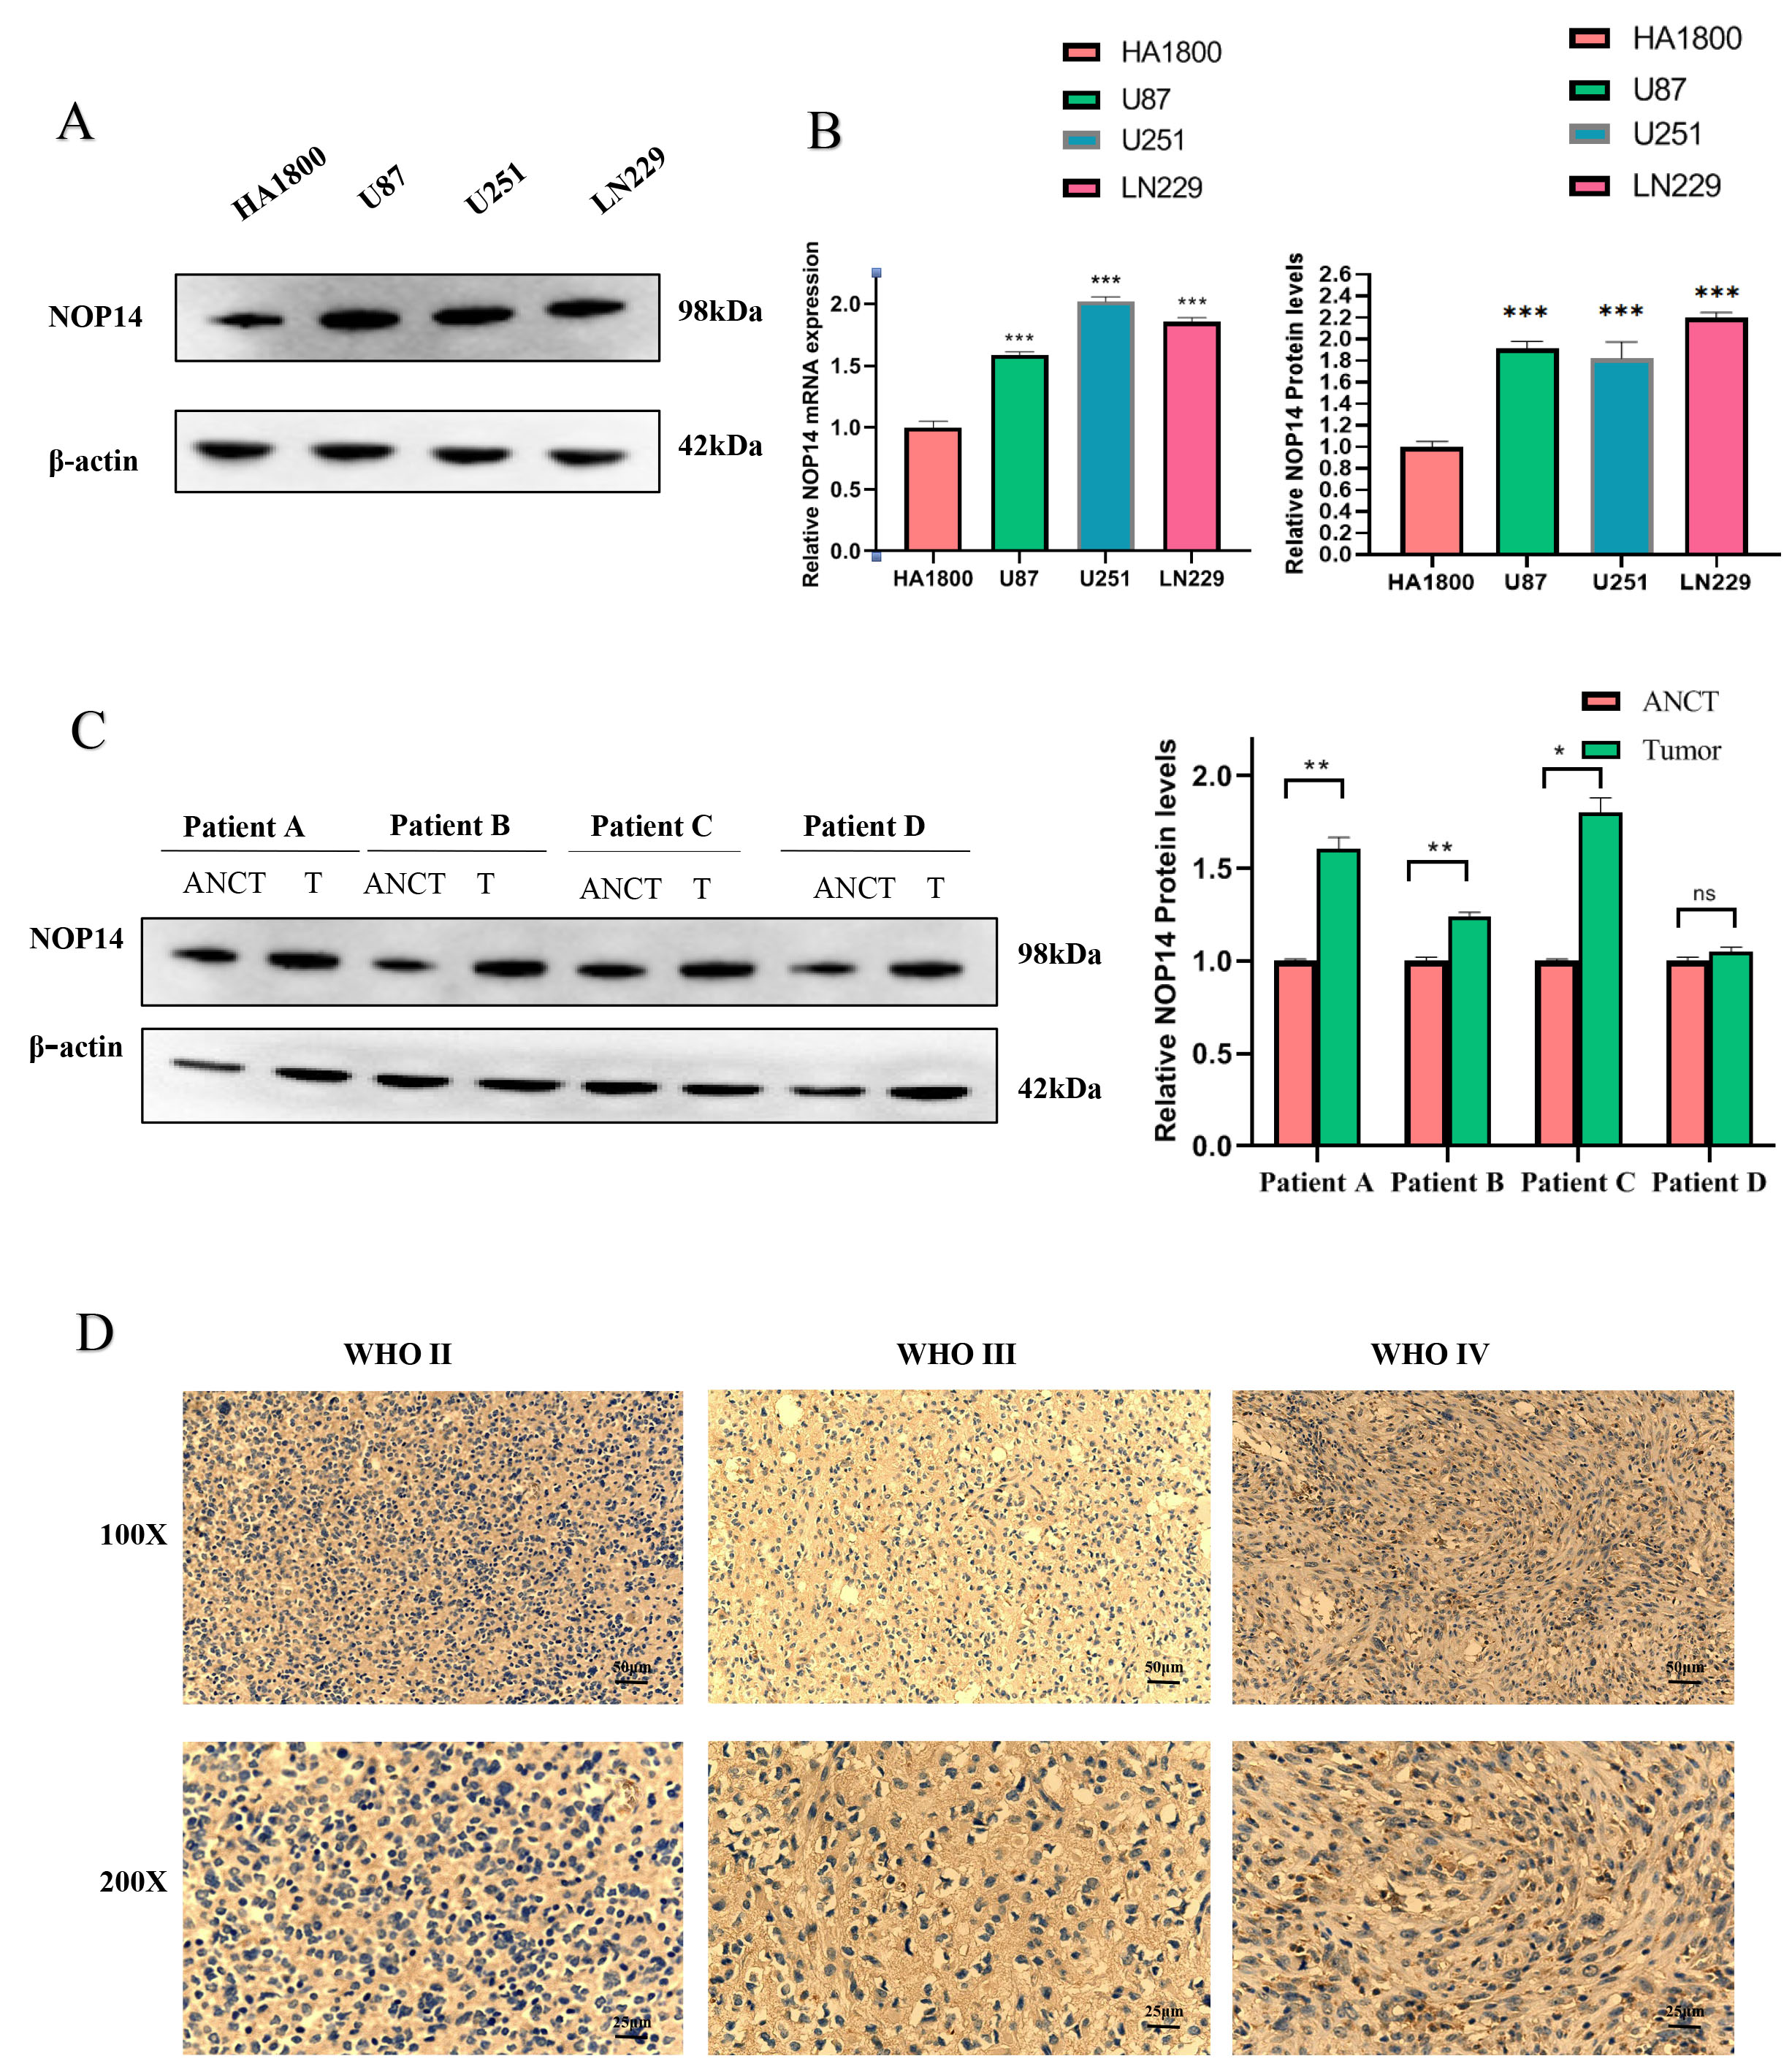 Fig. 1.
The nucleolar protein 14 (NOP14)
expression is upregulated in the Glioma. (A) Western Blot for the expression of
NOP14 protein in several different glioma cell lines and normal
astrocytes. (B) Quantitative map of NOP14 mRNA expression and protein
expression. (C) Western blotting detection of Glioma clinical adjacent four cases
of benign and cancer tissue. (D) Quantitative map of NOP14 protein
expression; Immunohistochemical detection of NOP14 expression of
different grades. *** p
Table 1 summarizes the clinical data of the 696 GBM patients. In this study, a
total of 398 men and 298 women were analyzed. The chi-square test results
demonstrated a significant correlation between NOP14 and WHO grade,
isocitrate dehydrogenase (IDH) status, 1p/19q codeletion, and histological type
(all p
| Characteristic | Low expression of NOP14 | High expression of NOP14 | p | |
| n | 348 | 348 | ||
| WHO grade, n (%) | ||||
| G2 | 159 (25%) | 65 (10.2%) | ||
| G3 | 115 (18.1%) | 128 (20.2%) | ||
| G4 | 40 (6.3%) | 128 (20.2%) | ||
| IDH status, n (%) | ||||
| Wild-type (WT) | 81 (11.8%) | 165 (24.1%) | ||
| Mut | 262 (38.2%) | 178 (25.9%) | ||
| 1p/19q codeletion, n (%) | ||||
| Codel | 120 (17.4%) | 51 (7.4%) | ||
| Non-codel | 227 (32.9%) | 291 (42.2%) | ||
| Gender, n (%) | 0.491 | |||
| Female | 144 (20.7%) | 154 (22.1%) | ||
| Male | 204 (29.3%) | 194 (27.9%) | ||
| Primary therapy outcome, n (%) | 0.244 | |||
| PD | 57 (12.3%) | 55 (11.9%) | ||
| SD | 87 (18.8%) | 60 (13%) | ||
| PR | 41 (8.9%) | 23 (5%) | ||
| CR | 86 (18.6%) | 53 (11.5%) | ||
| Age, n (%) | ||||
| 300 (43.1%) | 253 (36.4%) | |||
| 48 (6.9%) | 95 (13.6%) | |||
| Histological type, n (%) | ||||
| Astrocytoma | 105 (15.1%) | 90 (12.9%) | ||
| Glioblastoma | 40 (5.7%) | 128 (18.4%) | ||
| Oligoastrocytoma | 81 (11.6%) | 53 (7.6%) | ||
| Oligodendroglioma | 122 (17.5%) | 77 (11.1%) | ||
| Age, median (IQR) | 41 (33, 53) | 50 (36, 62) | ||
WHO, World Health Organization; IDH, Isocitrate Dehydrogenase; PD, progressive disease; SD, stable disease; PR, partial response; CR, complete response; IQR, Interquartile Range.
The expression of NOP14 was analyzed in patients with various clinicopathological features in this study. Among them, Levene’s test of homogeneity of variance and one-way ANOVA test showed that the expression of NOP14 mRNA increased with the WHO level (Fig. 2A). Moreover, NOP14 was differentially expressed regarding the primary therapy outcome for glioma and the histological type (Fig. 2B,C). The Mann-Whitney U test analysis revealed a higher expression of IDH wild-type compared to mutant NOP14 mRNA (Fig. 2D), non-codel 1p/19 compared to codel (Fig. 2E). Older adults demonstrated higher expression of NOP14 (Fig. 2F), and NOP14 expression was higher in patients with a dead outcome regarding overall survival (OS). Furthermore, consistent findings were observed when analyzing the Chinese Glioma Genome Atlas (CGGA)-based data (Supplementary Fig. 1A–D).
 Fig. 2.
Correlation between NOP14 expression and different
clinicopathological features and the prognostic value of NOP14 in OS and
DSS of GBM. Correlation between (A) NOP14 expression and WHO GBM grade,
(B) primary treatment, (C) histological type, (D) IDH status, (E) 1p/19p cedar,
(F) age, and (G) OS events. (H,I) Prognostic value of NOP14 in the OS
and DSS of GBM. (J–M) High expression of NOP14 in different subgroups
was associated with worse OS. OS, overall survival; DSS, disease-specific
survival; GBM, glioblastoma. *** p
To assess the prognostic value of NOP14 in GBM patients, the study
analyzed the correlation between NOP14 expression with OS and
disease-specific survival (DSS). The findings revealed that high NOP14
mRNA expression implied a significant association with shorter OS and DSS in the
TCGA cohort (OS: hazard ratio [HR] = 2.09, 95% CI = 1.63–2.67, p
The results of the univariate Cox regression analysis uncovered that high
expression of NOP14 showed a linkage with increased risk among adverse
clinical prognostic factors (Table 2). Significant variables discovered in the
univariate analysis were subsequently included in the multivariate Cox regression
analysis. It was evident that NOP14 expression was an independent risk
factor for overall survival (HR: 0.530, p = 0.009), thus indicating a
predictive value for overall survival in the disease. Moreover, the WHO grade,
particularly in the G3 stage, IDH status, histological type, and TP53,
demonstrated a predictive advantage for the clinical outcome (Fig. 3A). The
results of the univariate logistic regression analysis revealed significant
clinicopathological differences between the groups, including WHO grade (odds
ratio [OR] = 4.040, 95% CI = 2.857–5.765), 1p/19q codeletion (OR = 3.016, 95%
CI = 2.093–4.398), IDH status (OR = 0.334, 95% CI = 0.240–0.461), and age (OR
= 2.347, 95% CI = 1.604–3.471) (all p
 Fig. 3.
The prognostic value of NOP14 in GBM. (A) Multivariate Cox regression visualized in the forest plot. (B) NOP14 expression distribution and survival status. 0: dead, 1: alive. (C) Diagnostic receiver operating characteristic curve (ROC) curve of NOP14. (D) Time-dependent ROC curve of NOP14.
| Characteristics | Total (N) | Univariate analysis | Multivariate analysis | |||
| Hazard ratio (95% CI) | p value | Hazard ratio (95% CI) | p value | |||
| WHO grade | 634 | |||||
| G2 | 223 | Reference | ||||
| G3 | 243 | 2.999 (2.007–4.480) | 1.936 (1.178–3.180) | 0.009 | ||
| G4 | 168 | 18.615 (12.460–27.812) | 1.795 (0.466–6.908) | 0.395 | ||
| 1p/19q codeletion | 688 | |||||
| Codel | 170 | Reference | ||||
| Non-codel | 518 | 4.428 (2.885–6.799) | 1.797 (0.905–3.572) | 0.094 | ||
| Primary therapy outcome | 461 | |||||
| PD | 112 | Reference | ||||
| SD | 147 | 0.440 (0.294–0.658) | 0.399 (0.242–0.659) | |||
| PR | 64 | 0.170 (0.074–0.391) | 0.177 (0.063–0.500) | 0.001 | ||
| CR | 138 | 0.133 (0.064–0.278) | 0.168 (0.078–0.362) | |||
| TP53 | 695 | 1.680 (1.427–1.978) | 1.811 (1.283–2.558) | |||
| Age | 695 | 1.066 (1.056–1.076) | 1.064 (1.046–1.082) | |||
| IDH status | 685 | |||||
| WT | 246 | Reference | ||||
| Mut | 439 | 0.117 (0.090–0.152) | 0.427 (0.250–0.731) | 0.002 | ||
| Histological type | 695 | |||||
| Glioblastoma | 168 | Reference | ||||
| Oligodendroglioma | 198 | 0.085 (0.060–0.122) | 0.444 (0.234–0.843) | 0.013 | ||
| Astrocytoma | 195 | 0.147 (0.107–0.203) | 0.683 (0.399–1.168) | 0.164 | ||
| Oligoastrocytoma | 134 | 0.097 (0.064–0.147) | ||||
| NOP14 | 695 | |||||
| Low | 348 | Reference | ||||
| High | 347 | 2.088 (1.632–2.671) | 0.530 (0.329–0.852) | 0.009 | ||
Bold values were statistically significant.
| Characteristics | Total (N) | Odds ratio (OR) | p value |
| WHO grade (G3&G4 vs. G2) | 635 | 4.040 (2.857–5.765) | |
| 1p/19q codeletion (non-codel vs. codel) | 689 | 3.016 (2.093–4.398) | |
| Primary therapy outcome (PR&CR vs. PD&SD) | 462 | 0.749 (0.514–1.089) | 0.132 |
| IDH status (Mut vs. WT) | 686 | 0.334 (0.240–0.461) | |
| Histological type (Glioblastoma&Oligoastrocytoma&Oligodendroglioma vs. Astrocytoma) | 696 | 1.239 (0.890–1.728) | 0.206 |
| Age ( |
696 | 2.347 (1.604–3.471) |
Fig. 3B displays the distribution of NOP14 expression, the survival status of GBM patients, and the NOP14 expression profiles. The group with a low-risk score showed a low expression of the dashed line, while the group with a high-risk score exhibited a high expression of the dashed line. With an increase in the risk score of GBM patients, there was a gradual rise in the number of green points, indicating an escalation in the mortality rate among GBM patients. This indicates the survival rate and high risk.
There receiver operating characteristic curve (ROC) curve for the NOP14 score demonstrated its diagnostic accuracy with an Area Under Curve (AUC) of 0.814 (95% CI = 0.793–0.835) (Fig. 3C). The accuracy of this study was also assessed over time to evaluate the predictive capability of NOP14 for overall survival at 1, 2, and 3 years (Fig. 3D).
In the NOP14 group, a total of 5892 genes showed differential
expression, with 3126 DEGs upregulated (53.0%) and 2766 DEGs downregulated
(46.9%) (adjusted p-value
 Fig. 4.
Enrichment analysis of NOP14 in GBM. (A) Biological process enrichment related to NOP14-related genes. (B) A network of NOP14 and its 20 potential co-interaction proteins. (C–F) The results of enrichment analysis from GSEA. GSEA, Gene Set Enrichment Analysis.
To further elucidate the biological function of NOP14, GSEA was
implemented on the disparities between the high and low expression datasets of
NOP14 (Table 4). This analysis enabled us to identify the specific
REACTOME and KEGG pathways associated with NOP14. Besides, 244 pathways
exhibited significant differences in the enrichment of the REACTOME and KEGG
pathways in the samples with high NOP14 expression (FDR
| Characteristic | Description | NES | p-value | p.adjust |
| Positive REACTOME term | REACTOME_CELL_CYCLE | 4.773 | 0.003 | 0.006 |
| REACTOME_CELL_CYCLE_MITOTIC | 4.698 | 0.002 | 0.006 | |
| REACTOME_CELL_CYCLE_CHECKPOINTS | 4.427 | 0.002 | 0.005 | |
| REACTOME_M_PHASE | 4.098 | 0.002 | 0.005 | |
| REACTOME_RHO_GTPASE_EFFECTORS | 3.570 | 0.002 | 0.005 | |
| Negative REACTOME term | REACTOME_NEURONAL_SYSTEM | –4.045 | 0.001 | 0.005 |
| REACTOME_TRANSMISSION_ACROSS_CHEMICAL_SYNAPSES | –3.563 | 0.001 | 0.005 | |
| REACTOME_NEUROTRANSMITTER_RECEPTORS_AND_POSTSYNAPTIC_SIGNAL_TRANSMISSION | –3.247 | 0.001 | 0.005 | |
| REACTOME_SIGNALING_BY_GPCR | –3.0123 | 0.001 | 0.005 | |
| REACTOME_TRANSPORT_OF_SMALL_MOLECULES | –2.7192 | 0.001 | 0.005 | |
| Positive KEGG term | KEGG_CELL_CYCLE | 3.002 | 0.002 | 0.005 |
| KEGG_ECM_RECEPTOR_INTERACTION | 2.885 | 0.002 | 0.005 | |
| KEGG_CYTOKINE_CYTOKINE_RECEPTOR_INTERACTION | 2.550 | 0.002 | 0.005 | |
| KEGG_FOCAL_ADHESION | 2.426 | 0.002 | 0.005 | |
| KEGG_P53_SIGNALING_PATHWAY | 2.395 | 0.002 | 0.005 | |
| Negative KEGG term | KEGG_NEUROACTIVE_LIGAND_RECEPTOR_INTERACTION | –4.004 | 0.001 | 0.005 |
| KEGG_CALCIUM_SIGNALING_PATHWAY | –2.825 | 0.001 | 0.005 | |
| KEGG_AMYOTROPHIC_LATERAL_SCLEROSIS_ALS | –2.343 | 0.003 | 0.006 | |
| KEGG_LONG_TERM_POTENTIATION | –2.216 | 0.001 | 0.005 | |
| KEGG_OLFACTORY_TRANSDUCTION | –1.967 | 0.005 | 0.009 |
NES, normalized enrichment score; KEGG, Kyoto Encyclopedia of Genes and Genomes.
A Spearman correlation analysis was implemented to investigate the relationship
between NOP14 and the levels of immune cell infiltration, quantified by
the ssGSEA score. The infiltration level of Th2 cells was positively correlated
with NOP14 expression (Spearman’s R = 0.448) (Fig. 5A) and was elevated
in the high NOP14 expression group (all p
 Fig. 5.
The results of analysis between NOP14 expression and
immune infiltration. (A) The positive correlation between NOP14
expression and Th2 cells. (B) Th2 cells’ infiltration level in different
NOP14 expression groups. (C) The negative correlation between
NOP14 expression and Follicular helper T cell (TFH). (D) TFH’infiltration level in different
NOP14 expression groups. (E) Correlation between NOP14
expression level and the relative abundances of 24 immune cells. (F) Heat map of
24 immune infiltration cells in GBM. ***, p
Research has demonstrated that relying solely on clinicopathological
characteristics does not yield accurate prognostic information for tumor
patients, resulting in excessive or inadequate treatment. Emerging evidence
indicates that incorporating tumor microenvironment (TME)-related immune scores
and the proportion of tumor-infiltrating immune cells (TIC) in the TME can
enhance the predictive accuracy of conventional staging systems [11, 12, 13, 14, ]. TME
comprises tumor cells, stromal cells, immune cells, extracellular matrix (ECM),
signaling molecules, and cytokines. Immune cells in the TME can influence tumor
growth [15, 16, 17]. To explore the association between NOP14 levels and
stromal cell infiltration, we initially analyzed the Tumor Immune Single Cell
Center [13] database to determine the main cell subset expressing NOP14.
The GSC_GSE148842_Smartseq2 dataset (a glioma single-cell dataset) was
explored. We discovered the expression of NOP14 in both single-cell
subsets of immune and stromal cells (Fig. 6A–C). Subsequently, we examined the
specific cell subsets of NOP14 species exhibiting high glioma
expression. The results demonstrated that CD8
 Fig. 6.
Correlation between NOP14 levels and stromal cell infiltration. (A–E) GFPT2 was expressed in both immune and stromal cell single-cell subpopulations in a Glioma single-cell GSE dataset (GSC_GSE148842_Smartseq2) from the Tumor Immune Single-cell Hub (TISCH) dataset. (D) Corrplot was used to perform the correlation between NOP14 levels and CD8T-associated factors. (E) A corrplot was used to perform the correlation between NOP14 levels and EMT-related factors.
We further pinpointed the correlation between NOP14 and biomarkers
linked to CD8
CD8
In vitro, interference of NOP14 was observed in LN229 and U251 cells (Supplementary Fig. 3A,B). The cell wound scratch assay demonstrated that the inhibition of NOP14 resulted in a reduction in cell migration (Fig. 7A,B,G). Similarly, the Transwell assay indicated a decrease in cell invasion upon reduction of NOP14 expression (Fig. 7C,D,H). Furthermore, the clone formation assay provided evidence that the inhibition of NOP14 impaired the colony formation ability of GBM cells (Fig. 7E,F,I).
 Fig. 7.
NOP14 promotes glioma cell migration and
invasion in vitro. (A,B) Images of wound healing experiments in the NC
and NOP14 gene interference groups. (G) Quantification of the wound
closure condition. (C,D) Images of migrated transwell experiments in NC and
NOP14 gene interference groups. (H) Quantitative analysis of the number
of migrating glioma cells. (E,F) Plate cloning experiments of the NC and
NOP14 gene interference groups. (I) Quantitative analysis of the plate
clones. *** p
NOP14 promotes localization by interacting with the nucleolar RNA methyltransferase EMG1, thereby playing a pivotal role in the processing of 18s rRNA precursor and assembly of the small ribosomal subunit [6, 7, 8]. However, the expression and function of NOP14 in human malignancies remain poorly understood.
The present study conducted a combined analysis of the CGGA and TCGA databases,
revealing a significant upregulation of NOP14 expression in gliomas.
These findings were consistent with the results obtained from the HPAs database.
Furthermore, elevated NOP14 expression was correlated with adverse
clinicopathological factors, including non-codel 1p/19q codeletion, WHO grade
(G3&G4), Mut subtype of IDH status, age (p
NOP14 participates in a crucial biological process of cellular ribosome synthesis, which may significantly influence the onset and progression of malignancy. Ribosomes are widely acknowledged as the site of protein synthesis in cells [21]. In tumor cells, a substantial quantity of ribosomes is essential to sustain a highly proliferative state and synthesize an adequate amount of proteins for various cellular physiological activities. Previous studies have demonstrated the involvement of ribosomes in DNA damage repair, cell cycle regulation, and proliferation, and dysfunctional ribosomes can contribute to cell transformation and tumor progression [22, 23, 24]. To enhance our comprehension of NOP14’s involvement in the advancement and evolution of GBM, we performed a GSEA analysis within this research endeavor to elucidate its role in GBM. The GSEA results revealed a positive enrichment of REACTOME terms associated with cell cycle, cell cycle mitotic, cell cycle checkpoints, M phase, and RHO GTPase effectors. Alternatively, the KEGG pathway analysis results suggested that cancer-related pathways, including the cell cycle and P53, exhibited a positive enrichment when NOP14 was highly expressed. This finding was consistent with the established biological function of NOP14, implying that its involvement in cell cycle regulation may contribute to tumor progression in adult-type diffuse glioma. However, further experimental validation is still needed.
In general, immune cells can recognize and remove abnormal tumor cells [25]. However, tumor cells employ various strategies to evade the antitumor response of the human immune system. Within the TME, stromal cells and immune cells induce alterations such as increased extracellular matrix stiffness, vascular and lymphatic vessel formation, necrotic zone formation, and tumor metastasis through autocrine and paracrine production [26]. Therefore, immune cells play a pivotal role in tumor development. Earlier research has indicated a link between heightened NOP14 expression in PDAC and localized metastasis and lymphatic invasion [10]. Here, we observed a negative correlation between the expression of NOP14 and the levels of various immune cells, including TFH, NK CD56bright cells, mast cells, B cells, Th1 cells, Treg cells, Tem cells, Tcm cells, pDCs, and DCs. Diminished Tfh cells in the TME resulted in imbalanced humoral immunity and the inactivation of natural killer (NK) cells. As a consequence, the anti-tumor capacity is compromised. It is strongly linked to the formation of an immunosuppressive microenvironment within Glioma [27]. Glioma cells and other immune-regulatory-related cells, such as DC, present in the TME, are capable of producing and releasing cytokines, including transforming growth factor, IL-6, IL-10, prostaglandin E2, and ID-2,3-dioxygenase, which have the potential to directly or indirectly suppress the activation of NK cells [28]. Drawing from these findings, one could infer that the significant NOP14 overexpression was vital in governing ribosome production and cell cycle control in adult-type diffuse glioma. Additionally, NOP14 may act as a potential immune modulator, inhibiting glioma immune infiltration.
The single-cell transcriptome analysis provides insights into tumor
heterogeneity and holds great potential for individualized therapy [29]. To gain
a deeper understanding of the mechanisms underlying adult-type diffuse glioma
progression and its response to immunotherapy, we investigated the involvement of
specific genes in tumor EMT and CD8
In conclusion, the results demonstrate the potential of NOP14 as a prognostic biomarker and an indicator for immunotherapy. Furthermore, our study demonstrated a close association between NOP14 and cell migration and proliferation of adult-type diffuse glioma in vitro, highlighting the potential impact of NOP14 on adult-type diffuse glioma development and prognosis. However, further validation in vivo is still required in our future studies.
All data analyzed in this review are included in this article and/or its figures. Further inquiries can be directed to the corresponding author.
QST performed the experiments, collected all the relevant data, and wrote the first draft of this manuscript with most figures and supplemental information. JC performed the histological examination. ZJB designed and supervised this study, analyzed all the data, helped to prepare all figures with cartoons, and rewrote and revised the paper. All authors contributed to editorial changes in the manuscript. All authors have read and agreed to the published version of the manuscript. All authors have participated sufficiently in the work and agreed to be accountable for all aspects of the work.
This study was approved by the Ethics Committee of 3201 Hospital (approval number 2022082). Helsinki declaration has been followed for involving human subjects in the study, and relevant guidelines for animal experimentation have been followed. Signed written informed consents were obtained from all participants before the study.
Not applicable.
This study was funded by the General Medical Research Fund (TYYLKYJJ-2022-014).
The authors declare no conflict of interest.
Publisher’s Note: IMR Press stays neutral with regard to jurisdictional claims in published maps and institutional affiliations.