
- Academic Editor
Background: Chronic viral infection results in impaired immune
responses rendering viral persistence. Here, we compared the quality of T-cell
responses among chronic hepatitis B virus (HBV), hepatitis C virus (HCV) and
human immunodeficiency virus (HIV)-infected individuals by examining the levels of
expression of selected immune activation and exhaustion molecules on circulating
MAIT cells and Tfh cells. Methods: Cytokines were measured using a
commercial Bio-plex Pro Human Cytokine Grp I Panel 17-plex kit (BioRad, Hercules,
CA, USA). Inflammation was assessed by measuring an array of plasma cytokines,
and phenotypic alterations in CD4
Chronic viral infections result in immune cell dysfunctions in the host [1], but often persist without inflicting any serious cell damage [2]. Many chronic viruses, especially the hepatitis B virus (HBV), hepatitis C virus (HCV) and human immunodeficiency virus 1 (HIV-1) in humans are adept at circumventing the host’s immune responses, primarily by imposing the expression of co-inhibitory molecules to the advantage of the pathogen [3]. Given the non-cytopathic nature of HBV and HCV, the immune system is attributed to hepatocellular damage as well as viral clearance [4]. Inability to attain viral clearance and development of chronic HBV disease is suggestive of dysfunctional immune responses [5]. The expansion of regulatory T cells (Tregs), high antigen loads, anti-inflammatory cytokines, and biosignatures of exhaustion are the likely indications of dysfunctional HBV-specific responses [6]. Evasion of the host’s immune surveillance augments active replication of chronic viruses. In addition, viral persistence also stems from clonal deletion of HBV-specific T cells and/or their functional insufficiency together with increased expression of signatures associated with immune activation, senescence, and exhaustion.
Chronic HCV infection leads to persistent upregulation of genes associated with
innate immune activation leading to liver inflammation and consequently cirrhosis
[7]. Exhausted T cells in concert with TNF-
Mucosal-associated invariant T (MAIT) cells are a unique subset of innate-like T
cells that link the innate and the adaptive immune systems [11]. Although MAIT
cells comprise only ~5% of the peripheral T cell pool in adults,
the cell population is enriched in up to ~40% in the liver [12].
MAIT cells play a paramount role in innate host defense responses against
bacterial and viral infections [13, 14]. Given the primary localization of MAIT
cells is confined to the peripheral mucosal tissues, their functions are weakened
(characterized by heightened expression of immune exhaustion markers, reduced
cytokine production and cytotoxicity) in chronic viral infections, including HIV
[15], HCV [16, 17] and HIV-TB co-infections [18], the current research intends to
generically and descriptively determine the quality of host immune responses in
chronic HBV, HIV, and HCV infections. We investigated the role of immune
activation and potentially compromised T-cell responses in the three different
chronic viral infections by exploring conventional CD4
The cross-sectional case-control study was carried out in accordance with the guidelines of the International Conference on Harmonization Guidelines and the Declaration of Helsinki. The study protocols were reviewed by the Institutional Ethical Committee (IEC) of the Government Medical College, Theni, for necessary approval for the conduct of the research (Ref. No. 2544/ME1/18 and Ref. No. 1515/MEIII/21). Prior approval was also obtained from the Tamil Nadu State AIDS Control Society, Chennai, India (TANSACS Approval- 00529/TANSACS/M&E/2019 NACO-T-11020/08/2020_NACO) for the conduct of work. Institutional Biosafety Committee (IBSC) approval was secured (Ref. No.: CUTN/SLS/1st IBSC/2020/04). All the human subjects were adults and written consents were duly obtained from all the participants.
HBV-infected individuals with plasma HBsAg and anti-HBc positivity (n = 13), HCV-infected individuals as determined by anti-HCV (n = 8), HIV-infected individuals (as per the criteria of the National AIDS Control Organization (NACO), India) (n = 7), and healthy controls (HCs) (n = 10) were recruited into the cross-sectional study. The HIV-infected patients were on ART as per NACO recommendations (at least for over five years). Peripheral blood was obtained from all the participants by a trained phlebotomist. HCs were identified as individuals free from HBV, HCV, HIV, Mycobacterium tuberculosis infections as well as HBV/HIV co-infections.
Plasma aspartate aminotransferase (AST), alanine aminotransferase (ALT),
HIV infection was diagnosed using the conventional three-kit method advocated by
the NACO. According to the manufacturer’s instructions, the rapid
immunochromatographic tests Comb Aids-RS (Arkray Healthcare, Mumbai, India),
VoXpress HIV-1/2 (Voxtur Bio, Mumbai, India), and Meriscreen HIV 1-2 WB
(Mumbai, Merillife, India) were employed for diagnosing HIV infection. At inclusion, all
HIV-positive individuals were receiving active antiretroviral therapy (ART).
According to the manufacturer’s instructions, anti-CD45-PE-Cy5 (Cat. No.
05-8405-02) and anti-CD4-PE (Cat. No. 05-8405-01) (Sysmex Partec GmbH, Gorlitz,
Germany) fluorochrome-tagged antibodies were used for the immunophenotyping. For
absolute CD4
The Pathodetect™ (Mylab Discovery, Pune, India) quantitative Real-Time PCR was used to quantify the viral loads of HBV and HCV using an in vitro nucleic acid amplification assay on a QuantStudio 5 real-time PCR (Applied Biosystems, ThermoFisher Scientific, MA, USA). We determined HIV-1 viral load using the Abbott Real-time HIV-1 assay (Abbott, Abbot Park, IL, USA), via an in vitro reverse transcription-polymerase chain reaction assay with the sensitivity 40 copies/mL volume of the sample.
Cytokines were measured using the Bio-plex Pro Human Cytokine Grp I Panel
17-plex kit (BioRad, Hercules, CA, USA) that quantifies the levels of MCP-1,
G-CSF, GM-CSF, IL-7, IL-12 (p70), IL-1
Ten milliliters of peripheral blood were collected by venipuncture, and stored in lithium heparin BD Vacutainer (BD Biosciences, Franklin Lakes, NJ, USA) tubes at room temperature. PBMCs were extracted using a commercial Sepmate™ (Stemcell Technologies, Vancouver, Canada) by density gradient centrifugation. Cell viability was determined by 0.4% Trypan blue vital staining. Purified PBMCs were suspended in a Bambanker™ serum-free cell freezing medium (Nippon Genetics Europe GmbH, Duren, Germany) for storage at –80 °C, not more than 3 months before use in the experiments. PBMCs were thawed in a water bath at 37 °C before use in the experiments.
All antibodies were purchased from BD Pharmingen™ (BD
Biosciences, San Jose, CA, USA) unless otherwise specified. Immunostaining was
performed with one panel each for MAIT cells, Tfh cells, and along with various
markers. The MAIT cell panel included allophycocyanin H7 (APC-H7)–conjugated
anti–CD3, brilliant violet 510 (BV510) anti–CD4, fluorescein isothiocyanate
(FITC)–conjugated anti–CD8, phycoerythrin (PE)–conjugated TCR iV
Mononuclear cells were incubated with PMA (50
ng/mL) and ionomycin (500 ng/mL) or cultured in RPMI containing 10% FBS (R10)
alone. Samples were incubated at a concentration of 10 µg/mL, and Golgi
Plug (brefeldin A) and Golgi Stop (monensin) were included at 10 µg/mL.
Samples were incubated for overnight at 37 °C in 5% CO
We examined the percentages and expression of biomarkers on distinct subsets of
T cells, MAIT and Tfh cells between the four study groups. For multiple group
comparisons, categorical variables were examined using the Chi-square test of
Fisher’s Exact Test, while continuous variables were tested using non–parametric
Kruskal–Wallis Test. If the p values were
The four groups, non-randomized study design consisted of 38 individuals. Thirteen subjects with chronic HBV infection who tested positive for HBsAg, anti-HBc as well as HBV DNA: Group 1 (G1), eight subjects with HCV RNA positive and anti-HCV positive; G2, seven subjects with HIV RNA positive, and 10 healthy controls (HC) (G4). The samples were collected between September and October of 2021. As per the analytical parameters, 54% HBV-infected individuals, 87% HCV-infected individuals, and 47.5% HIV-infected individuals were diagnosed with signs of liver injury, while 46% of the HBV-infected, 13% of the HCV-infected, and 52.5% of the HIV-infected participants were chronically infected without any underlying clinical or biochemical signs of liver injury (Table 1).
| Characteristics | Total | HBV | HCV | HIV | HC | p value |
| (n = 38) | (n = 13) | (n = 8) | (n = 7) | (n = 10) | ||
| Age, years | 43 (32.5–58.0) | 55 (33.3–67) | 53.5 (45–65.5) | 34 (32–42) | 34 (28–42) | 0.103 |
| Sex, male (%) | 24 (63.2%) | 10 (76.9%) | 6 (75%) | 3 (42.9%) | 5 (50%) | 0.274 |
| SGOT, U/L |
37 (27.1–66) | 33.3 (21.4–75.2) | 59.8 (40.7–68.2) | 36.7 (30.7–48.2) | … | 0.126 |
| SGPT, U/L |
15.2 (10.5–26.2) | 12.3 (5.4–13.4) | 23.7 (17.8–47.8) | 16.9 (12–21.6) | … | 0.010* |
| GGT, U/L |
41.5 (18.4–93.9) | 18.6 (13.4–71.2) | 68.8 (37.6–117) | 55.5 (33.1–93.4) | … | 0.113 |
| ALP, U/L |
58.4 (45.3–66.5) | 52.7 (32.5–66.1) | 63.7 (55.7–86.7) | 59.5 (47.9–64) | … | 0.188 |
| PVL, copy/µL |
4.03 (1.63–4.64) | 2.1 (1.46–2.5) | 4.67 (1.9–4.78) | 4.63 (4.6–6.66) | … | 0.086 |
| CD4 |
… | … | … | 333 (241–265) | … | … |
All data reported as median and interquartile range (IQR) unless specified. n, numbers; %, percentages; IQR, interquartile range; HBV, hepatitis B virus; HCV, hepatitis C virus; HIV, human immunodeficiency virus; HC, healthy control; PVL, plasma viral load; SGOT, serum glutamic oxaloacetic transaminase; SGPT, serum glutamic-pyruvic transaminase; GGT, gamma-glutamyl transferase; ALP, alkaline phosphatase.
* represents p
The flow cytometry gating strategy to delineate the CD4
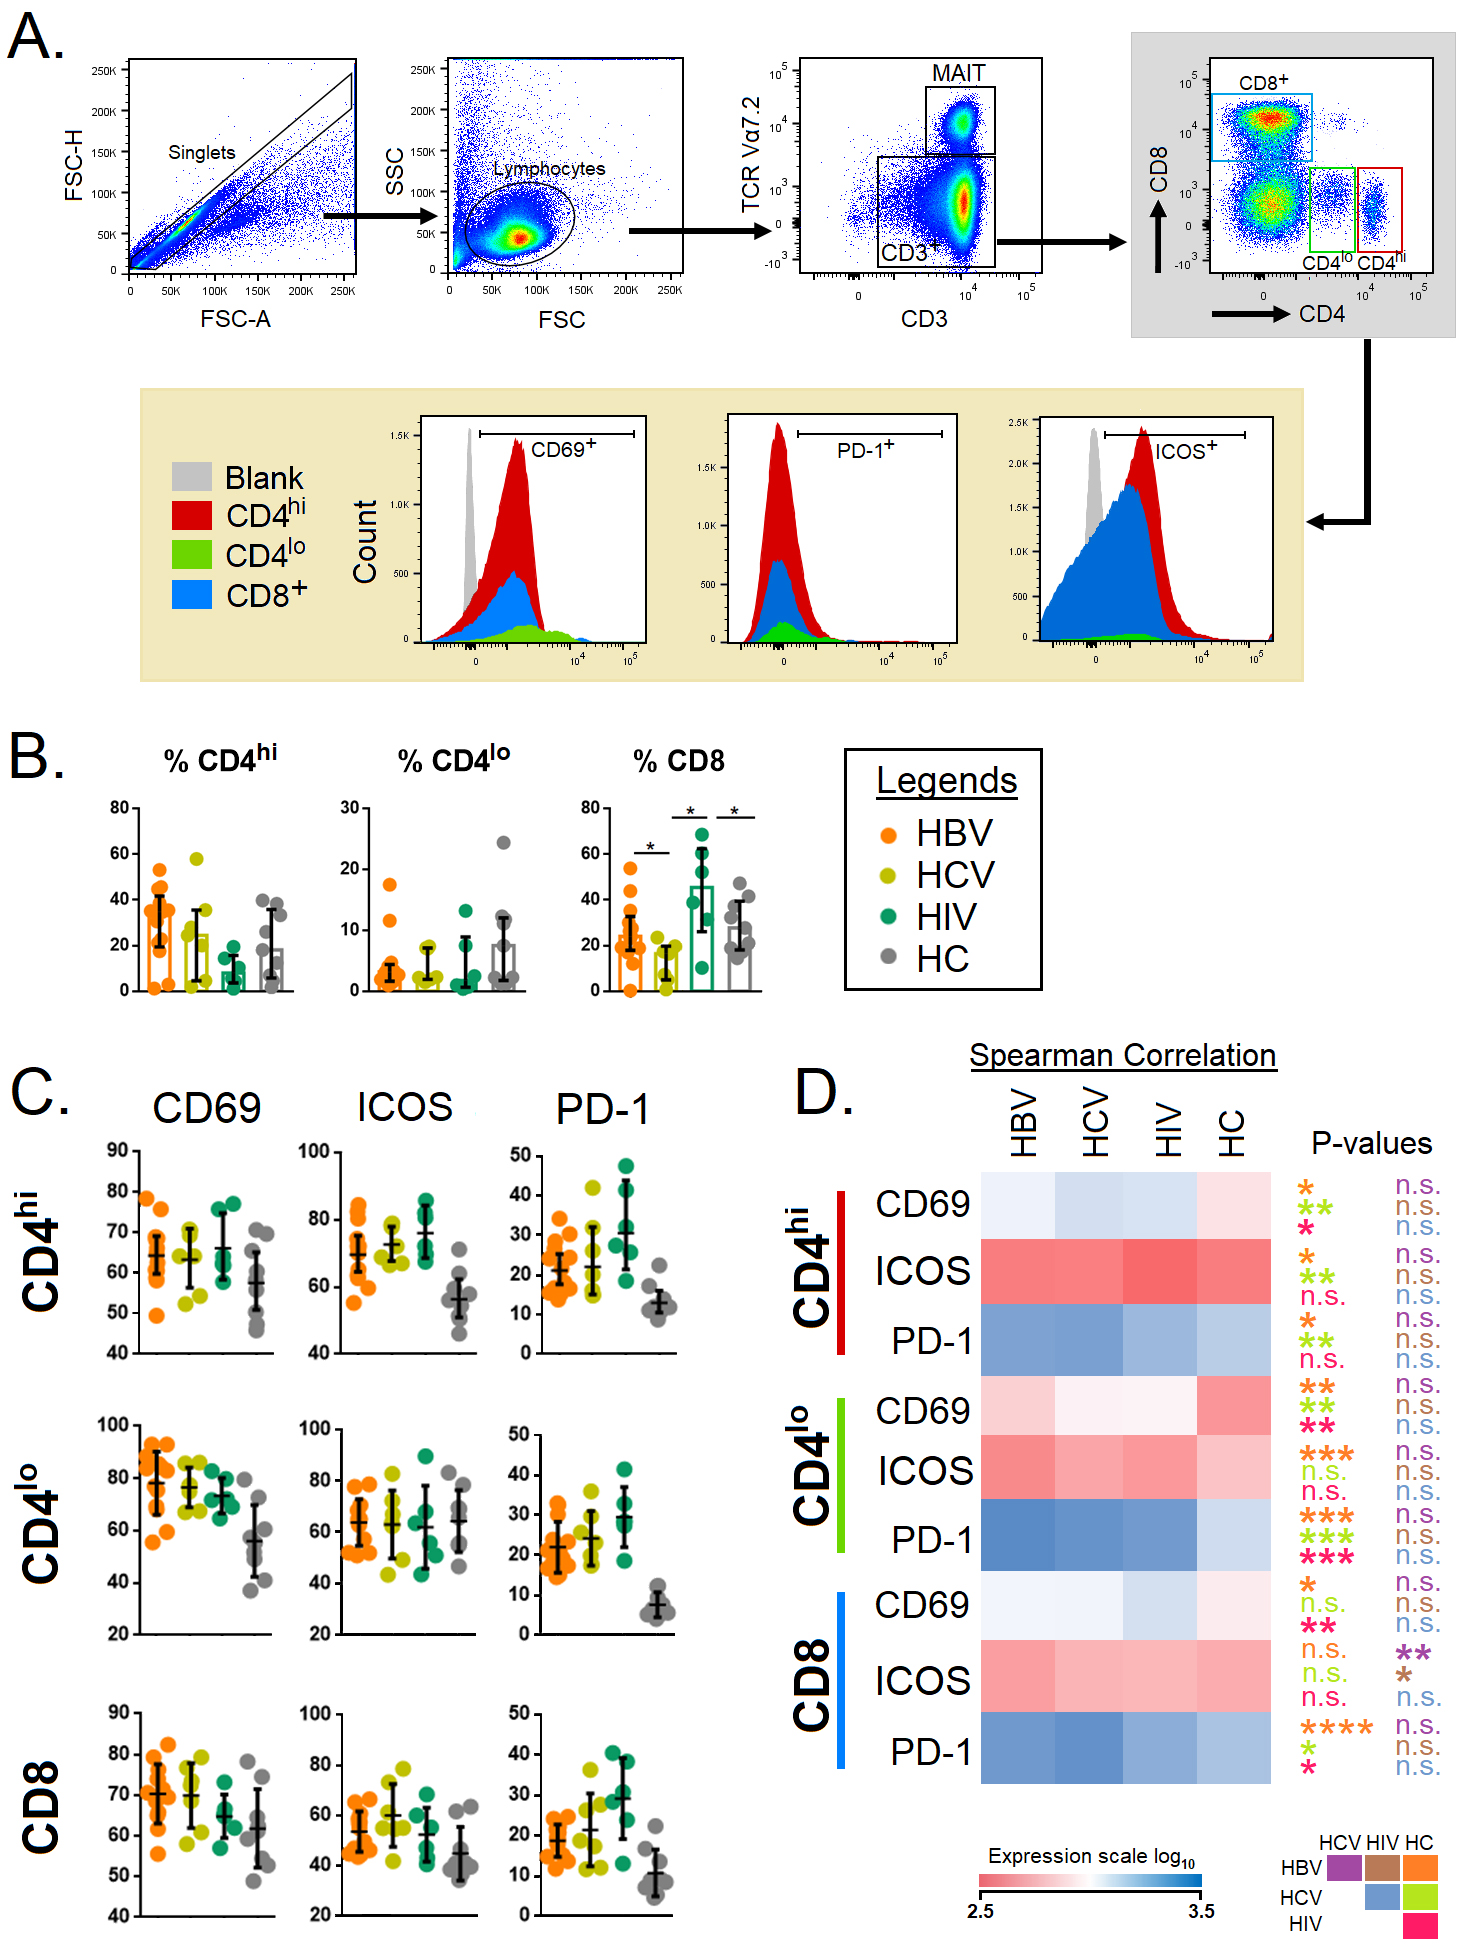 Fig. 1.
Immune activation and exhaustion markers associated with
CD4
Next, we set out to study the MAIT and Tfh cells across the different study
groups with a pre-determined gating strategy (Fig. 2A). Total TCR
iV
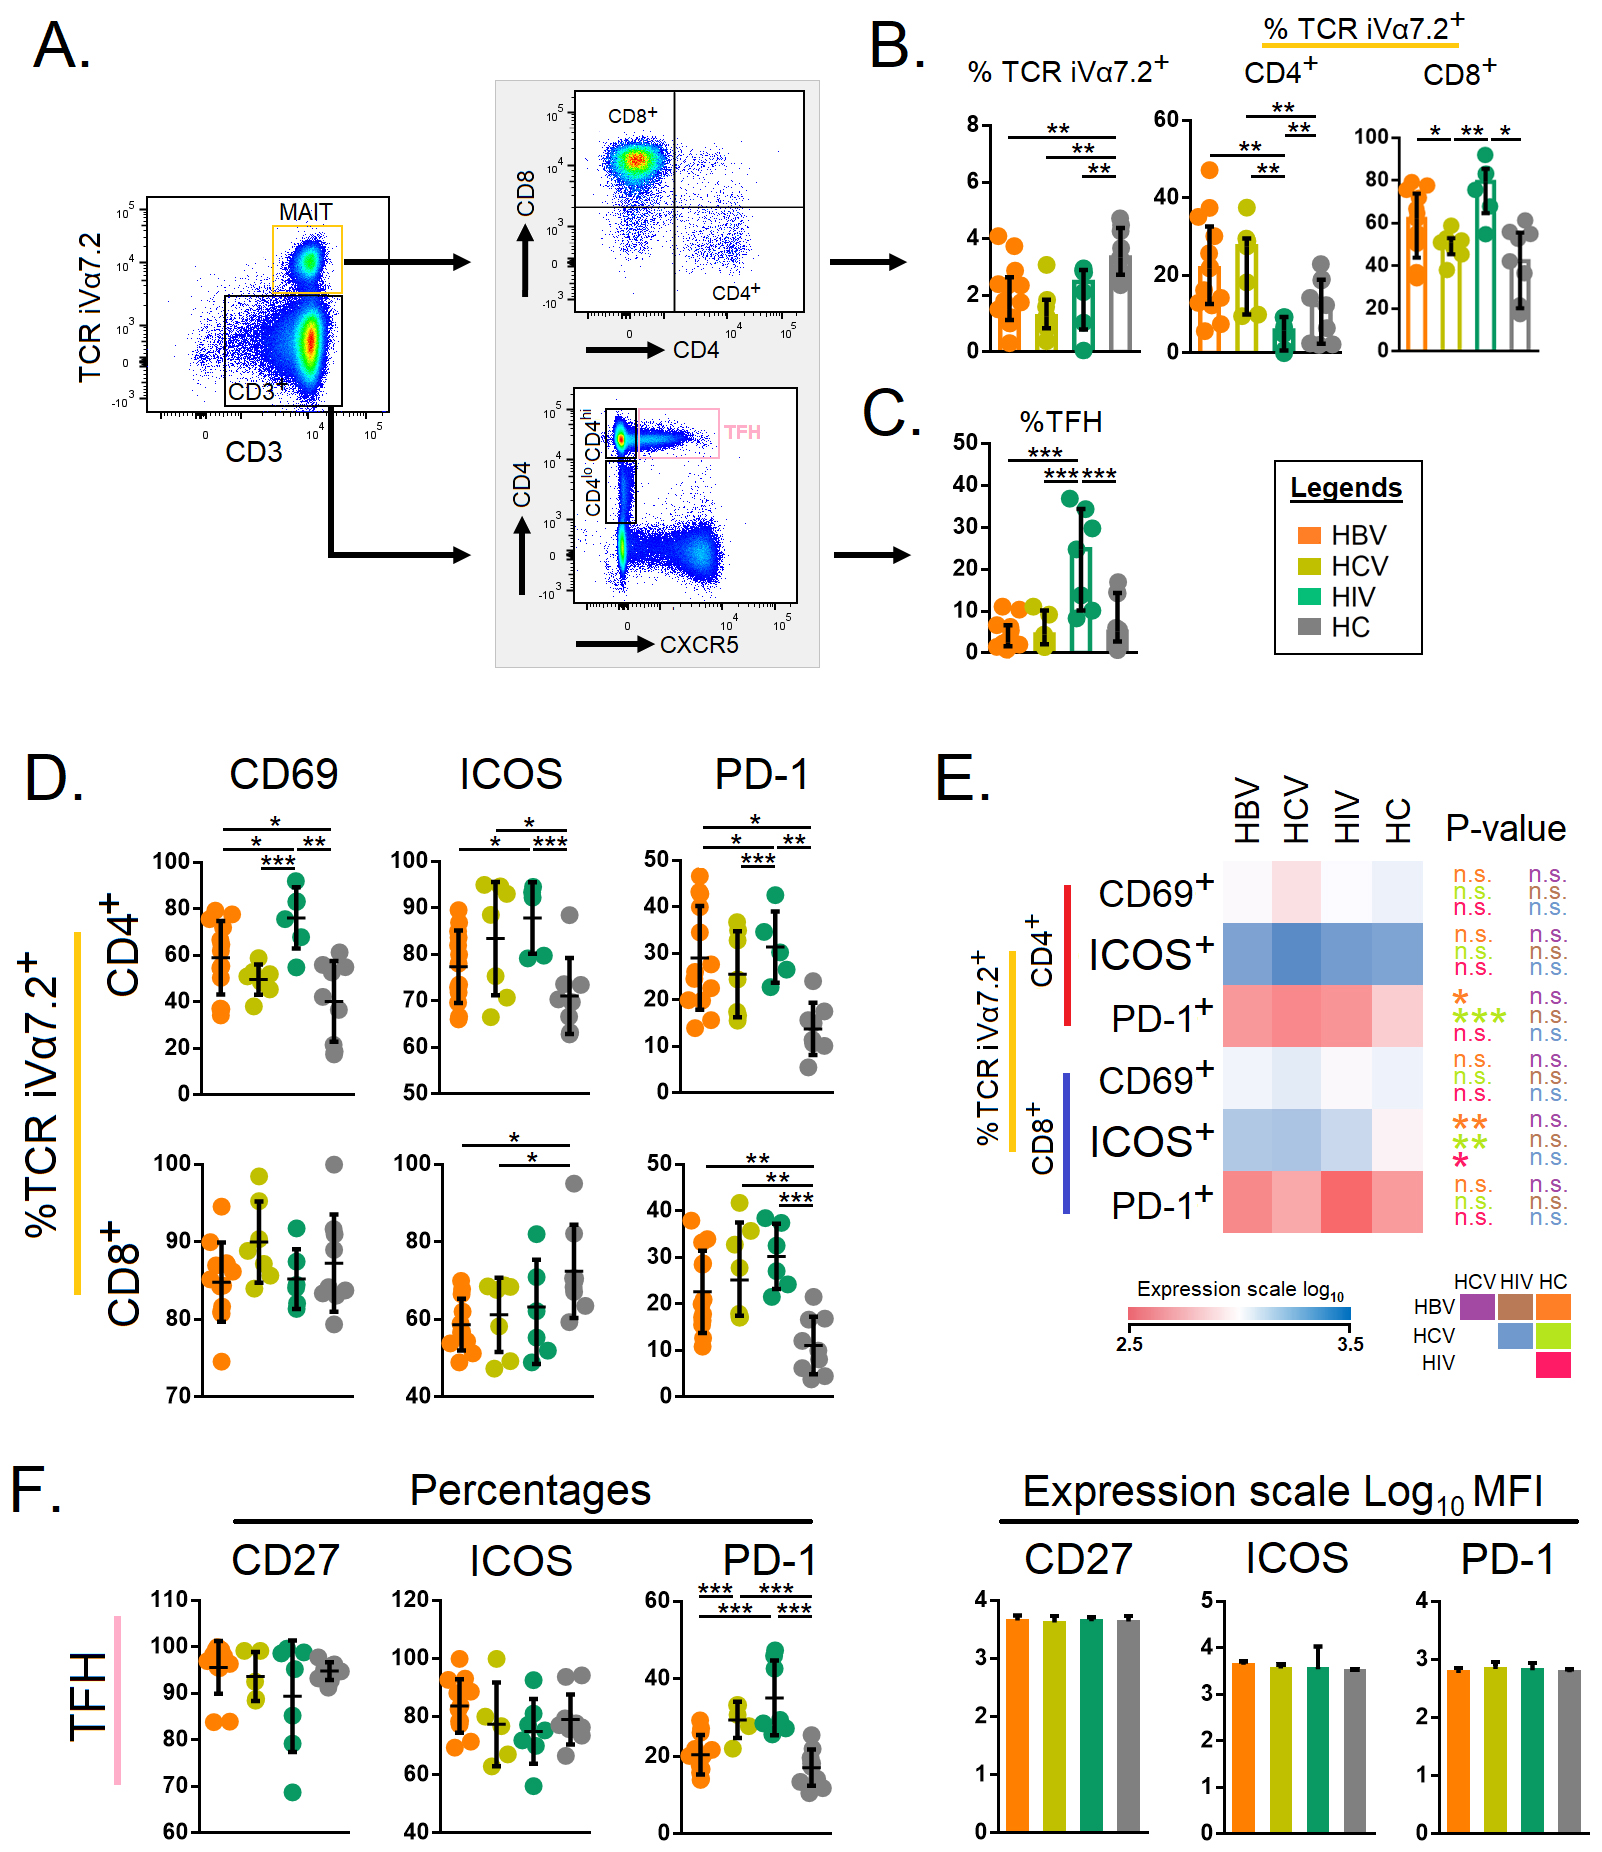 Fig. 2.
Expression of immune activation and exhaustion markers on
mucosal-associated invariant T cells and follicular T helper cells. (A) Gating
strategies for mucosal-associated invariant T cells and follicular T helper
cells. Total CD3
Next, we compared the cytokine-producing ability of T cells with respect to
CD4
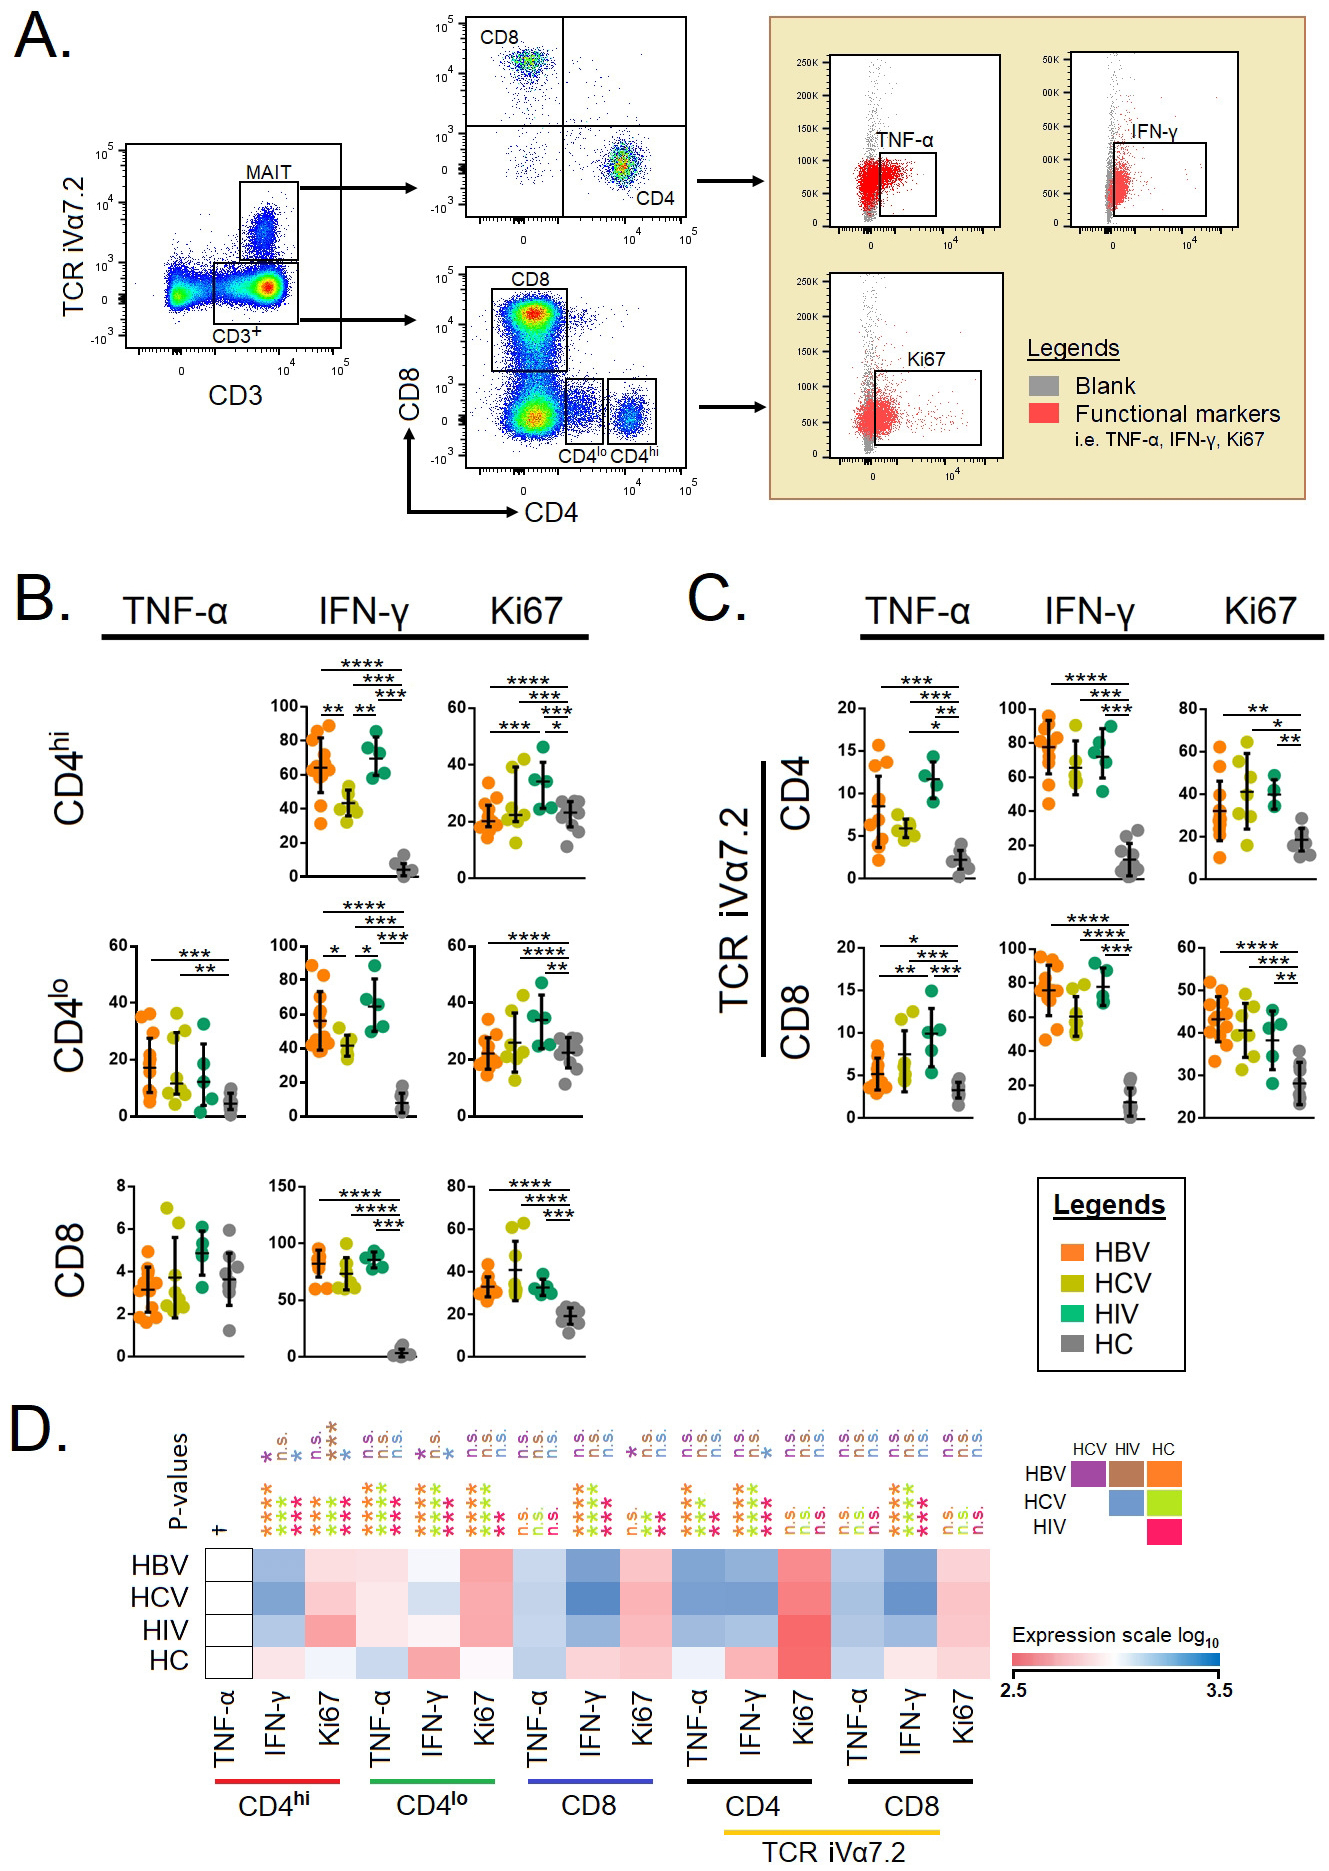 Fig. 3.
Functional markers on conventional T cells and
mucosal-associated invariant T cells (A) Gating strategies of intercellular
cytokines in conventional and unconventional T cells. Total CD3
Next, we also looked at the proliferating potential of T cells, which indicated that Ki67
In this study, we observed that the infected groups shared a similar activation
and cytokine profiles with total CD4
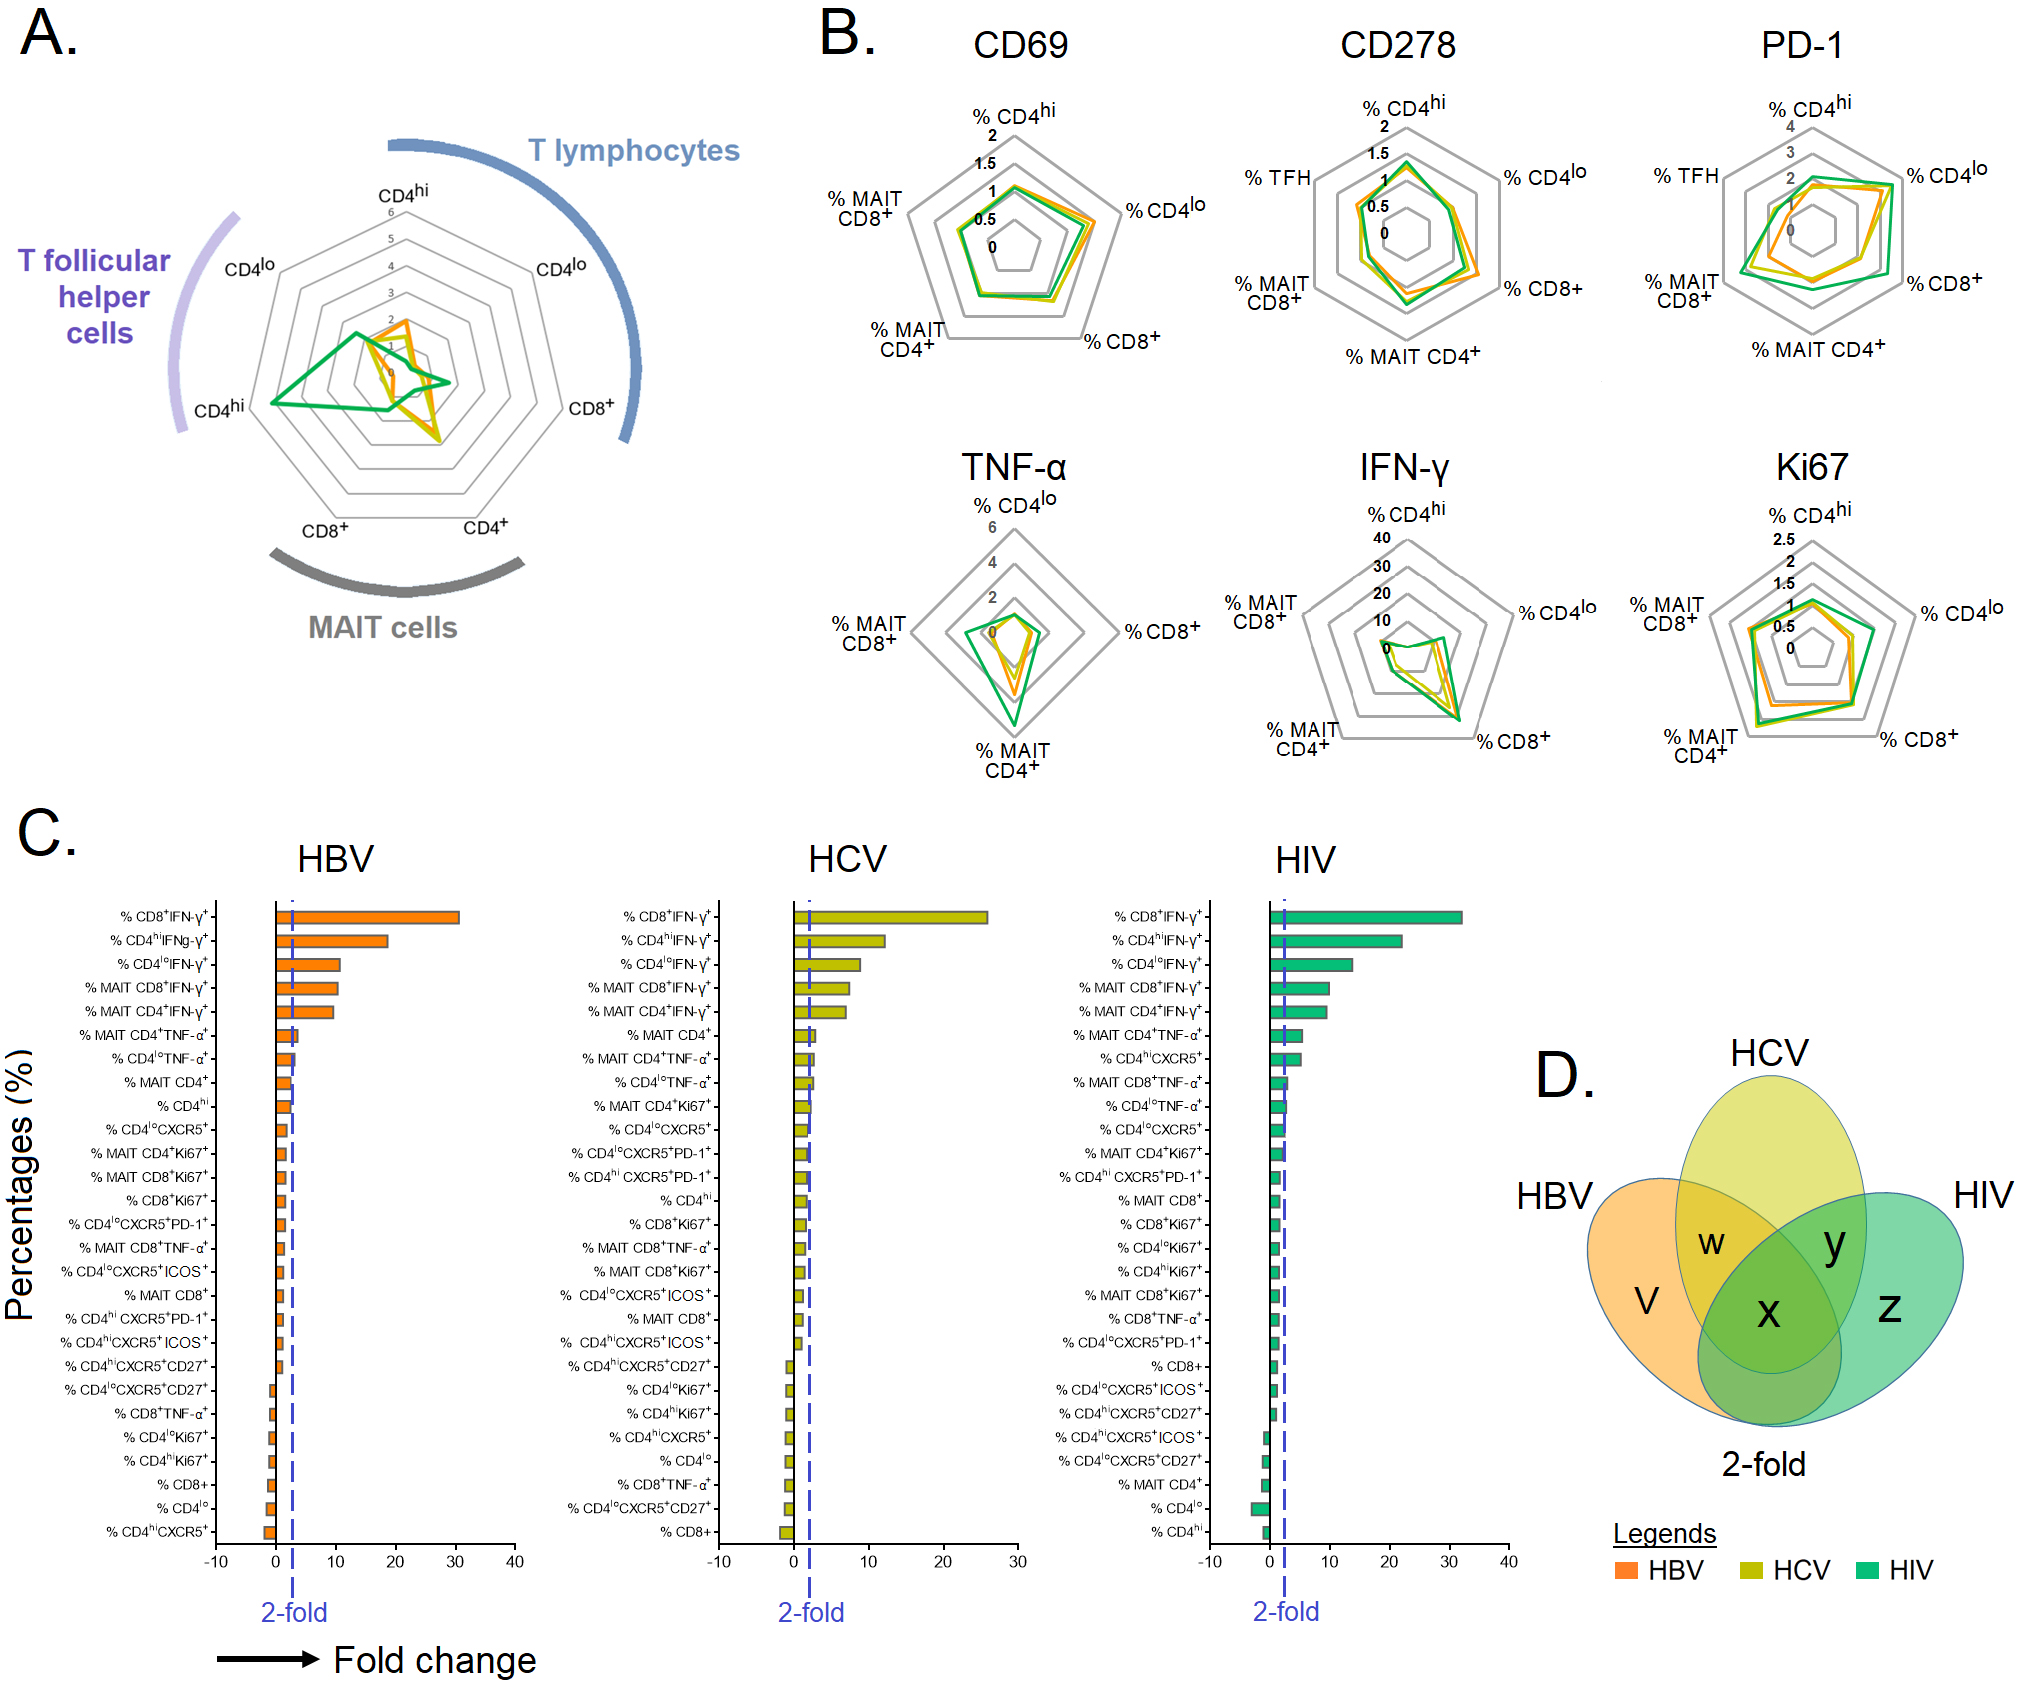 Fig. 4.
Immune cell profiling in chronic HBV-, HCV-, and HIV-infected
individuals. (A,B) The fold change in immune cells with identified intracellular
and extracellular markers in individuals chronically infected with HBV, HCV and
HIV normalized against HCs. (C) Bar plot depicting mean 2-fold change among
identified markers in specific immune cell type. (D) Venn diagram showing immune
cells that are upregulated
| Marker | Univariate | Multivariate | |||
| Coef. (95% CI) | p value | Coef. (95% CI) | p value | ||
| Demographic | |||||
| Age, years | –0.002 (–0.022 to 0.018) | 0.849 | – | – | |
| Gender, male | 0.244 (–0.729 to 1.216) | 0.617 | – | – | |
| Activation markers | |||||
| % CD4 |
0.006 (–0.060 to 0.071) | 0.863 | – | – | |
| % CD4 |
–0.021 (–0.075 to 0.034) | 0.450 | – | – | |
| % CD4 |
–0.054 (–0.102 to 0.007) | 0.025* | – | – | |
| % CD4 |
–0.043 (–0.075 to –0.010) | 0.012* | – | – | |
| % CD8 CD69 | –0.043 (–0.110 to 0.024) | 0.199 | – | – | |
| % CD8 ICOS | –0.036 (–0.077 to –0.005) | 0.041 | – | – | |
| % MAIT CD4 CD69 | –0.011 (–0.070 to 0.048) | 0.706 | – | – | |
| % MAIT CD4 ICOS | 0.029 (–0.022 to 0.079) | 0.262 | – | – | |
| % MAIT CD8 CD69 | –0.010 (–0.070 to 0.091) | 0.799 | – | – | |
| % MAIT CD8 ICOS | –0.023 (–0.050 to 0.003) | 0.040* | – | – | |
| % TFH CD27 | –0.042 (–0.104 to 0.019) | 0.173 | – | – | |
| % TFH ICOS | –0.015 (–0.060 to 0.030) | 0.499 | – | – | |
| log MFI CD4 |
–1.942 (–8.766 to 4.882) | 0.570 | – | – | |
| log MFI CD4 |
5.457 (0.463 to 11.377) | 0.040* | – | – | |
| log MFI CD4 |
–5.135 (–9.189 to –1.081) | 0.014* | – | – | |
| log MFI CD4 |
–3.891 (–9.766 to 1.984) | 0.189 | – | – | |
| log MFI CD8 CD69 | –5.759 (–11.744 to –0.226) | 0.039* | –10.066 (–15.148 to –4.984) | ||
| log MFI CD8 ICOS | –1.759 (–11.4 to 7.883) | 0.716 | – | – | |
| log MFI MAIT CD4 CD69 | 5.602 (1.359 to 9.844) | 0.011* | –8.725 (–12.431 to –5.019) | ||
| log MFI MAIT CD4 ICOS | 0.709 (–1.992 to 3.411) | 0.600 | – | – | |
| log MFI MAIT CD8 CD69 | –3.214 (–7.058 to –0.631) | 0.037* | – | – | |
| log MFI MAIT CD8 ICOS | –2.251 (–4.868 to –0.365) | 0.040* | – | – | |
| log MFI MAIT TFH CD27 | 0.255 (–5.456 to 5.967) | 0.929 | – | – | |
| log MFI MAIT TFH ICOS | –1.564 (–4.093 to 0.966) | 0.220 | – | – | |
| Exhaustion markers | |||||
| % CD4 |
0.059 (0.015 to 0.103) | 0.009** | 0.055 (0.034 to 0.077) | ||
| % CD4 |
0.003 (–0.055 to 0.060) | 0.930 | – | – | |
| % CD8 PD-1 | 0.036 (–0.023 to 0.096) | 0.224 | – | – | |
| % MAIT CD4 PD-1 | 0.037 (0.003 to 0.077) | 0.041* | – | – | |
| % MAIT CD8 PD-1 | 0.025 (–0.015 to 0.065) | 0.209 | – | – | |
| % TFH PD-1 | 0.053 (0.006 to 0.100) | 0.027 | – | – | |
| log MFI CD4 |
2.363 (–2.885 to 7.611) | 0.370 | – | – | |
| log MFI CD4 |
5.860 (0.538 to 12.258) | 0.042* | – | – | |
| log MFI CD8 PD-1 | –3.964 (–11.878 to 3.949) | 0.319 | – | – | |
| log MFI CD4 PD-1 | 0.014 (–5.058 to 5.087) | 0.996 | – | – | |
| log MFI CD8 PD-1 | –2.618 (–4.480 to –0.755) | 0.007** | 5.468 (1.552 to 9.384) | 0.007** | |
| log MFI TFH PD-1 | 5.223 (0.303 to 10.142) | 0.038* | – | – | |
| Functional markers | |||||
| % CD4 |
0.103 (–0.124 to 0.330) | 0.365 | – | – | |
| % CD4 |
0.001 (–0.024 to 0.026) | 0.949 | – | – | |
| % CD4 |
0.059 (0.026 to 0.092) | 0.001*** | † | – | |
| % CD4 |
0.017 (–0.024 to 0.057) | 0.414 | – | – | |
| % CD4 |
0.016 (–0.023 to 0.055) | 0.410 | – | – | |
| % CD4 |
0.013 (–0.022 to 0.048) | 0.447 | – | – | |
| % CD8 TNF- |
–0.021 (–0.053 to 0.011) | 0.191 | – | – | |
| % CD8 IFN- |
–0.041 (–0.081 to –0.002) | 0.042* | – | – | |
| % CD8 Ki67 | 0.031 (–0.013 to 0.076) | 0.164 | – | – | |
| % MAIT CD4 TNF- |
0.009 (–0.080 to 0.098) | 0.840 | – | – | |
| % MAIT CD4 IFN- |
0.008 (–0.015 to 0.031) | 0.467 | – | – | |
| % MAIT CD4 Ki67 | 0.053 (0.026 to 0.079) | 0.034 (0.015 to 0.053) | |||
| % MAIT CD8 TNF- |
0.003 (–0.025 to 0.032) | 0.806 | – | – | |
| % MAIT CD8 Ki67 | 0.001 (–0.055 to 0.056) | 0.985 | – | – | |
| % MAIT CD8 IFN- |
0.046 (–0.009 to 0.101) | 0.101 | – | – | |
| log MFI CD4 |
–0.019 (–0.857 to 0.820) | 0.964 | – | – | |
| log MFI CD4 |
1.188 (–5.475 to 7.851) | 0.720 | – | – | |
| log MFI CD4 |
4.314 (1.968 to 6.659) | 0.001*** | † | – | |
| log MFI CD4 |
–5.354 (–11.066 to –0.357) | 0.045* | –7.794 (–13.400 to –2.188) | 0.007** | |
| log MFI CD4 |
–0.148 (–3.729 to 3.434) | 0.934 | – | – | |
| log MFI CD4 |
–1.815 (–7.845 to 4.215) | 0.546 | – | – | |
| log MFI CD8 TNF- |
–1.367 (–3.472 to 0.738) | 0.197 | – | – | |
| log MFI CD8 IFN- |
1.747 (–3.022 to 6.515) | 0.463 | – | – | |
| log MFI CD8 Ki67 | 2.541 (–0.552 to 5.633) | 0.104 | – | – | |
| log MFI MAIT CD4 TNF- |
4.39 (–3.233 to 12.030) | 0.249 | – | – | |
| log MFI MAIT CD4 IFN- |
1.817 (–2.528 to 6.162) | 0.402 | – | – | |
| log MFI MAIT CD4 Ki67 | 4.632 (1.989 to 7.275) | 0.001*** | † | – | |
| log MFI MAIT CD8 TNF- |
1.935 (–1.795 to 5.666) | 0.300 | – | – | |
| log MFI MAIT CD8 Ki67 | 3.763 (0.177 to 7.703) | 0.041* | – | – | |
| log MFI MAIT CD8 IFN- |
–1.671 (–4.186 to 0.844) | 0.187 | – | – | |
Univariate analyses by linear regression were performed to identify potential
predictors of PVL. Given the small sample size, the linear regression modeling
for T-cells subsets, activation, exhaustion and functional markers were performed
separately. Variables with p
We performed a network analysis for the six predictors of PVL, viz.,
CD4
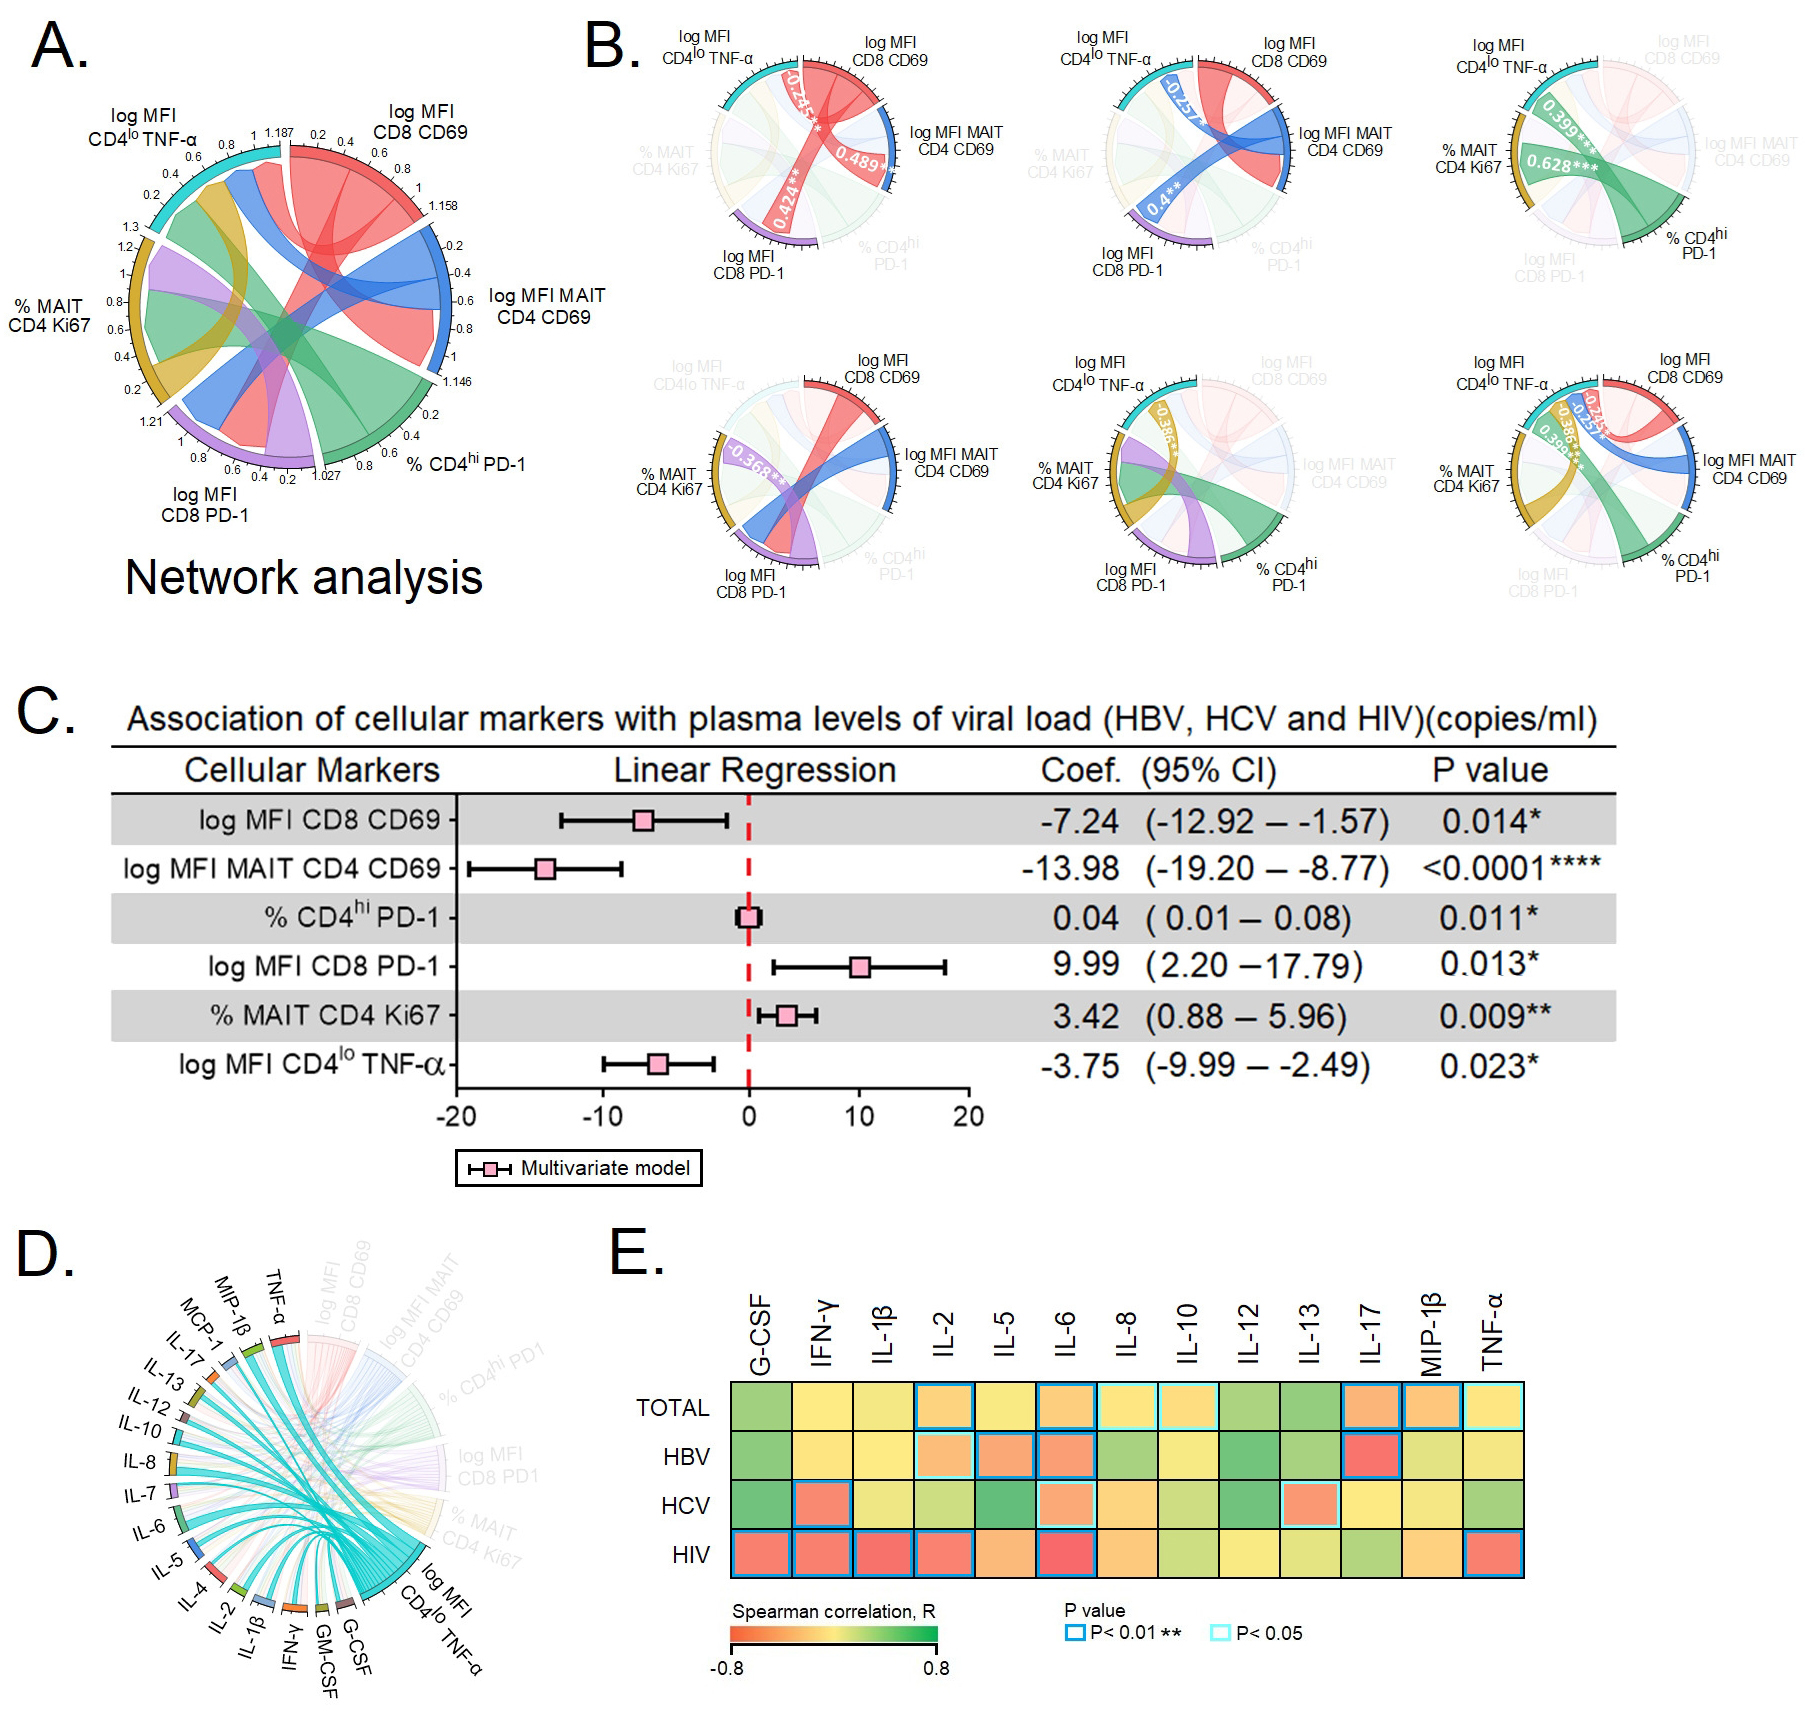 Fig. 5.
Predictors of plasma viral load. (A,B) Network analysis of the
six predictors of plasma viral load. (A) depicts the complexity of the
interactions between the six predictors. (B) Spearman correlation between the six
predictors of plasma viral load. (C) The six markers were subjected to
multivariate linear regression analysis to determine the markers that
independently predict the plasma viral load. (D) Expression of TNF-
Next, we performed multivariate linear regression analysis among the six subsets
of T cells to determine independent prediction over the PVLs of HBV, HCV and
HIV-infected individuals. The multivariate linear regression analysis of cellular
markers were as follows: CD69
Virus-specific T cells express multiple inhibitory receptors during chronic
infections eventually impairing T cell functions. Evidence suggests that
exhausted virus-specific CD8
Recent evidence suggest that MAIT cells are key to immune surveillance, especially in chronic viral infections. MAIT cells aid in host defense in an antigen-independent manner, as they respond to a variety of cytokines such as IL-12 and IL-18 [24] during viral infections. In chronic HBV and HIV infections plasma IL-5 and IL-7, respectively may play a significant role in viral suppression [25]. MAIT cells have been shown to act against several viral agents, particularly HBV, HCV, HIV, dengue, and influenza viruses [26, 27]. Although available findings portray their significance in chronic HBV, HCV and HIV infections, very few compared their role in cross-sectional studies conducted across the infections from same region. In addition, we have also explored into the activation and functional status of circulating Tfh cells across the different study groups.
In the current study, we observed the activation and proliferation of MAIT cells
with higher expression of CD69 and Ki67, respectively. Similar findings have also
been observed during chronic HCV infection, where they exhibit an activated
phenotype with higher levels of the activation markers CD69, HLA-DR, and CD38
[28]. Importantly, here we found that the co-stimulatory potential of MAIT cells
were elevated in the three chronic viral infections, as these cells expressed
higher levels of ICOS as compared to HCs. The correlation between CD69 levels and
polyfunctional TCR iV
Experiments conducted thus far on CD4
In summary, our findings suggest a likely association of compromised immune
responses in chronic HBV, HCV, and HIV infections although not conclusive of the
role of the markers studied herein. The upregulation of CD69 may aid in
regulating immune response by determining the patterns of cytokine and chemokine
release as well as the activation of lymphocytes during chronic infections.
Enhanced TNF-
AIDS, Acquired immunodeficiency syndrome; ALP, Alkaline phosphate triphosphate;
ALT, Alanine aminotransferase; APC, Antigen presenting cells; ART,
Anti-retroviral therapy; AST, Aspartate aminotransferase; BB, Brilliant blue; BV,
Brilliant violet; CD, Cluster of differentiation; CXC, Chemokine ligand; CXCL,
C-X-C chemokine ligand; CXCR, C-X-C chemokine receptor; EDTA, Ethylene diamine
tetra acetic acid; FACS, Fluorescence-activated cell sorting; FBS, Fetal bovine
serum; FITC, Fluorescein isothiocyanate; GC, Germinal center; G-CSF, Granulocyte
colony-stimulating factor; GGT, Gamma-glutamyl transferase; GM-CSF,
Granulocyte-macrophage colony-stimulating factor; HBV, Hepatitis B virus; HC,
Healthy control; HCV, Hepatitis C virus; HIV, Human immunodeficiency virus;
HLA-DR, Human leukocyte antigen D-related; IBSC, Institutional Biosafety
Committee; IC, Internal control; ICOS, Inducible co-stimulator; IEC,
Institutional ethical committee; IFN, Interferon; IL, Interleukin; MAIT,
Mucosal-associated invariant T cell; MCP-1, Monocyte chemoattractant protein-1;
MFI, Mean fluorescence index; MIP-1
The original contributions presented in this study are included in the article/Supplementary material, further inquiries can be directed to the corresponding authors.
EMS, VV, AM, PB and ML designed the study. AM coordinated patient recruitment and sample collections. JV, RA, SR and AM developed the laboratory works and co-ordinated the development of the study. YKY and EMS per-formed data analysis. YKY, HYT, and YZ did the biostatistical analysis. JV, EMS, YKY and VV co-wrote the manuscript. All authors critically reviewed the article, have accepted responsibility for its entire contents and approved its submission.
The studies involving human participants were reviewed and approved by Institutional Ethical Committee (IEC) of the Government Medical College, Theni, India (Ref. Nos. 2544/ME1/18 and 1515/MEIII/21). Prior approval was also obtained from the Tamil Nadu State AIDS Control Society, Chennai, India (TANSACS Approval- 00529/TANSACS/M&E/2019 NACO-T-11020/08/2020_NACO) for the conduct of work. Institutional Biosafety Committee (IBSC) approval was secured from the IBSC of the Central University of Tamil Nadu, Thiruvarur (Ref. No.: CUTN/SLS/1st IBSC/2020/04). The patients/participants provided their written informed consent to participate in this study.
The authors are grateful to all the participants, paraclinical, and laboratory staff of the Government Theni Medical College for assistance with patient recruitment, specimen collection, and cooperation. The authors are thankful to Luke Elizabeth Hanna, National Institute for Research in Tuberculosis, Indian Council of Medical Research, Chennai, India.
This work was supported by funding provided by the Department of Science and Technology-Science and Engineering Research Board, Government of India (CRG/2019/006096) (to ES). This work was also supported by grants through: AI52731, the Swedish Research Council, the Swedish, Physicians against AIDS Research Foundation, the Swedish International Development Cooperation Agency, SIDA SARC, VINNMER for Vinnova, Linköping University Hospital Research Fund, CALF, and the Swedish Society of Medicine (to ML). VV was supported by: The NIH Office of Research Infrastructure Programs (P51 OD011132 to ENPRC), and Emory CFAR (P30 AI050409). HYT was supported by Xiamen University Malaysia Research Fund (XMUMRF/2020-C5/ITCM/0003). AM was supported by a Start-Up-Grant from the Department of Health Research, Government of India (No. 12020/04/2018-HR).
The authors declare no conflict of interest.
Publisher’s Note: IMR Press stays neutral with regard to jurisdictional claims in published maps and institutional affiliations.