
- Academic Editor
†These authors contributed equally.
Background: The survival rate of hepatocellular carcinoma (HCC) is low and the prognosis is poor. Metabolic reprogramming is still an emerging hallmark of cancer, and reprogramming of cholesterol metabolism plays a crucial action in tumor pathogenesis. Increasing evidence suggests that cholesterol metabolism affects the cell proliferation, invasion, migration, and resistance to chemotherapy of HCC. To date, no long noncoding RNA (lncRNA) signature associated with cholesterol metabolism has been developed to predict the outcome of patients with HCC. Methods: The RNA-seq data as well as the prognostic and clinical data were obtained from The Cancer Genome Atlas (TCGA) database. We conducted univariate and multivariate analyses to assess cholesterol metabolism-related lncRNAs correlated with the prognosis of patients with HCC in order to construct a prognostic signature. Functional differences between low- and high-risk groups were investigated using genomic enrichment analysis (GSEA). Kaplan-Meier (KM) curves were applied to explore the overall survival (OS) of the low- and high-risk groups. Single-sample genomic enrichment analysis (ssGSEA) was applied to investigate the association between this predictive signature and immune function. We subsequently examined how this signature relates to treatment response in HCC patients. Results: A prognostic signature comprising six lncRNAs related to cholesterol metabolism was constructed (AC124798.1, AL031985.3, AC103760.1, NRAV, WAC-AS1 and AC022613.1). We found that low-risk groups showed a better prognosis than high-risk groups. In HCC patients, the cholesterol metabolism-related lncRNA signature may be served as an independent prognostic factor. Cholesterol metabolism-related lncRNA signature had higher diagnostic efficiency compared to clinicopathologic variables. After stratifying patients according to different clinicopathological variables, patients with low-risk had a longer OS compared with high-risk patients. The ssGSEA demonstrated that this signature was closely related to the immune status of HCC patients. GSEA analysis demonstrated that immune- and tumor-related pathways were predominantly enriched in the high-risk group. High-risk patients were more responsive to immune checkpoint inhibitors (ICIs) and conventional chemotherapeutic agents. Conclusions: This cholesterol metabolism-related lncRNA signature can predict the prognosis of HCC patients and guide the clinical management of HCC patients, including immunotherapy.
Among primary liver cancers, hepatocellular carcinoma (HCC) is the most common and remains a global health challenge and the third leading cause of cancer-related death globally [1]. Despite the variety of treatment options now available, including locoregional treatments, liver resection/transplantation, and systemic medications, the treatment of HCC still has many limitations [2]. The discovery of immune checkpoints and the development of immunotherapy have brought new hope to patients with HCC, which is a major breakthrough in the history of cancer treatment. Immune checkpoint inhibitors (ICIs) are increasingly used in HCC treatment, but only 20% of patients benefit from immunotherapy [3]. Therefore, more research is needed to explore new therapeutic targets, prognostic signatures, and immunotherapeutic response markers for HCC.
Reprogramming of lipid metabolism plays a crucial action in tumor pathogenesis,
with cholesterol being a major lipid [4]. It has been reported that cholesterol
metabolism modulates the development of HCC in a number of ways, including cell
proliferation, migration, invasion, and resistance to chemotherapy [5, 6, 7].
Cholesterol is typically enriched in the tumor microenvironment (TME) which
includes stromal and immune cells and a repertoire of secreted molecules,
cytokines, and chemokines [8], and dysregulated cholesterol homeostasis drives
the production of immunosuppressive monocytes/macrophages (M
In our research, we conducted a cholesterol metabolism-related lncRNA signature to predict the prognosis of HCC and the response of HCC patients to immunotherapy. Additionally, we performed internal validation and explored possible mechanisms through GSEA.
We obtained gene sequence data of 374 patients with HCC and 50 normal samples as well as clinical information from the TCGA database (https://cancergenome.nih.gov/). We obtained metabolism-related genes from genecards (https://www.genecards.org/). The downloaded data from TCGA were processed and analyzed by Perl (https://strawberryperl.com/, version: 5.38.2) and R (https://www.r-project.org/, version: 4.2.0) software. The mRNA expression of these cholesterol metabolism-related genes in normal and HCC tissues was assessed using the “Wilcox.test” method. The R package “ggboxplot” was applied to plot the boxplot.
Screening of lncRNAs associated with cholesterol metabolism-related genes was
conducted using the “limma” package with p
The x denoted the expression value of the cholesterol metabolism-related lncRNAs, and Coef represented the coefficient value. We used the formula to calculate the risk score of each patient. The lncRNA and mRNA interactions graph was produced by cytoscape software. The cytoscape related analysis were followed by a k-means cluster analysis to find associated protein subgroups. Patients with HCC were categorized into high or low-risk groups based on the median value. The two risk groups’ survival status were assessed by KM and tested using the log-rank test. We calculated the patient’s Youden index using the formula Youden = TP – FP. In order to assess the accuracy of the prognostic model, receiver operating characteristic (ROC) curves and calibration curves were performed. Survival curves of the low- and high-risk groups under different clinicopathological conditions were explored by the “survminer” and “survival” packages. Moreover, we internally validated the prognostic model by dividing the downloaded TCGA data into training and validation sets. The Spearman correlation analyses were further performed to validate the between relationship between risk score and clinical characteristics.
Clinicopathologic characteristics such as grade, stage, gender, T-, N-, and M-stage combined with risk scores together constructed a nomogram that could predict survival in HCC patients. Calibration curves were applied to check if predicted survival matched the actual survival [17].
We used GSEA (https://www.gsea-msigdb.org/gsea/index.jsp, Version 4.1.0 [18]) to
explore which pathway genes were predominantly enriched in the high-risk group.
Nominal p
We employed the “GSVA” package for single-sample gene GSEA (ssGSEA) to calculate the activities of immune-correlated pathways and the infiltration scores of immune cells. Immune checkpoint expression analysis and mapping was performed by the “reshape2”, “limma”, “ggpubr”, and “ggplot2” packages [20].
The half-maximal inhibitory concentration (IC50) of commonly used chemotherapy drugs used in the clinical treatment of HCC was calculated. We compared the IC50 values between low- and high-risk groups using the Wilcoxon signed-rank test. The “limma”, “ggpubr”, “pRRophetic” and “ggplot2” packages [21] were used to predict which high-risk and low-risk groups have different susceptibilities to the drug.
We performed PCA analysis [22] by the “scatterplot3d” and “limma” packages to investigate the distribution of patients with different risk scores.
Statistical analyses were conducted by R software (Version 4.2.0, https://www.r-project.org/). We used the Wilcoxon test to assess the expression of cholesterol metabolism-related DEGs in normal and cancer tissues. We used the univariate Cox regression analysis to explore the association between OS and cholesterol metabolism-related lncRNAs. Multivariate Cox analysis was employed to construct the signature. Furthermore, we used the log-rank test and KM method to explore the patients’ OS different groups. The ROC curves and the AUC values were determined using the “survivalROC” package.
We obtained 59 genes correlated to cholesterol metabolism that were differentially expressed in normal versus HCC tissues, including 41 up-regulated genes and 18 down-regulated genes (Fig. 1A). GO biological process analysis illustrated that DEGs were primarily enriched in the processes of alcohol metabolic process, lipid localization, cholesterol metabolic process, steroid metabolic process, lipid transport and cholesterol transport. GO cellular components category showed the metabolism-related DEGs were mainly located at the lipoprotein particle, plasma lipoprotein particle, high-density lipoprotein particle and protein lipid complex. GO molecular function analysis showed that metabolism-related DEGs were mainly enriched in steroid hydroxylase activity, steroid binding, steroid binding, tetrapyrrole binding and oxidoreductase activity (Fig. 1B). Subsequently, we performed KEGG pathway analysis on these genes, and found that cholesterol metabolism-related DEGs were primarily enriched in the steroid hormone biosynthesis, cholesterol metabolism, metabolism of arachidonic acid, lipid and atherosclerosis, linoleic acid metabolism and steroid biosynthesis pathways (Fig. 1C).
 Fig. 1.
Construction of the cholesterol metabolism-related 6 long noncoding RNA (lncRNA) prognostics signature in patients with hepatocellular carcinoma (HCC). (A) Cholesterol metabolism-related differentially expressed genes (DEGs) in normal and HCC tissues. (B) Gene Ontology (GO) analysis of cholesterol metabolism-related DEGs. (C) Kyoto Encyclopedia of Genes and Genomes (KEGG) analysis of cholesterol metabolism-related DEGs. (D) 6 lncRNAs (AC124798.1, AL031985.3, AC103760.1, NRAV, WAC-AS1 and AC022613.1) that construct the prognostic signature. (E) The lncRNA-mRNA protein-protein interaction (PPI) network of the 6 lncRNAs. (F) Sankey diagram of the 6 lncRNAs.
We obtained 455 lncRNAs that associated with the cholesterol metabolism-related DEGs (Supplementary Table 1). A univariate Cox regression analysis demonstrated that 52 of these 455 lncRNAs were related to HCC patients’ prognosis (Supplementary Fig. 1). By using multivariate Cox regression analysis, 6 cholesterol metabolism-related lncRNAs were identified (AC124798.1, AL031985.3, AC103760.1, negative regulator of antiviral response (NRAV), WAC antisense RNA 1 (WAC-AS1) and AC022613.1) to construct a predictive signature. These 6 lncRNAs were up-regulated in patients with HCC (Fig. 1D). Subsequently, we constructed the network map of the 6 lncRNAs with associated mRNAs using cytoscape software (version:3.8.2, https://cytoscape.org/) (Fig. 1E). We used an additional k-means cluster analysis to divide the associated protein into 3 subgroups (Supplementary Fig. 2). AC124798.1 was co-expressed with SLC25A19, SMARCA4 and DYNC2LI1. AL031985.3 was co-expressed with NPC1, LBR, SLC25A19, PPARD, VDR, ALDH2, SMARCA4 and DYNC2LI1. AC103760.1 was co-expressed with CYP3A4 and CYP2C9. NRAV was co-expressed with NPC1, ALB, CYP2C9, CAV1, CYP2C8, COG2, LBR, SLC25A19, PPARD, ALDH2, SMARCA4 and DYNC2LI1. WAC-AS1 was co-expressed with NPC1, ALB, COG2, LBR, SLC25A19, PPARD, SMARCA4, DYNC2LI1, STARD3 and HSD11B2. AC022613.1 was co-expressed with HSD11B2. Fig. 1F showed that AC022613.1 and AC103760.1 are protective factors. Besides, AC124798.1, AL031985.3, NRAV and WAC-AS1 were risk factors.
Based on the formula, the risk score of each patient with HCC was measured and the patients were categorized into low- and high-risk groups based on the median. KM analysis of the OS rate of HCC patients shown that high-risk group patients had a markedly worse prognosis than low-risk group (Fig. 2A). Fig. 2B showed the risk scores of the low- and high-risk groups. Moreover, we found the higher the risk score, the more HCC patients die (Fig. 2C). We also performed the KM analysis again by taking the cutoff value of the risk scores at the maximum of the Youden-Index (Supplementary Fig. 3). Furthermore, we performed univariate Cox regression analysis to determine whether the signature could serve as an independent prognostic factor for HCC patients. The result indicated that risk score, T stage, M stage, and stage were correlated with the prognosis of patients with HCC (Fig. 2D). Moreover, risk score was also an independent predictor of HCC patients’ OS (Fig. 2E). The (area under curves) AUCs of the signature at 1, 3, and 5-years survival were 0.795, 0.756 and 0.763, respectively, indicating an accurate predictive value of the metabolism-related lncRNA predictive signature (Fig. 2F). The AUC of the risk score was 0.805, showing a better predictor of prognosis in patients with HCC than other clinicopathologic variables (Fig. 2G). Clinical factors like age and gender that do not have a significant impact on the patient’s prognosis may have smaller AUC values. Fig. 3A showed the heat map of the distribution of clinicopathologic variables and the six prognostic cholesterol metabolism-related lncRNAs in the low- and high-risk groups. AC124798.1, AL031985.3, NRAV, and WAC-AS1 were expressed higher in the high-risk group, whereas AC103760.1 and AC022613.1 were highly expressed in the low-risk group.
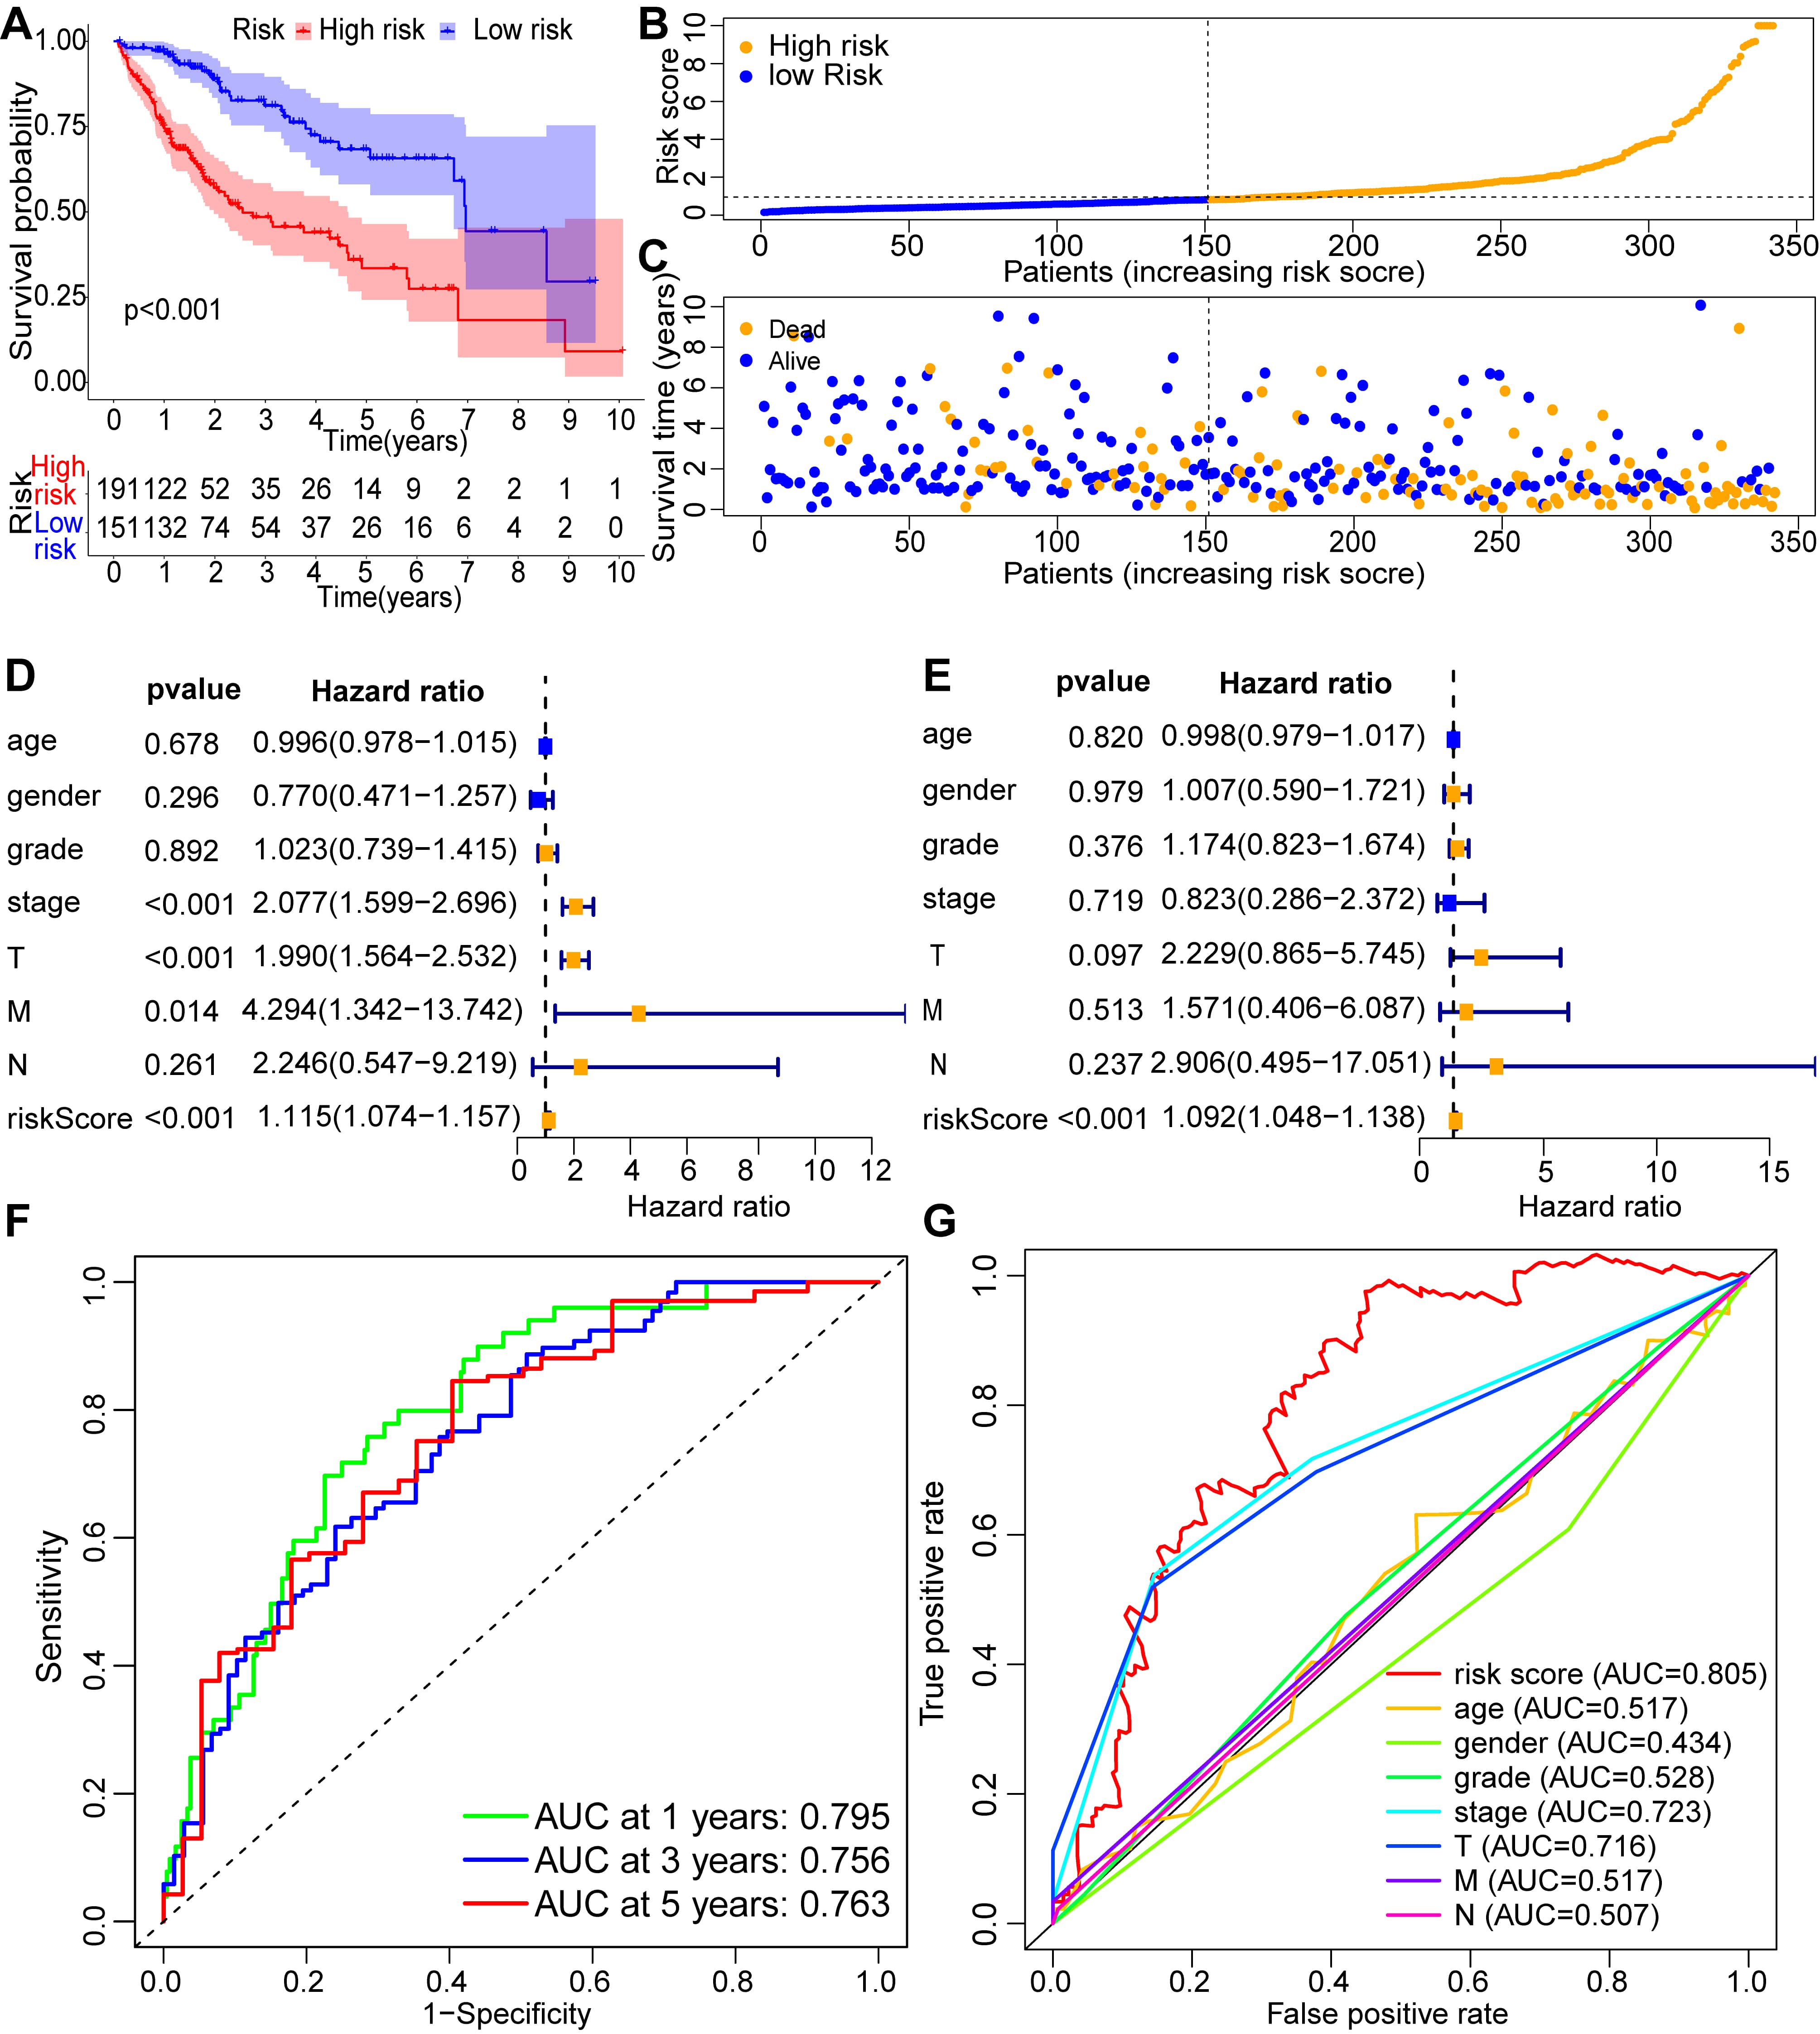 Fig. 2.
Validation of the cholesterol metabolism-associated lncRNA prognostic signature as a prognostic factor for HCC patients. (A) Survival analysis of HCC patients in low- and high-risk groups. (B) Distribution of the risk scores in patients with HCC. (C) The number of alive and dead HCC patients with various risk scores. Univariate Cox regression analysis (D) and multivariate Cox regression analysis (E) for the risk score and other clinical factors. (F) Receiver operating characteristic (ROC) curves at 1-, 3- and 5-years survival for the cholesterol metabolism-associated lncRNA prognostic signature. (G) The ROC curve and area under curves (AUCs) of clinicopathological variables and the risk score.
 Fig. 3.
The relationship between the prognostic signature and clinicopathologic variables in the low- and high-risk groups. (A) AC124798.1, AL031985.3, NRAV, and WAC-AS1 were highly expressed in the high-risk group, whereas AC103760.1 and AC022613.1 were highly expressed in the low-risk group. (B) Nomograms containing the risk score and clinicopathologic variables predicted 1-, 3-, and 5-year overall survival (OS) in HCC patients. (C–E) Calibration curves examined the consistency between actual OS and predictions of 1-, 3-, and 5-year survival.
A nomogram including the risk score and clinicopathological variables was
constructed to predict the 1, 3, and 5-years prognosis of HCC patients (Fig. 3B).
The results showed that the higher the risk score, the higher the T, M, grade,
and stage rating, the higher the score obtained, and the worse the 1-, 3-, and
5-year prognosis of the patient was. We performed Spearman correlation analyses
to validate the between relationship between risk score and clinical
characteristics. We found that the risk score was not associated with age (R = 0.078, p = 0.247) and M stage (R = 0.043, p = 0.526). The risk score was negatively correlated with gender (R = –0.143, p = 0.034), survival status (R = –0.406, p
We grouped HCC patients according to age, stage, grade, T-, N- and M-stage. In
HCC patients with age
 Fig. 4.
The OS of patients in low- and high-risk groups categorized
according to different clinicopathologic variables. In HCC patients with age
To validate the cholesterol metabolism-related lncRNA predictive signature based on the entire TCGA dataset, we randomized 342 HCC patients into two groups (n = 171). In both cohorts, patients with HCC in the low-risk group had better OS than high-risk group, consisting with the results observed across the entire dataset (Fig. 5A–D,F–I). The 1-, 3-, and 5-year survival’s AUCs in the first cohort were 0.803, 0.771, and 0.805, respectively (Fig. 5E). The AUCs for 1-, 3-, and 5-year survival in the second cohort were 0.783, 0.741, and 0.739, respectively (Fig. 5J). The results demonstrated that the cholesterol metabolism-related lncRNA predictive signature is a promising predictor of prognosis in patients with HCC.
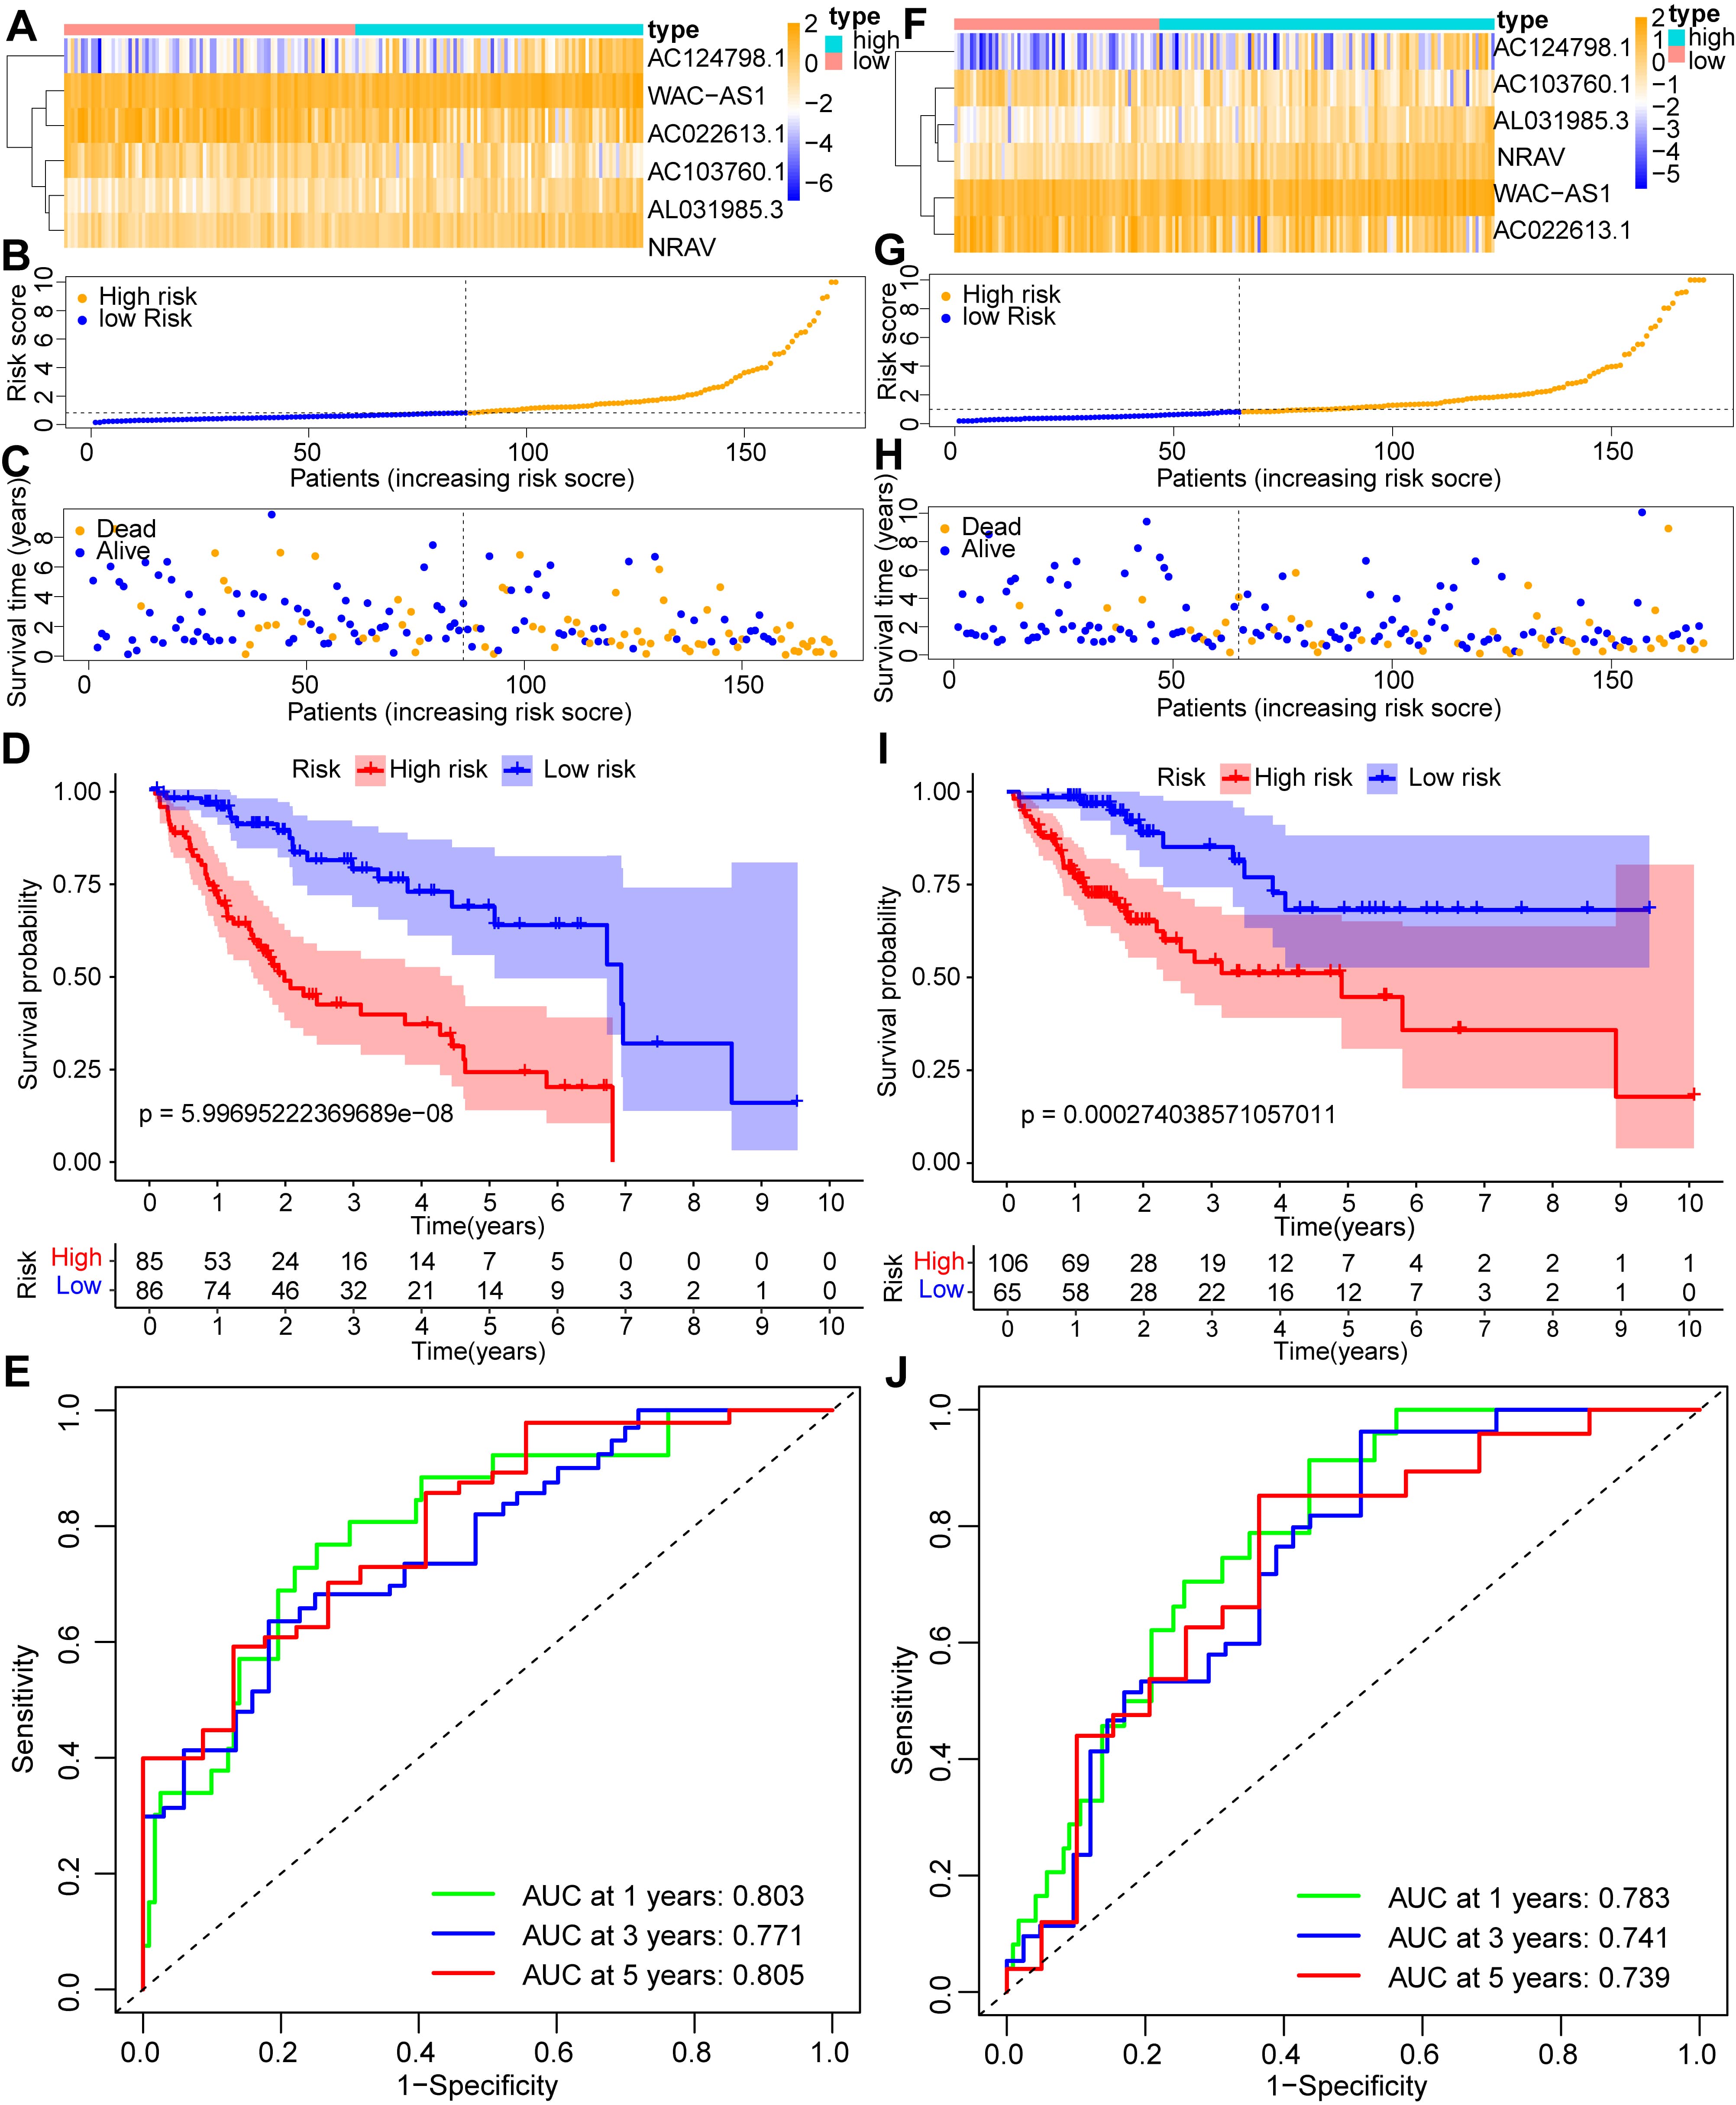 Fig. 5.
Internal validation of the cholesterol metabolism-associated lncRNA prognostic signature. (A) Heatmap of the signature in the first internal cohort. (B) Distribution of the risk scores in patients with HCC in the first internal cohort. (C) The number of alive and dead HCC patients with various risk scores in the first internal cohort. (D) Kaplan-Meier (KM) analysis of OS rates in the first internal cohort. (E) ROC curve and AUCs at 1-year, 3-years and 5-years survival in the first internal cohort. (F) Heatmap of the signature in the second internal cohort. (G) Distribution of the risk scores in patients with HCC in the second internal cohort. (H) The number of alive and dead HCC patients with various risk scores in the second internal cohort. (I) KM analysis of OS rates in the second internal cohort. (J) ROC curve and AUCs at 1-year, 3-years and 5-years survival in the second internal cohort.
In order to investigate the possible mechanisms for the different OS of the low- and high-risk groups, we performed GSEA analysis. The results demonstrated that cell cycle, ERBB signaling pathway, pathways in cancers, lysosome, MAPK pathway, MTOR pathway, VEGF pathway, notch pathway, and RIG I like receptor pathway were significantly enriched in the high-risk group (Fig. 6). These results illustrated that high-risk patients were closely associated with immune- and tumor-related pathways, which may be related to their poor prognosis.
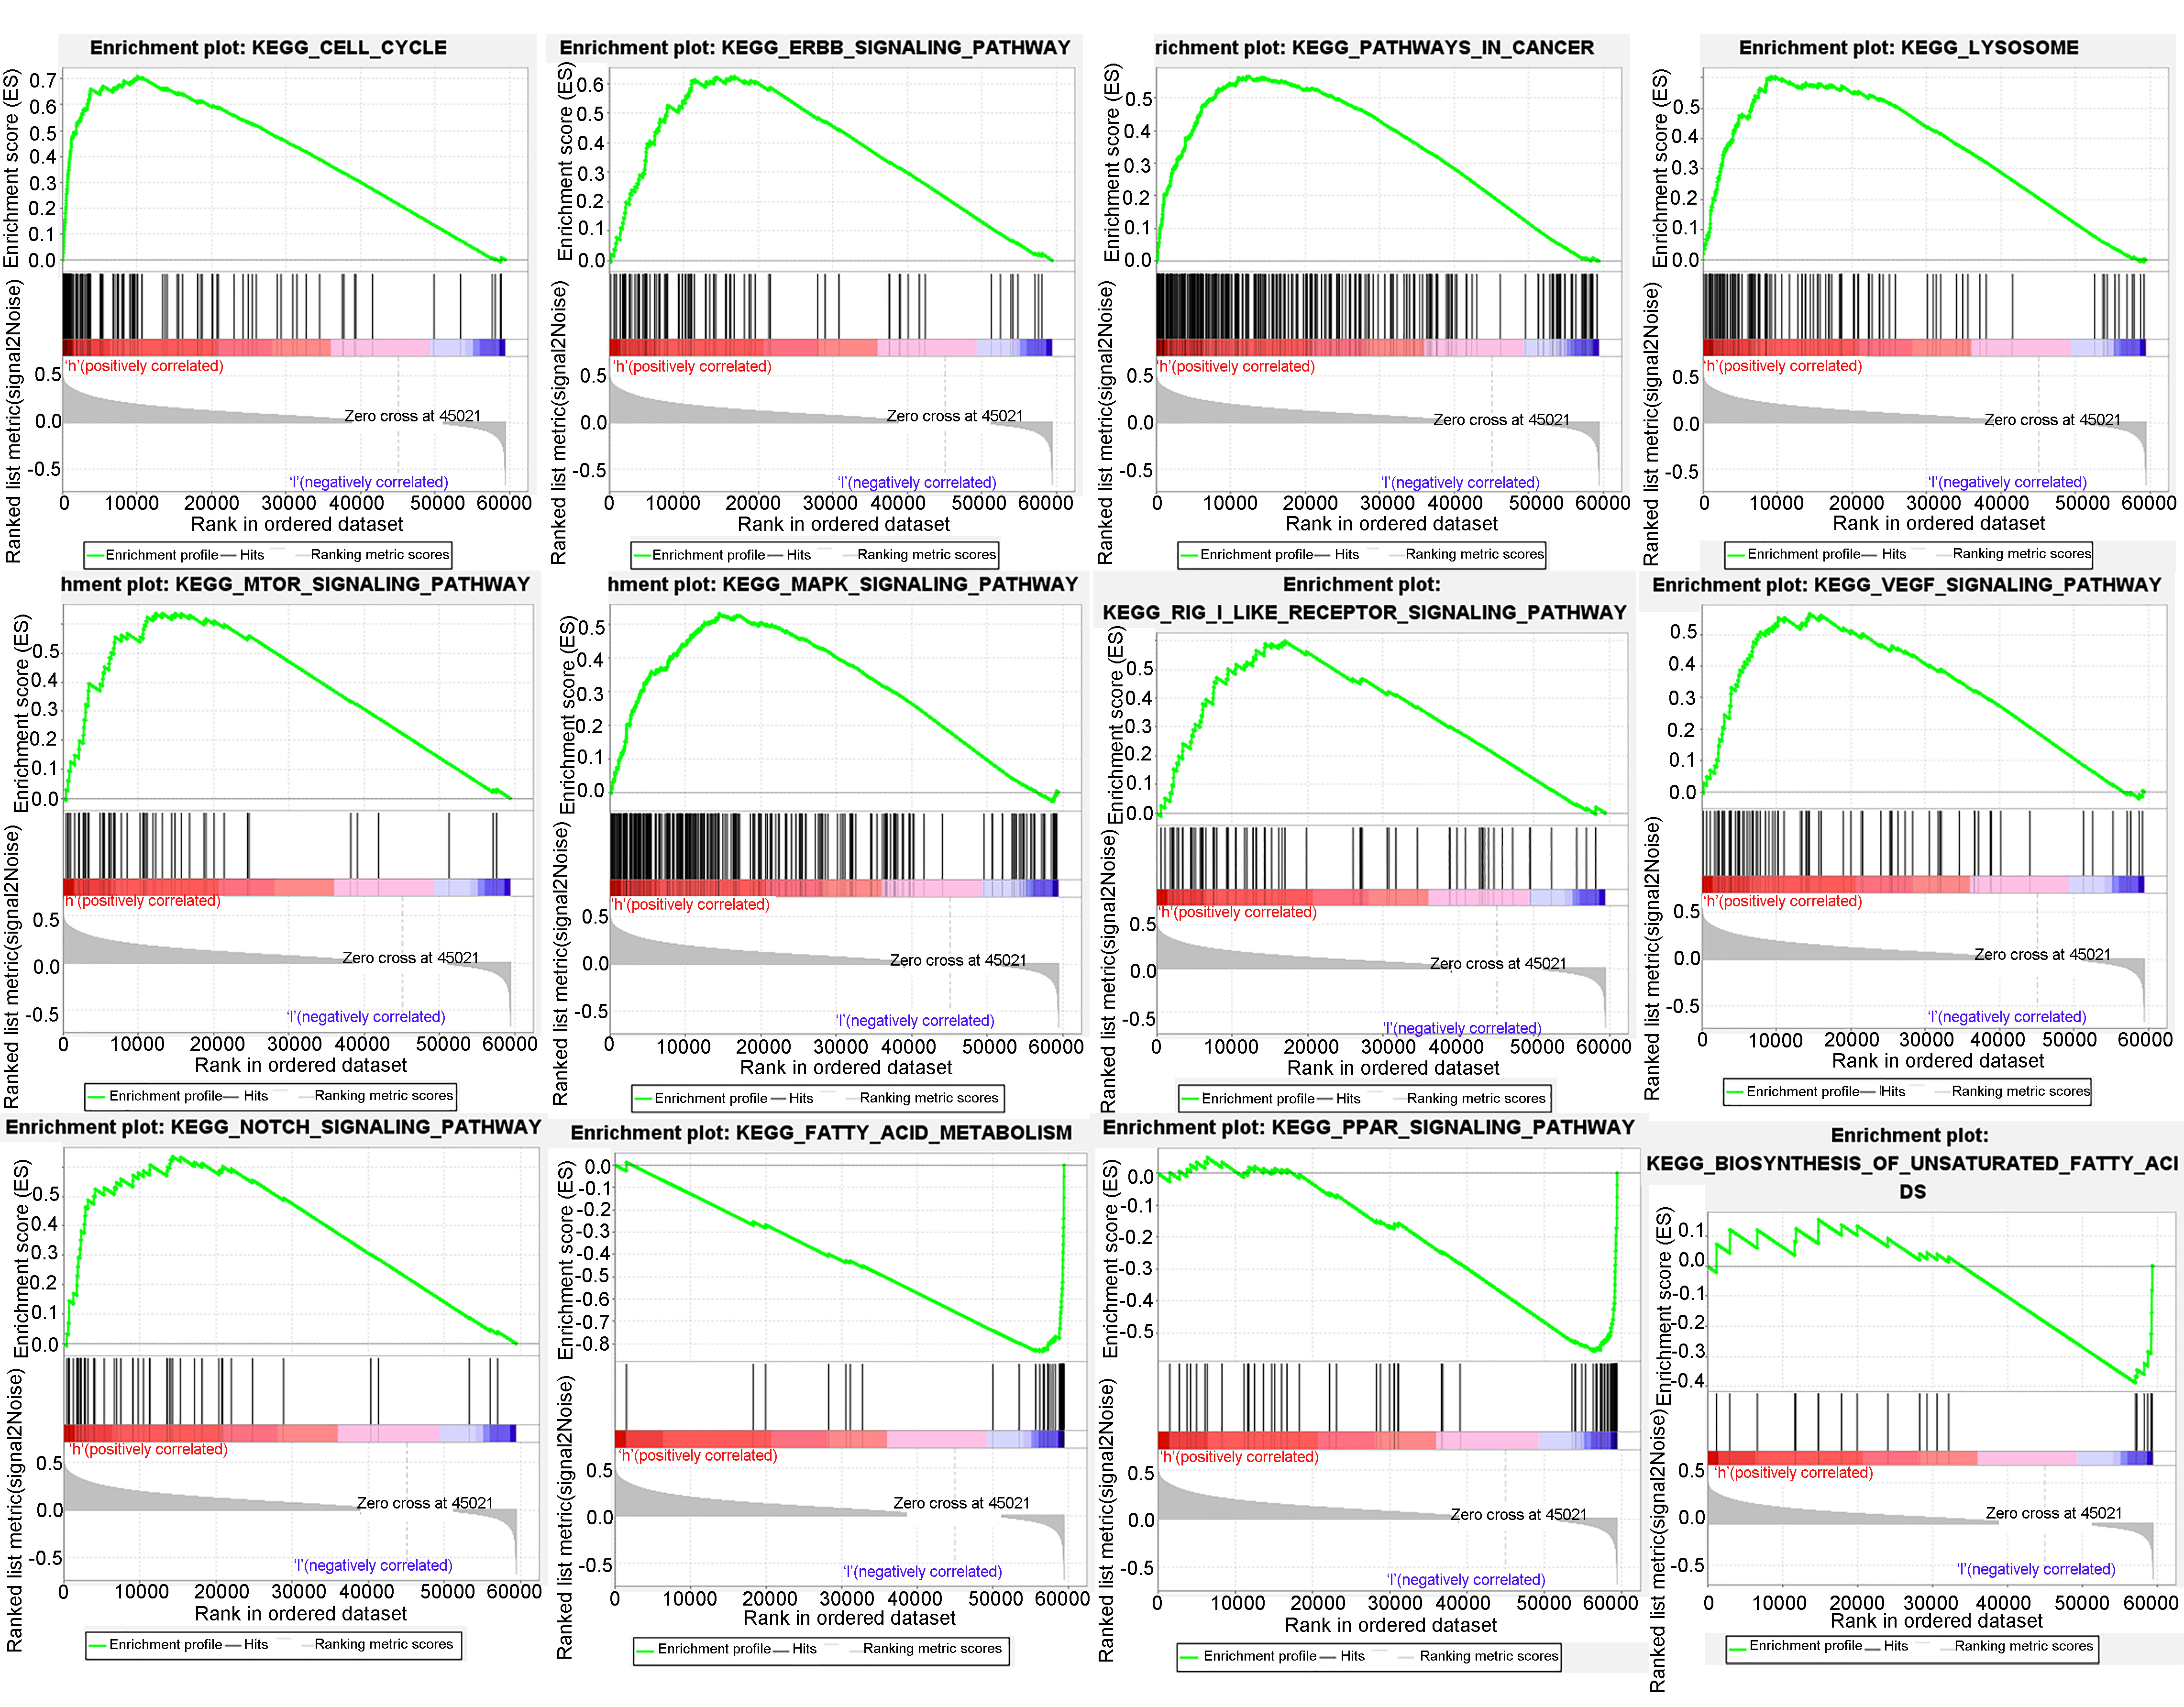 Fig. 6.
Genomic enrichment analysis (GSEA) analysis of low- and high-risk groups of the cholesterol metabolism-associated lncRNA prognostic signature in HCC. This lncRNA prognostic signature is associated with cell cycle, ERBB pathway, pathways in cancer, lysosome, MTOR pathway, MAPK pathway, RIG_I like receptor pathway, VEGF pathway, notch pathway, fatty acid metabolism, PPAR pathway, and biosynthesis of unsaturated fatty acids.
We then explored the correlation between risk scores and immune function and immune cell infiltrates. We found that mast cells were increased in low-risk group, while activated dendritic cells (aDCs), macrophages, Th2 cells and Treg cells were elevated in high-risk group (Fig. 7A). Compared with low-risk group, the immune function scores of MHC class I were higher in the high-risk group, while the immune function scores of type I and type II interferon (IFN) response were lower in high-risk group (Fig. 7B). Additionally, it was revealed that immune checkpoint genes expressed higher in high-risk group patients, indicating that metabolism-related lncRNA predictive signature may be a predictor for the patient’s response to ICIs (Fig. 7C).
 Fig. 7.
The association between the cholesterol metabolism-associated
lncRNA prognostic signature and the immune status of HCC patients. (A)
Relationship between the risk score and immune cell infiltration in HCC. (B)
Association of the risk score with immune pathways in HCC. (C) Association
between the risk score and the immune checkpoint genes expression in HCC. ns, no significance, *p
We investigated the correlation between the prognostic signature of cholesterol metabolism-associated lncRNAs and patients’ response to clinically available drugs for HCC treatment. We found that the riskscore could indicate patient response to relevant drugs and guide more appropriate dosing regimens (Fig. 8). Moreover, PCA maps were used to visualize the distribution of patients according to the whole genome (Fig. 9A), all lncRNAs (Fig. 9B), differential expressed genes (Fig. 9C), and the model-screened cholesterol metabolism-related lncRNAs (Fig. 9D). The results indicated that the two groups were separated to a greater extent by the 6 lncRNAs risk model than by all lncRNAs, 59 DEGs and whole-genome expression profiles; that is, through this lncRNA signature HCC patients could be divided into high- and low-risk groups that differed significantly with respect to cholesterol metabolism status.
 Fig. 8.
Analysis of sensitivity to therapeutic drugs in patients in low- and high-risk groups.
 Fig. 9.
The construction of principal component analysis (PCA) maps. The PCA maps visualize the distribution of HCC patients according to the whole genome (A), all lncRNAs (B), differential expressed genes (C), and the model-screened cholesterol metabolism-related lncRNAs (D).
Patients with HCC have a poor prognosis and low survival rate. Despite advances in systemic therapies like surgery, radiation therapy, chemotherapy and immunotherapy, the OS rate of HCC patients is still low [23]. Numerous studies have demonstrated that cholesterol plays an essential part in the development of HCC, but there have been no studies on cholesterol metabolism-related lncRNAs as a prognostic signature to predict the prognosis of patients with HCC and to guide therapy.
In our work, we first screened 59 cholesterol metabolism-related genes that
expressed differentially in normal and HCC tissues, and then finally obtained 6
cholesterol metabolism-related lncRNAs (AC124798.1, AL031985.3,
AC103760.1, NRAV, WAC-AS1 and AC022613.1)
that were correlated to the prognosis of HCC patients by univariate and
multivariate analysis. AC124798.1 has been proved to be associated with
cuproptosis [24]. It has been shown that relevant lncRNA models, including
AL031985.3, are associated with CD4
We calculated the risk score of each patient based on the formula and categorized the patients into low- and high-risk groups according to the median. We found that patients with HCC had longer OS in low-risk group than in high-risk group. ROC curves demonstrated that the predictive signature could be used as an independent prognostic factor for HCC, and its prognostic performance was better than clinicopathologic variables. The predictive signature could predict the outcome of patients with HCC in most clinicopathologic variables. Moreover, we confirmed the good predictive performance of the predictive signature by internal validation. Drug sensitivity analyses also validated the usefulness of this prognostic signature for predicting patient responsiveness to drugs such as sorafenib, and for guiding clinical therapy. For example, in patients with a low riskscore score sorafenib may be more effective.
GSEA showed that pathways in cancers, lysosome, MTOR pathway, MAPK pathway, VEGF
pathway, RIG I like receptor pathway, notch pathway were significantly enriched
in the high-risk group. mTOR signaling and cellular metabolism are common
determinants of cancer [37], mTOR inhibitor effectively improves prognosis in
liver transplant patients with HCC [38]. The MAPK signaling pathway is a
fundamental pathway in mammalian cells and is closely associated with
physiological activities such as cell differentiation, proliferation, apoptosis
and angiogenesis. It was demonstrated that the abnormal activation of certain
proteins in the MAPK pathway is a major cause of many types of cancers, and
intervention in this pathway is a promising strategy for the treatment of tumors
[39, 40]. It has been reported that mutant RIG-I enhances cancer-associated
inflammation by activating CircRIG-I signaling [41]. Besides, intrinsic RIG-I can
regulate the antitumor activity of CD8
Moreover, we found that aDCs, Th2 cells, macrophages, and Treg cells are upregulated in high-risk group. Th2 cytokines are known to promote cancer metastasis [46]. Tregs play an important role in tumor immune evasion by suppressing the immune response of immune cells attacking tumors [47]. Dendritic cells (DCs) with their potent antigen presenting ability are long considered as critical factor in antitumor immunity. Despite high potential in promoting antitumor responses, tumor-associated DCs are largely defective in their functional activity and can contribute to immune suppression in cancer [48]. Th2 cell-mediated type 2 immunity may influence the tumor microenvironment (TME) and on tumor progression. Th2 cells contribute to antitumor immunity. The specific metabolic properties of Th2 cells may prove beneficial in treating cancer by modulating TME [49]. Treg cells are closely related to tumor immunity, and their number and function fluctuate during the tumor occurrence and development, as well as their mutual developmental plasticity. In different tumor tissues, Treg cells may play antitumor or tumor suppression role [50]. The M1/M2 macrophage paradigm plays a key role in tumor progression. M1 macrophages are historically regarded as anti-tumor, while M2-polarized macrophages, commonly deemed tumor-associated macrophages (TAMs), are contributors to many pro-tumorigenic outcomes in cancer through angiogenic and lymphangiogenic regulation, immune suppression, hypoxia induction, tumor cell proliferation, and metastasis [51]. Mast cells (MCs) are a non-negligible population of immune cells in the tumor microenvironment (TME). In most tumor types, MCs accumulate in both the tumor tissue and the surrounding tissue. MCs interact with multiple components of the TME, affecting TME remodeling and the tumor cell fate. However, controversy persists regarding whether MCs contribute to tumor progression or trigger an anti-tumor immune response [52]. Here, in the high-risk group, the more malignant the tumor progresses to advanced stages, the more anti-tumor immune cells are needed, that may be the reason why aDCs, Th2 cells are more numerous. Risk scores are not only associated with the immune cell infiltrates but also with immune-related pathways. In addition, immune checkpoint gene expression was generally higher in patients with high-risk scores, suggesting a stronger response to ICIs. Overall, the prognostic signature could predict the responsiveness to immunotherapy and the tumor immune microenvironment in HCC patients.
However, there are some shortcomings in our study. First, only TCGA database was used for internal validation of our signature, which should be further followed up with external datasets or clinical data for further validation. Second, we did not conduct in vitro and in vivo experiments to explore the mechanism of action of our signature in depth.
In summary, the cholesterol metabolism-associated lncRNA signature may be used as an independent predictor of the prognosis of HCC patients and their response to ICIs. Patients with high-risk scores may have worse prognosis because of the activation of cancer, immune-related pathways. Additionally, based on the level of the model’s risk score and its relationship to the IC50, patients may be guided on the precise administration of some of their chemotherapeutic agents. Meanwhile, this signature is highly correlated with cholesterol metabolism pathways, which helps researchers gain insight into the correlation between metabolism and tumorigenesis. Hopefully, this will provide a new perspective for exploring biomarkers in the cholesterol metabolism microenvironment of HCC tumors. But the prognostic signature still needs further experimental verification and the validation of clinical data in the future.
The datasets utilized in this study are accessible from TCGA database (https://cancergenome.nih.gov/), and genecards (https://www.genecards.org/). The datasets used and/or analyzed during the current study are also available from the corresponding author on reasonable request.
HL and TX wrote the manuscript. HZ and XH designed this work. XH and HL downloaded and analyzed the data. HL and XH performed the differential expression analysis and constructed the cholesterol metabolism-related lncRNA model. XH constructed the nomogram and performed the GSEA and PCA analysis. HZ, XH and TX prepared the figures and revised the manuscript. All authors read and approved the final manuscript. All authors have participated sufficiently in the work and agreed to be accountable for all aspects of the work.
Not applicable.
Not applicable.
This research received no external funding.
The authors declare no conflict of interest.
Publisher’s Note: IMR Press stays neutral with regard to jurisdictional claims in published maps and institutional affiliations.