
- Academic Editor
†These authors contributed equally.
Background: The study on Head and Neck Squamous Cell Carcinoma (HNSCC), a prevalent and aggressive form of head and neck cancer, focuses on the often-overlooked role of soluble mediators. The objective is to leverage a transcriptome-based risk analysis utilizing soluble mediator-related genes (SMRGs) to provide novel insights into prognosis and immunotherapy efficacy in HNSCC patients. Methods: We analyzed the expression and prognostic significance of 10,859 SMRGs using 502 HNSCC and 44 normal samples from the TCGA-HNSC cohort in The Cancer Genome Atlas (TCGA). The samples were divided into training and test sets in a 7:3 ratio, with an additional external validation using 40 tumor samples from the International Cancer Genome Consortium (ICGC). Key differentially expressed genes (DEGs) with prognostic significance were identified through univariate and Lasso-Cox regression analyses. A prognostic model based on 20 SMRGs was developed using Lasso and multivariate Cox regression. We assessed the clinical outcomes and immune status in high-risk (HR) and low-risk (LR) HNSCC patients utilizing the BEST databases and single-sample Gene Set Enrichment Analysis (ssGSEA). Results: The 20 SMRGs were crucial in predicting the prognosis of HNSCC, with the SMRG signature emerging as an independent prognostic indicator. Patients classified in the HR group exhibited poorer outcomes compared to those in the LR group. A nomogram, integrating clinical characteristics and risk scores, demonstrated substantial prognostic value. Immunotherapy appeared to be more effective in the LR group, possibly attributed to enhanced immune infiltration and expression of immune checkpoints. Conclusions: The model based on soluble mediator-associated genes offers a fresh perspective for assessing the pre-immune efficacy and showcases robust predictive capabilities. This innovative approach holds significant promise in advancing the field of precision immuno-oncology research, providing valuable insights for personalized treatment strategies in HNSCC.
Head and neck squamous cell carcinoma (HNSCC), a critical global health concern, ranks as the sixth most prevalent cancer worldwide. This group of malignancies, originating in the oral cavity, lips, nasopharynx, pharynx, and larynx, presents a significant clinical challenge [1, 2]. Annually, HNSCC accounts for more than 809,000 new cases and over 316,000 deaths, constituting approximately 3.6% of all cancer-related fatalities [3]. The prognosis for HNSCC remains daunting despite the array of available therapeutic interventions, including surgery, chemotherapy, radiotherapy, and photodynamic therapy. The increasing morbidity and mortality rates each year underscore the urgent need for enhanced treatment strategies, as the cancer’s aggressive and heterogeneous nature complicates management and therapeutic outcomes [4]. Early-stage HNSCC patients have a 60–95% success rate with primary tumor resection and neck debulking [5], but most are diagnosed at advanced stages with metastasis and recurrence [6, 7]. Disease prognosis heavily depends on the Tumour, node and metastasis (TNM) stage and histologic grade, influencing treatment decisions, including immunotherapy [8]. However, traditional clinicopathological staging may not accurately reflect prognosis due to variable clinicopathologic characteristics in patients with the same clinical stage [9].
Soluble mediators like cytokines, chemokines, and growth factors play pivotal
roles in the tumor microenvironment (TME), influencing immune responses and
intercellular communication [10, 11]. These mediators facilitate tumor growth,
chronic inflammation, and an immunosuppressive and pro-angiogenic milieu,
challenging the efficacy of therapies including immunotherapy [12].
Tumor-associated macrophages, for instance, release soluble mediators (e.g.,
IL-6, IL-10, CCL18, CCL22, TNF
Amidst evolving bioinformatics, this study, for the first time, explores the prognostic and therapeutic implications of soluble mediator-related genes (SMRGs) in HNSCC using the Cancer Genome Atlas-Head and Neck Squamous Cell Carcinoma (TCGA-HNSC) dataset. We meticulously analyzed the association between SMRG expression patterns and HNSCC prognosis, identifying 20 reliable SMRGs. This investigation was driven by the unexplored potential of SMRGs in diagnosing and prognosticating HNSCC. Consequently, we developed a predictive model based on SMRGs and a risk score, examining their ties to the immune microenvironment, and associations with chemotherapy and immunotherapy. This comprehensive genetic analysis aims to underscore the utility of SMRGs in enhancing prognosis, diagnosis, and personalized treatment strategies for HNSCC patients.
The TCGA-HNSC cohort, encompassing 502 HNSC and 44 normal samples, was retrieved from the TCGA database (https://portal.gdc.cancer.gov/), with 501 HNSC samples possessing complete clinical data included in subsequent analyses. These samples were randomized into training and test risk groups (7:3 ratio) using the cart R package (https://cran.r-project.org/web/packages/caret/index.html), drawing on relevant clinical information. Additionally, 40 patients with comprehensive follow-up data were sourced from the ICGC as an external validation set.
Differential expression analysis between normal and tumor groups was
meticulously executed using the ‘limma’ R package [26, 27, 28], adhering to stringent
criteria of an absolute log fold change (
TCGA-HNSC cohorts were segregated into distinct groups based on the consensus expression of soluble media-associated differentially expressed genes (DE-SMRGs) using ‘ConsensionClusterPlus’ R software (Version 4.1.3, Chapel Hill, NC, USA) [31]. The MCPcounter R package (Version 4.1.3, Paris, France) [32] was employed to evaluate the content of immune-related cells in these clusters and to generate violin plots.
The prognostic value of SMRGs in the HNSCC cohort was meticulously evaluated
through univariate Cox regression analysis. This statistical approach allowed us
to determine the individual impact of each SMRG on patient survival. Further, to
refine our analysis and identify the most influential genes within the vast array
of SMRGs, we employed LASSO Cox regression analysis using the “glmnet” R package
[33]. This method effectively pinpointed key genes and their corresponding
regression coefficients, reducing the risk of overfitting by penalizing the
complexity of the model. The risk scores for each patient were then calculated
using a comprehensive formula that combines the expression levels of these key
mRNAs and their respective regression coefficients. The formula is structured as
follows: risk score = Expression_mRNA1
Risk scores for patients in our study were accurately computed using the “survminer” R package, based on the established model equations derived from the combination of gene expressions and their corresponding coefficients. This calculation enabled the categorization of patients into high-risk (HR) and low-risk (LR) groups, a division based on the median value of the calculated risk scores. Following this stratification, survival curves for each group were meticulously plotted to visually represent and compare the survival probabilities over time between these two distinct risk categories. To quantitatively assess the predictive accuracy of our prognostic model, the concordance index (C-index) was determined using the ‘pec’ R program. The C-index is a crucial metric in survival analysis, providing a measure of the model’s ability to accurately predict survival outcomes [34]. Additionally, we utilized the ‘survivalROC’ R package for conducting time-dependent Receiver Operating Characteristic (ROC) curve analysis. This analysis is essential for evaluating the predictive potential of the genetic markers identified in our study over time, offering insights into the temporal robustness and reliability of the prognostic model in assessing patient outcomes in HNSCC.
The evaluation of the risk score’s effectiveness as an independent prognostic factor for HNSCC was thoroughly conducted using both univariate and multivariate Cox regression models. These models are instrumental in discerning the extent to which the calculated risk score can predict patient outcomes independently of other clinical variables. Furthermore, to translate our findings into a practical tool for clinical use, we utilized the “rms” R package [35] to create detailed nomograms. These nomograms integrate several key parameters, including the risk score derived from our model, patient age, tumor stage, and the expression levels of the model genes. They are designed to predict the 1, 3, and 5-year overall survival rates for patients in the TCGA HNSC cohort.
We employed a multifaceted approach to quantify immune infiltration scores, utilizing a suite of established methodologies. These included XCELL [36, 37], TIMER [38, 39], QUANTISEQ [40, 41], MCPCOUNT [32], EPIC [42], CIBERSORT [43, 44]and CIBERSORT-ABS [45]. The integration of these diverse tools enabled a thorough analysis of the immune landscape within the HNSCC tumor microenvironment. We conducted Spearman correlation analysis to investigate the relationship between the calculated risk scores and the presence of various immune cells, providing insights into the interplay between genetic risk factors and the immune milieu. Furthermore, the single-sample Gene Set Enrichment Analysis (ssGSEA) method was applied to determine the immune cell characteristics in HNSCC patients. This approach was instrumental in differentiating the immune infiltration status between high-risk (HR) and low-risk (LR) groups, offering a nuanced understanding of how risk levels correlate with immune response.
Our analysis extended to examining 20 suppressive immune checkpoints identified in Auslander’s study [46], focusing on their variations between the HR and LR groups. Additionally, we referenced a gene set pertaining to the cancer immune cycle from Xu et al.’s website [44] (http://biocc.hrbmu.edu.cn/TIP/) and drew upon Mariathasan’s research for a list of genes associated with favorable responses to the anti-PD-L1 drug atezolizumab [47]. To assess the enrichment of gene features related to the cancer immune cycle and immunotherapy response, we employed the Gene Set Variation Analysis (GSVA) method [48] was employed. A p-value of less than 0.05 was considered indicative of a significant difference between the HR and LR groups. The ‘ggcor’ R package (version 4.1.3) was utilized to further analyze the association between risk scores and these genetic characteristics, providing a comprehensive overview of how genetic risk factors might influence the efficacy of immunotherapeutic interventions in HNSCC.
The evaluation of treatment response in high-risk (HR) and low-risk (LR) patient groups with HNSCC was meticulously conducted using half-maximal inhibitory concentration (IC50) data. This data was sourced from the Genomics of Drug Sensitivity in Cancer (GDSC) database, accessible at https://www.cancerrxgene.org/. Utilizing the “pRRophetic” R package (version 4.1.3) [49], we were able to predict and compare the response of HR and LR groups to various anticancer drugs.
The Tumor Immune Single-Cell Hub (TISCH) database, accessible at http://tisch.comp-genomics.org, played a pivotal role in our research, particularly in the study of tumor microenvironment (TME) heterogeneity in HNSCC. As a comprehensive repository of single-cell RNA sequencing data, TISCH specializes in providing detailed insights into the TME across a variety of cancer types, datasets, and cell types [50].
The verification of the expression levels of soluble mediator-related genes (SMGs) in our study on HNSCC was significantly bolstered by utilizing immunohistochemical sections from the Human Protein Atlas (HPA) database (https://www.proteinatlas.org/). HPA is an extensive resource that integrates proteomic, transcriptomic, and systems biology data to provide a comprehensive view of human protein expression across various tissues and cells.
In our comprehensive study, all statistical analyses were rigorously performed using R software, version 4.1.3. We adhered to stringent statistical criteria, considering both p-values and false discovery rate (FDR) q-values below the threshold of 0.05 to denote statistical significance. This approach ensured a robust and reliable interpretation of our data, minimizing the likelihood of false positives and providing a solid foundation for our conclusions.
The graphic flowchart in Fig. 1 succinctly encapsulates the methodology and
structure of our extensive study on the role of SMRGs in HNSCC. Our research
entailed a detailed analysis of clinical information and mRNA expression data
from 546 HNSCC samples, which were sourced from The Cancer Genome Atlas (TCGA).
In the initial phase of our study, we identified a comprehensive gene set of
soluble mediators, totaling 10,859 genes, from the Genecard database. This
extensive list served as a foundational reference for our subsequent analyses.
Employing the “limma” R package, we conducted differential gene expression
analysis on HNSCC tumor tissues. We set a stringent threshold of an absolute log
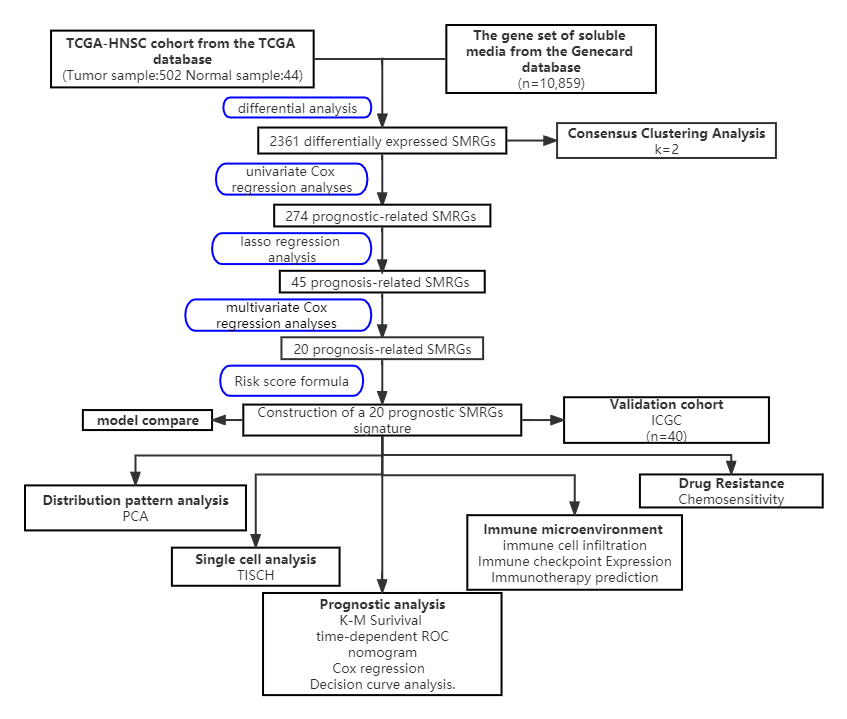 Fig. 1.
The workflow of identification of the SMRGs signature for patients with HNSCC. PCA, principal components analysis; TCGA, The Cancer Genome Atlas; SMRGs, soluble mediator-related genes; ICGC, International Cancer Genome Consortium; TISCH, Tumor Immune Single-Cell Hub; ROC, Receiver Operating Characteristic; HNSCC, Head and Neck Squamous Cell Carcinoma; K-M, Kaplan-Meier.
 Fig. 2.
Biological process analysis of soluble mediators related genes. (A) Volcano map of DE-SMRGs. (B) DE-SMRGs in HNSCC tumor samples and normal samples. (C) GO enrichment analysis DE-SMRGs. (D) KEGG pathway analysis of DE-SMRGs. DE-SMRGs, differentially expressed SMRGs; GO, Gene Ontology; KEGG, Kyoto Encyclopedia of Genes and Genomes; FC, fold change.
We categorized the TCGA-HNSC cohort into groups based on expression of DE-SMRGs using the ConsensusClusterPlus R program (Supplementary Figs. 1,2). A consensus matrix with k value equal to 2 was found to minimize crossover between HNSC samples (Fig. 3A). Survival differences between clusters were analyzed using the ClusterSurvival R package, revealing better overall survival (OS) in one cluster compared to the other (Fig. 3B). To elucidate the reasons behind these prognostic differences, we examined the levels of immune-related cells in both clusters using the MCPcounter R package, including B lineage, CD8 T cells, cytotoxic lymphocytes, endothelial cells, monocyte lineage, bone marrow dendritic cells, NK cells, and T cells. We found significantly higher infiltration of these cells in one cluster (Fig. 3C–J), suggesting a correlation between immune cell infiltration and better patient prognosis in HNSCC.
 Fig. 3.
Immunotyping of differentially expressed genes associated with soluble mediators. (A) Consensus clustering matrix for K = 2. (B) Survival curves of different immune genotypes. (C–J) The content of important immune cells among different types.
In our study, we developed a sophisticated risk score model based on SMRGs to
predict outcomes in HNSCC patients. Initially, univariate Cox analysis, executed
via the “survival” R package, identified 274 prognostic-related SMRGs (p
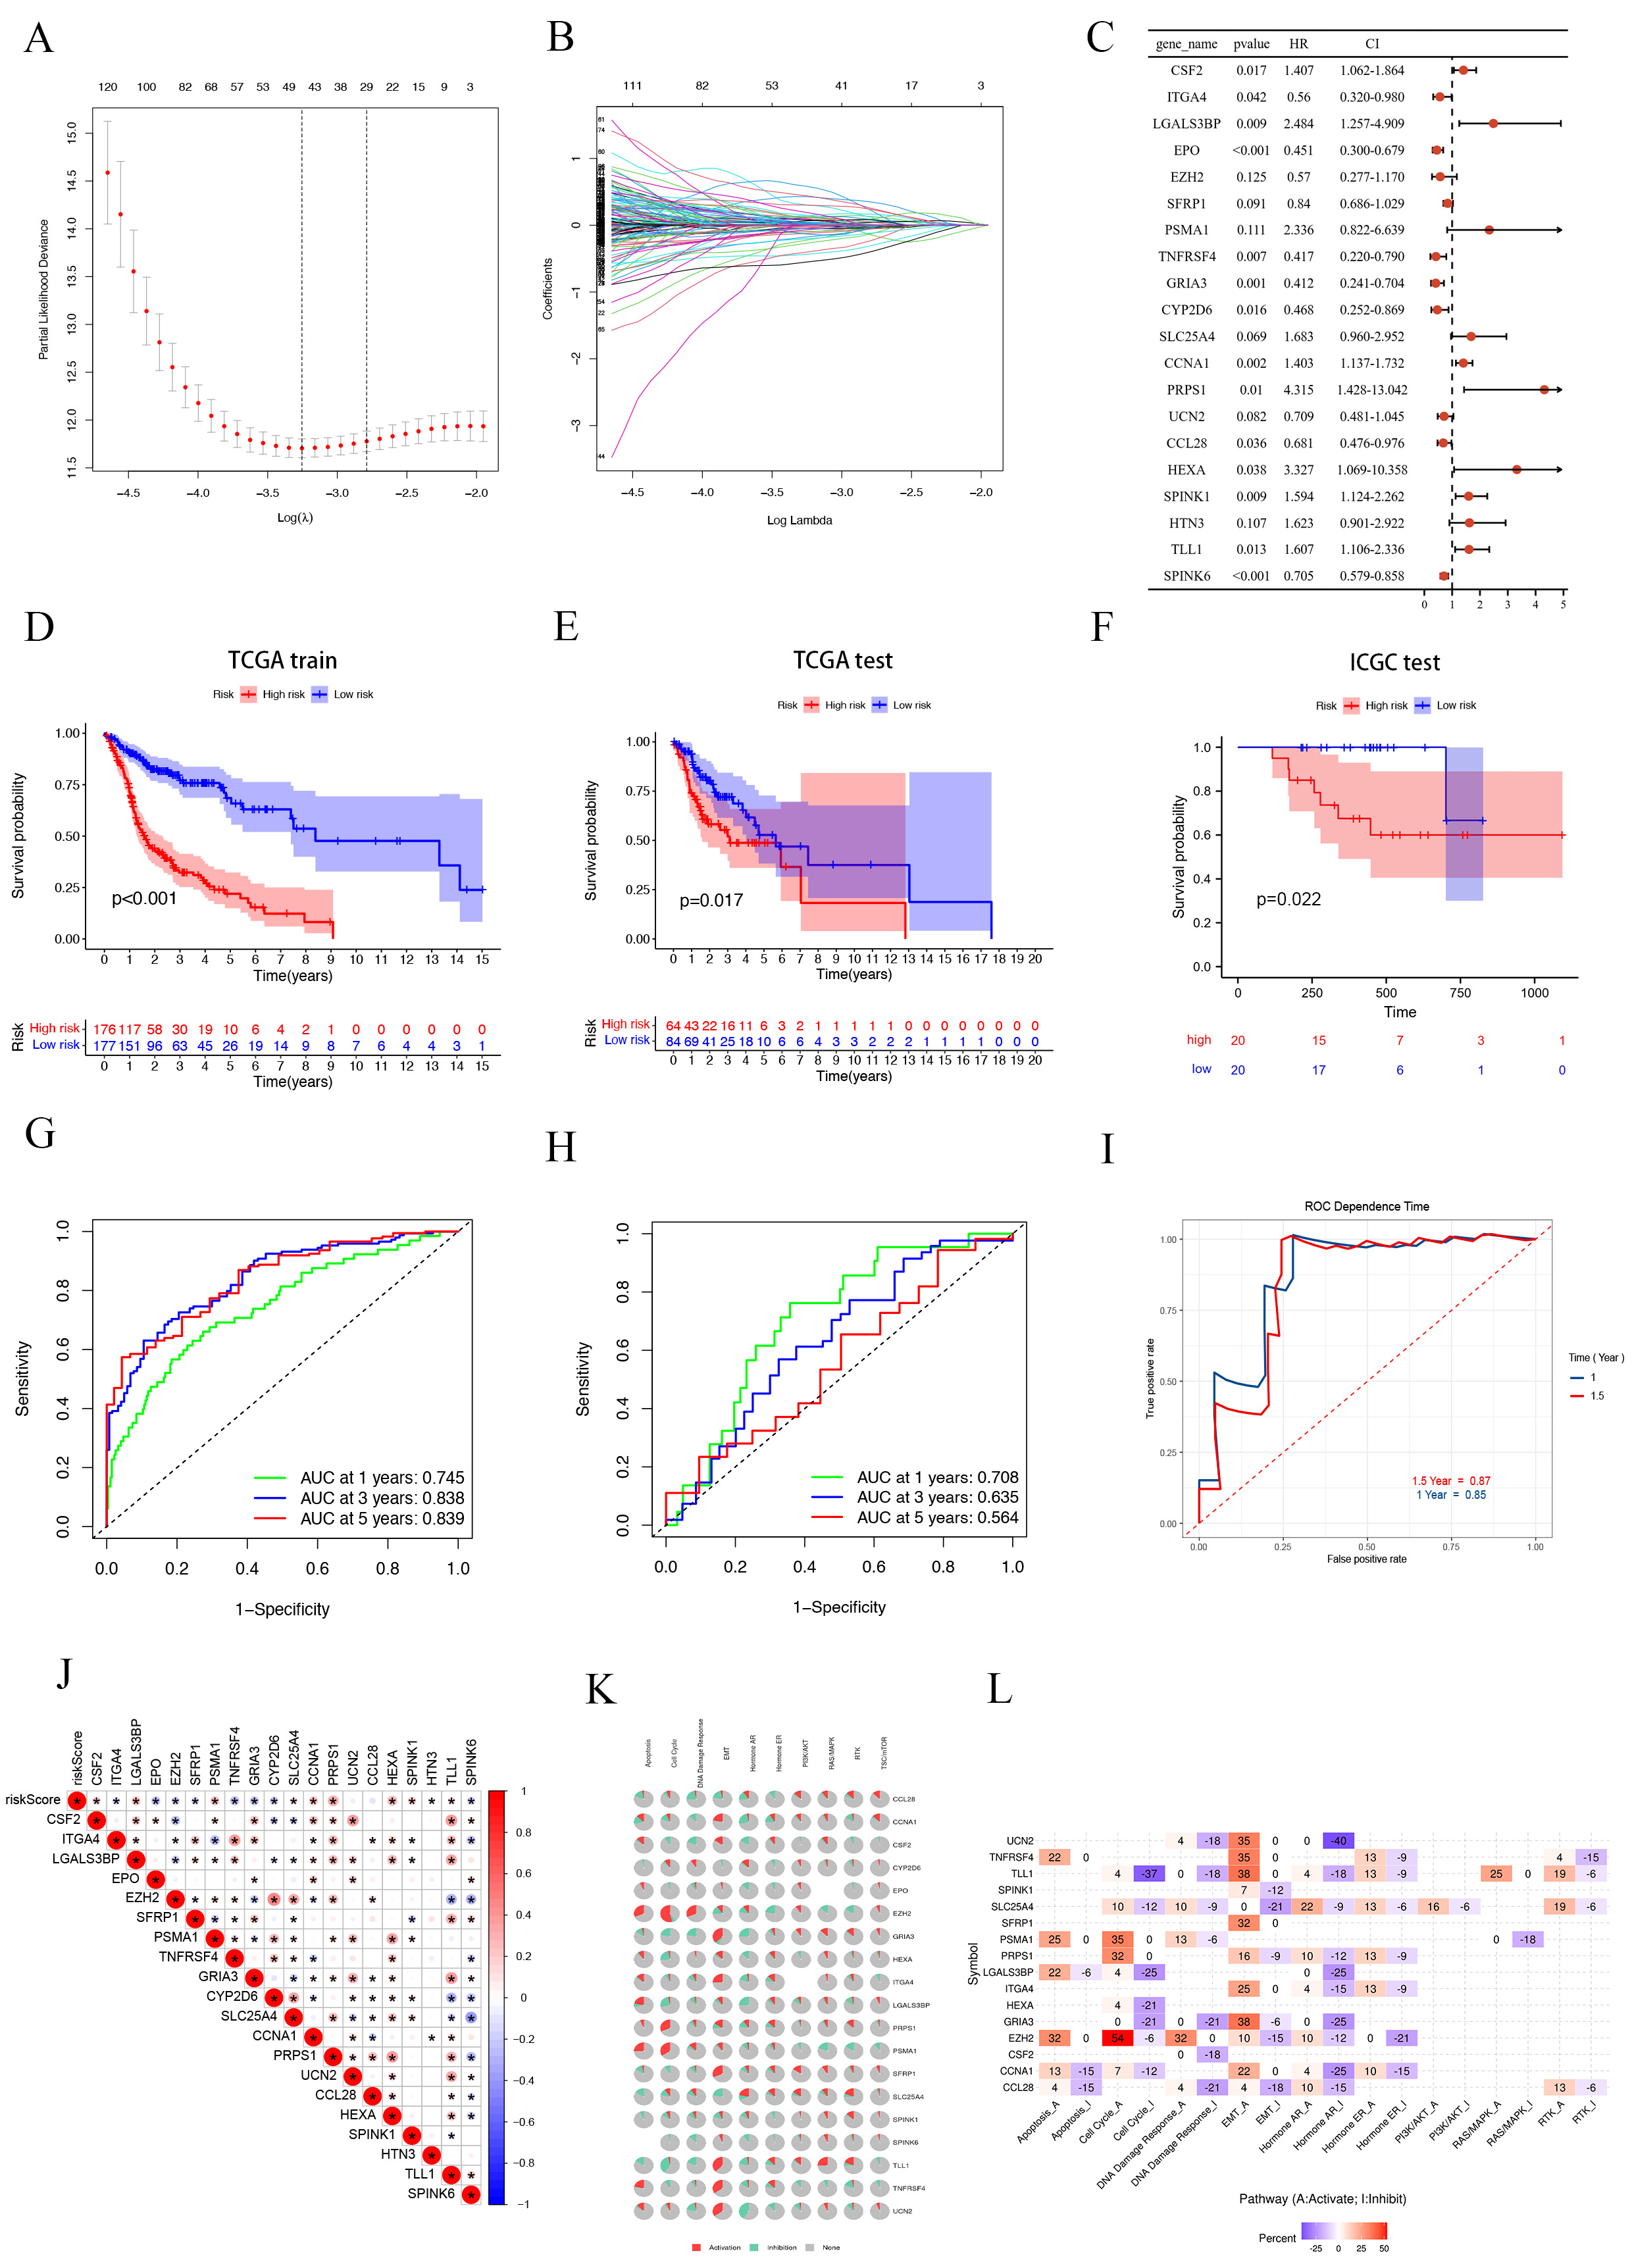 Fig. 4.
Construction and validation of SMRGs Signature and its prognostic value. (A) Ten-time cross-validation for tuning parameter selection in the LASSO model. (B) LASSO coefficient profiles. (C) Prognosis of 20 SMGs in the entire cohort of HNSC was analyzed by univariate Cox regression model. K-M survival curve of HNSC patients in the TCGA train cohort (D), TCGA test cohort (E) and ICGC test cohort (F). Time-dependent ROC curve of HSNC patients in the TCGA train cohort (G), TCGA test cohort (H) and ICGC test cohort (I). (J) Genetic correlation analysis of 20 SMGs. (K,L) Pathway analysis of 20 SMGs. SMGs, soluble mediator-related genes; HNSCC, Head and Neck Squamous Cell Carcinoma.
To ensure the robustness of our prognostic model, we divided the patients into a
training cohort (n = 353) and a testing cohort (n = 148), following a 7:3 ratio.
The training cohort results aligned with the overall findings, where HR patients
had significantly worse outcomes (p
To explore the biological mechanisms behind the aberrant expression of the 20 target genes, we conducted gene correlation analysis (Fig. 4J) and pathway analysis. The pathway analysis revealed significant involvement of these SMRGs in regulating critical processes such as apoptosis, epithelial-mesenchymal transition (EMT), DNA damage response, and the cell cycle, among other tumor-related pathways (Fig. 4K). We further classified these pathways into activated (A) and repressed (I) categories, as depicted in Fig. 4L. Notably, these genes were found to influence the activation of the PI3K/AKT pathway in HNSCC patients. Other pathways, including apoptosis, EMT, RTK, RAS/MAPK, cell cycle, Hormone ER, Hormone AR, and DNA damage response, exhibited varying degrees of activation or repression.
We undertook a detailed clinical subgroup analysis to evaluate the variations in
patient prognosis across diverse clinical parameters. This analysis was essential
to understand how different patient characteristics might influence outcomes when
assessed through the lens of our SMRGs risk model. To this end, we meticulously
stratified the HNSCC patient cohort into various subgroups. These subgroups were
based on critical clinical criteria such as T stage (T1-2 and T3-4), pathological
stage (I–III and III–IV), pathological N stage (grades N0 and N1–3), tumor
grade (grades I–II and III–IV), age (
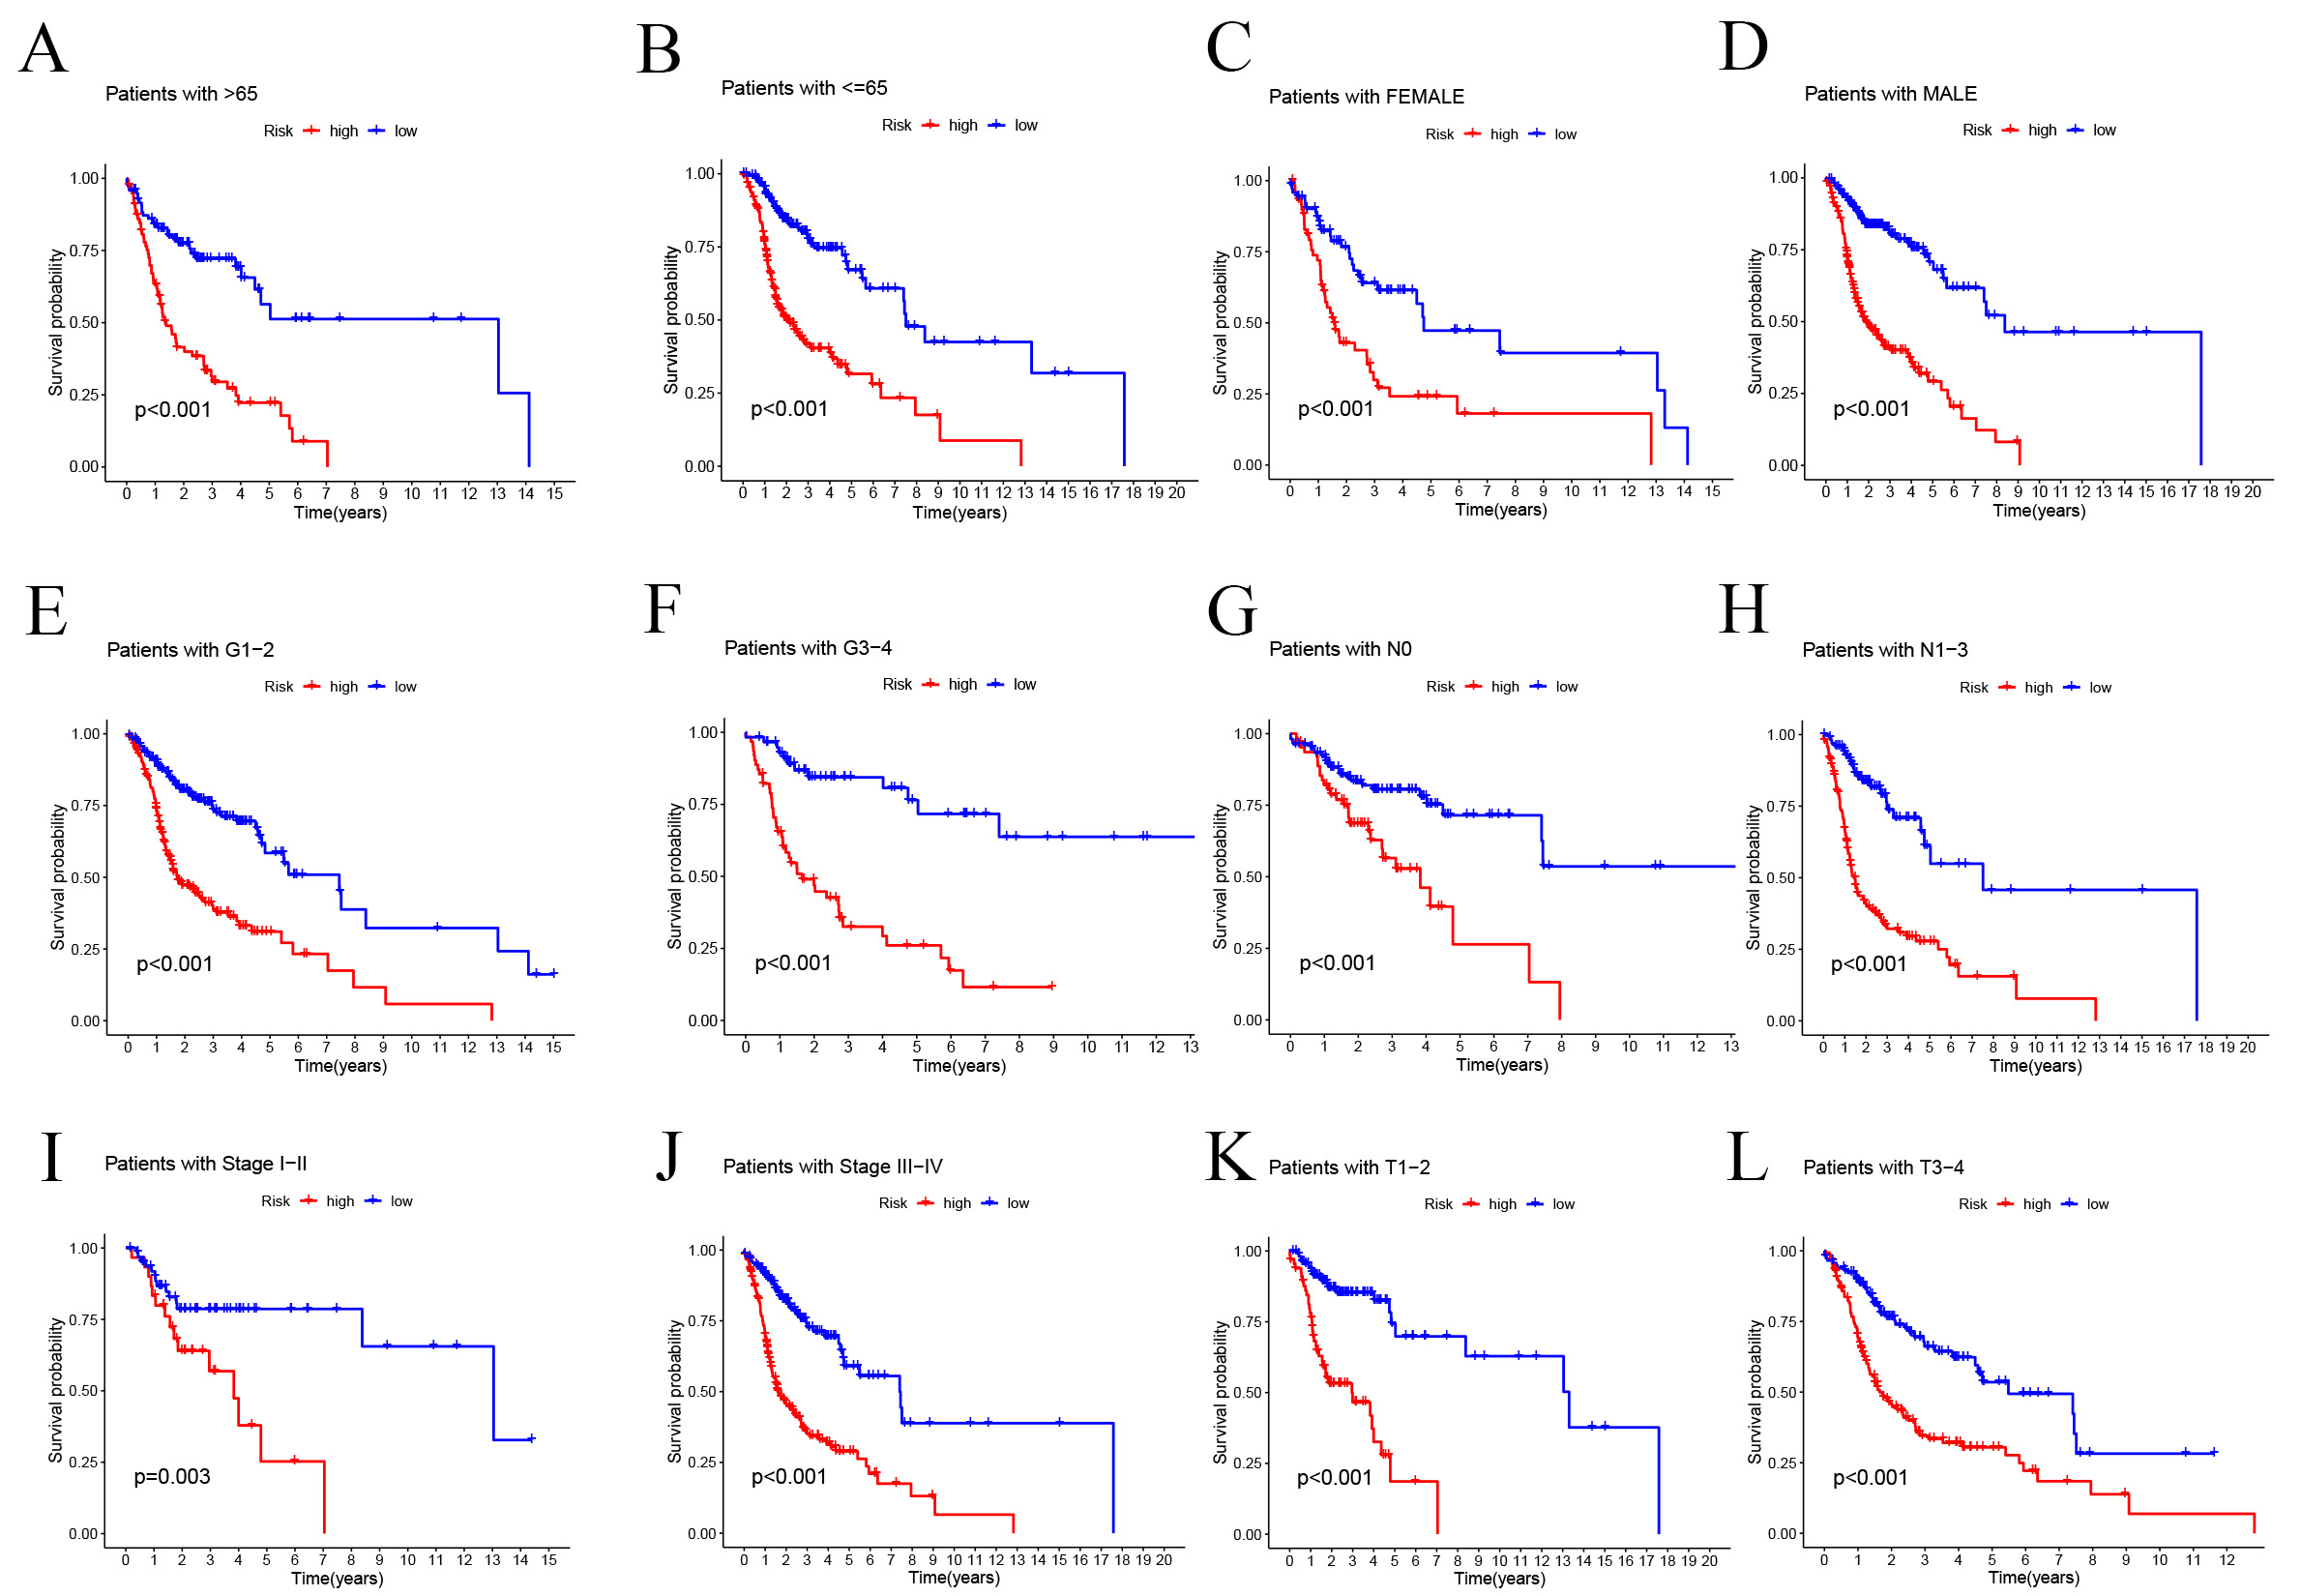 Fig. 5.
Prognostic power of the SMRGs risk model for overall survival
for multiple HNSC subtypes. (A) Age
Our in-depth study on HNSCC entailed rigorous univariate and multivariate Cox
regression analyses to evaluate the prognostic potential of our SMRGs-based
model. These analyses were crucial for determining whether our 20-SMRGs-based
prognosis signature could act as an independent prognostic factor, considering
the overall survival (OS) of HNSCC patients in conjunction with their clinical
characteristics. The univariate analysis yielded significant findings, revealing
a strong correlation between several clinical parameters—age, stage, grade, T,
N—and the risk score with patient prognosis (p
 Fig. 6.
Independent prognostic analysis of risk scores and clinical parameters. Univariate (A) and multivariate (B) COX regression analysis of the signature and different clinical features. (C) Heatmap for the 20 SMRGs-based signatures with clinicopathological manifestations. (D) Nomogram for predicting 1-year, 3-year, and 5-year OS of patients with HNSC. (E) The calibration curve of the constructed nomogram of 1-year, 3-year, and 5-year survival. (F) Multi-index ROC analysis in the test cohort. (G) Decision curve analysis. OS, overall survival; AUC, area under the curve.
We developed a novel SMRGs signature and compared its predictive power against four established HNSCC prognostic signatures: the Lian signature [51], Tang signature [52], Xue signature [53], and Huang signature [54] (Fig. 7A–D). Uniform risk scores were calculated for each HNSCC sample across all TCGA cohorts to ensure a standardized comparison. Time-dependent ROC curve analysis revealed that our SMRGs signature consistently outperformed the other signatures, exhibiting higher AUC values at 1-year, 3-year, and 5-year survival intervals. Notably, it achieved the highest C-index of 0.718 (Fig. 7E), demonstrating superior predictive performance. This underscores the potential of our SMRGs signature as a more effective prognostic tool in HNSCC, offering enhanced accuracy in predicting patient outcomes and informing personalized treatment strategies.
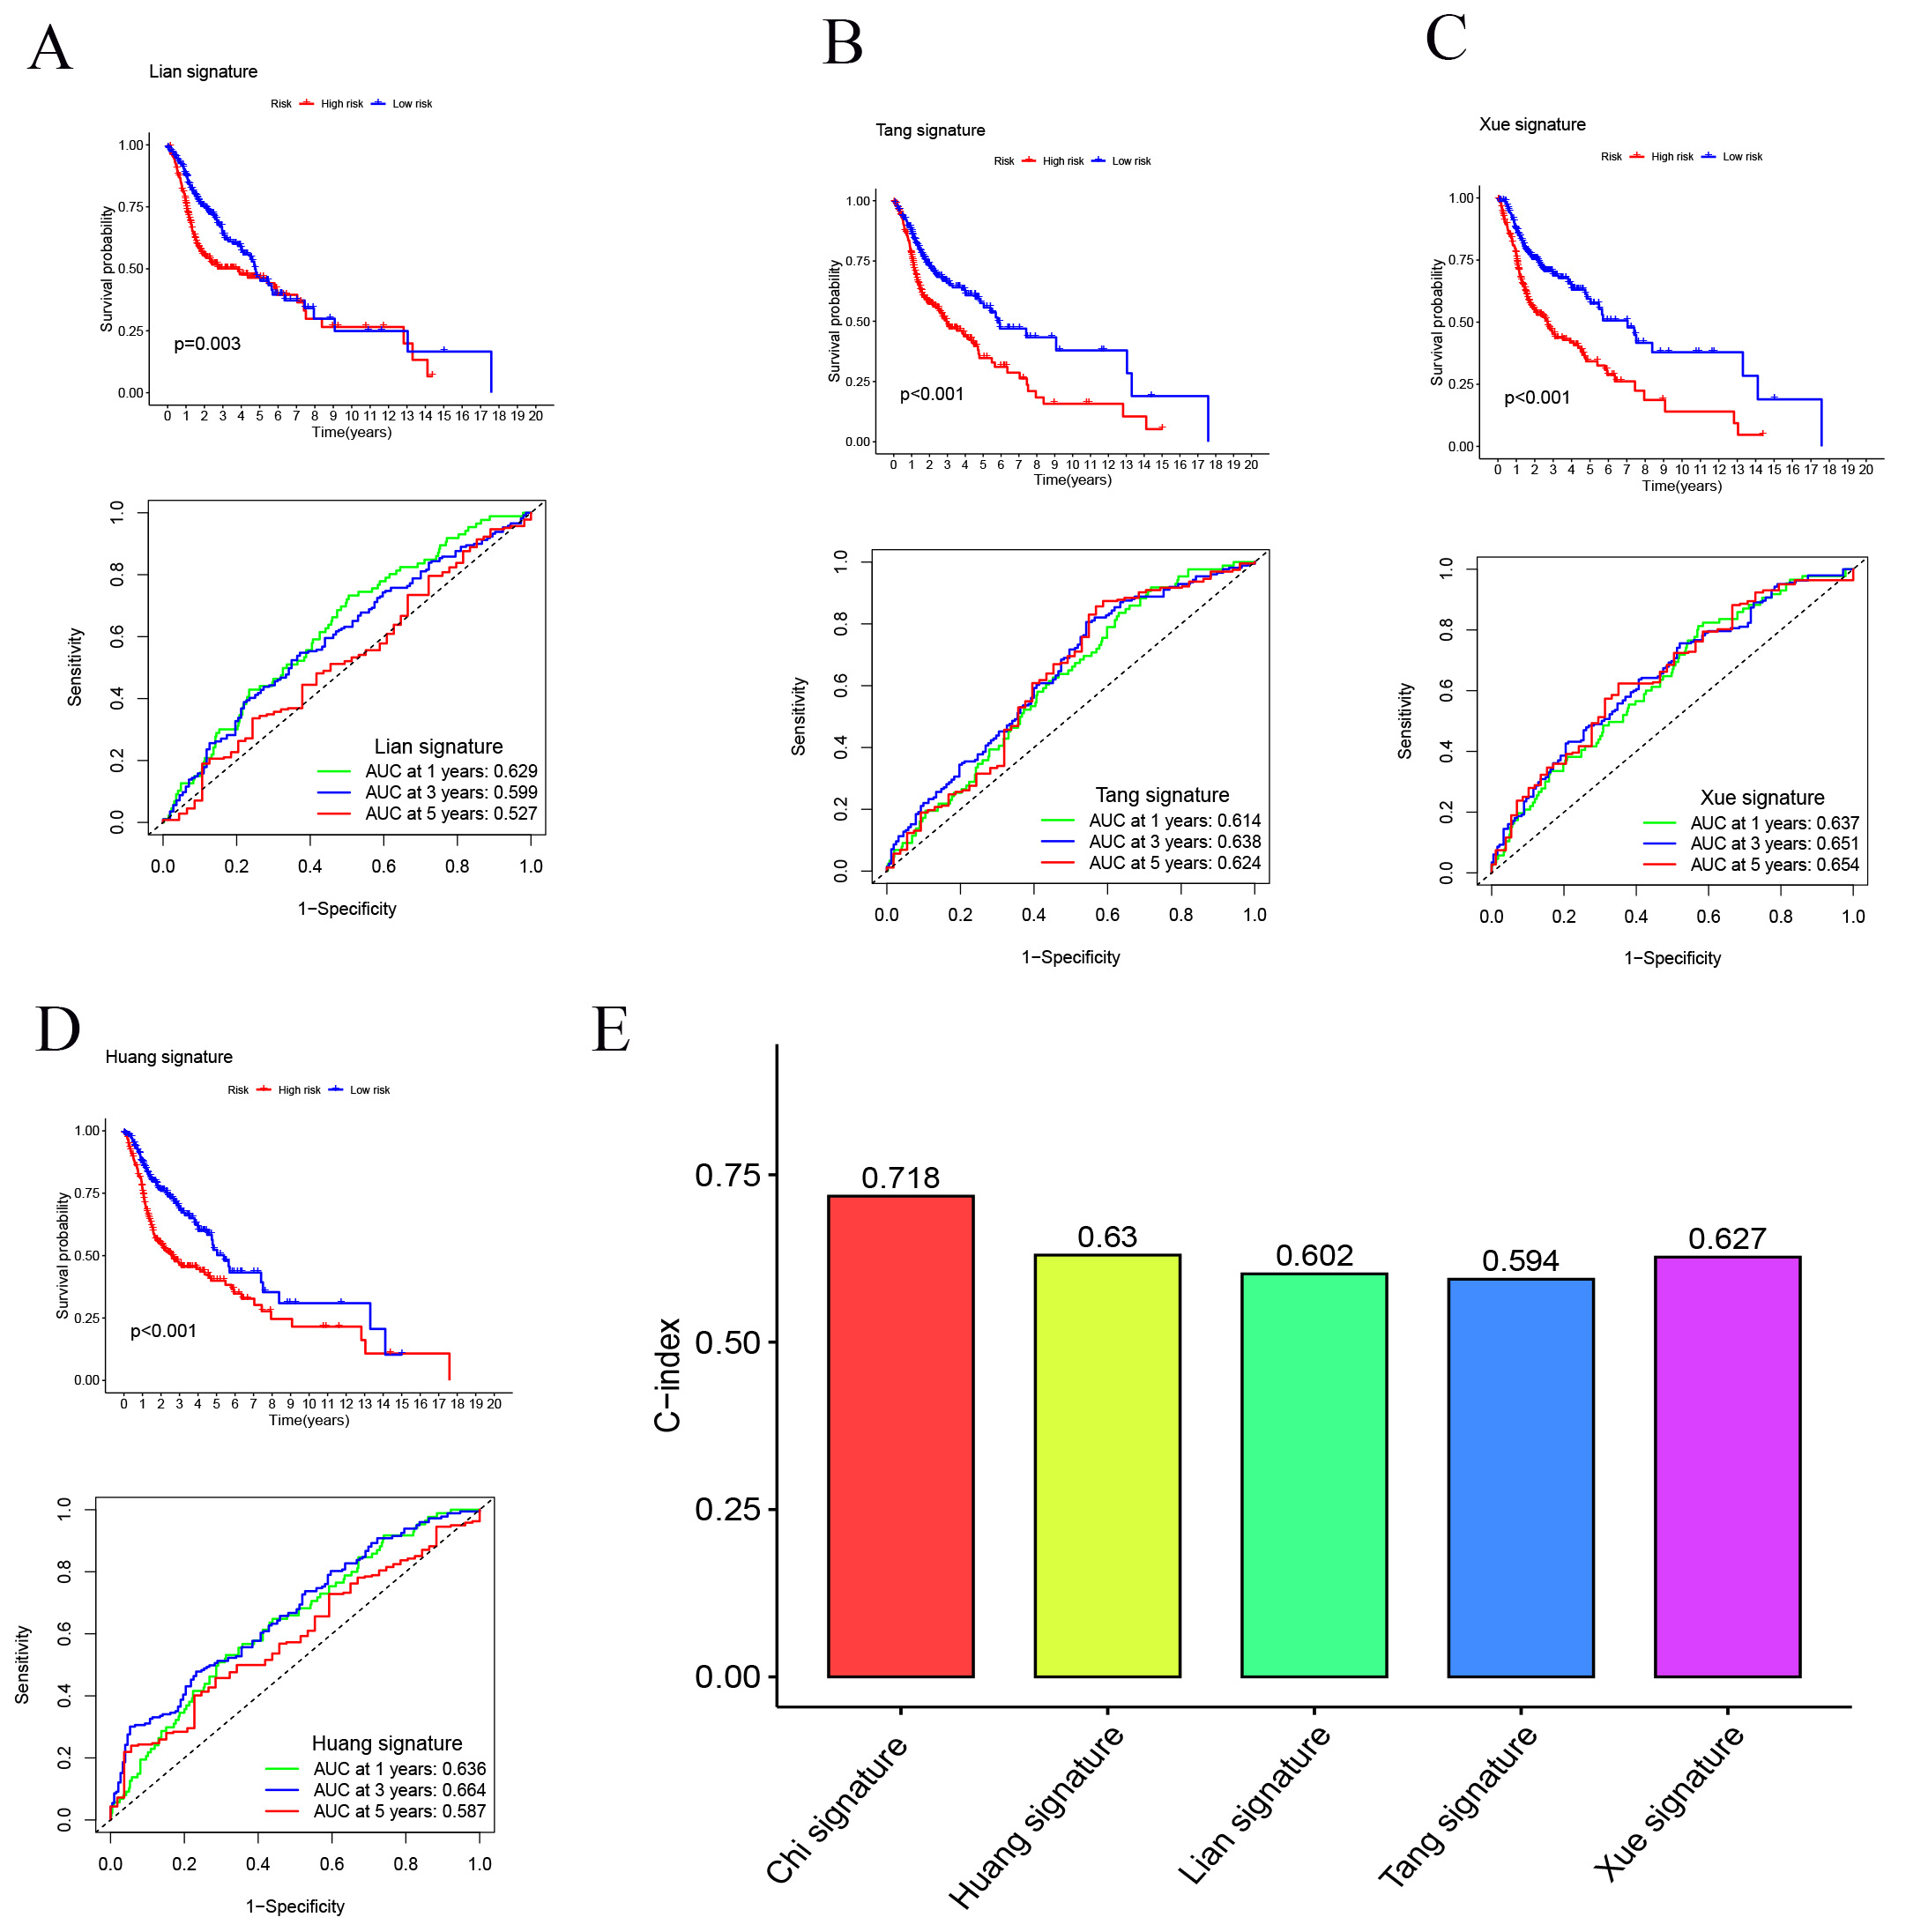 Fig. 7.
Comparison of the SMRGs signature with other models. (A–D) Kaplan-Meier (K-M) curves and ROCs for risk models constructed by others. (E) C-indexes for five risk models.
We explored the correlation between our SMRGs-based risk models and key
clinicopathological characteristics of patients. Using the Wilcoxon test, we
analyzed variations in risk scores across subgroups defined by gender, T stage,
pathological stage, tumor grade, and age. The results indicated no significant
association between risk scores and age, N stage, or gender. However, a notable
correlation was found with tumor grade (p
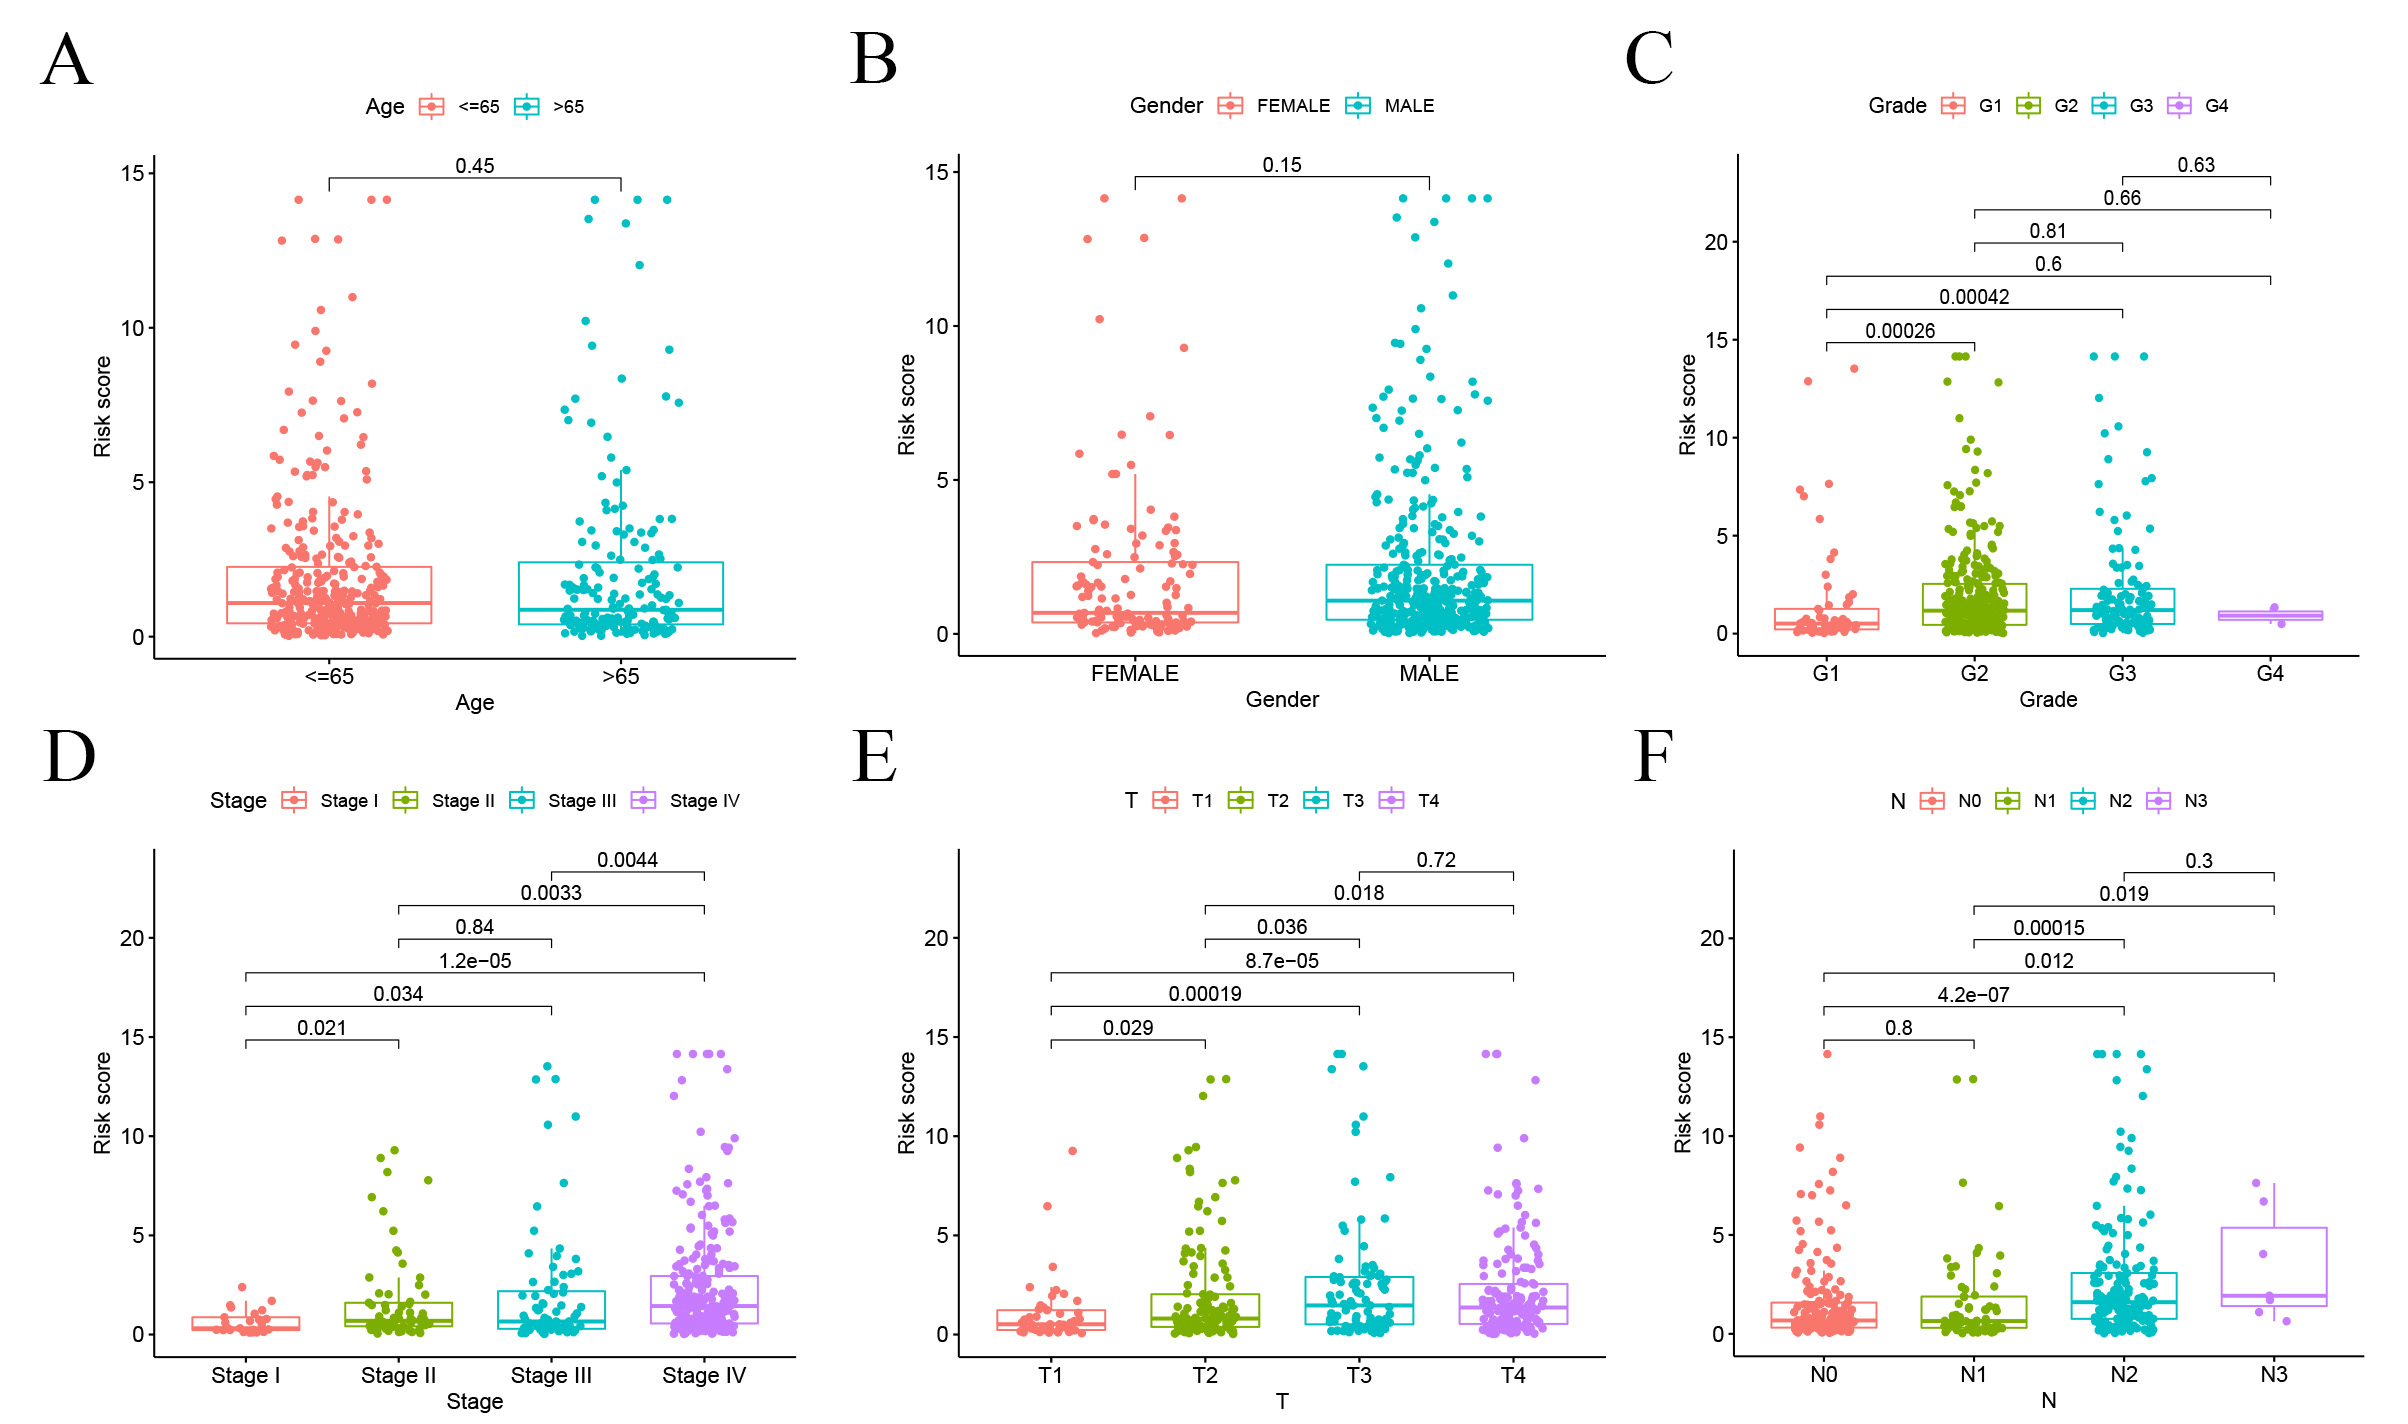 Fig. 8.
Correlation analysis of risk scores and clinicopathological characteristics. (A) Age. (B) Gender. (C) Tumor grade. (D) Stage. (E) T stage. (F) N stage.
We conducted an in-depth investigation into the relationship between the SMRGs risk score and the tumor microenvironment (TME) in HNSCC, focusing particularly on immune cell infiltration. Utilizing a comprehensive set of algorithms, including XCELL, QUANTISEQ, TIMER, MCPCOUNTER, CIBERSORT-ABS, CIBERSORT, and EPIC (Fig. 9A), we sought to understand the complex dynamics within the TME. Our findings indicated a significant inverse relationship between the SMRGs risk score and the presence of various immune cells, including myeloid dendritic cells, T cells, CD8 T cells, B lineage cells, and NK cells (Fig. 9B). Moreover, single-sample Gene Set Enrichment Analysis (ssGSEA) revealed pronounced differences in immune function between high-risk (HR) and low-risk (LR) groups (Fig. 9C). A particularly striking discovery was the differential expression of immune checkpoints between the HR and LR groups. This aspect is of critical importance in the context of checkpoint-based immunotherapy. The LR group showed heightened expression of twelve immune checkpoint genes, notably including LAIR1, IDO1, CTLA-4, PD-1, TIGIT, CD200R1, CEACAM1, CD200, KIR3DL, BTLA, and ADORA2A, with a pronounced expression of PD-1. This pattern suggests a dependency on the PD-1/PD-L1 pathway for immune evasion in LR tumor cells (Fig. 9D), implying that treatments targeting PD-1 might be particularly effective in this subgroup. The activation of these immune checkpoints, such as PD-1, is typically associated with an inflamed TME [55], suggesting an inflammatory milieu in LR patients. Complementing this, our comparison of ssGSEA scores for various immune cells and functions revealed that all immune cell types, except for macrophages, were significantly more abundant in the LR group. Additionally, nine immune functions, including HLA and CCR, scored higher in the LR group (Fig. 9E,F). This comprehensive analysis underscores not only the robustness of our SMRGs risk score in prognostic prediction for HNSCC but also its significant implications in shaping personalized immunotherapeutic strategies. The insights garnered from this study could potentially guide more effective and tailored treatments for patients with HNSCC.
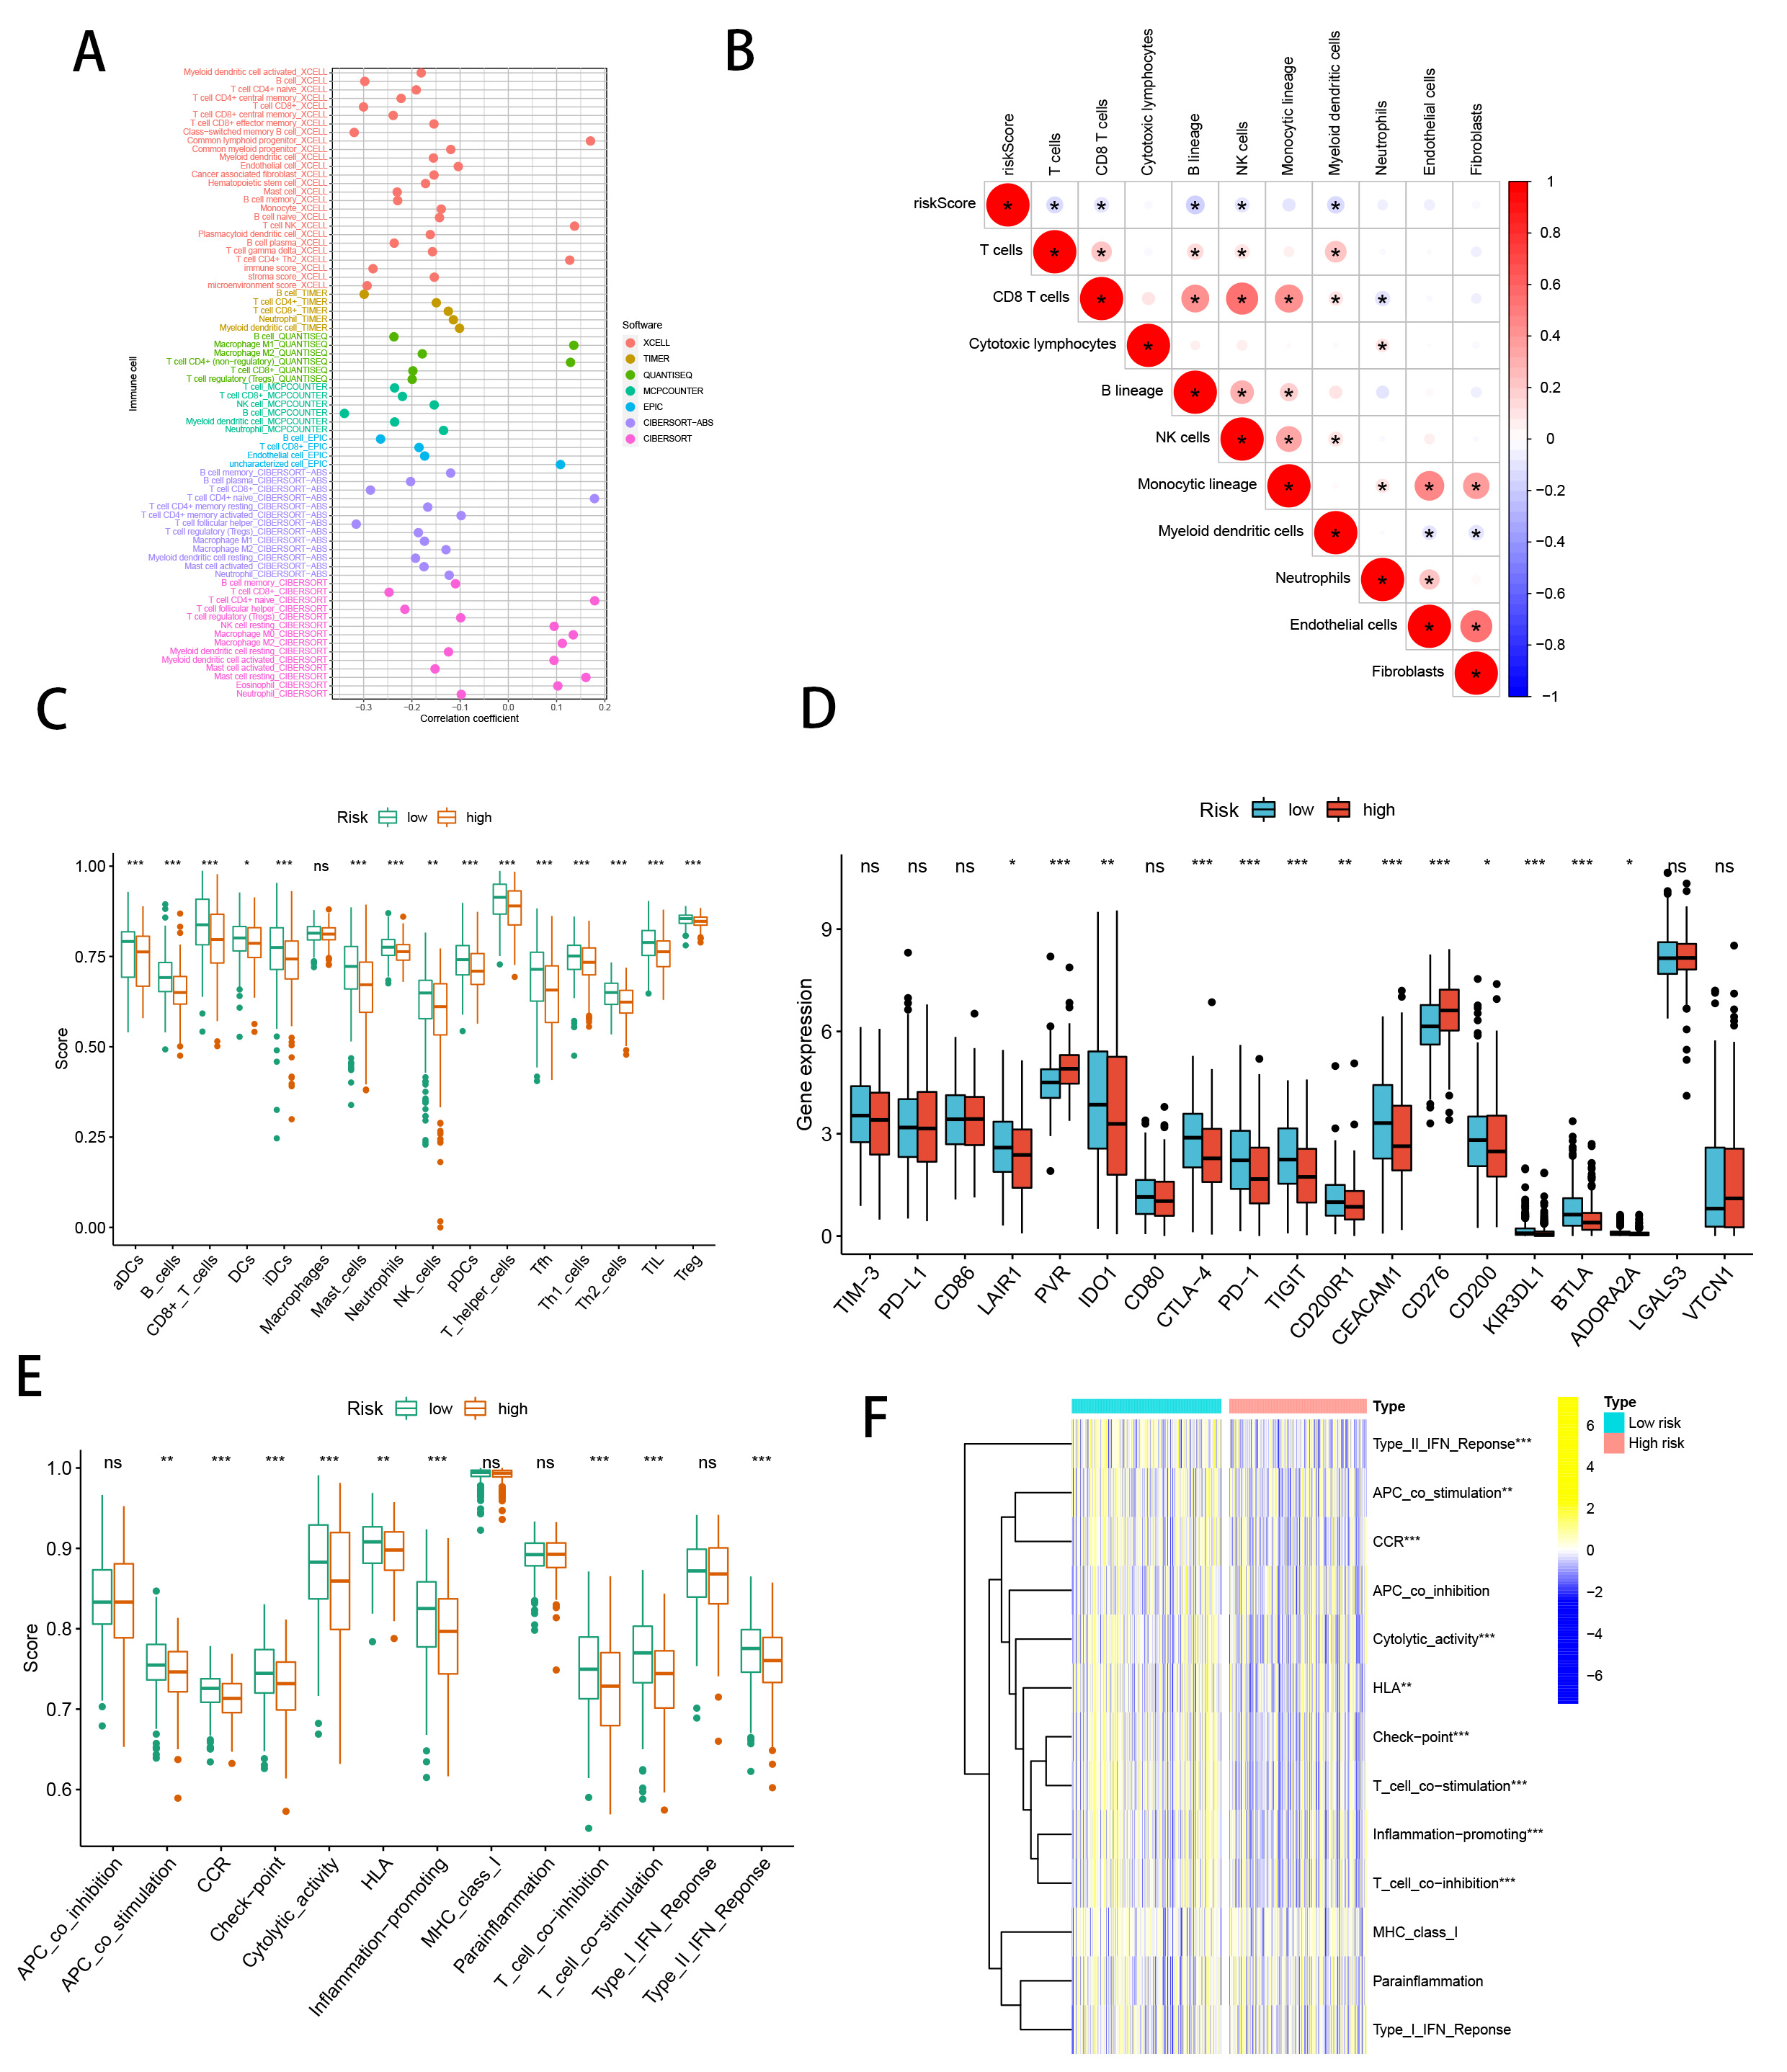 Fig. 9.
SMRGs risk score predicts tumor microenvironment and
immune cell infiltration. (A) Immune cell bubble plots. (B) The risk score and
immune cell correlation. (C) Immune cell ssGSEA scores between high and low-risk
groups. (D) Immune checkpoint differences between high and low-risk groups. (E)
Immune function ssGSEA scores between high and low-risk groups. (F) Heat map of
immune function differences between high- and low-risk groups. *p
We initiated our analysis by exploring the Immunotherapy Prediction Pathway, focusing on the comparison between high-risk (HR) and low-risk (LR) groups. We discovered significant differences in several pathways (Fig. 10A). Notably, the LR group exhibited elevated Systemic lupus erythematosus risk scores, while other pathways such as Homologous recombination, Spliceosome, Progesterone-mediated oocyte maturation, and RNA degradation presented lower risk scores compared to the HR group (Fig. 10B). This suggests a better prognosis in the LR group, potentially influenced by aberrant RNA degradation processes impacting gene expression and cancer progression [56]. Further, we utilized the tumor immune cycle as a framework to evaluate the impact of immunomodulators and chemokine systems [44, 57]. Our comparison of the HR and LR groups showed marked differences in the activities of various steps of the tumor immune cycle. Activities related to the expression of cancer cell antigen (step 2), initiation and activation (step 3), transport of immune cells to the tumor (step 4), infiltration into tumors (Step 5), recognition of cancer cells by T cells (Step 6), and the killing of cancer cells (step 7) were predominantly upregulated in the LR group. In contrast, the release of cancer cell antigens (step 1) demonstrated decreased activity (Fig. 10C). Analysis of risk scores related to these differences indicated higher scores in steps 3, 4, 5, 6, and 7 in the LR group, while other steps showed no significant variation (Fig. 10D).
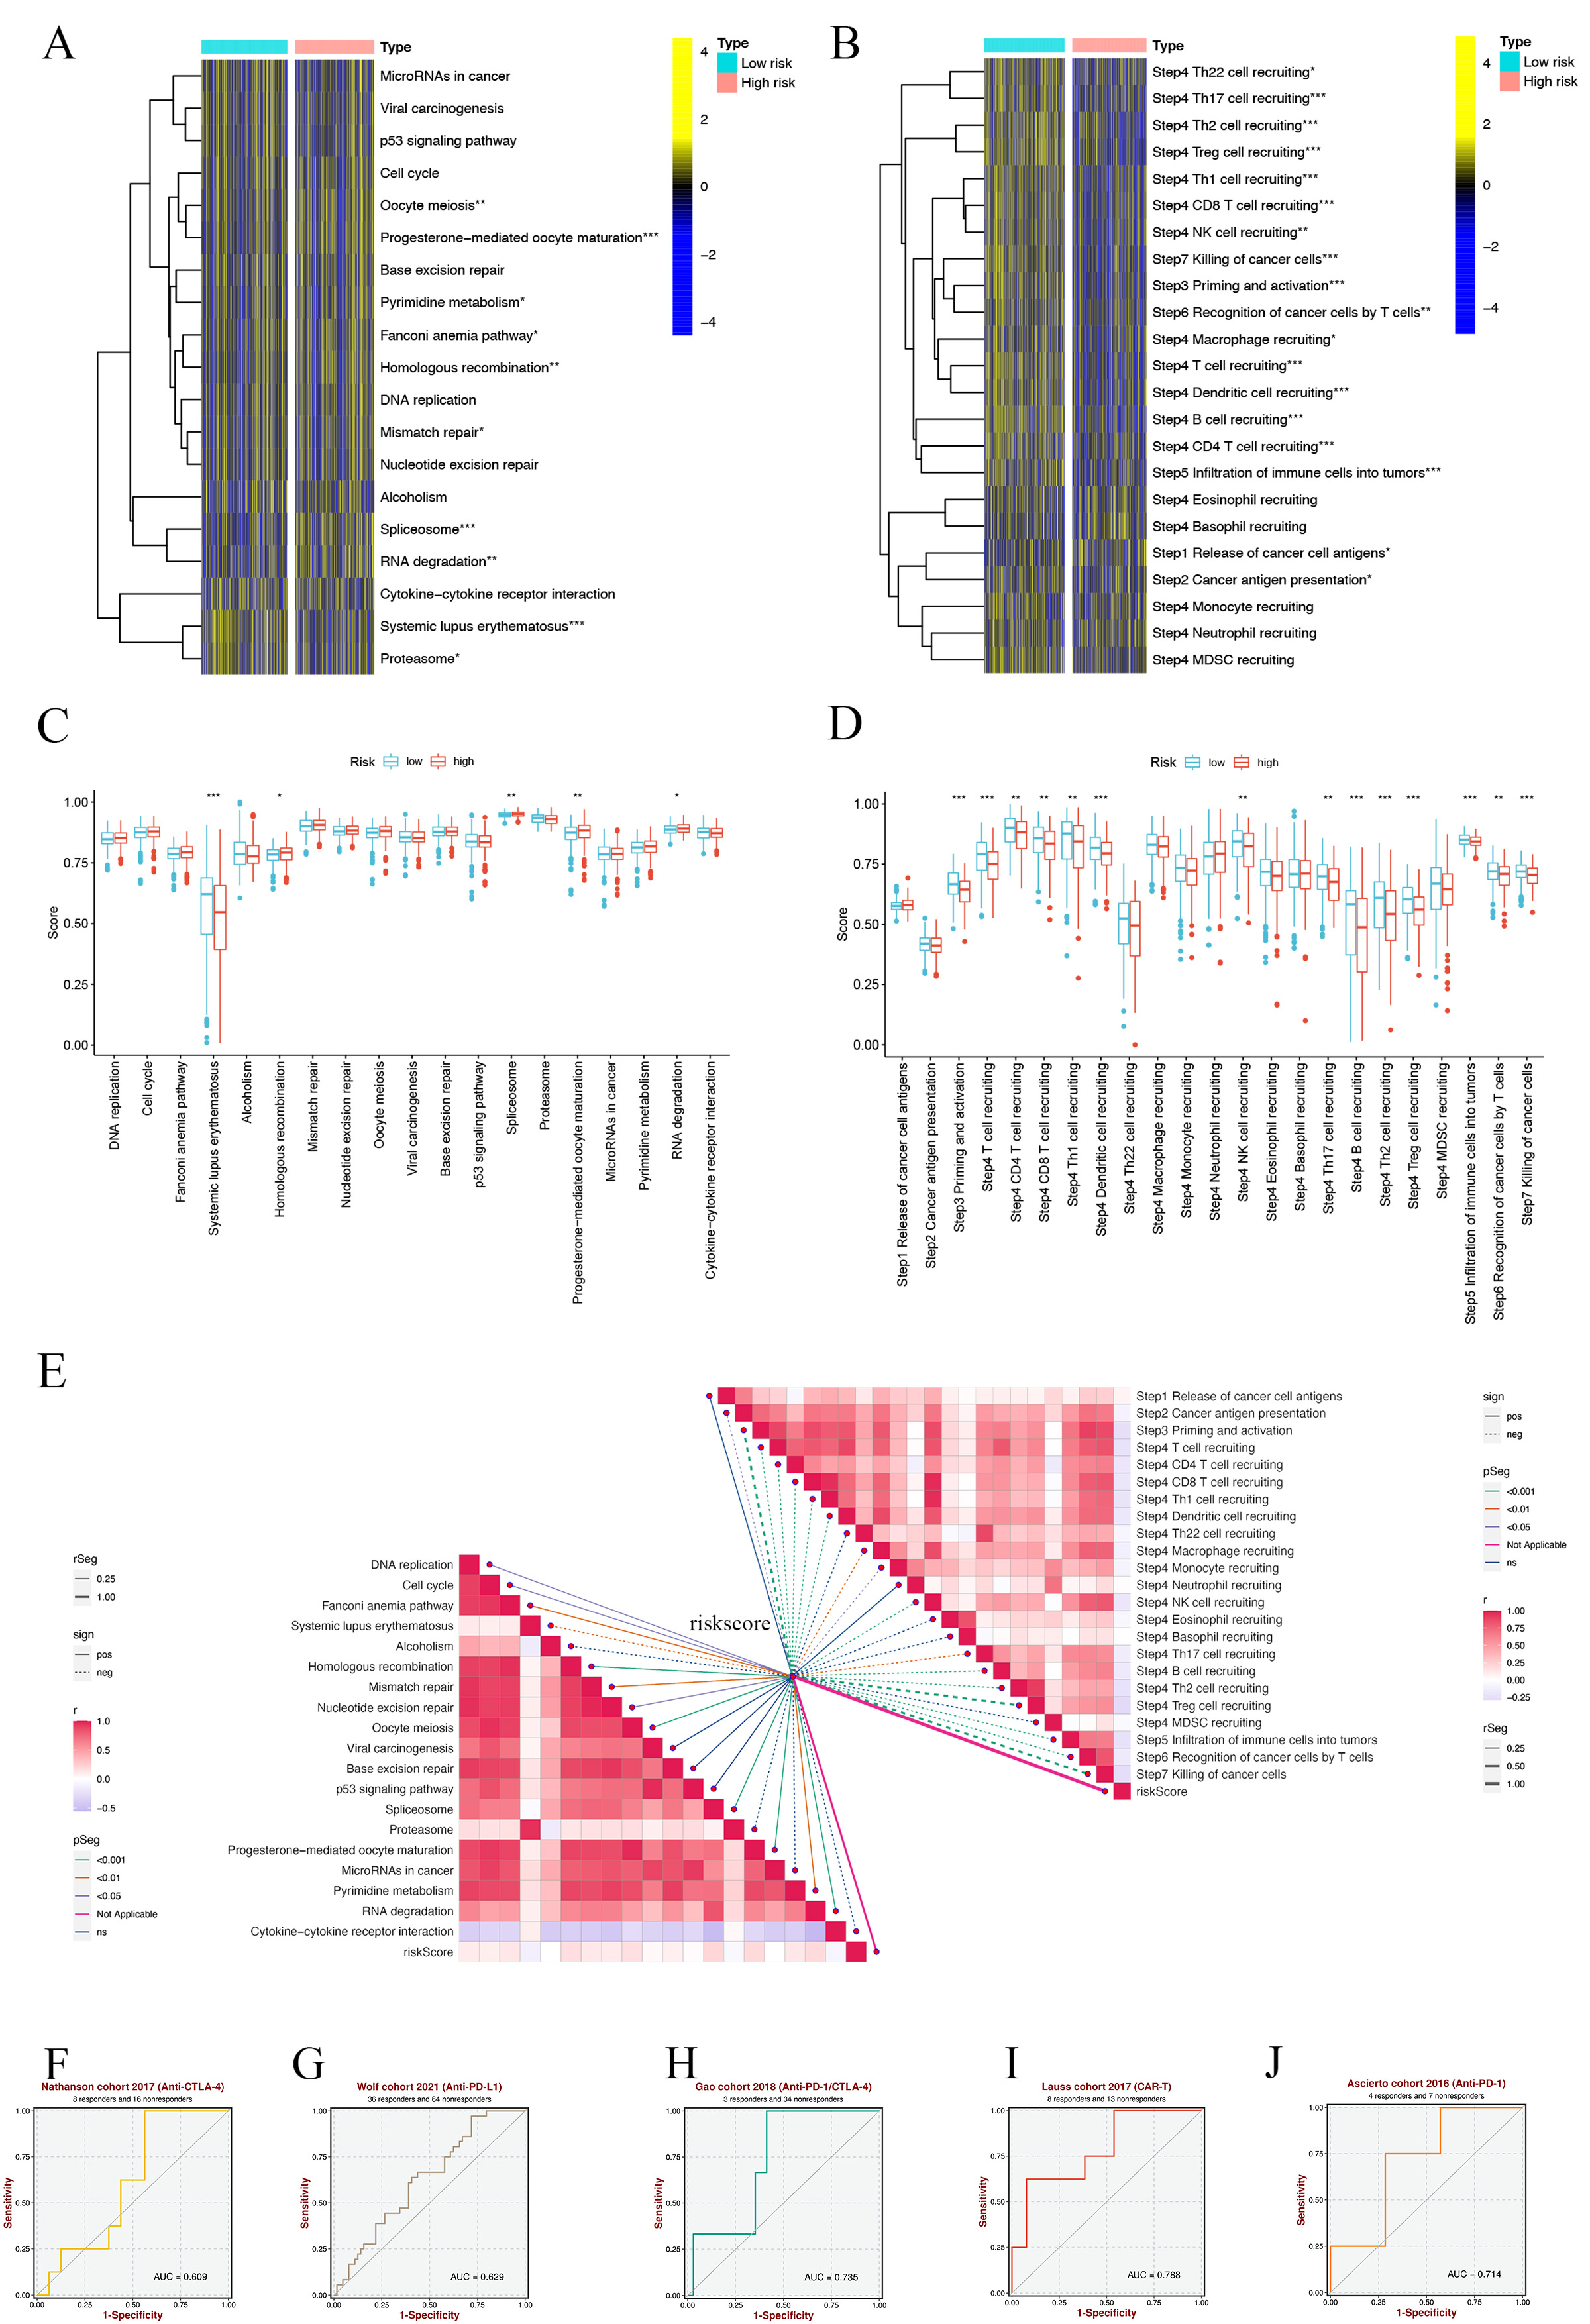 Fig. 10.
SMRGs risk scores predicting treatment response assessment.
(A) Heat map of the difference in enrichment scores between high and low-risk
groups on the immunotherapy prediction pathway. (B) Heat map of differences
between high and low-risk groups on each step of the cancer-immune cycle. (C)
Differences in risk scores of immunotherapy prediction pathway between high and
low-risk groups. (D) Differences in risk scores between high- and low-risk groups
at steps of the cancer-immune cycle. (E) Correlation of different risk scores
with the corresponding signals at the cancer-immune cycle step and ICB. (F–J)
Sensitivity analysis of SMRGs score in predicting immunotherapy response to
cancer. *p
Additionally, we explored the correlation between immune checkpoint blockade (ICB)-related signals and SMRG risk scores. This analysis revealed a negative correlation of the risk scores with pathways including DNA replication, Cell cycle, Fanconi anemia pathway, Homologous recombination, Nucleotide excision repair, Mismatch repair, Oocyte meiosis, Progesterone-mediated oocyte maturation, Spliceosome, Pyrimidine metabolism, and Systemic lupus erythematosus, while a positive correlation was observed with RNA degradation. Other pathways did not show significant correlations (Fig. 10E). Moreover, we found that SMRG risk scores were inversely related to most tumor immune processes, except for cancer cell antigen release, Th22, eosinophil, neutrophil, basophil, or MDSC cell recruitment (Fig. 10E). Finally, our analysis using the BEST database demonstrated that the SMRGs Score has high sensitivity in predicting responses to immunotherapy in cancer patients (Fig. 10F–J). This finding provides valuable insights into the potential of SMRGs as a tool for guiding immunotherapeutic strategies, underscoring the significance of our comprehensive approach in understanding and predicting HNSCC treatment outcomes.
A.770041 (p = 3.4
 Fig. 11.
Differences in IC50 of immunotherapy drugs by risk score. (A) A.770041. (B) ABT.263. (C) ABT.888. (D) AICAR. (E) AKT. inhibitor Ⅷ. (F) AS601245. (G) ATRA. (H) AZ628. (I) AZD.0530. IC50, half-maximal inhibitory concentration.
We leveraged the single-cell dataset HNSC GSE103322 from the TISCH database to
explore the expression profiles of 20 selected SMRGs in tumor microenvironment
(TME)-related cells. The dataset encompasses 20 distinct cell clusters,
representing 11 unique cell types, as detailed in Fig. 12A. Our analysis revealed
a varied expression pattern of SMRGs among different cell types. Notably, a
spectrum of immune cells, including proliferating T, myofibroblasts, CD8
 Fig. 12.
SMRGs Expression in HNSCC TME-associated cells. (A) Annotation of all cell types in GSE103322 and the percentage of each cell type. (B) Percentages and expression of 20 SMRGs in different cell types in GSE103322. TME, tumor microenvironment.
To further validate gene expression, we used immunohistochemical analysis. The results showed that LGALS3BP, EZH2, SFRP1, CCNA1 and SPRINK1 were highly expressed in HNSCC, while SLC25A4 was highly expressed in normal samples (Fig. 13).
 Fig. 13.
Immunohistochemical analysis was used to verify gene expression. (A) LGALS3BP. (B) EZH2. (C) SFRP1. (D) SLC25A4. (E) CCNA1. (F) SPRINK1. Images available from https://www.proteinatlas.org/ENSG00000108679-LGALS3BP/pathology/head+and+neck+cancer#img. Light yellow, weak positivity; brownish yellow, moderate positivity; brownish black, strong positivity
In this comprehensive study, we delve into the aggressive nature of HNSCC, a malignancy with a grim prognosis in advanced stages. Recent advancements, particularly in single-cell analyses targeting HNSC, have underscored the pivotal role of the tumor microenvironment (TME) in tumorigenesis [58, 59]. Various cell populations within the TME secrete a plethora of soluble mediators, including chemokines, that sculpt the TME dynamics [60, 61, 62, 63]. Furthermore, the burgeoning field of immunotherapy has shifted focus towards immune checkpoints, encompassing early diagnosis, combination therapies, and prediction of patient responses to treatment [64, 65, 66], with soluble immune checkpoint markers emerging as predictive indicators for response to immune checkpoint blockade (ICB) therapy [67].
Soluble mediators, including chemokines, Hsp70 family proteins, soluble sugars, lymphokines, and others, predominantly enter the extracellular compartment via exosomal vesicles [68, 69, 70, 71, 72, 73, 74]. Their extensive involvement in tumor progression and impact on patient prognosis is evident yet underexplored [75, 76, 77, 78]. Our investigation focused on differentially expressed genes (DEGs) of soluble mediators in HNSCC, revealing their concentration in areas related to stromal tissue, humoral immune response, T cell activation, and regulation of lymphocyte activity. This indicates a strong immunological function association of these genes. Cluster analysis based on DE-SMRG highlighted significant immune infiltration and survival differences among groups. Notably, prognostic clusters exhibited substantial infiltration of NK and CD8 T cells, key players in combating HNSC [79, 80, 81, 82]. Previous studies have shown that CD8 T cell activation enhances radiotherapy efficacy in HNSC [83] and boosts NK and T cell effector functions [79, 84, 85]. Meta-analysis further supports the association of the NK cell ligand Fas with improved HNSC patient survival [86].
Our study constructs a multi-gene signature based on soluble mediator-related genes, proving effective in prognostic assessment for HNSC patients. Risk scores were calculated for each patient, categorizing them into high-risk (HR) and low-risk (LR) groups based on the expression levels of this signature. A nomogram incorporating clinicopathological criteria was developed, with decision curve analysis (DCA) demonstrating its clinical utility over single-factor models. This tool enables clinicians to tailor HNSC treatment strategies based on individual patient profiles.
Investigating immune infiltration levels across different risk groups, we found that the LR group showed higher levels of immune cell infiltration, suggesting our model’s efficacy in distinguishing ‘cold’ and ‘hot’ tumor subtypes in HNSC, with ‘hot’ subtypes indicating a more favorable prognosis. Given the potential of immune checkpoint inhibitors (ICIs) in HNSC treatment, particularly as primary treatments in advanced stages [87], the findings are significant. For instance, CD276 is highly expressed in CSCs in human HNSC, with elevated levels in the HR group correlating with reduced immune infiltration and immune evasion [88]. This underscores the need for combination immunotherapies in the HR group [89]. Targeting immune checkpoints like IDO1, PD-1, CEACAM1, and TIGIT, which show raised expression in the LR group, could benefit patients in this subset [90, 91, 92]. This hypothesis gains further credibility from immunotherapy response assessments across two risk subtypes using data from the BEST database.
The TME’s complexity is evident from its diverse cell populations, including
platelets, immune cells, and cancer-associated fibroblasts, all interconnected
through soluble mediators [58, 93, 94, 95, 96]. Single-cell data analysis has enhanced our
understanding of the distribution of soluble mediators across these cells. We
observed significant enrichment of LGALS3BP, PSMA1, HEXA, and PRPS1 in various
immune cells, including proliferating T, CD4
The granularity and spatial heterogeneity inherent in single-cell analyses have significantly enhanced our understanding of soluble mediators’ roles in HNSCC. By focusing on these finer details, our study elucidates how soluble mediator-related gene (SMRG) expression impacts HNSCC prognosis and progression. The strength of our findings primarily lies in the predictive accuracy of the SMRG risk score and the derived nomogram. However, it’s important to note that the current study’s dataset is limited in size, necessitating future calibration of the prediction model with larger datasets for robustness. Moreover, the assessment of the signature’s efficacy in predicting immunotherapy responses was conducted indirectly, due to the absence of mRNA expression profile data from HNSCC patients undergoing such treatments. This approach, while necessary, may not fully represent real-world scenarios. Consequently, future research should integrate data from HNSCC patients who have received immunotherapy to validate and refine our findings.
In clinical practice, the developed nomogram offers a valuable tool for physicians, enabling the creation of personalized treatment plans for HNSCC patients. The predictive accuracy of our multi-gene model in determining patient survival underscores its potential in guiding precision medicine. Going forward, in-depth research into the molecular mechanisms underlying the actions of these therapeutically relevant soluble mediators, coupled with prospective randomized clinical trials, will be pivotal in advancing patient-specific therapeutic strategies and improving outcomes in HNSCC.
Acknowledging the limitations of our research is crucial for advancing our understanding and application of the findings in clinical settings. Primarily, our study’s reliance on the TCGA dataset, while extensive, encounters constraints due to the inherent biases and data limitations of available mRNA information. Our efforts to validate the findings with external datasets are commendable, yet they fall short of capturing a comprehensive real-world scenario. To bolster the credibility and applicability of our prognostic model, future validations must integrate a broader spectrum of real-world data. Secondly, the inclusion of 20 SMRGs as independent prognostic variables for HNSCC was intended to enhance the model’s specificity and accuracy. Nevertheless, this approach might impose a financial burden on patients due to the costs associated with comprehensive gene profiling. Addressing this concern is imperative to not only enhance the model’s practicality but also to ensure its equitable application across diverse patient populations. As we progress in our research, refining our methodologies to overcome these challenges will be vital for improving the clinical utility and relevance of our findings in the treatment of HNSCC.
In conclusion, our study represents a systematic exploration of SMRGs in the context of HNSCC. We have successfully developed a prognostic signature comprising 20 SMRGs. This signature stands out for its ability to accurately evaluate the prognosis and immune status of HNSCC patients. Crucially, it equips clinicians with a powerful tool to identify specific patient subgroups who are likely to respond favorably to immunotherapy and chemotherapy. The application of this signature in clinical settings promises to enhance the personalization of treatment strategies, tailoring them to the unique molecular and immunological landscapes of individual HNSCC cases.
The datasets in this study were obtained from the TCGA database (http://cancergenome.nih.gov/), and ICGC database (https://dcc.icgc.org).
HC, QW, KX, and GY conceived the study. HC, GP, GS, JinZ, XX, JY, JX and JieZ drafted the manuscript. HC, XX, JY, JieZ and JX performed the literature search and collected the data. HC, GP, GS and JinZ analyzed and visualized the data. QW and GY revised the manuscript and was a supporter of the study. All authors contributed to editorial changes in the manuscript. All authors read and approved the final manuscript. All authors have participated sufficiently in the work and agreed to be accountable for all aspects of the work.
This study adhered to public database guidelines and data access policies, and approval by the local ethics committees was not required.
Not applicable.
This study was supported by grants from the Science and Technology Development Fund, Macau SAR (No.: 0098/2021/A2 and 0048/2023/AFJ), Macau University of Science and Technology’s Faculty Research Grant (No: FRG-23-003-FC).
The authors declare no conflict of interest.
Publisher’s Note: IMR Press stays neutral with regard to jurisdictional claims in published maps and institutional affiliations.