


1 School of Basic Medical Sciences, Jiangsu Vocational College of Medicine, 224005 Yancheng, Jiangsu, China
2 Department of General Surgery, Research Unit of General Surgery, Beijing Yanging Hospital of Traditional Chinese Medicine, 102100 Beijing, China
†These authors contributed equally.
Abstract
Background: Triple-negative breast cancer (TNBC) is the most aggressive
subtype of breast cancer (BC). TNBC has a poor prognosis due to high intratumoral
heterogeneity and metastasis, pointing to the need to explore distinct molecular
subtypes and gene regulatory networks. Methods: The scRNA-seq data of
five primary BC samples were downloaded from the Gene Expression Omnibus (GEO)
database. Clustering was performed based on filtered and normalized data using
the Seurat R package to identify marker genes, which were subsequently annotated
to each subset using the CellMarker database. AUCell R package was applied to
calculate the hallmark score for each epithelial cell. Marker genes of each
subset were screened with FindAllMarkers and their biological functions were
analyzed using the Database for Annotation Visualization and Integrated Discovery (DAVID) database. Next, cell–cell communication was performed
with the CellChat R package. To identify the key regulatory genes, single-cell
regulatory network inference and clustering (SCENIC) analysis was conducted.
Finally, the expression and potential biological functions of the key regulatory
factors were verified through cellular experiments. Results: A total of
29,101 cells were classified into nine cell subsets, namely, Fibroblasts,
Fibroepithelial cells, Epithelial cells 1, Epithelial cells 2, Epithelial cells
3, Endothelial cells, T cells, Plasma B cells and Macrophages. Particularly, the
epithelial cells had a higher proportion and higher transforming growth
factor-
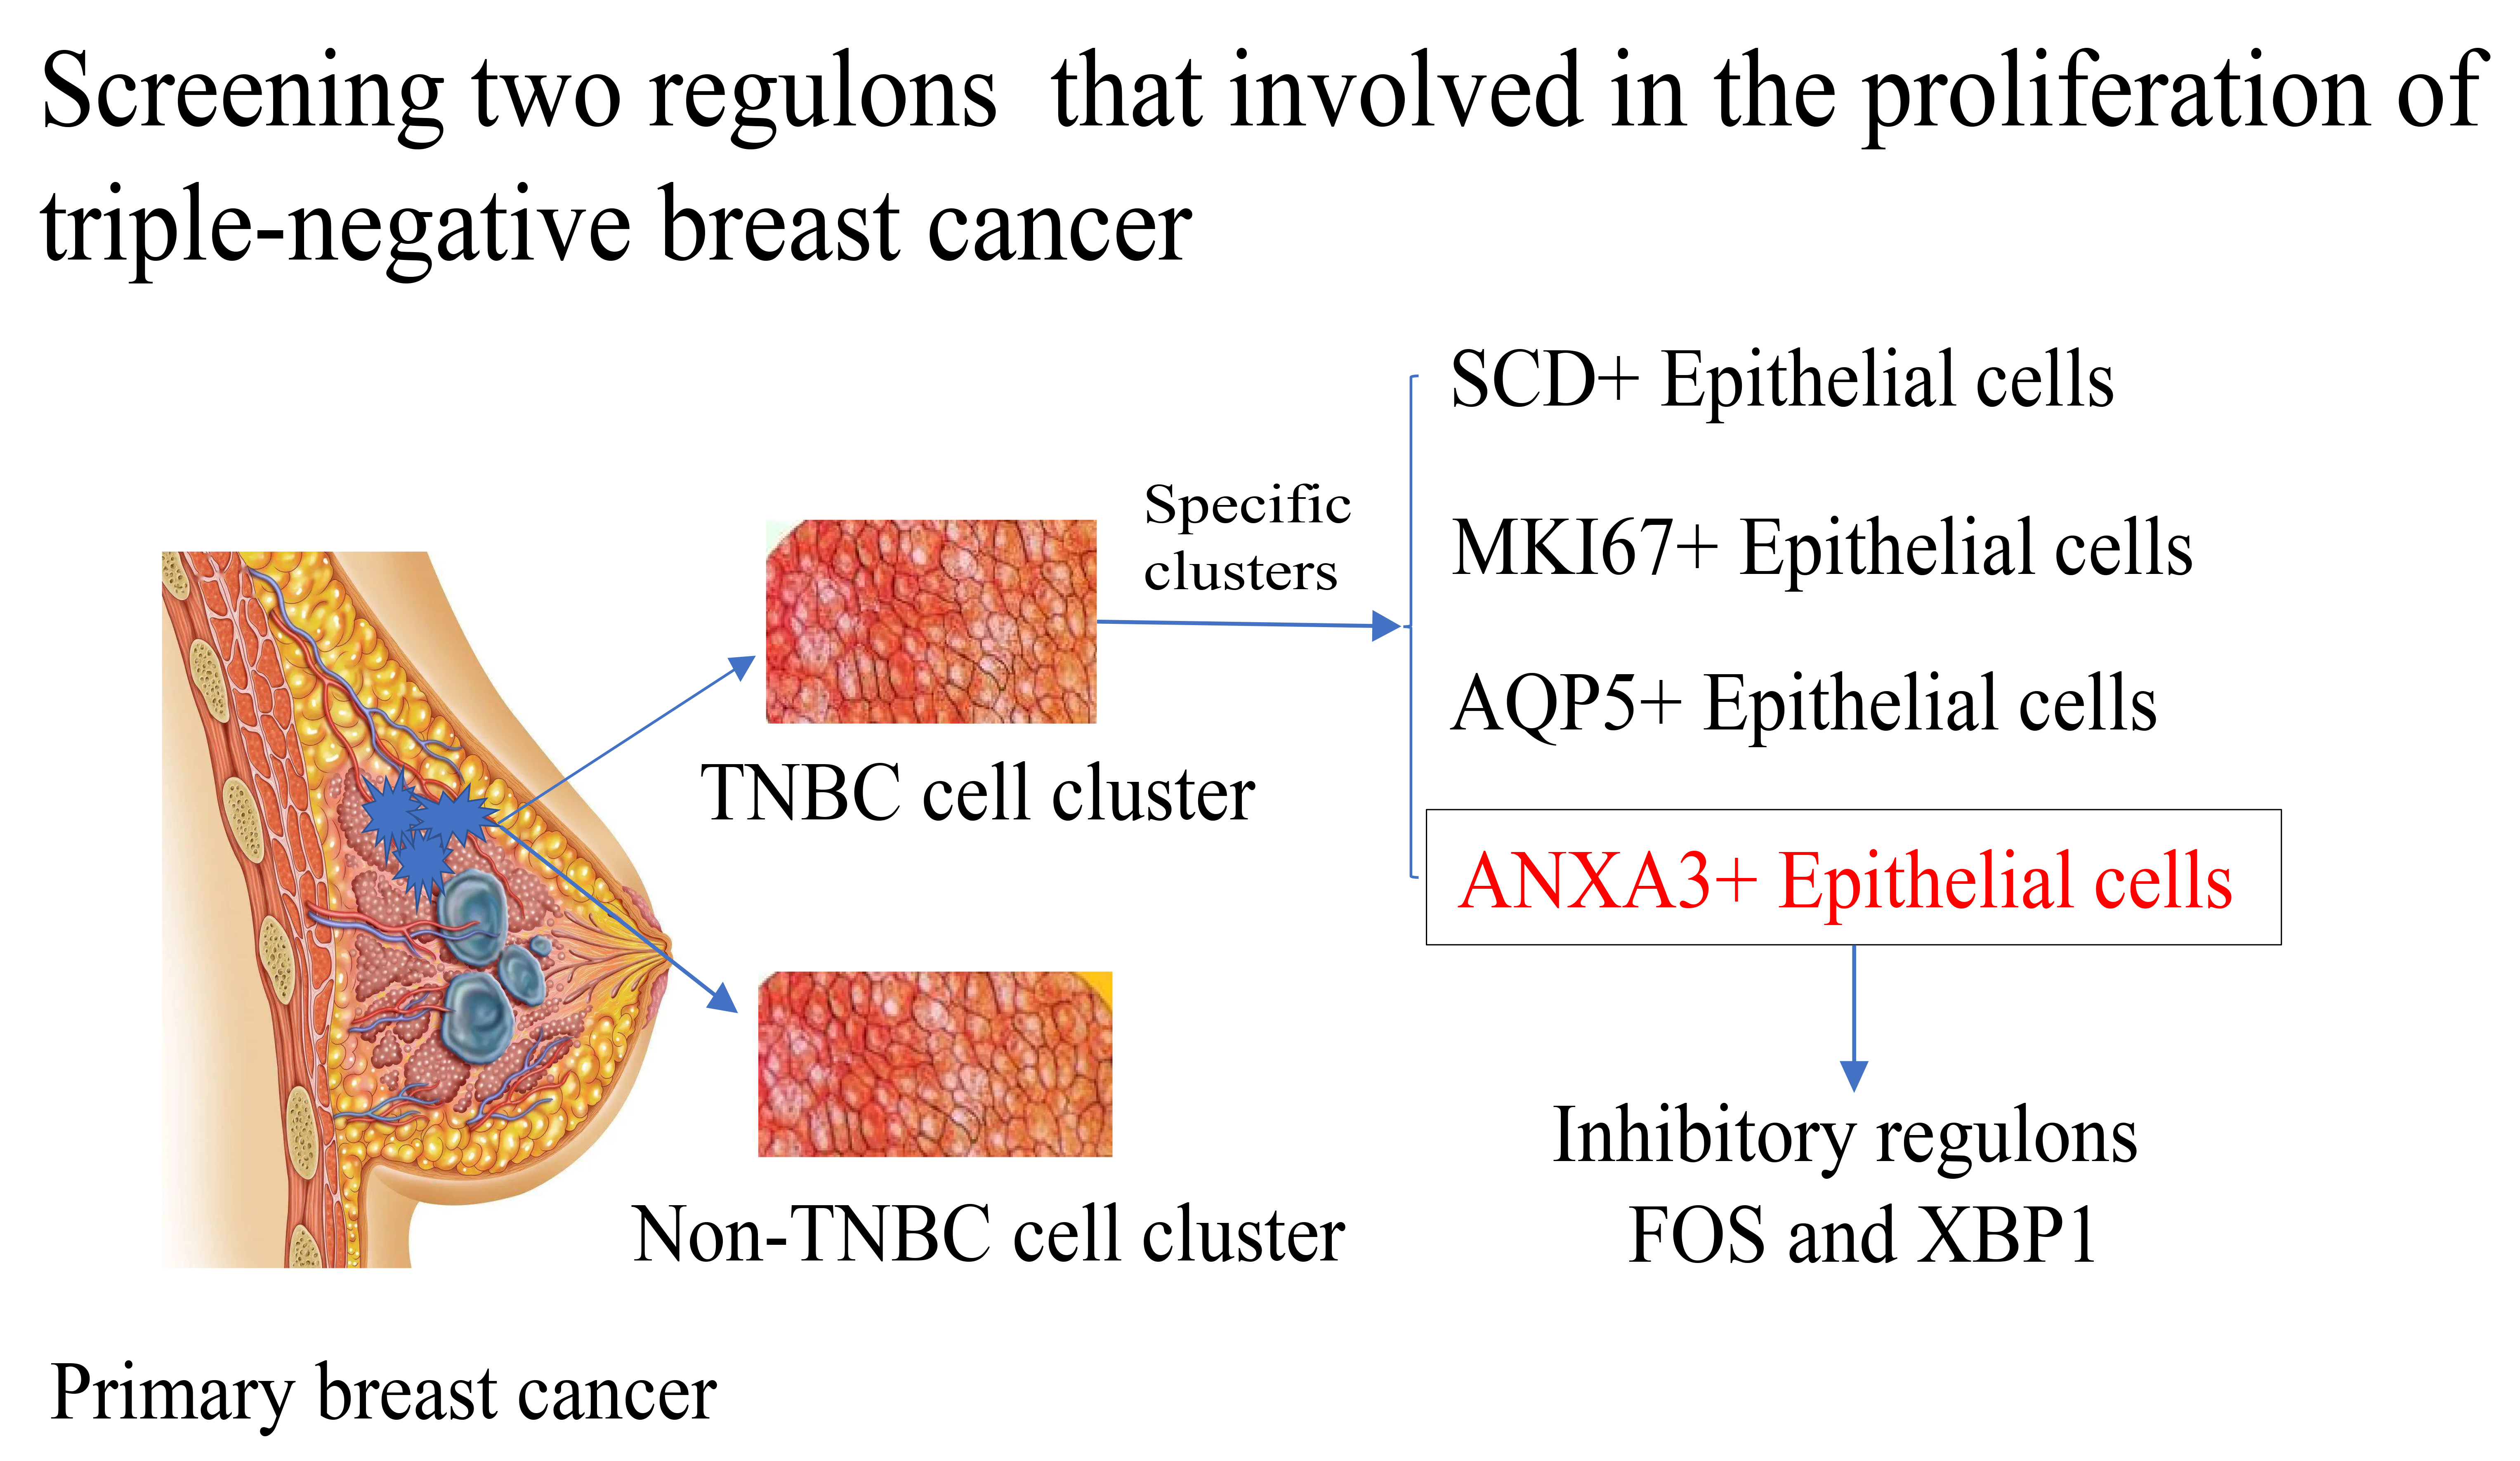
Graphical Abstract
Keywords
- triple-negative breast cancer
- TNBC
- SCENIC analysis
- gene regulatory networks (GRNs)
- TGF-β
- single-cell analysis
Breast cancer (BC) is the most common malignant cancer with the highest incidence and mortality rate (15% of all tumor deaths) among women [1, 2]. Meanwhile, BC is a highly heterogeneous cancer with five major intrinsic molecular subtypes, namely, Luminal (40%), Normal-like (2%–8%), Luminal B (20%), human epidermal growth factor receptor 2 (HER2)-enriched (10%–15%) and Triple Negative (15%–20%) [3]. Triple-negative breast cancer (TNBC), showing a lack of human epidermal growth factor receptor-2 (HER2), estrogen receptor (ER) and progesterone receptor (PR) immunohistochemistry expression, is defined as HER2-, ER- and PR- negative, respectively [3, 4]. Compared to non-TNBC subtypes, TNBC is characterized as the most aggressive BC with frequent p53 mutation, higher proliferative and distant metastases rates (10%–24% of all BC) and poor prognosis (only 60% of 5-year survival rate) [5, 6]. TNBC exhibits different clinical and biological characteristics from other BC subtypes and occurs in younger women at a higher frequency, commonly presenting as an invasive ductal carcinoma with advanced stage [7, 8]. Common therapeutic regimens for BC include chemotherapy, radiotherapy, surgery and endocrine therapy, such as endocrine tamoxifen and trastuzumab, which could be used for HER2-positive patients but not for TNBC patients due to a lack of the three receptors [9]. Currently, combined chemotherapy of taxanes and anthracycline is the most common choice for TNBC patients; however, anthracyclines have irreversible toxicity to the heart, which encourages researchers to further study the molecular mechanism of TNBC to develop safer and more effective chemotherapy regimens [10].
Intratumoral heterogeneity of TNBC is a driving force not only to pathogenesis,
but also to metastasis, treatment resistance and poor clinical outcomes [11]. Yeo and Guan [12] found that a single TNBC tumor tissue might consist of
multiple subtypes, the compositions of which will change under chemotherapy
pressure [13]. Although most primary TNBC cases are responsive to pre-operative
chemotherapy, viable tumor cells remaining in the breast (pathologic complete
response) are still closely related to the poor clinical outcomes in TNBC but not
to ER+ BC [14], suggesting the involvement of a minor TNBC subpopulation in
metastatic dissemination [15]. The development of single-cell RNA sequencing
(scRNA-seq) technology has improved the understanding of complex molecular
pathways and provided novel insight into genetic heterogeneity at the single-cell
level for cancer research [16]. For instance, Patel et al. [17] revealed
the cell state diversity and functional features of glioblastoma. The malignant
cells of BC originate from epithelial cells of the breast and contribute to the
complex tumor microenvironment (TME) via interacting with immune cells and stroma
cells [18]. Karaayvaz et al. [15] found that the TNBC is composed of
different subpopulations of epithelial cells, in which one epithelial cell
subpopulation with distinct signatures could be associated with the long-term
prognosis of TNBC patients. Thus, exploring the subtypes of TNBC could help
understand the progression of TNBC. Iacono et al. [19] performed a
global regulatory program to establish the gene regulatory networks (GRNs) based
on the scRNA-seq data, facilitating the identification of critical regulators in
disease. In addition, epithelial–mesenchymal transition (EMT)
promotes the metastasis and invasion of cancer cells, partly due to the fact that
epithelial cells can acquire the properties of cancer stem cells [20]. Special
signaling factors in the TME, such as interleukin-6 (IL-6), epidermal growth
factor (EGF), transforming growth factor-
This study performed a comprehensive analysis of scRNA-seq data
from five primary BC samples to identify TNBC subtypes and
determine critical genes for each molecular subtype. Firstly, the cell clusters
were classified according to the annotated marker genes. Secondly, the
pathological source of each cell cluster was classified, and we found that
epithelial cells had a larger proportion in the TNBC pathotype. Pathway
enrichment analysis revealed that the TGF-
GSE180286 containing single-cell transcriptome sequencing data from five groups (P1, P2, P3, P4 and P5) of primary BC was downloaded from the Gene Expression Omnibus (GEO) database (https://www.ncbi.nlm.nih.gov/gds/) [15]. For P1 (Luminal), P2 (Her-2) and P3 (Her-2), one LN+ and one LN- were investigated in this research; for P4 (TNBC), both lymph nodes were LN-; for P5 (TNBC), both lymph nodes were LN+ [29].
The Seurat R package (v4.3.1, Broad Institute of MIT and Harvard, Cambridge, MA, USA) was used for single-cell RNA-sequencing data (scRNA-seq) analysis [30], the data were filtered under the following criteria: (1) the numbers of expressed genes in each cell were between 200 and 6000; (2) the proportion of mitochondrial genes was less than 25%. The sctransform function was used to normalize the merged data [30]. After principal component analysis (PCA) dimensionality reduction, batch effects of the 5 samples were removed using the harmony R package (max.iter.harmony = 50, lambda = 0.5, assay.use = “sctransform”) [31]. According to the first 20 principal components, Uniform Manifold Approximation and Projection (UMAP) was performed for dimensionality reduction [30]. Then the FindNeighbors and FindClusters functions were used to cluster the cells (setting resolution = 0.1 for all cells and resolution = 0.3 for the epithelial cell) [30] and cell cluster types were annotated according to the marker genes of each cell type in the CellMarker database [32].
The hallmark gene set “h.all.v2023.1.Hs.symbols.gmt” was downloaded from the Molecular Signatures Database (MSigDB) database [33] and used to calculate the hallmark enrichment score for each epithelial cell, applying the AUCell R package [34].
The FindAllMarkers function was used to select high-expressed genes in each subset (parameter setting: only.pos = T, min.pct = 0.25, logfc.threshold = 0.25) [30] to explore the heterogeneity of gene expression patterns in each cell subset.
Genes of interest were uploaded into the Database for Annotation, Visualization
and Integrated Discovery (DAVID, https://david.ncifcrf.gov/) website to obtain
their biological functions (p
To investigate the communication between TNBC-specific epithelial cell subsets and T cells, we used the CellChat R package to estimate the probability of ligand–receptor interactions between the two [36]. Visualization of the results was achieved using the cell–cell contact and secreted signaling.
Normally, the intracellular heterogeneity is caused by transcriptional differences, which are controlled and determined by the GRNs, including a large transcription factor (TF) synergy. Thus, exploring scRNA-seq GRNs may help reveal the underlying biological significance of cell heterogeneity. SCENIC is a method to analyze GRNs and cell states based on co-expression and motif analysis using scRNA-seq data [34]. We employed the GENIE method of the SCENIC R package to identify potential target genes for each TF, and the AUCell function was employed to calculate the activity score of regulons. Finally, GRNs of target TFs were developed.
Dulbecco’s Modified Eagle Medium (DMEM, Solarbio, Beijing, China, Catalog no.
11995) was used to culture human normal mammary epithelial cell lines (MCF-10A)
and BC cell lines (MDA-MB-231) (American Type Culture Collection, ATCC, Manassas,
VA, USA) in a humidified atmosphere at 37 °C with 5% CO2. Cells
have been STR identified and the mycoplasma detection results are negative.
According to the manufacturer’s protocol of lipofectamine 2000 reagent
(Invitrogen; Thermo Fisher Scientific, Carlsbad, CA, USA), si-XBP1/silencing negative control (si-NC) and
pcDNA3.1-FOS/pcDNA3.1-NC were used to knock down XBP1 and overexpress FOS in
MDA-MB-231 cells, respectively. si-XBP1: 5
A TRIzol reagent (Invitrogen, Thermo Fisher Scientific, Carlsbad, CA, USA) extraction kit was utilized to separate total RNA from MDA-MB-231 cells. Subsequently, qRT-PCR was carried out on a LightCycler 480 PCR System (Roche, Basel, Switzerland) with FastStart Universal SYBR Green Master. The reaction volume (20 µL) consisted of water, PCR mixture (10 µL), forward and reverse primers (0.5 µL each) and cDNA template (2 µL). The PCR protocol involved pre-degeneration at 95 °C for 30 s, denaturation at 94 °C for 15 s, annealing at 56 °C for 30 s, and extension at 72 °C for 20 s for 45 cycles. Gene expression levels were calculated using the 2-ΔΔCT method, and each sample was analyzed in triplicate. The primer pairs for target genes can be found in Table 1, with GAPDH serving as a reference gene.
| genes | forward primer (5 |
reverse primer (5 |
| XBP1 | CCCTCCAGAACATCTCCCCAT | ACATGACTGGGTCCAAGTTGT |
| FOS | CCGGGGATAGCCTCTCTTACT | CCAGGTCCGTGCAGAAGTC |
| GAPDH | GGTGGTCTCCTCTGACTTCAACA | GTTGCTGTAGCCAAATTCGTTGT |
Invasion experiments were conducted using transwell plates coated with Matrigel
(BD Bioscience, Franklin Lake, NJ, USA). A total of 5
All the statistical analyses were performed in R software (version 4.3.1). The
Wilcoxon rank-sum test was used to compare the difference of continuous variables
between the two groups. p
After filtering, normalization and dimensionality reduction clustering, we identified a total of nine main cell subsets (29101 cells) based on the scRNA-seq data, namely, Fibroblasts, Fibroepithelial cells, Epithelial cells 1, Epithelial cells 2, Epithelial cells 3, Endothelial cells, T cells, Plasma B cells and Macrophages (Fig. 1A). The cells in each sample were classified (Supplementary Fig. 1). Interestingly, the pathological origins (Fig. 1B) showed that the numbers of Fibroblasts, Epithelial cells 2, Marchrophages and Endothelial cells derived from TNBC were less than that of the Her-2 (Fig. 1C). The maker genes to annotate cell subset were shown in Fig. 1D, for instance, Fibroblasts were identified by DCN, LUM and COL3A1 genes, Macrophages were identified by APOE, LYZ and SPP1 genes, etc. (Fig. 1E, Supplementary Table 1).
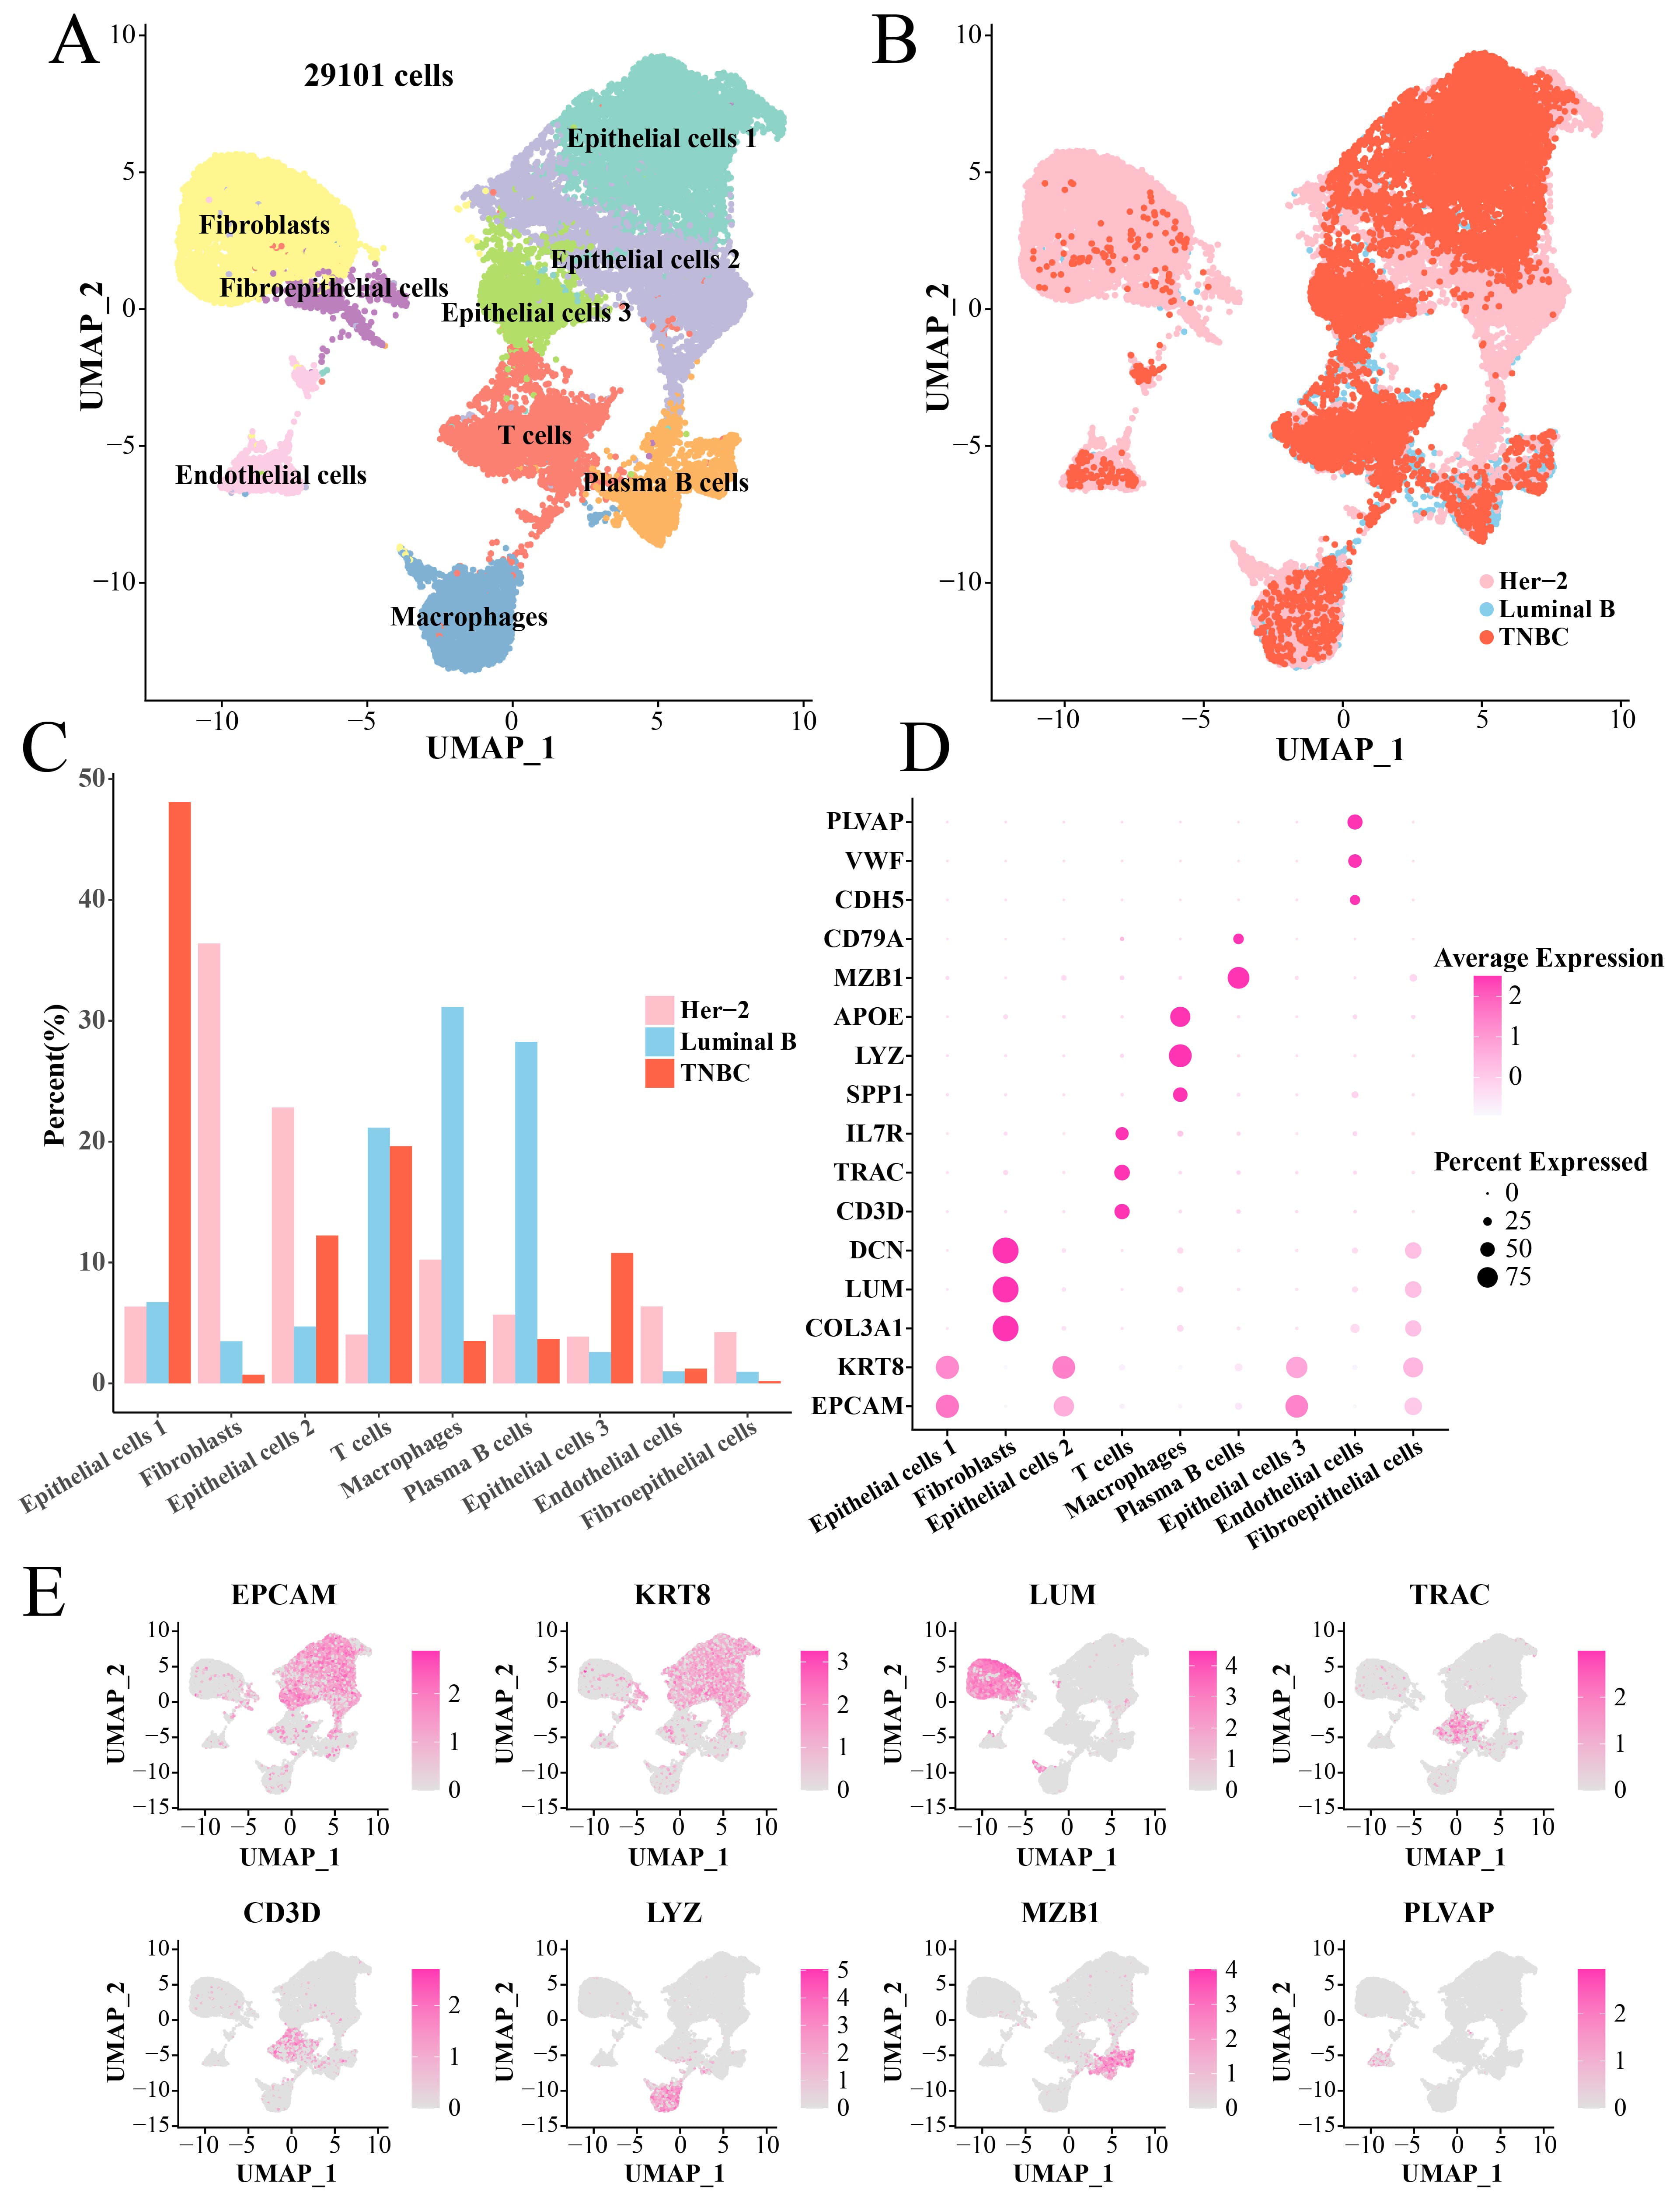 Fig. 1.
Single-cell landscape of BC tissues. (A) UMAP plot of annotated cell clusters. (B) UMAP dimensionality reduction plot of tissue types of each cell. (C) Bar plot of the proportion of each cell cluster in three pathologies tissues. (D) Bubble plot of marker genes in each cell cluster. (E) UMAP plot to demonstrate key marker genes (including EPCAM, KRT8, LUM, TRAC, CD3D, LYZ, MZB1 and PLVAP) in different TNBC cell clusters. BC, breast cancer; UMAP, Uniform Manifold Approximation and Projection; TNBC, triple-negative breast cancer.
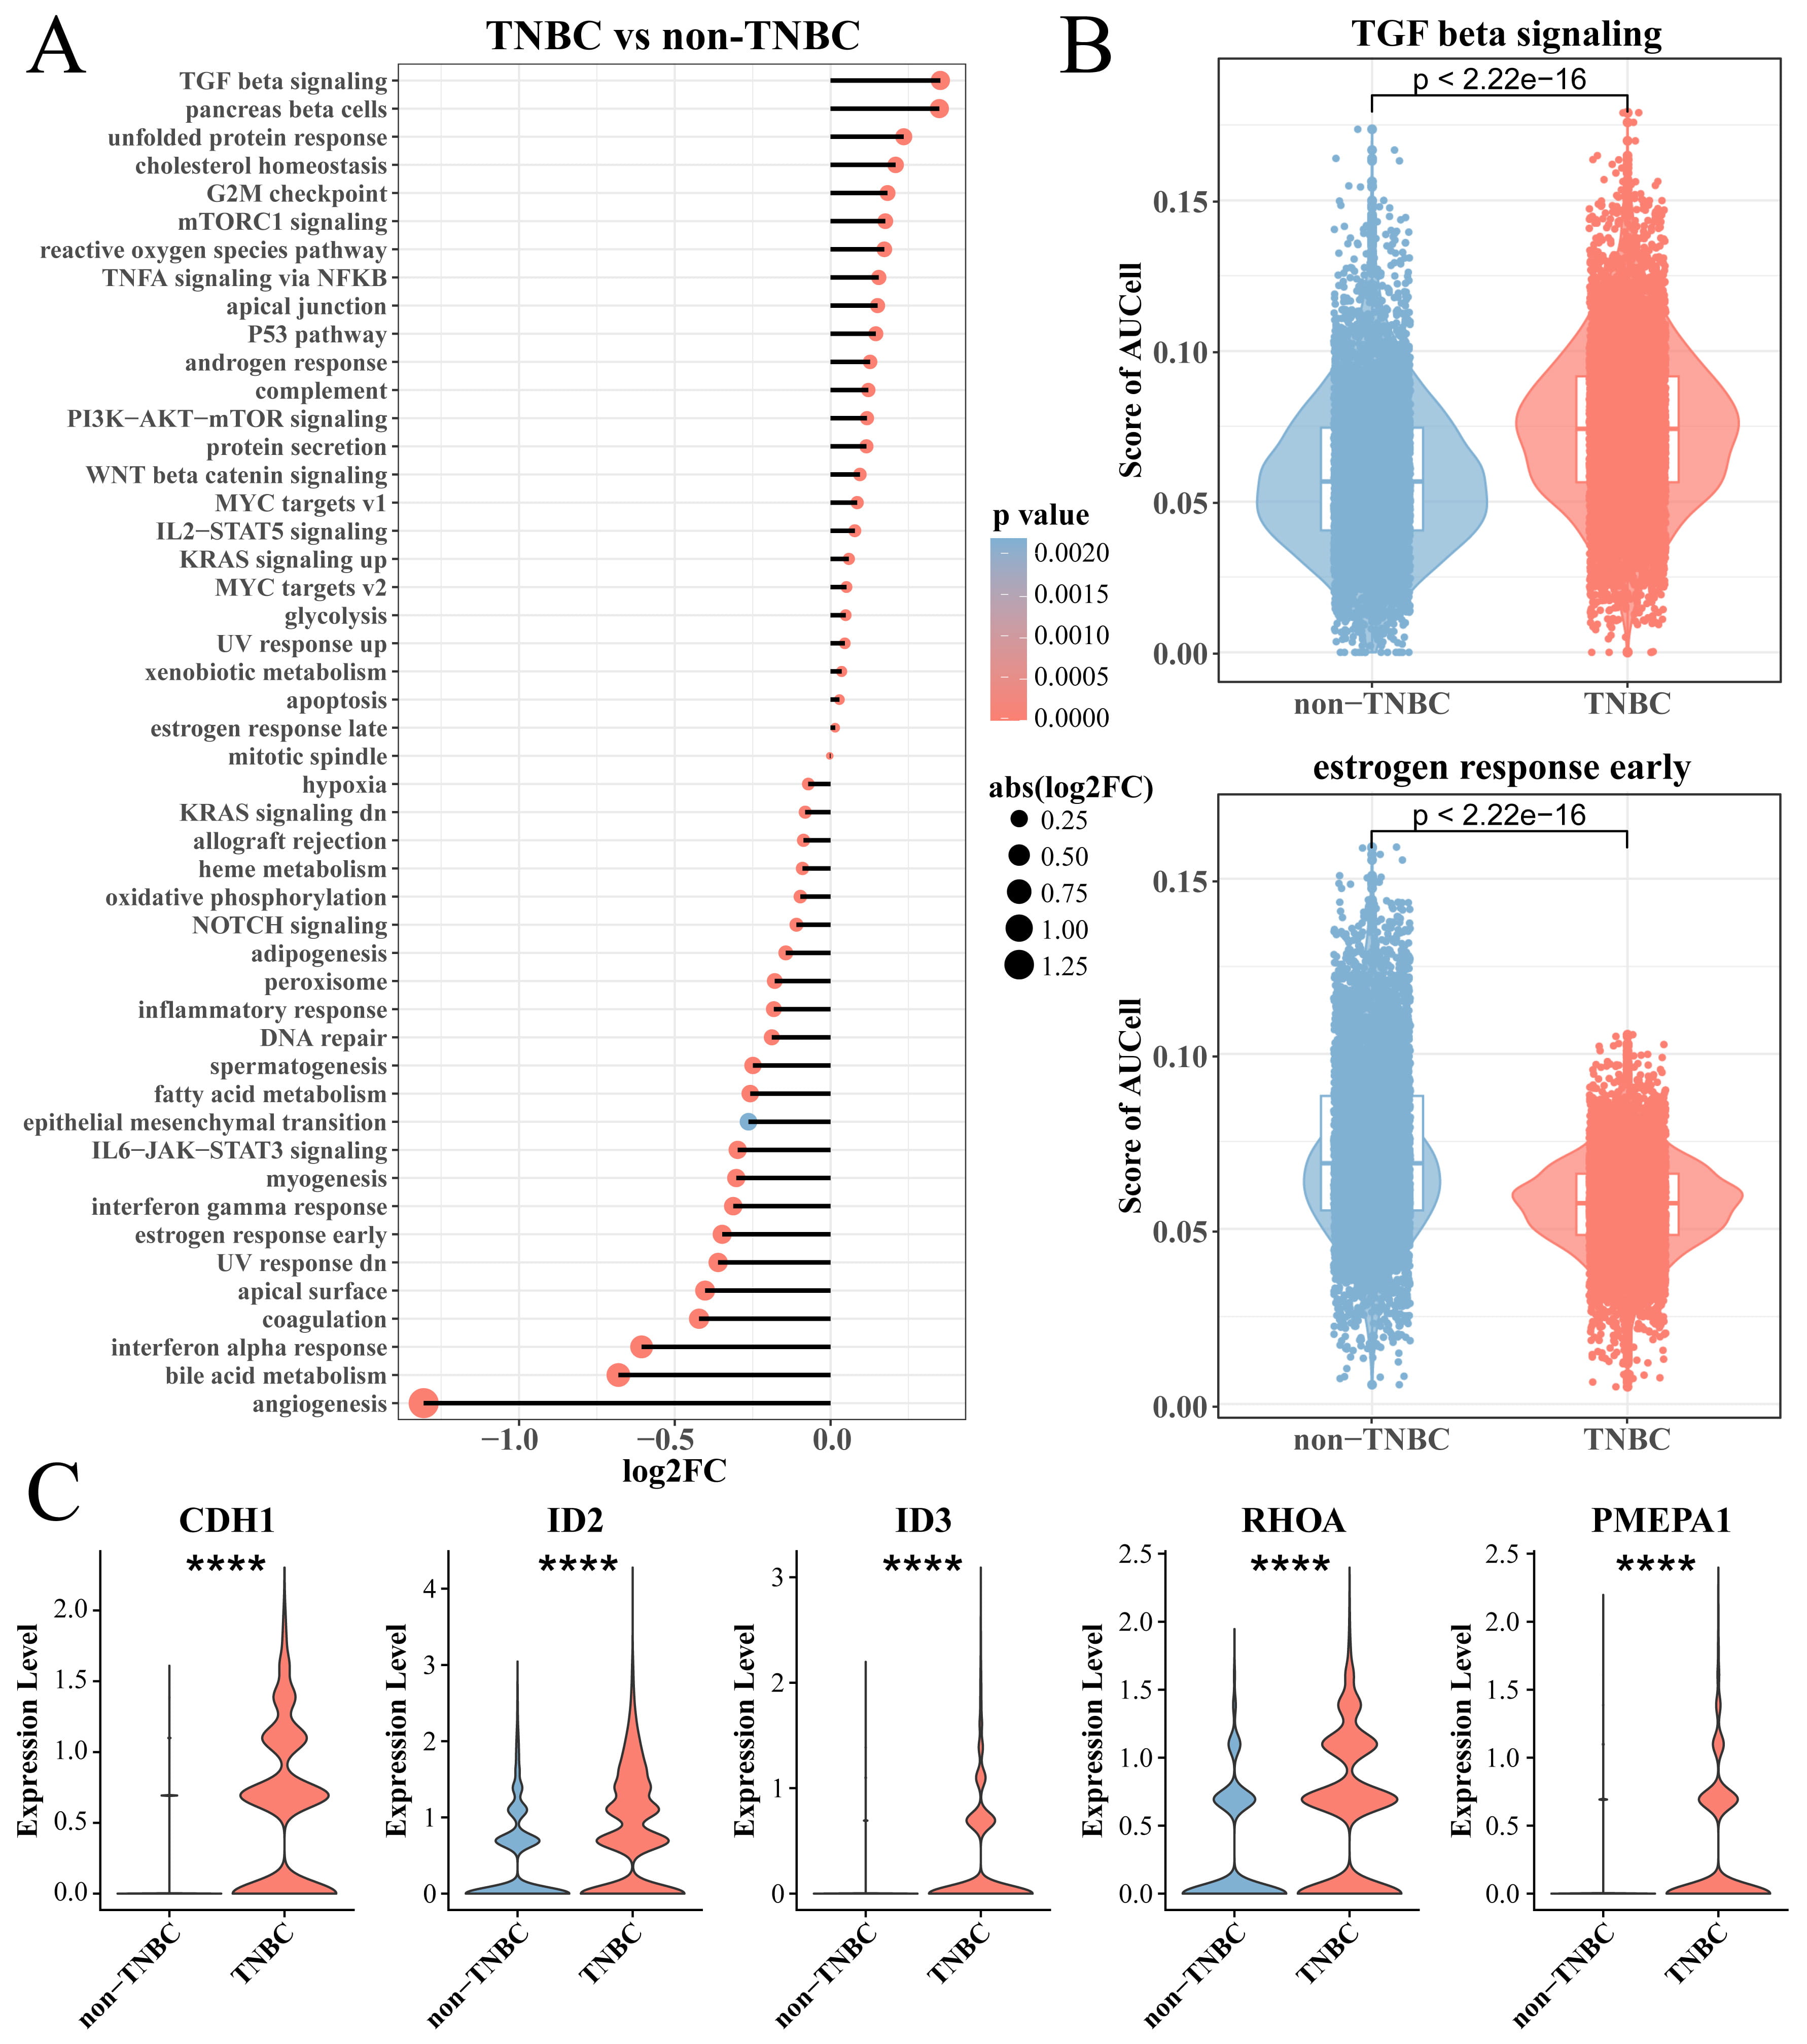
To explore differences in the enrichment of cancer-related pathways between TNBC
and non-TNBC epithelial cells, we calculated the enrichment score of two types of
cells in the hallmark gene set and used the Wilcoxon rank-sum test for further
analysis. Interestingly, the results showed that tumorigenic pathways, for
example, TGF-
 Fig. 2.
Analysis of TNBC epithelial cell enrichment pathway. (A) The
hallmark enriched pathway score between the TNBC and non-TNBC epithelial cell
groups. (B) Box plot of T enrichment score of transforming growth factor (TGF)-
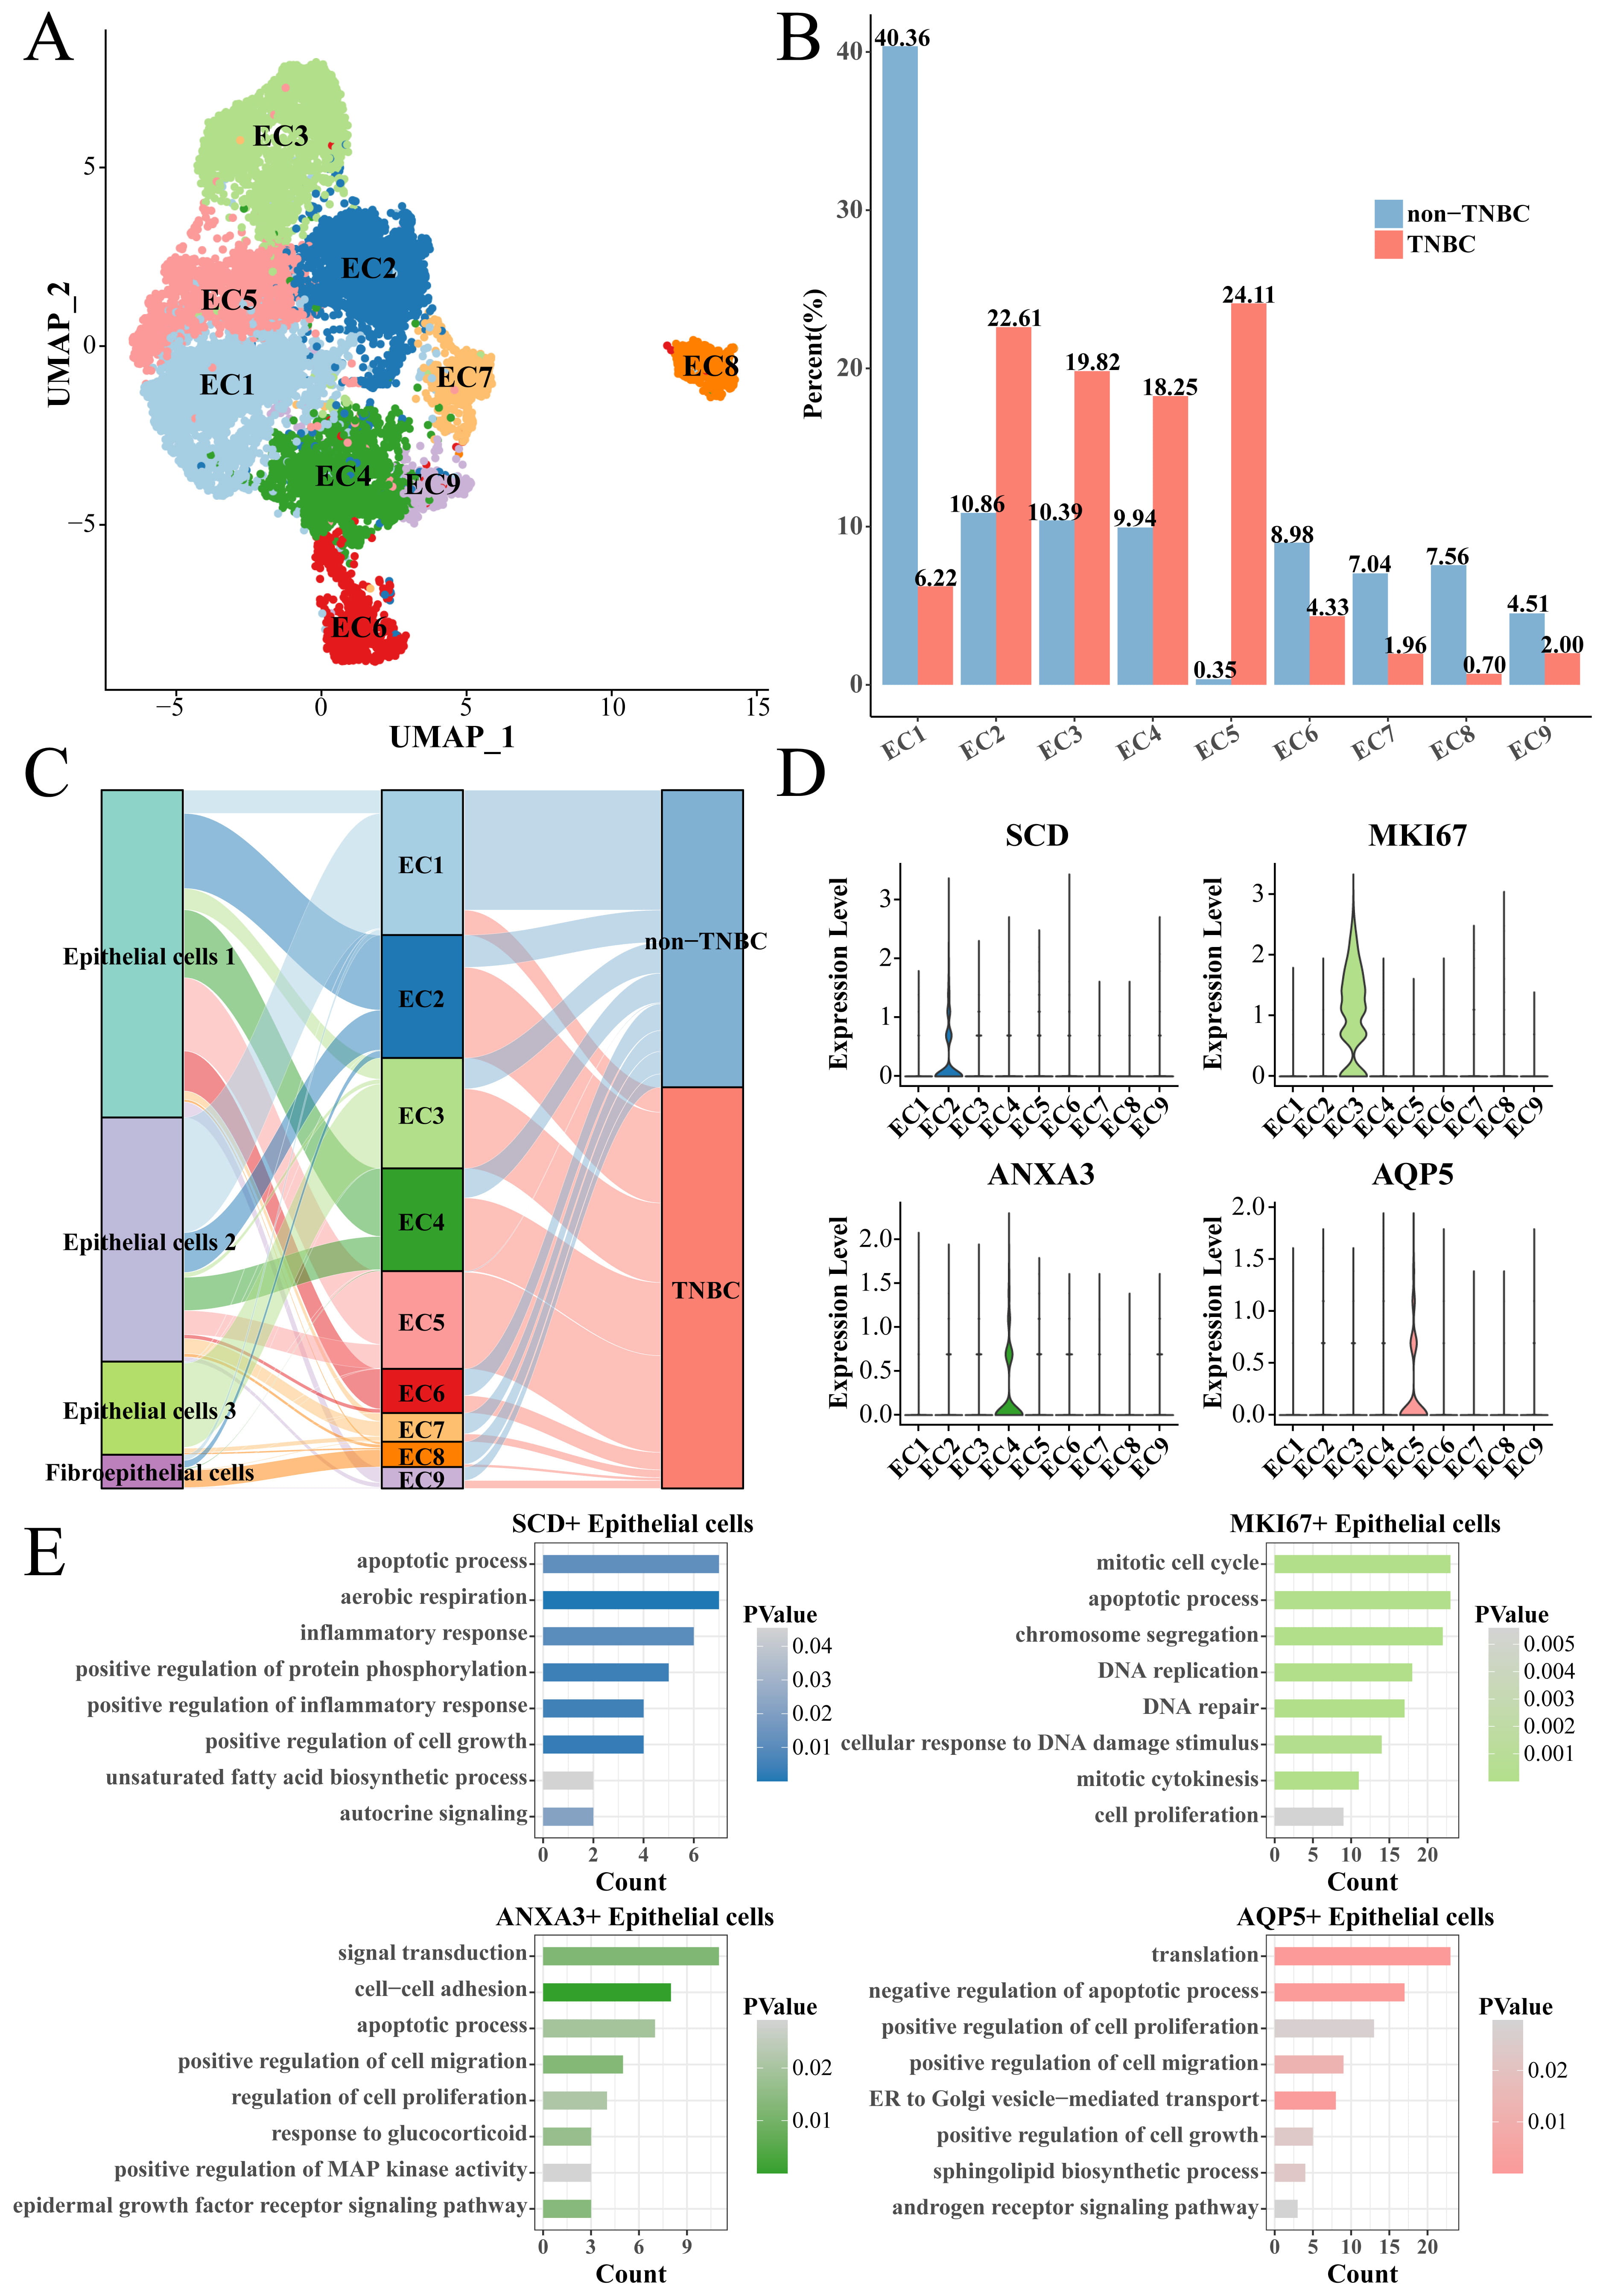
We collected all the epithelial cells to screen TNBC-specific epithelial cell subsets. The epithelial cells were clustered into nine cell subsets (EC1 to EC9) using the same Seurat workflow (Fig. 3A). The proportion of epithelial cells subsets (EC2), EC3, EC4 and EC5 subsets in the TNBC group was significantly higher than that in the non-TNBC group (Fig. 3B), indicating that they played a key role in distinguishing TNBC from non-TNBC groups. Thus, the EC2, EC3, EC4 and EC5 subsets were regarded as the TNBC-specific epithelial cell subsets, among them EC2, EC4, EC5 subsets mainly derived from the Epithelial cells 1, while the EC3 subset mainly derived from the Epithelial cells 3 (Fig. 3C). Subsequently, we used the FindAllMarkers function to screen marker genes in each subset, and found that the EC2, EC3, EC4 and EC5 subsets specifically overexpressed Stearoyl-CoA Desaturase (SCD), marker of proliferation Ki67 (MKI67), Annexin A3 (ANXA3) and aquaporin 5 (AQP5), respectively (Fig. 3D). These marker genes were uploaded to the DAVID database for functional analysis. The results showed that SCD was involved in the apoptotic process, aerobic respiration and inflammatory response, etc., MKI67 was involved in mitotic cell cycle, apoptotic process and chromosome segregation, etc., ANXA3 was involved in signal transduction, cell–cell adhesion and apoptotic process, etc., and AQP5 was involved in translation, negative regulation of apoptotic process and positive regulation of cell proliferation, etc., (Fig. 3E); noticeably, all of them were related to the process of apoptosis.
 Fig. 3.
Identification of TNBC-specific epithelial cell subsets. (A) UMAP clustering plot of all epithelial cells. (B) Box plot of the proportion of each epithelial cell subset between TNBC and non-TNBC. (C) Correspondence plot of subdivided epithelial cell subsets to the initial epithelial cell grouping. (D) Violin plot of specifically high-expressed genes in epithelial cell (EC)2, EC3, EC4 and EC5 groups. (E) The enriched biological processes of high-expressed genes. EC, epithelial cell.
The CellChat package was employed to explore the ligand–receptor interaction of TNBC-specific epithelial cells and T cells. For the cell–cell contact types. It was found that the four TNBC-specific epithelial cell subsets acted on CTLA4 via CD80 and CD86 to inhibit T cell activity in TNBC and non-TNBC groups (Fig. 4A,B). However, these four subsets inhibited the T cell activity via HLA-C-KIR2DL3 interaction in the TNBC group (Fig. 4A), while only the ANXA3+ epithelial cells in the non-TNBC group can inhibit T cell activity via CDH1-KLRG1 interaction (Fig. 4B). For the secreted signaling types, ANXA3+ epithelial cell subset in TNBC group inhibited T cell activity via BTLA-TNFRSF14 interaction (Fig. 4C) and by secreting TGFB and FASL in the non-TNBC group (Fig. 4D). We also found that ANXA3+ epithelial cells in TNBC and non-TNBC groups had the highest number of ligand–receptor pairs with T cells (Supplementary Fig. 2), suggesting that ANXA3+ epithelial cells played a vital role in inhibiting T cells.
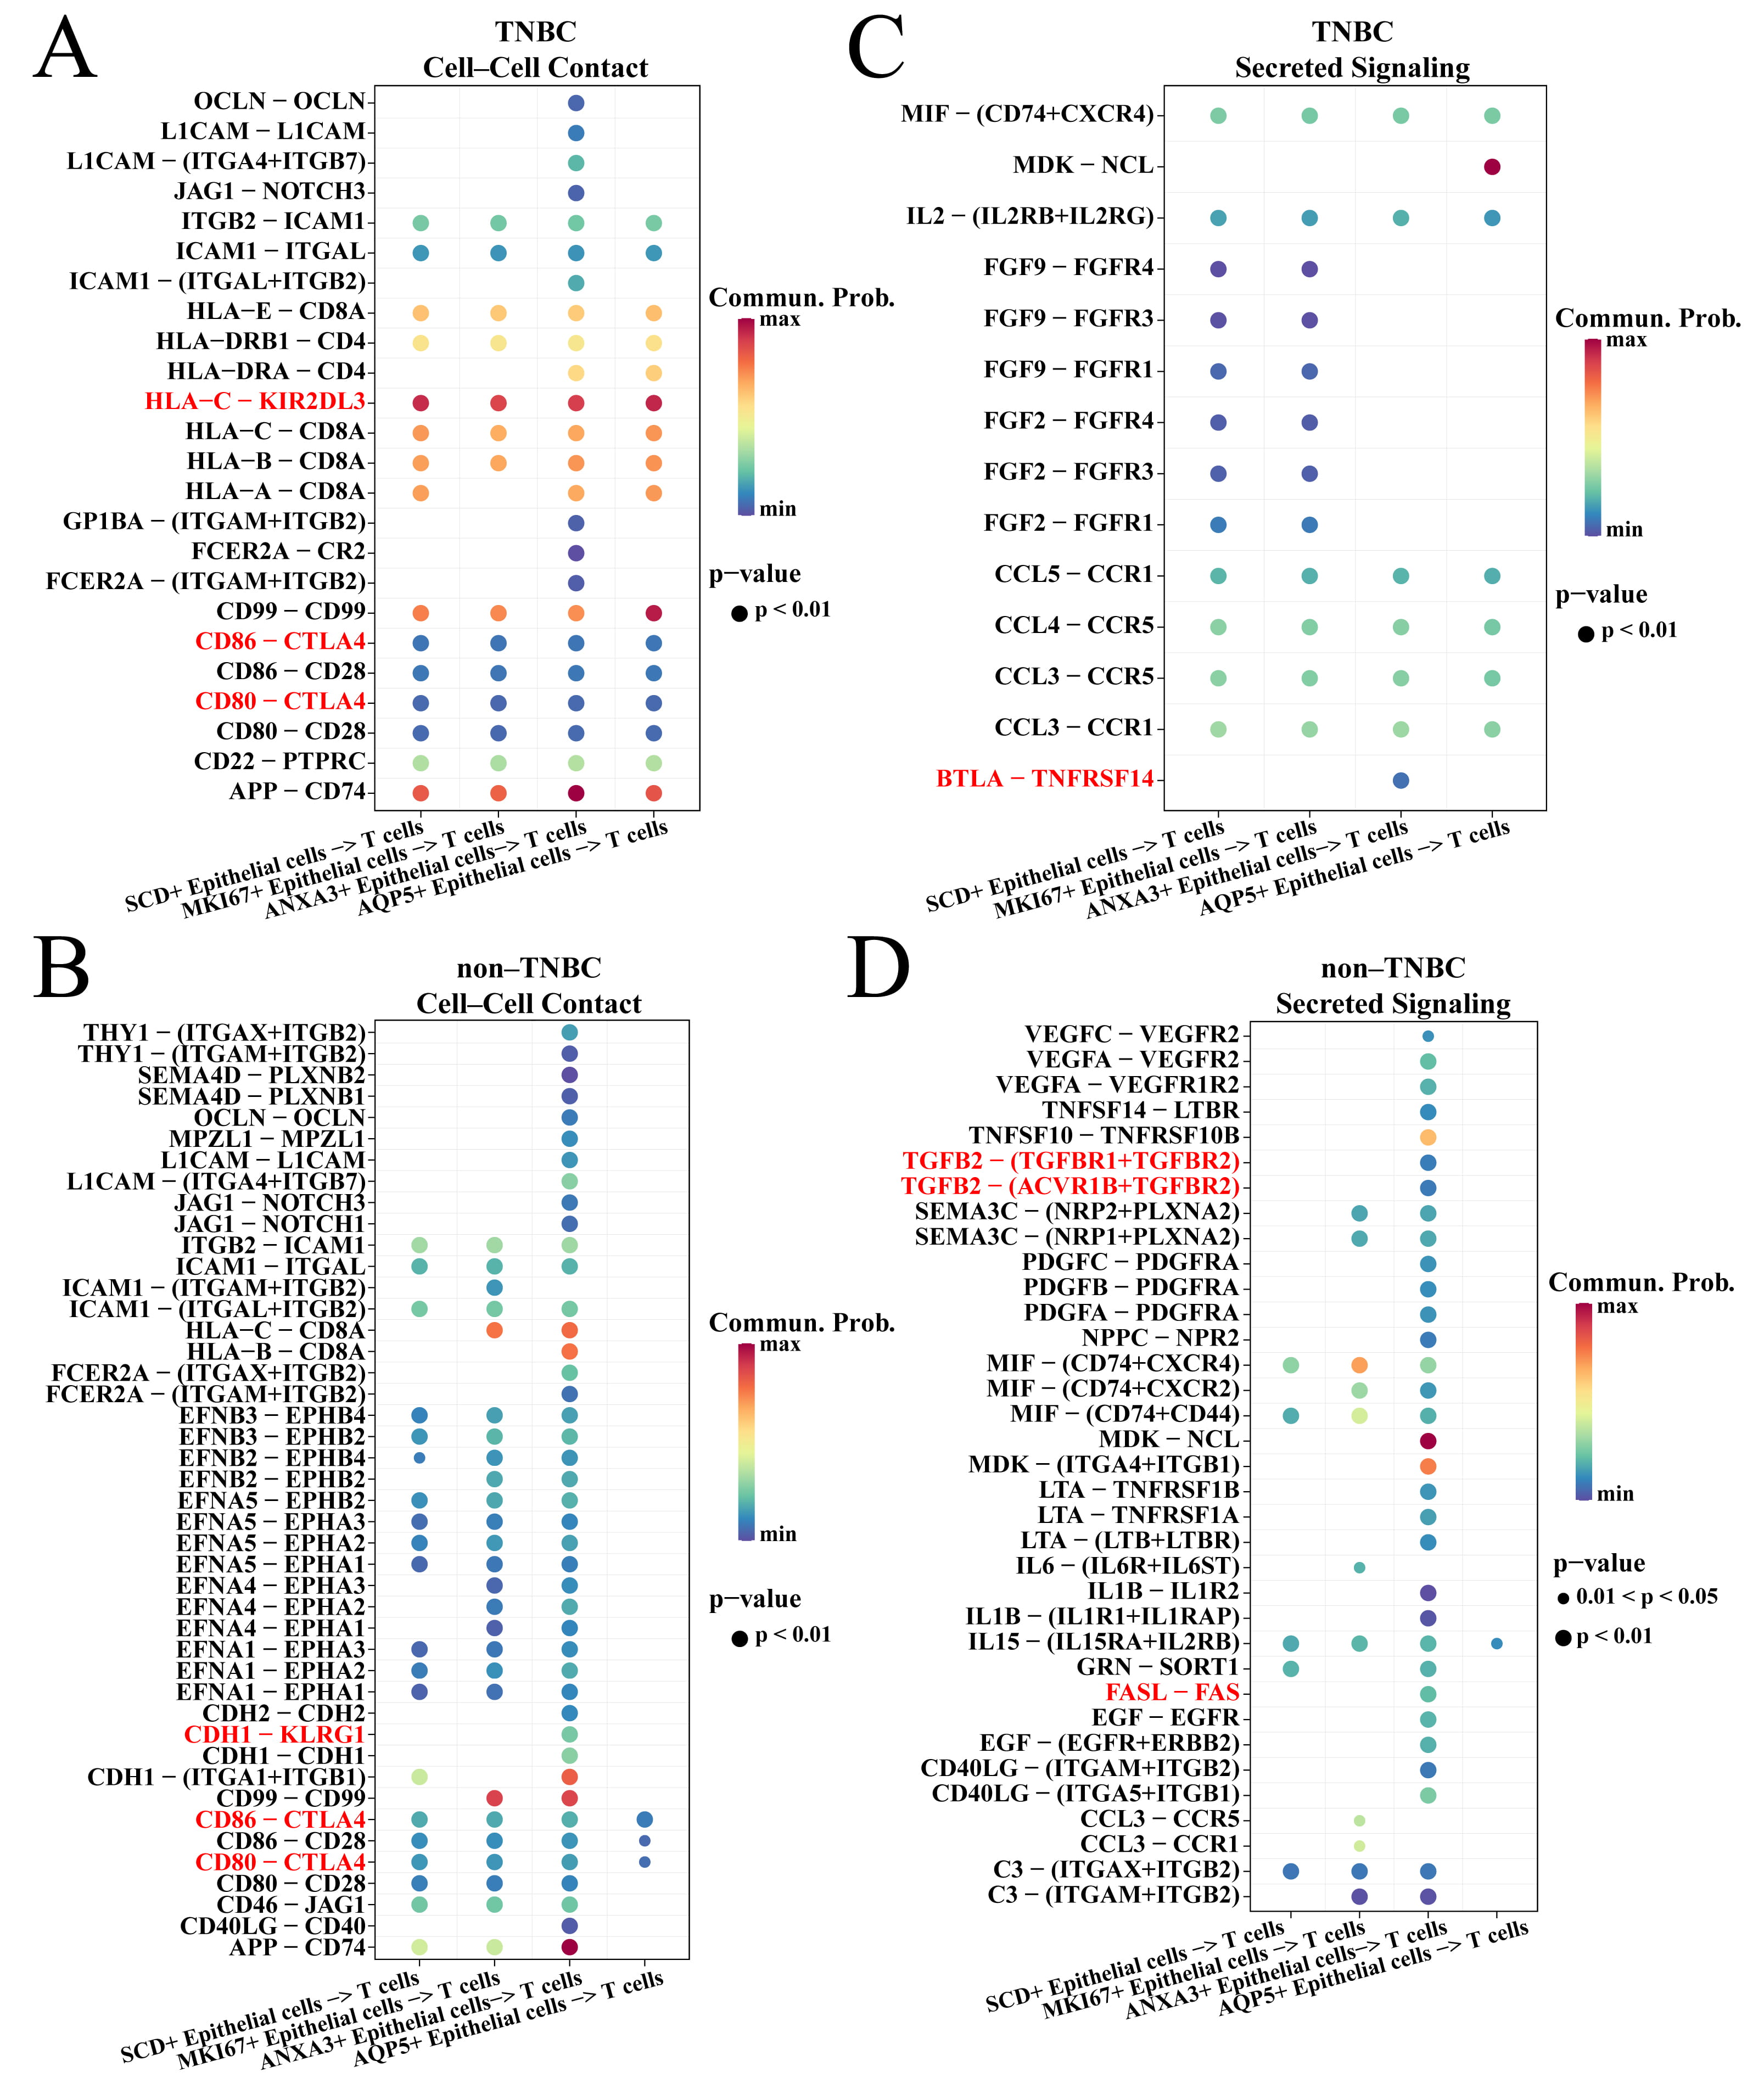 Fig. 4.
Cell communication between TNBC-specific epithelial cells and T cells. (A) Cell–cell contact of TNBC-specific epithelial cells and T cells in the TNBC groups. (B) Secreted signaling of TNBC-specific epithelial cells and T cells in the TNBC groups. (C) Cell–cell contact of TNBC-specific epithelial cells and T cells in the non-TNBC groups. (D) Secreted signaling of TNBC-specific epithelial cells and T cells in the non-TNBC groups.
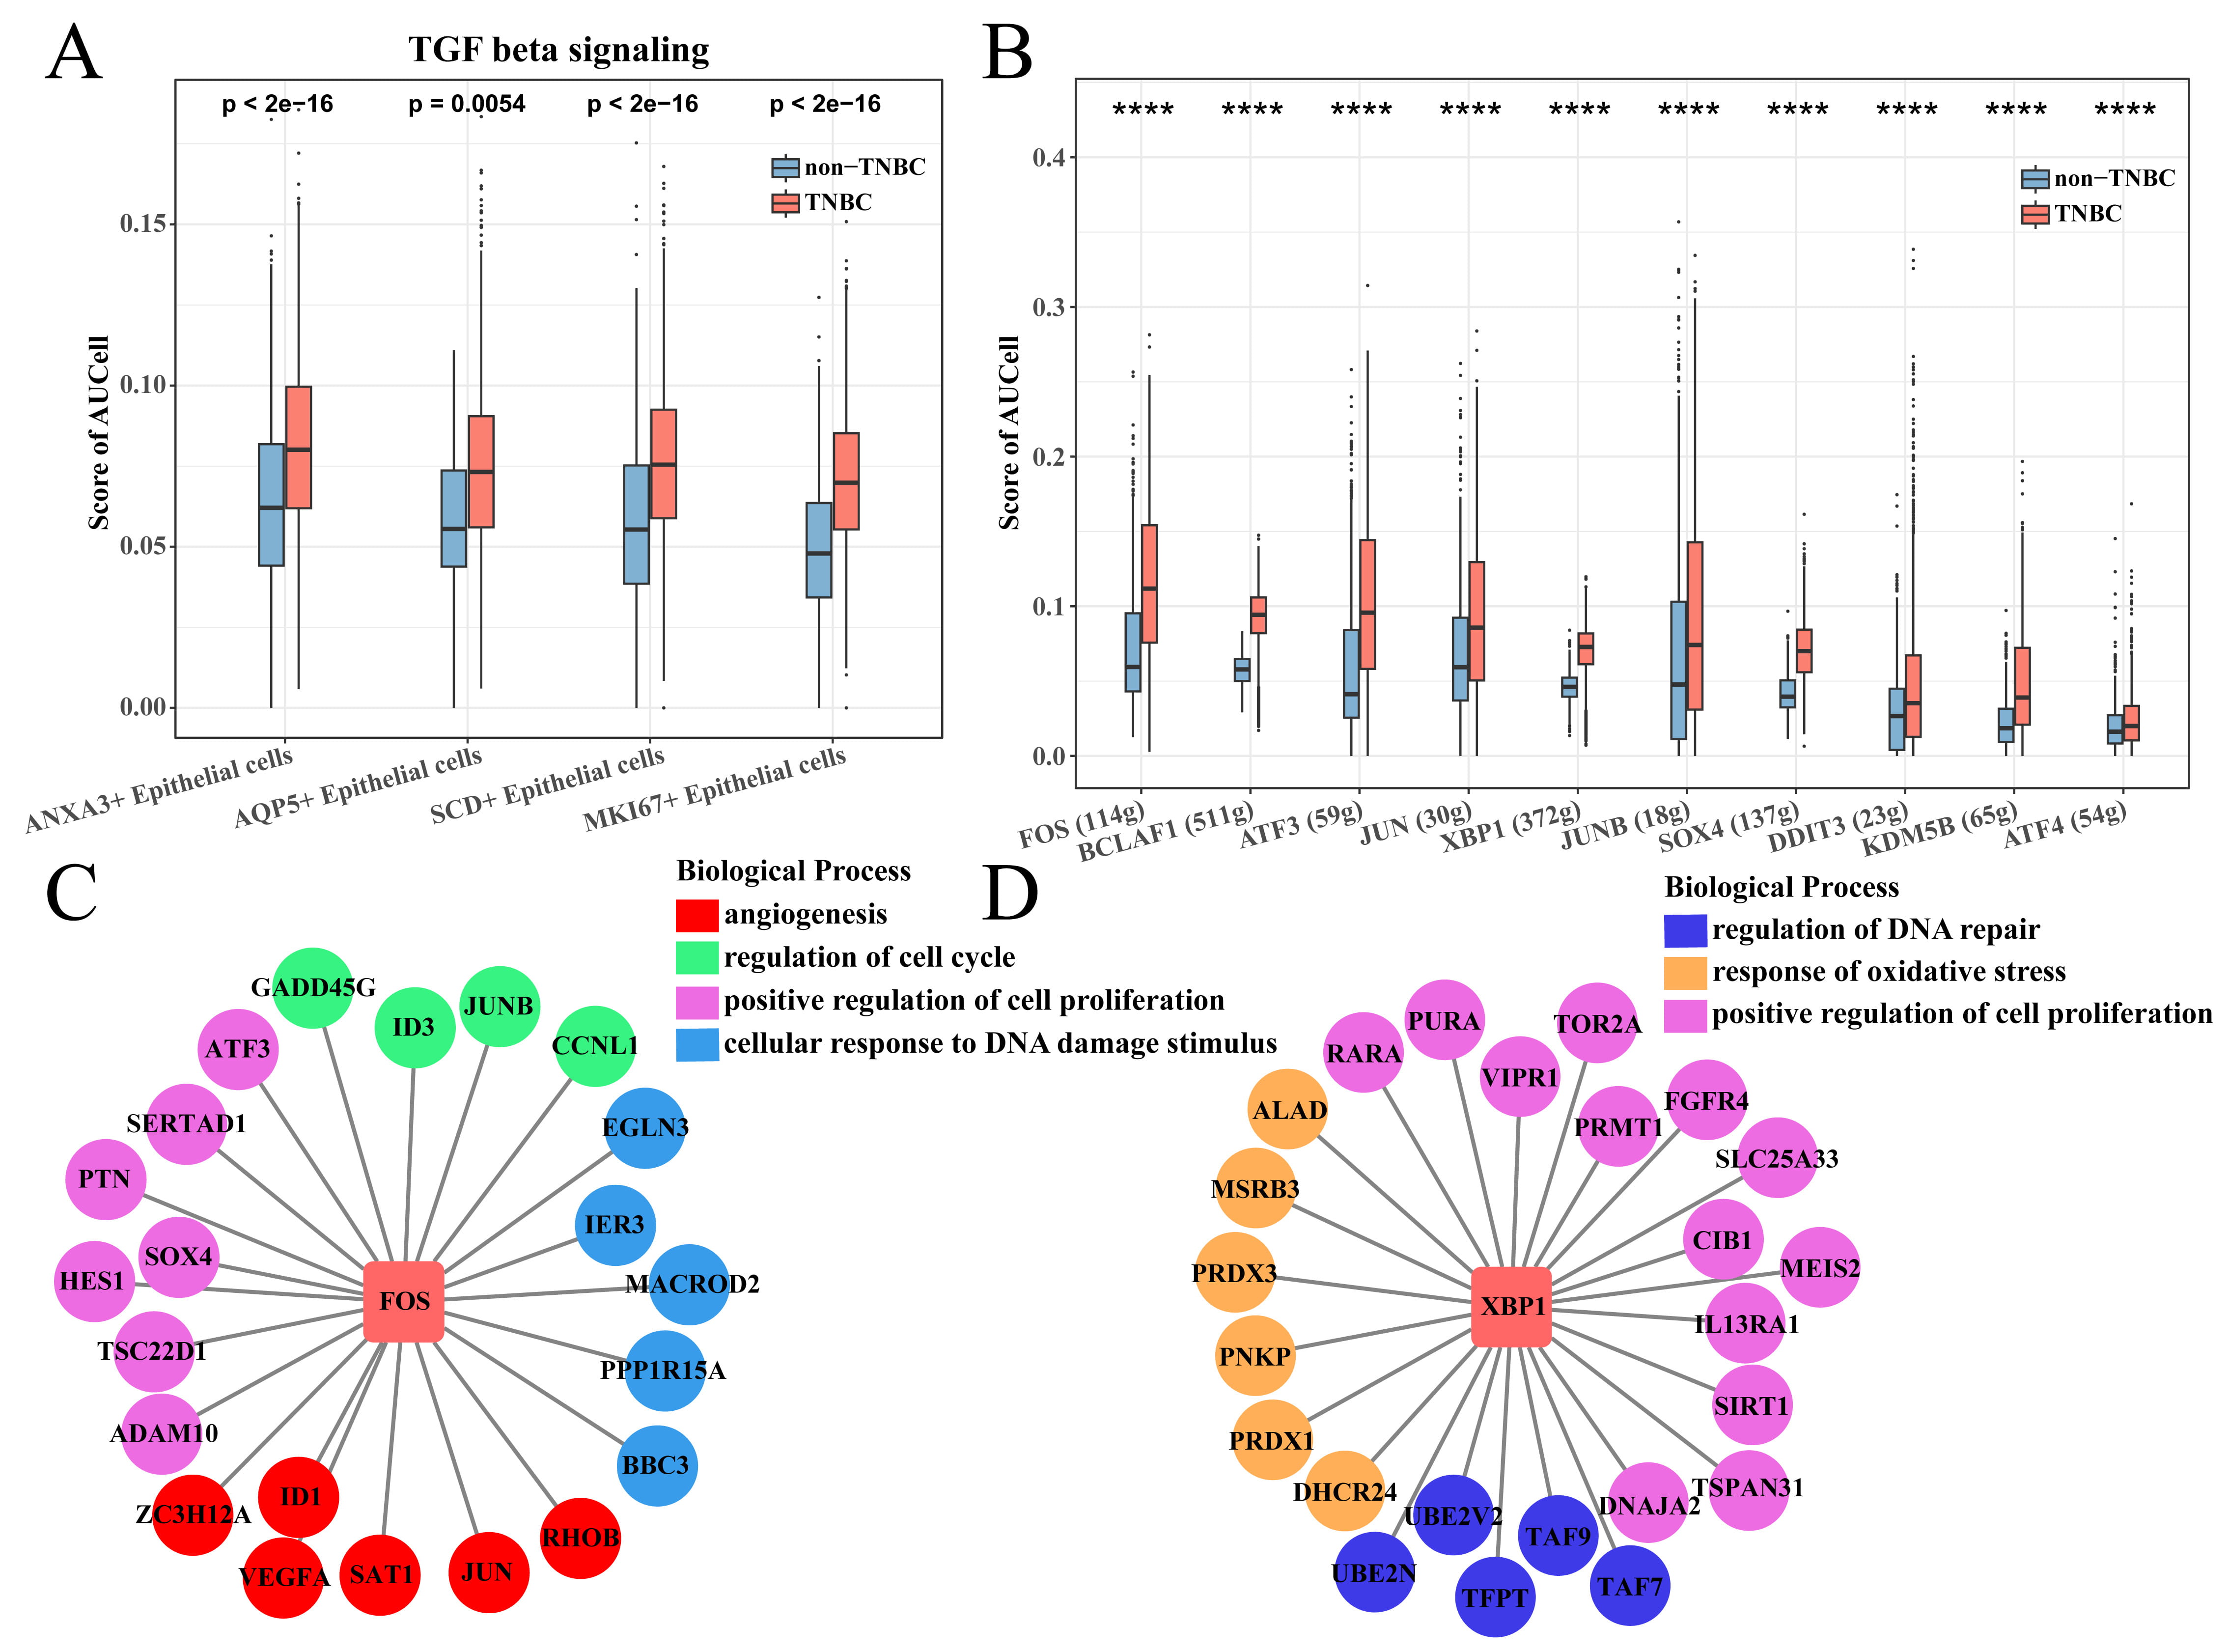
Subsequently, the TGF-
 Fig. 5.
SCENIC analysis of ANXA3+ epithelial cells. (A) TGF-
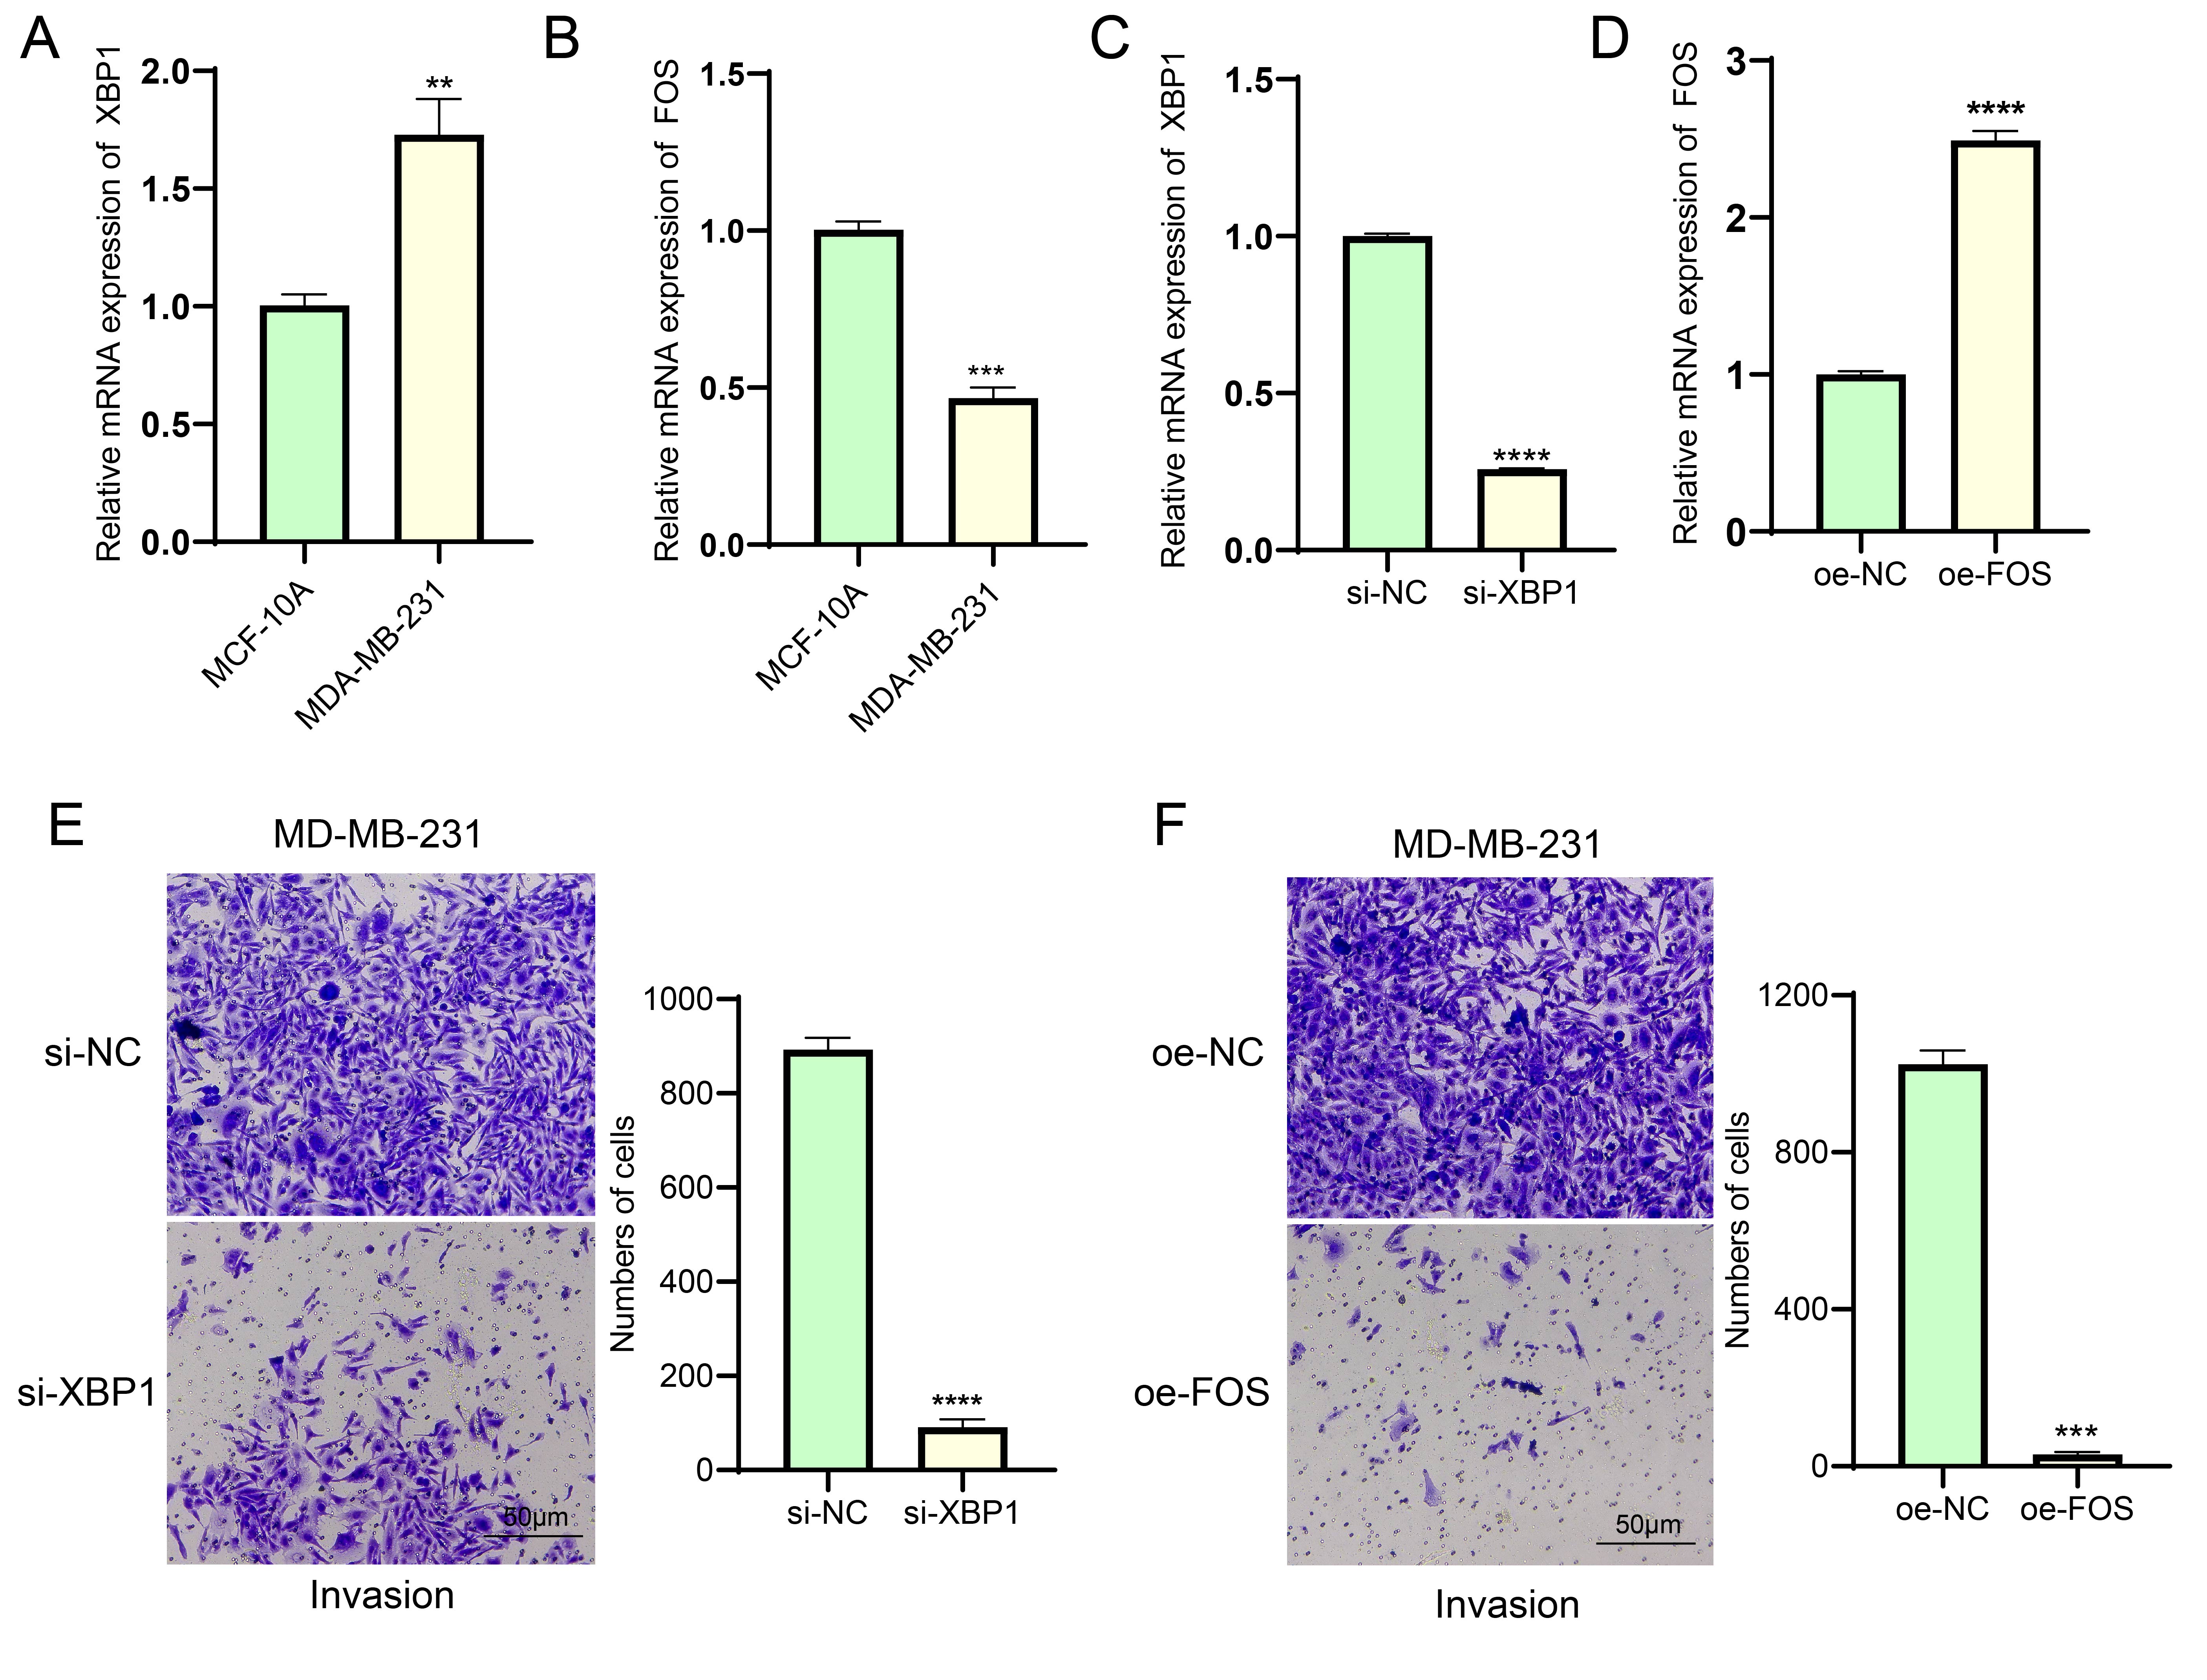
To further validate the potential mechanism of action of the key factors, we
first verified the expression levels of XBP1 and FOS using qRT-PCR. As shown in
Fig. 6A,B, compared to human normal mammary epithelial cells, the mRNA expression
level of XBP1 was significantly upregulated in BC cells, while that of FOS was
significantly downregulated (p
 Fig. 6.
Validation of the effects of XBP1 and FOS on BC cells. (A,B)
Differential analysis of mRNA expression levels of XBP1 (A) and FOS (B) in
MCF-10A and MDA-MB-231 cell lines, respectively. RT-qPCR analysis proved the
transfection efficiency of si-XBP1 (C) and oe-FOS (D) in MDA-MB-231 cells
successfully. (E) Silencing XBP1 expression to inhibit the invasive ability of
MDA-MB-231 breast cancer cells. Scale bar: 50 μm. (F) FOS overexpression inhibits invasion of
MDA-MB-231 breast cancer cells. Scale bar: 50 μm. ** represents p
TNBC is an aggressive subtype of BC with high intratumoral heterogeneity. In this study, we performed a comprehensive analysis of five primary BC samples using scRNA-seq data and identified nine cell subsets based on gene-expression profiles and marker genes, with the epithelial cells accounting for the largest proportion in nine subsets and TNBC pathotypes. Previous studies showed that malignant BC cells derive from epithelial cells [18, 37, 38]. We investigated the difference in epithelial cells in the TNBC and non-TNBC pathotypes, and classified four TNBC-specific epithelial cell subsets closely related to cell proliferation. Interaction analysis showed that these four subsets suppressed the immune response through different mechanisms to interact with T cells, playing vital roles in promoting tumor progression. In addition, the ANXA3 epithelial cell subset had the largest number of T cell interacted-receptor pairs and two key regulons involved in proliferation. Thus, we speculated that the ANXA3 epithelial cells might be a leading cause of TNBC progression, and the critical regulons genes could serve as potential targets for chemotherapy.
The epithelial cells in the TNBC pathotype exhibited higher TGF-
In the four TNBC-specific epithelial cell subsets, their marker genes were associated with the apoptotic, proliferation and cell growth processes. Lipids are involved in the proliferation, metastasis and therapeutic resistance in many tumors [48], and hypoxia can induce the formation of reactive oxygen species (ROS), leading to lipid peroxidation [49]. Stearoyl-CoA desaturase (SCD), a rate-limiting enzyme for unsaturated fatty acid synthesis, is highly expressed in lung cancer [50]. In tumors, SCD can reactivate fatty acid biosynthesis and improve the overall saturation level of membrane lipids, helping the tumor avoid damage from ROS [51]. MKI67 expression is indicative of cell proliferation status, and its overexpression is a prognostic indicator for cancer [52]. Annexin A3 (ANXA3) as a Ca2+-dependent membrane binding protein is involved in channel regulation, signal transduction, cell growth, proliferation, migration, apoptosis and anti-inflammation in tumor progression [53]. Research reported that silencing ANXA3 inhibits the proliferation, invasion and colony-forming abilities of HCC-1954 and MDA-MB 231 BC cells [54, 55]. AQP5 is an aquaporin that controls the water flow across the membrane and is also responsible for regulating osmotic pressure based on the intracellular glycerol concentration [56]. The regulation of water movement and osmotic pressure further influence cellular functions, such as proliferation, migration and adhesion [57]. AQP5 is involved in breast carcinogenesis [58]. AQP5 silencing or induction of hyperosmotic stress downregulates the expression of AQP5 and negatively affects tumor cell proliferation and migration [59], which might be caused by AQP5-mediated oxidative stress imbalance [60]. Another study reported that overexpression of AQP5 in the TNBC samples with high-expressed MKI67 is associated with a poor outcome, suggesting that the co-expression of the two genes could serve as an independent prognostic indicator for TNBC patients [61]. Thus, these four TNBC-specific epithelial cell subsets all contributed to TNBC progression but through different mechanisms, specifically, SCD+ and AQP5+ epithelial cell subsets were responsible for maintaining the oxidative stress homeostasis, and MKI67+ and ANXA3+ epithelial cell subsets were responsible for the cell cycle, proliferation and invasion regulation.
The ANXA3+ epithelial cell subsets interacted with T cells through different means, with the two regulons (FOS and XBP1) playing prominent roles in cell proliferation and angiogenesis. FOS has been regarded as an oncogene, and high levels of FOS in the nucleus can bind to other transcription factors (TFs) for downstream transcriptional activation [62]. A similar study showed that FOS is a representative apoptotic driver, as higher expressions of both FOS and apoptotic effector genes in FOS-targeted cells are correlated with better survival [63]. In addition, Nanamiya et al. [64] found that FOS is partially involved in regulating the expression of PVRL4 in BC cells, which in turn regulates the response of cancer cells to the immune system. XBP1 is a unique basic-region leucine zipper (bZIP) protein (TF) involved in EMT activation, cell growth and proliferation in a variety of cancers including in BC [65]. A previous study discovered that downregulating XBP1 expression through RNA interference can restore E-cadherin levels and promote the formation of cell–cell junctions in BC cells, which results in the inhibition of cell invasion and tumor growth [66]. These results further confirmed the reliability of the key regulatory genes we screened for TNBC, with FOS and XBP1 playing important roles in TNBC progression.
This study developed the single-cell profile of BC and identified four TNBC-specific epithelial cell subsets and comprehensively analyzed their roles in TNBC progression. In addition, the GRNs of the two regulons involved in cell growth and proliferation were constructed; however, their actual function and molecular mechanisms remained to be further elucidated in vivo and in vitro.
We performed a comprehensive analysis of the scRNA-seq data of five primary BC samples, and found a significant contribution of four TNBC-specific epithelial cell subsets to the TNBC metastasis and malignant progression. Two critical regulons in the ANXA3+ epithelial cell subsets exhibited complex regulation relationships to promote tumor development, which could help explore the underlying molecular mechanism of intratumoral heterogeneity and may be used as potential targets for TNBC.
TNBC, Triple-negative breast cancer; GEO, Gene Expression Omnibus; DAVID,
Database for Annotation, Visualization and Integrated Discovery; SCENIC,
Single-cell regulatory network inference and clustering; scRNA-seq, single cell
RNA sequencing; GRNs, Gene regulatory networks; BC, Breast cancer; HER2, human
epidermal growth factor receptor-2; ER, estrogen receptor; PR, progesterone
receptor; EMT, epithelial-mesenchymal transition; IL-6, interleukin-6; EGF,
epidermal growth factor; TGF-
The datasets generated and/or analyzed during the current study are available in the [GSE180286] repository, [https://www.ncbi.nlm.nih.gov/geo/query/acc.cgi?acc=GSE180286]. The raw data used and/or analyzed during the current study are available from the corresponding author on reasonable request.
All authors contributed to this present work: HZ & YNS designed the study, XND acquired the data. HZ improved the figure quality. HZ & YNS drafted the manuscript, HZ & XND revised the manuscript. All authors contributed to editorial changes in the manuscript. All authors read and approved the final manuscript. All authors have participated sufficiently in the work and agreed to be accountable for all aspects of the work.
Not applicable.
Not applicable.
This work was supported by the Yancheng Engineering Center (YC2022808).
The authors declare no conflict of interest.
References
Publisher’s Note: IMR Press stays neutral with regard to jurisdictional claims in published maps and institutional affiliations.