
Academic Editors: Poggi Alessandro and Neven Zarkovic
Prostate cancer is one of the most common and socially significant cancers among men. The aim of this study was to identify significant changes in the expression of exosomal miRNAs associated with an increase in the level of prostate specific antigen in castration-resistant prostate cancer during therapy and to evaluate them as potential prognostic markers for this category of disease. High-throughput miRNA sequencing was performed on 49 blood plasma samples taken from 11 Russian patients with castration-resistant cancer during therapy. Bioinformatic analysis of the obtained miRNA-seq data was carried out. Additionally, miRNA-seq data from the PRJNA562276 project were analyzed to identify exosomal miRNAs associated with castration-resistant prostate cancer. We found 34 differentially expressed miRNAs associated with the progression of castration-resistant prostate cancer during therapy in Russian patients. It was also shown that hsa-miRNA-148a-3p expression can serve as a potential prognostic marker. We found the exosomal miRNA expression signature associated with castration-resistant prostate cancer progression, in particular on the Russian patient cohort. Many of these miRNAs are well-known players in either oncogenic transformation or tumor suppression. Further experimental studies with extended sampling are required to validate these results.
Prostate cancer (PCa) is one of the urgent problems of modern oncology and is characterized by high incidence rates among men [1]. The main method of treatment for patients with advanced stages of PCa is androgen deprivation. However, the progression of the tumor process against the background of the castration level of testosterone after temporary stabilization is observed in most patients. These patients are moving into the category of castration-resistant prostate cancer (CRPC), which is a prognostically unfavorable form of the disease that significantly impairs the quality of life of patients.
Despite a wide range of therapeutic options, such as cytotoxic chemotherapy agents, androgen receptor blockers, immunotherapy, and radiopharmaceuticals, metastatic CRPC remains incurable [2]. In addition, patients inevitably develop resistance to therapy, which is usually diagnosed on the basis of biochemical and radiological progression, and is a serious problem in oncourology.
Therapeutic resistance is expressed as a decrease in the effectiveness and ability of drugs to have a therapeutic effect, which is one of the key problems in cancer treatment [3]. Acquired drug resistance is a stepwise process during which significant molecular genetic events occur in tumor cells, resulting in the formation of a drug-resistant phenotype [4].
Thus, informative markers of response to therapy are needed to identify the initial manifestations of resistance to ongoing therapy and timely change the therapeutic approach for the patient. Currently, a promising direction for monitoring response to therapy in patients with predominant stages of various types of cancer is the search for biomarkers based on minimally invasive liquid biopsy [5, 6, 7]. Exosomes found in various biological fluids are of particular interest as a source of potential markers of liquid biopsy.
Exosomes are extracellular vesicles approximately 40–160 nm in size (~100 nm on average) composed of a lipid bilayer membrane that surrounds a small portion of the cytosolic content but does not include any cytoplasmic organelles [8]. Numerous studies have shown that exosomes can carry various functional molecules, including proteins, lipids, and nucleic acids (DNA, mRNA, lncRNA, microRNA, etc.) obtained from the parent cell [9]. In the case of tumor cells, exosomes can potentially reflect the molecular genetic features of the tumor [10].
Exosomes play an important role in the regulation of intercellular interaction, including due to the protection of their contents from environmental conditions, which emphasizes their attractiveness for research [11]. An increased number of exosomes is usually secreted by tumor cells, often correlating between the stage of the disease and its progression. These vesicles mediate intercellular communication and perform important functions in tumor biology, such as proliferation induction, angiogenesis, and metastasis [12, 13, 14]. Recently, there has been a growing body of evidence highlighting the important role of exosomes in modulating tumor-specific chemoresistance strategies that lead to the induction of tumor drug resistance [15, 16, 17]. It has been shown that exosomes from chemosensitive/resistant tumor cells can markedly influence other tumor cells during chemotherapy through the transfer of specific regulatory molecules [18].
Thus, there are a number of fundamental questions about the molecular basis of tumor resistance to various drugs. The aim of our study is to identify the profile of exosomal miRNAs in the blood plasma of Russian patients with CRPC associated with initial manifestations of therapy resistance. Evaluation of the prognostic potential of these molecules, as well as consideration of potential therapeutic targets based on key molecular events, is especially important for predicting therapeutic efficacy/resistance to therapy, patient prognosis, and the development of precision cancer medicine.
The study included 49 plasma samples from 11 Russian patients with metastatic CRPC during therapy (docetaxel/abiraterone), obtained under observation in the P.A. Hertzen Moscow Oncology Research Center (branch of the National Medical Research Radiological Center, Ministry of Health of the Russian Federation) in 2016–2020. The main clinicopathological characteristics of patients are presented in Table 1.
| Patients | Age | Gleason score | PSA at diagnosis, ng/mL | Therapy | Radionuclide study of the skeletal system |
| 1 | 66 | 9 (5 + 4) | 3000 | Docetaxel | multiple bone metastasis |
| 2 | 68 | 8 (4 + 4) | 1900 | Docetaxel | bone metastasis |
| 3 | 66 | - | 5 | Abiraterone | bone metastasis |
| 4 | 65 | - | 428 | Abiraterone | bone metastasis |
| 5 | 61 | 8 (4 + 4) | 23 | Docetaxel | multiple bone metastasis |
| 6 | 68 | 8 (4 + 4) | 124 | Docetaxel | bone metastasis |
| 7 | 70 | 8 (4 + 4) | 72 | Docetaxel | bone metastasis |
| 8 | 73 | 8 (4 + 4) | 2950 | Docetaxel | bone metastasis |
| 9 | 66 | 8 (4 + 4) | 334 | Docetaxel | bone metastasis |
| 10 | 67 | 9 (4 + 5) | 25 | Abiraterone | bone metastasis |
| 11 | 61 | 7 (4 + 3) | 15 | Abiraterone | bone metastasis |
To create a collection of exosomal RNA, blood was taken into EDTA vacutainers, which were then subjected to double centrifugation at 4 °C (the first step of centrifugation –20 minutes at 300 g, the second step of centrifugation –10 minutes at 14,000 g) followed by storage at –80 °C.
All plasma samples were tested for hemolysis by color scoring according to the metric hemolysis score on the color scale. Hemolysis was also assessed by measuring free hemoglobin uptake in samples at 414 nm using a NanoDrop™ 1000 spectrophotometer (Thermo Scientific, USA).
The studied samples were divided into several conditional groups during the observation process in accordance with the dynamics of the prostate specific antigen (PSA) level in each patient during treatment: period P0—start of therapy, period P1—response to therapy (stable low PSA level of the patient), period P2—(patient’s initial increase in PSA level), period P3—(elevated PSA level in a patient).
The study also analyzed exosomal miRNAs profiling data from the PRJNA562276 project (treatment-naive PCa patients n = 24, CRPC patients n = 24) to confirm the involvement of certain circulating miRNAs in the CRPC category [19].
To assess the dynamics of response to therapy in patients with CRPC, an enzyme-linked immunosorbent assay for the concentration of PSA in each blood plasma sample was performed using the “total PSA—option 1” reagent kit (Vector-Best, Russia). The assay was performed in three technical replicates according to the manufacturer’s protocol. The registration of the obtained results was carried out on an iMark™ Microplate Absorbance Reader spectrophotometer (BioRad, USA) at a main wavelength of 450 nm and a reference wavelength in the range of 620–655 nm.
Blood plasma samples were subjected to additional purification through
specialized filters with a pore size of 0.8
During RNA isolation, cel-miR-39 (Norgene, Canada) was added to each sample as a normalization control according to the manufacturer’s protocol. The concentration of isolated total RNA was assessed on a Quibit 4.0 fluorimeter (Thermo Fisher Scientific, USA) using the Qubit microRNA Assay Kit (Thermo Fisher Scientific, USA).
miRNAs libraries were prepared using the NEBNext Small RNA Library Prep Set for Illumina (New England Biolabs, USA) according to the manufacturer’s protocol. Selection of the miRNA fraction was carried out using electrophoretic separation of fragments in a 6% polyacrylamide gel, followed by extraction and concentration in accordance with the manufacturer’s protocol.
The concentration of the resulting libraries was measured on a Quibit 4.0 fluorimeter using the Qubit dsDNA HS Assay Kit (Thermo Fisher Scientific, USA). The quality of the resulting libraries was assessed on an Agilent Bioanalyzer 2100 instrument using the Agilent High Sensitivity DNA Kit (Thermo Fisher Scientific, USA) in accordance with the manufacturer’s protocol. The size of the resulting miRNA libraries was ~147 bp.
High throughput sequencing of miRNA libraries was performed on a NextSeq 500 System (Illumina) using NextSeq 500/550 High Output Kit v2.5 (Illumina) in 36 bp single-ended read mode. Sequencing was carried out on the basis of the Center for Collective Use “Genome” of the EIMB RAS (http://www.eimb.ru/ru1/ckp/ccu_genome_c.php). As a result of the sequencing for each sample, at least 8 million reads were obtained.
For the obtained miRNA-seq data in the fastq format, the quality was assessed using the FastqQC and MultiQC programs (https://www.bioinformatics.babraham.ac.uk/projects/fastqc/). The miRge 2.0 pipeline was used for data processing [22]. Data on the number of obtained transcripts miRNA (counts) were obtained using the featureCounts [23].
Differential miRNA expression analysis was performed in the R statistical
environment using the edgeR package [24]. To normalize the data, the TMM (Trimmed
Mean of M-values) method was used, followed by the calculation of the CPM (counts
per million) parameter. When analyzing the differential expression of miRNAs, the
following quasi-likelihood F-test (QLF test), Wilcoxon test (W test) for
comparisons in paired mode were applied. Spearman’s rank correlation coefficient
(r
To analyze the enrichment of pathways based on miRNA-Seq data, the mirPath 3.0
tool of the DIANA Tools web service was used [25]. The results obtained were
considered significant at p-value
Survival analysis using the Cox regression model was performed with Jupyter
Notebook, Python (ver. 3.6), native libraries and ‘Lifelines’ library
(Kaplan-Meier, COX). Results were presented as hazard ratio (HR) and 95%
confidence intervals (CI) and were considered significant at p
cDNA was obtained from the miRNA template using the TaqMan Advanced miRNA cDNA Synthesis Kit (Thermo Fisher Scientific, USA) according to the manufacturer’s protocol.
qPCR was carried out in three technical repeats on an Applied Biosystems 7500 instrument (Thermo Fisher Scientific, USA). cel-miR-39 served as a reference miRNA. For the detection of control and target miRNAs, commercial sets of primers and probes TaqMan™ Advanced miRNA Assay (Thermo Fisher Scientific, USA) were used: 477814_mir (miR-148a-3p), 478293_mir (cel-miR-39).
The level of relative miRNA expression for each study period was calculated by the dCT method. Statistical analysis of relative miRNA results was performed in the R statistical environment using standard packages.
First of all, we analyzed the differential expression (DE) of exosomal miRNAs
between the P1 and P3 periods during CRPC therapy. The statistical significance
level of the QLF, W and r
| miRs | LogFC | LogCPM | p (QLF) | p (W) | r |
p (r |
| hsa-let-7f-5p | –1.34 | 15.02 | 3.03 × 10 |
9.77 × 10 |
–0.64 | 1.41 × 10 |
| hsa-let-7g-5p | –1.80 | 13.96 | 2.07 × 10 |
9.77 × 10 |
–0.72 | 1.41 × 10 |
| hsa-miR-1-3p | –2.73 | 12.01 | 9.69 × 10 |
9.77 × 10 |
–0.42 | 4.99 × 10 |
| hsa-miR-122-5p | 2.71 | 11.85 | 6.78 × 10 |
4.88 × 10 |
0.71 | 2.19 × 10 |
| hsa-miR-125b-1-3p | –9.24 | 9.10 | 1.55 × 10 |
3.46 × 10 |
–0.46 | 3.20 × 10 |
| hsa-miR-125b-2-3p | –3.20 | 10.07 | 2.35 × 10 |
9.77 × 10 |
–0.43 | 4.75 × 10 |
| hsa-miR-126-3p | 1.16 | 14.48 | 1.23 × 10 |
3.22 × 10 |
0.54 | 9.91 × 10 |
| hsa-miR-1275 | –5.41 | 5.15 | 3.94 × 10 |
2.25 × 10 |
–0.52 | 1.24 × 10 |
| hsa-miR-1307-3p | 1.75 | 10.05 | 1.15 × 10 |
9.77 × 10 |
0.74 | 8.85 × 10 |
| hsa-miR-132-3p | –7.20 | 7.04 | 1.49 × 10 |
1.91 × 10 |
–0.45 | 3.44 × 10 |
| hsa-miR-132-5p | –7.53 | 5.45 | 9.23 × 10 |
2.09 × 10 |
–0.65 | 1.03 × 10 |
| hsa-miR-143-3p | –2.74 | 18.35 | 3.31 × 10 |
6.84 × 10 |
–0.48 | 2.38 × 10 |
| hsa-miR-145-3p | –2.45 | 9.01 | 1.58 × 10 |
8.05 × 10 |
–0.43 | 4.86 × 10 |
| hsa-miR-148a-3p | –2.49 | 18.26 | 9.02 × 10 |
9.77 × 10 |
–0.75 | 5.38 × 10 |
| hsa-miR-148b-3p | –1.83 | 11.25 | 3.22 × 10 |
9.77 × 10 |
–0.77 | 3.17 × 10 |
| hsa-miR-152-3p | –2.46 | 10.49 | 8.48 × 10 |
9.77 × 10 |
–0.61 | 2.62 × 10 |
| hsa-miR-185-3p | –9.01 | 7.06 | 1.50 × 10 |
9.15 × 10 |
–0.68 | 4.89 × 10 |
| hsa-miR-21-3p | –7.53 | 5.27 | 5.55 × 10 |
2.25 × 10 |
–0.67 | 6.95 × 10 |
| hsa-miR-221-5p | –6.82 | 5.36 | 2.98 × 10 |
8.05 × 10 |
–0.72 | 1.59 × 10 |
| hsa-miR-23a-3p/23b-3p | –1.79 | 11.60 | 2.71 × 10 |
9.77 × 10 |
–0.74 | 8.85 × 10 |
| hsa-miR-27a-3p/27b-3p | –1.27 | 13.67 | 9.18 × 10 |
9.77 × 10 |
–0.61 | 2.63 × 10 |
| hsa-miR-29b-3p | –6.95 | 5.95 | 1.18 × 10 |
5.92 × 10 |
–0.72 | 1.59 × 10 |
| hsa-miR-30e-3p | –1.43 | 11.40 | 2.84 × 10 |
1.37 × 10 |
–0.45 | 3.49 × 10 |
| hsa-miR-320a-3p | 1.81 | 11.96 | 1.29 × 10 |
1.95 × 10 |
0.75 | 5.38 × 10 |
| hsa-miR-342-5p | 1.75 | 9.35 | 3.64 × 10 |
9.77 × 10 |
0.62 | 1.94 × 10 |
| hsa-miR-378a-3p | –2.14 | 12.28 | 7.18 × 10 |
1.37 × 10 |
–0.55 | 7.78 × 10 |
| hsa-miR-423-5p | 2.37 | 13.54 | 4.51 × 10 |
9.77 × 10 |
0.69 | 3.31 × 10 |
| hsa-miR-424-3p | 6.50 | 6.06 | 2.58 × 10 |
1.29 × 10 |
0.57 | 5.20 × 10 |
| hsa-miR-4446-3p | 4.15 | 7.33 | 1.55 × 10 |
9.15 × 10 |
0.61 | 2.61 × 10 |
| hsa-miR-483-5p | 4.68 | 7.47 | 1.10 × 10 |
8.05 × 10 |
0.58 | 5.10 × 10 |
| hsa-miR-574-5p | –7.16 | 7.73 | 1.07 × 10 |
8.05 × 10 |
–0.59 | 4.06 × 10 |
| hsa-miR-582-3p | –7.65 | 7.94 | 1.72 × 10 |
1.95 × 10 |
–0.71 | 2.40 × 10 |
| hsa-miR-744-5p | 1.77 | 10.10 | 1.04 × 10 |
9.77 × 10 |
0.59 | 3.51 × 10 |
| hsa-miR-9-5p | –7.11 | 6.78 | 4.76 × 10 |
9.15 × 10 |
–0.58 | 4.72 × 10 |
 Fig. 1.
Heatmap demonstrating log relative expression level of top differentially expressed exosomal miRNAs between the P1 and P3 periods. Cell colors (blue-white-red gradient) correspond to the binary logarithm of the ratio of the expression level in a current sample to the average level across all the samples (per each miRNA). Blue, expression level is below the average; red, above the average.
DE exosomal miRNAs were then analyzed between the remaining periods of CRPC
therapy. The level of statistical significance for QLF, W and r
| miRs | LogFC | LogCPM | p (QLF) | p (W) | r |
p (r |
| hsa-let-7g-5p | –0.37 | 13.9 | 3.41 × 10 |
2.44 × 10 |
–0.57 | 6.04 × 10 |
| hsa-miR-148a-3p | –0.44 | 17.93 | 2.42 × 10 |
4.37 × 10 |
–0.47 | 2.89 × 10 |
| hsa-miR-122-5p | 0.7 | 12.25 | 1.55 × 10 |
1.37 × 10 |
0.55 | 7.78 × 10 |
| hsa-miR-193a-5p | 2.83 | 6.92 | 6.96 × 10 |
2.09 × 10 |
0.64 | 1.50 × 10 |
| hsa-miR-320a-3p | 0.57 | 12.5 | 6.19 × 10 |
2.44 × 10 |
0.51 | 1.56 × 10 |
| hsa-miR-342-5p | 0.6 | 9.69 | 3.99 × 10 |
9.77 × 10 |
0.62 | 1.94 × 10 |
| hsa-miR-423-5p | 0.47 | 14.09 | 7.76 × 10 |
3.22 × 10 |
0.47 | 2.89 × 10 |
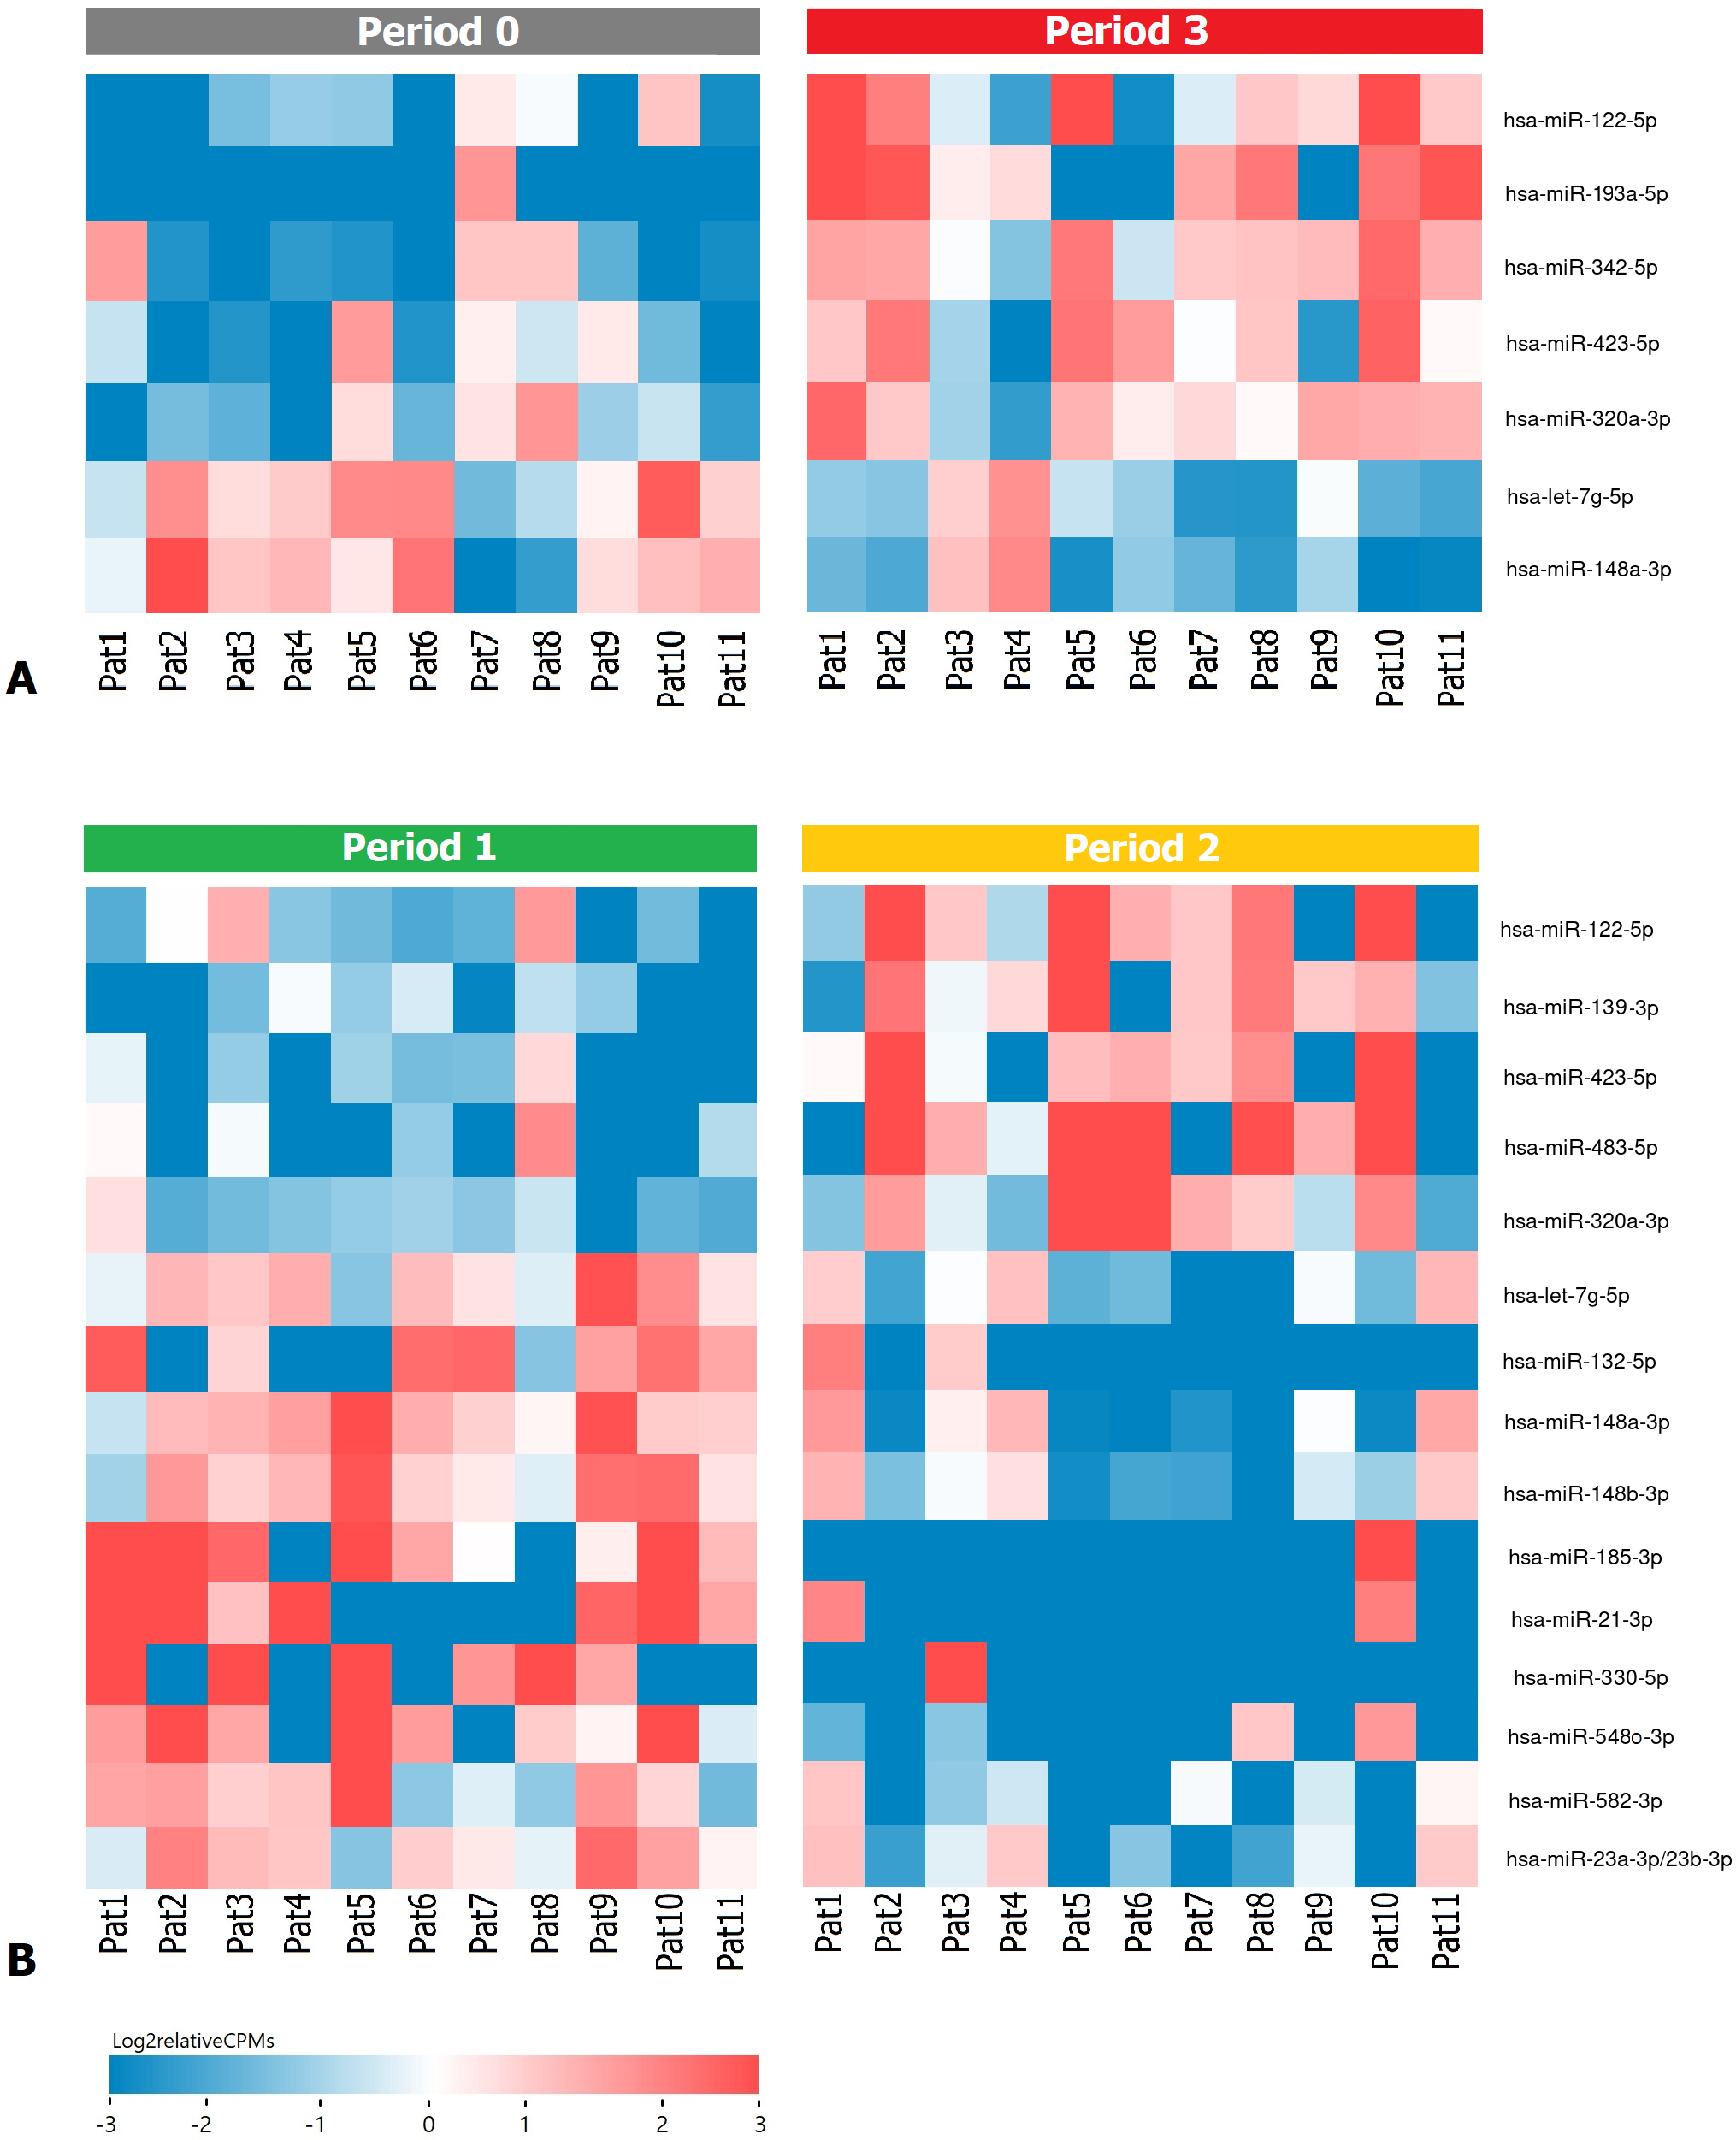 Fig. 2.
Heatmap demonstrating log relative expression level of top differentially expressed exosomal miRNAs (A) between the P0 and P3 periods (B) between the P1 and P2 periods. Cell colors (blue-white-red gradient) correspond to the binary logarithm of the ratio of the expression level in a current sample to the average level across all the samples (per each miRNA). Blue, expression level is below the average; red, above the average.
As a result of the DE analysis between P1 and P2 periods, 15 statistically
significant miRNAs were identified (Table 4, Fig. 2B). However, in the case of DE
analysis between P2 and P3 periods, a statistically significant result was
obtained only for hsa-miR-423-5p (LogFC = 0.66; LogCPM = 14.38; p (QLF)
= 3.49
| miRs | LogFC | LogCPM | p (QLF) | p (W) | r |
p (r |
| hsa-let-7g-5p | –1.23 | 13.82 | 6.99 × 10 |
2.44 × 10 |
–0.52 | 1.25 × 10 |
| hsa-miR-122-5p | 1.67 | 11.45 | 5.36 × 10 |
1.37 × 10 |
0.42 | 5.00 × 10 |
| hsa-miR-132-5p | –6.13 | 5.31 | 2.57 × 10 |
2.09 × 10 |
–0.55 | 8.33 × 10 |
| hsa-miR-139-3p | 3.39 | 7.86 | 8.59 × 10 |
9.77 × 10 |
0.57 | 5.69 × 10 |
| hsa-miR-148a-3p | –1.71 | 18.34 | 3.14 × 10 |
4.20 × 10 |
–0.49 | 1.94 × 10 |
| hsa-miR-148b-3p | –1.4 | 11.2 | 1.95 × 10 |
2.44 × 10 |
–0.58 | 4.63 × 10 |
| hsa-miR-185-3p | –8.93 | 7.15 | 1.22 × 10 |
9.15 × 10 |
–0.67 | 7.33 × 10 |
| hsa-miR-21-3p | –4.85 | 5.23 | 4.50 × 10 |
2.25 × 10 |
–0.49 | 2.05 × 10 |
| hsa-miR-23a-3p/23b-3p | –1.38 | 11.47 | 1.76 × 10 |
2.44 × 10 |
–0.51 | 1.56 × 10 |
| hsa-miR-320a-3p | 1.41 | 11.66 | 1.26 × 10 |
3.22 × 10 |
0.51 | 1.56 × 10 |
| hsa-miR-330-5p | –4.71 | 4.92 | 4.39 × 10 |
3.60 × 10 |
–0.48 | 2.50 × 10 |
| hsa-miR-423-5p | 1.51 | 12.96 | 2.72 × 10 |
9.77 × 10 |
0.55 | 7.78 × 10 |
| hsa-miR-483-5p | 4.32 | 7.09 | 2.81 × 10 |
2.49 × 10 |
0.44 | 4.02 × 10 |
| hsa-miR-548o-3p | –4.71 | 6.09 | 2.23 × 10 |
1.29 × 10 |
–0.54 | 9.22 × 10 |
| hsa-miR-582-3p | –3.49 | 8.21 | 1.19 × 10 |
1.37 × 10 |
–0.55 | 7.36 × 10 |
Additionally, we analyzed the data of the PRJNA562276 project, in the analysis
of which the level of statistical significance for QLF, and r
| miRs | LogFC | LogCPM | p (QLF) | r |
p (r |
| hsa-miR-375-3p | 3.82 | 12.0 | 6.68 × 10 |
0.50 | 3.00 × 10 |
| hsa-miR-99a-5p | 0.81 | 13.0 | 2.00 × 10 |
0.45 | 2.00 × 10 |
| hsa-miR-1246 | 2.49 | 10.7 | 1.00 × 10 |
0.39 | 7.00 × 10 |
| hsa-miR-148a-3p | 0.91 | 14.9 | 2.00 × 10 |
0.36 | 1.00 × 10 |
| hsa-miR-320a-3p | 0.65 | 14.6 | 2.00 × 10 |
0.38 | 8.00 × 10 |
| hsa-miR-30d-5p | 0.57 | 14.1 | 7.00 × 10 |
0.38 | 8.00 × 10 |
| hsa-miR-423-3p | 0.71 | 12.3 | 2.00 × 10 |
0.36 | 1.00 × 10 |
| hsa-miR-451a | –0.49 | 17.5 | 4.00 × 10 |
–0.40 | 5.00 × 10 |
| hsa-miR-21-5p | 0.51 | 14.6 | 5.00 × 10 |
0.33 | 2.00 × 10 |
| hsa-let-7f-5p | 0.33 | 14.2 | 2.00 × 10 |
0.31 | 3.00 × 10 |
| hsa-miR-24-3p | 0.45 | 12.2 | 3.00 × 10 |
0.33 | 2.00 × 10 |
When considering all the obtained lists of DE exosomal miRNAs, we see that
hsa-miR-148a-3p and hsa-miR-320a-3p were found in all. Moreover, the expression
of these miRNAs is presented at a high level (LogCPM
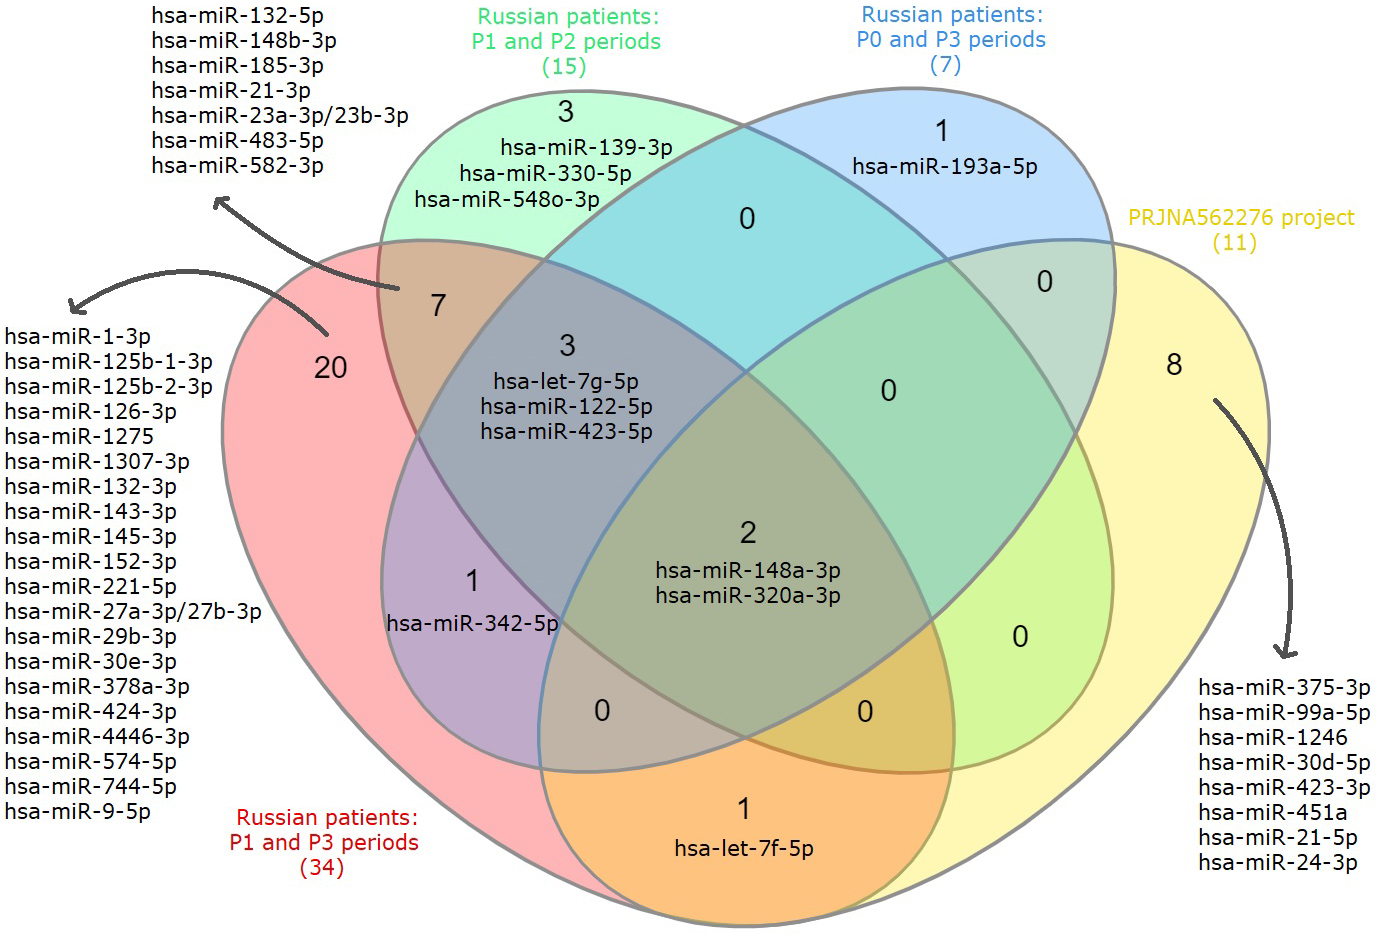 Fig. 3.
Venn diagram showing intersections of DE exosomal miRNAs lists based on the analysis of P0, P1, P2, P3 periods of Russian patients and data from the PRJNA562276 project.
Next, we performed the pathway enrichment analysis for the identified exosomal
miRNAs using the KEGG (Kyoto Encyclopedia of Genes and Genomes) database and
TarBase v7.0 (http://www.microrna.gr/tarbase) for target genes
prediction. For the list of DE of exosomal miRNAs associated with the progression
of CRPC during therapy (comparison between P1 and P3 periods), 29 statistically
significant pathways were identified (p
| KEGG pathway | FDR | #genes | #miRNAs |
| Prion diseases | 4.84 × 10 |
15 | 6 |
| Fatty acid metabolism | 4.84 × 10 |
17 | 9 |
| Viral carcinogenesis | 4.84 × 10 |
117 | 9 |
| Hippo signaling pathway | 4.84 × 10 |
82 | 10 |
| ECM-receptor interaction | 4.84 × 10 |
48 | 11 |
| Fatty acid biosynthesis | 4.84 × 10 |
5 | 12 |
| Lysine degradation | 4.84 × 10 |
31 | 12 |
| Proteoglycans in cancer | 4.84 × 10 |
137 | 14 |
| Glioma | 4.84 × 10 |
44 | 9 |
| Chronic myeloid leukemia | 4.99 × 10 |
55 | 8 |
| Cell cycle | 1.76 × 10 |
68 | 7 |
| TGF-beta signaling pathway | 4.06 × 10 |
52 | 8 |
| Adherens junction | 7.89 × 10 |
52 | 9 |
| Pathways in cancer | 6.58 × 10 |
179 | 5 |
| Hepatitis B | 2.36 × 10 |
74 | 5 |
| Thyroid hormone signaling pathway | 3.12 × 10 |
61 | 5 |
| p53 signaling pathway | 4.66 × 10 |
44 | 7 |
| Steroid biosynthesis | 8.92 × 10 |
8 | 6 |
| Small cell lung cancer | 1.58 × 10 |
55 | 6 |
| FoxO signaling pathway | 1.92 × 10 |
60 | 4 |
| Transcriptional misregulation in cancer | 3.58 × 10 |
61 | 5 |
| Protein processing in endoplasmic reticulum | 8.47 × 10 |
83 | 5 |
| Bacterial invasion of epithelial cells | 2.32 × 10 |
42 | 3 |
| Colorectal cancer | 3.04 × 10 |
30 | 2 |
| Renal cell carcinoma | 8.07 × 10 |
36 | 3 |
| Central carbon metabolism in cancer | 8.12 × 10 |
31 | 4 |
| Non-small cell lung cancer | 8.77 × 10 |
29 | 4 |
| Prostate cancer | 4.45 × 10 |
50 | 4 |
| Oocyte meiosis | 6.60 × 10 |
60 | 6 |
| #, number of genes-targets (genes) or miRNAs. | |||
| KEGG pathway | FDR | #genes | #miRNAs |
| Fatty acid biosynthesis | 1.11 × 10 |
5 | 3 |
| Proteoglycans in cancer | 1.11 × 10 |
118 | 7 |
| Lysine degradation | 1.11 × 10 |
26 | 6 |
| Viral carcinogenesis | 1.33 × 10 |
105 | 7 |
| Hippo signaling pathway | 1.45 × 10 |
77 | 6 |
| Pathways in cancer | 1.14 × 10 |
160 | 5 |
| Prion diseases | 9.52 × 10 |
3 | 1 |
| Chronic myeloid leukemia | 1.74 × 10 |
39 | 4 |
| Cell cycle | 3.56 × 10 |
63 | 3 |
| Colorectal cancer | 5.05 × 10 |
27 | 3 |
| Glioma | 7.44 × 10 |
25 | 3 |
| Oocyte meiosis | 1.03 × 10 |
53 | 4 |
| Hepatitis B | 1.19 × 10 |
55 | 2 |
| Thyroid hormone signaling pathway | 4.31 × 10 |
50 | 3 |
| Transcriptional misregulation in cancer | 5.22 × 10 |
52 | 3 |
| p53 signaling pathway | 1.19 × 10 |
30 | 3 |
| Fatty acid metabolism | 3.88 × 10 |
19 | 3 |
| TGF-beta signaling pathway | 4.14 × 10 |
21 | 2 |
| Adherens junction | 5.06 × 10 |
41 | 4 |
| Bladder cancer | 6.05 × 10 |
22 | 3 |
| FoxO signaling pathway | 2.09 × 10 |
48 | 3 |
| Protein processing in endoplasmic reticulum | 3.52 × 10 |
52 | 2 |
| ECM-receptor interaction | 1.51 × 10 |
13 | 1 |
| Endocytosis | 2.15 × 10 |
59 | 2 |
| Parkinson’s disease | 2.65 × 10 |
6 | 2 |
| Ubiquitin mediated proteolysis | 2.84 × 10 |
37 | 1 |
| Central carbon metabolism in cancer | 3.15 × 10 |
9 | 1 |
| Pancreatic cancer | 4.41 × 10 |
20 | 1 |
| Mucin type O-Glycan biosynthesis | 6.20 × 10 |
8 | 1 |
| Thyroid cancer | 6.83 × 10 |
9 | 2 |
| #, number of genes-targets (genes) or miRNAs. | |||
When comparing the results obtained for the two data sets, a match was shown in 23 pathways. Unique pathways for these exosomal miRNAs associated with CRPC progression are: ‘Steroid biosynthesis’, ‘Small cell lung cancer’, ‘Bacterial invasion of epithelial cells’, ‘Renal cell carcinoma’, ‘Non-small cell lung cancer’ and ‘Prostate cancer’. Previously, we also performed a transcriptome analysis of samples of distant CRPC metastases from the WCDT-CRPC project of the TСGA consortium, which resulted in a list of enriched pathways whose expression of involved genes is associated with time to relapse in patients receiving therapy [26]. When comparing the results obtained for these distant metastases datasets with miRNA data, we see the intersection of the following signaling pathways: “Hippo signaling pathway”, “TGF-beta signaling pathway” and “Transcriptional dysregulation in cancer”. The results for the intersection of pathways are shown in the Fig. 4.
 Fig. 4.
Venn diagram showing enriched pathways for identified exosomal miRNAs based on data from the PRJNA562276 project, Russian patients cohort and WCDT-CRPC project of the TCGA consortium.
A Cox proportional hazards model was constructed to explore the relationship
between time to progression in the patient and the expression of a number of
identified miRNAs as predictor variables. Samples from patients of all considered
periods (n = 49) were used for analysis. The model included the most abundant
exosomal miRNAs in the samples from the previously identified profile (LogCPM
As a result of the analysis, the values of the risk coefficients for the characteristics we have chosen were found (Table 8, Fig. 5). The concordance of this model is 0.73. A high and statistically significant HR was shown for hsa-miR-148a-3p and is 2.05 (p = 0.005), indicating a strong association between the expression of this miRNA and a high risk of CRPC progression during therapy.
 Fig. 5.
Results of survival analysis using the Cox regression model based on DE of exosomal miRNAs in the Russian patients cohort with CRPC (A) Plot of the Cox regression model covariates. Point estimates and 95% confidence intervals of the relative risks for 10 covariates in a Cox regression model of overall survival. (B) Survival curve based on the Cox regression model.
| Covariate | HR | HR lower 95% | HR upper 95% | p |
| hsa-let-7g-5p | 1.37 | 0.53 | 3.57 | 0.52 |
| hsa-miR-122-5p | 0.65 | 0.10 | 4.39 | 0.66 |
| hsa-miR-148a-3p | 2.05 | 1.29 | 3.25 | 0.005 |
| hsa-miR-23a-3p/23b-3p | 1.16 | 0.53 | 2.57 | 0.71 |
| hsa-let-7f-5p | 0.48 | 0.21 | 1.08 | 0.08 |
| hsa-miR-126-3p | 1.76 | 0.90 | 3.43 | 0.10 |
| hsa-miR-143-3p | 0.96 | 0.73 | 1.26 | 0.77 |
| hsa-miR-744-5p | 1.03 | 0.54 | 1.96 | 0.92 |
| hsa-miR-423-5p | 1.12 | 0.62 | 2.04 | 0.71 |
| therapy | 1.14 | 0.53 | 2.48 | 0.74 |
Exosomal hsa-148a-3p was selected for validation based on statistically significant DE analysis results between periods P1/P3 (baseline comparison), periods P0/P3, P1/P2, and Cox regression analysis. The level of hsa-miR-148a-3p relative expression was assessed by qPCR in plasma samples from Russian patients between all periods under consideration.
As a result of the validation, a statistically significant difference was confirmed between the periods P1 and P3 (p (W) = 0.02), as well as between the periods P0 and P3 (p (W) = 0.03). No statistically significant difference was found based on the relative expression of hsa-miR-148a-3p between periods P1 and P2 (p (W) = 0.08) (Fig. 6).
 Fig. 6.
Relative expression of hsa-miR-148a-3p in plasma samples from Russian patients according to P0, P1, P2 and P3 periods based on qPCR results.
The development of drug resistance in patients with CRPC is one of the most
important clinical problems, which may be based on both genetic changes and
interactions in the tumor microenvironment [27]. miRNAs in exosomes can be key
regulators of the resistance mechanism in cancer, which has been repeatedly
emphasized by various studies. We first looked at enriched pathways that are
potentially associated with both the development of CRPC and progression during
therapy. After comparing the obtained results, including those of the WCDT-CRPC
project, it was shown that the pathways ‘Hippo signaling pathway’, ‘TGF-
TGF-
More detailed studies of these signaling pathways and their key genes involved in the aspect of CRPC will help identify new therapeutic targets to improve the effectiveness of CRPC treatment. We also analyzed exosomal DE miRNAs as potentially significant regulators in CRPC. It is known that miRNAs are small non-coding RNAs that can play both oncogenic and tumor-suppressing roles, regularizing many cellular processes such as invasion, metastasis, apoptosis, epithelial-mesenchymal cell transition, chemoresistance, and others at the post-transcriptional level [40]. Based on the obtained differential expression parameters, statistical tests performed and survival analysis using the Cox regression model, it was shown that hsa-miR-148a-3p is the most promising prognostic marker in CRPC based on liquid biopsy.
hsa-miR-148a-3p is one of the most highly expressed miRNAs in PCa tissues, as
well as the most dominant in PCa metastasis [41]. Various studies have shown that
high-grade tumors exhibit reduced levels of hsa-miR-148a-3p expression. It has
also been shown that hsa-miR-148a-3p expression is downregulated in
docetaxel-resistant variants of PCa cell lines, including PC-3 and DU145, and
that hsa-miR-148a-3p is downregulated in PCa with a risk of biochemical
recurrence. In addition, it has been shown that this tumor-suppressing miRNA can
be downregulated in CRPC, which has been shown in PC3 cell culture leading to
cancer progression and resistance to androgen deprivation therapy [42]. Based on
our data on profiling exosomal miRNAs in the blood plasma of patients with CRPC
during therapy, it was also shown that the differential expression of
hsa-miR-148a-3p statistically significantly decreases with the progression of
CRPC and is characterized by a strong correlation (LogFC = –2.49; r
In addition, a strong relationship was shown between the expression of this
miRNA and a high risk of CRPC progression during therapy (HR = 2.05; p
Based on our results, as well as various literature data, a significant role of hsa-miR-148a-3p in the progression of CRPC is emphasized, which requires further study on an expanded sample with additional validation methods.
Thus, we obtained data on exosomal miRNA profiling during therapy in patients with metastatic CRPC. Signaling pathways associated with increased PSA levels during therapy have been identified, which contributes to the understanding of the molecular events underlying tumor progression in CRPC at the transcriptomic level. The identified signaling pathways and miRNAs with significant and specific expression, especially hsa-miR-148a-3p, can be further considered as new therapeutic targets and additional informative markers for assessing the aggressiveness of the tumor process.
PCa, prostate cancer; CRPC, castration-resistant prostate cancer; PSA, prostate
specific antigen; NGS, next generation sequencing; TMM, Trimmed Mean of M-values;
CPM, counts per million; QLF test, quasi-likelihood F-test; W test, Wilcoxon
test; r
AVK, KMN, BYA conceived and designed the work; EAP, IVK, MSF, ZGG, VSP, MVS performed the experiments; GSK, EAP, AAKo, AAKu analyzed the data; EAP, GSK and AVS wrote the manuscript. All authors read and approved the final manuscript.
The study was approved by The Ethics committee of P.A. Hertzen Moscow Oncology Research Center, Ministry of Health of the Russian Federation. The study was done in accordance with the principles outlined in the Declaration of Helsinki (1964). All patients gave their informed consent for participation in the study.
The authors thank the National Medical Research Radiological Center for providing the samples and their characterization. This work was performed using the equipment of the EIMB RAS “Genome” center (http://www.eimb.ru/rus/ckp/ccu_genome_c.php).
This work was financially supported by the Russian Science Foundation, grant 22-24-01093. The funding body played no role in the design of the study and collection, analysis, and interpretation of data and in writing the manuscript.
The authors declare no conflict of interest.