
† These authors contributed equally.
The spontaneous changes in brain activity in patients with diabetic optic neuropathy using steady-state fMRI. The fractional amplitude of the low-frequency fluctuation method was applied to evaluate neural activity changes. The Hospital Anxiety and Depression Scale was used to assess the anxiety and depression status of participants. The independent sample t-test and chi-squared test were applied to analyze the demographics of diabetic optic neuropathy patients and healthy controls. Receiver operating characteristic curves were applied to analyze the variation in mean fractional amplitude of low-frequency fluctuation values between diabetic optic neuropathy patients and healthy controls. Pearson’s correlation analysis analyzed the relationships between the fractional amplitude of low-frequency fluctuation values of brain regions and clinical behaviors in the diabetic optic neuropathy group. The fractional amplitude of low-frequency fluctuation value of diabetic optic neuropathy patients was significantly higher than healthy controls in the right precentral gyrus. However, the fractional amplitude of low-frequency fluctuation values in the right anterior cingulate gyrus and left middle cingulate gyrus were markedly decreased in diabetic optic neuropathy patients. The area under the curve of receiver operating characteristics for each brain region showed high accuracy. Pearson’s correlation analysis showed that fractional amplitude of low-frequency fluctuation values of the right anterior cingulate gyrus and left middle cingulate gyrus was negatively correlated with Hospital Anxiety and Depression Scale scores. The fractional amplitude of low-frequency fluctuation values of the left middle cingulate gyrus was negatively correlated with diabetic optic neuropathy disease duration. In conclusion, we found abnormal spontaneous brain activities in regions related to cognitive and emotional dysfunction, eye movement disorder, and vision loss in patients with diabetic optic neuropathy. These results may indicate the underlying neuropathological mechanisms of diabetic optic neuropathy and show that fractional amplitude of low-frequency fluctuation may be an effective method to distinguish patients with diabetic optic neuropathy from healthy individuals.
The incidence of diabetes has increased in recent years, making it one of the major diseases affecting public health globally. Diabetes is a metabolic disease with systemic effects. Complications often occur in tissues and organs such as the eyes, kidneys, heart, blood vessels, and nerves [1, 2]. Ocular complications include diabetic retinopathy, macular edema, and cataracts. Neuropathy is a complication of diabetes that affects the central and sensory nerve endings, with manifestations such as skin numbness, diabetic nephropathy, and diabetic foot problems. When the optic nerve is involved, it is known as diabetic optic neuropathy (DON).
DON is an important clinical blindness factor [3]. DON may be found in the form of optic disc neovascularization, Wolfram syndrome, diabetic papillitis, or anterior ischemic optic neuropathy [4]. Patients with DON have varying degrees of decline in visual function, which will eventually seriously affect their life quality and physical and mental health. Due to anatomical structure, the diagnosis of DON mainly relies on clinical symptoms and routine fundus examination, including visual evoked potential (VEP) and fundus fluorescein angiography (FFA) [5, 6].
Composed of many pyramidal neurons, the precentral gyrus (PCG) is the cortical motor center. In the brain of anesthetized monkeys, the PCG controlled defensive actions, including eye movements [7]. An earlier work [8] also showed that cortical electrical stimulation of the frontal gyrus and PCG could lead to eye movement. Thus, there may be a close link between the abnormal activity of the precentral gyrus and eye movement disorder.
Hong et al. [9] demonstrated that the functional activity of the frontal gyrus was reduced in people with restricted eye movement to the designated target incomitant strabismus patients. Researchers found a significant reduction of gray matter volume (GMV) in the precentral gyrus and a reduction of the white matter volume (WMV) in the right premotor cortex [10]. Compared with HCs, patients with mild frontotemporal degeneration (FTLD) also showed PCG degeneration and lower eye movement speed [11]. Patients with schizophrenia reportedly have reduced exploratory eye movements and significantly decreased GMV values in the bilateral PCG [12]. In addition, a positive correlation was found between the speed of eye movement and GMV values in the bilateral PCG, indicating that PCG dysfunction may explain eye movement disorder in these patients.
Shi et al. [13] found that the lower voxel-mirrored homotopic connectivity (VMHC) value in the precentral gyrus of patients with corneal ulcer than in those without suggests that it may in part explain ocular movement dysfunction in this condition.
Using the voxel-based DC method, Cai et al. [14] studied changes in the functional brain network of primary angle-closure glaucoma patients. They found significantly higher DC values in PCG after than before glaucoma surgery. THE voxel-based DC value in this region is also reportedly decreased in patients with comitant exotropia strabismus, and regional homogeneity (ReHo) value in PCG patients with strabismus and amblyopia is lower than in controls [15, 16].
All of these findings indicate an association between PCG and eye movements. We found a higher fALFF value in the PCG, indicating enhanced brain activity in PCG in patients with DON. On this basis, we speculate that increased fALFF value in PCG may reflect a compensatory mechanism for ocular movement disorder in patients with DON.
The cingulate gyrus consists of four sub-regions: anterior cingulate gyrus (ACG), middle cingulate gyrus (MCG), posterior cingulate gyrus, and retrosplenial cingulate gyrus [17]. Having many nerve fiber connections with other parts of the brain, the cingulate gyrus participates in maintaining arousal, regulating the body’s emotional, memory, cognitive, and executive functions [18]. Using independent component analysis of rs-fMRI, researchers have found significantly lower activation of the cingulate gyrus in early Parkinson’s disease patients than in healthy controls [19]. Lower functional connectivity in the ACG and MCG was also observed in patients with schizophrenia [20, 21].
Bürger et al. [22], whole-brain and a multivariate pattern classification analysis of rs-fMRI were used to study brain activity in patients with emotional disorders. They found significantly decreased ACG activation in patients with the major depressive disorder than in those with bipolar disorder or healthy controls, which potentially indicates impaired bottom-up emotional processing and abnormal automatic emotion regulation. Additionally, patients with chronic tinnitus also had abnormal ALFF value in the cingulate gyrus, which was thought to be related to psychological problems including stress, anxiety, inattention, and insomnia [23]. Consistent with the above results demonstrated significantly decreased fALFF values in the RACG and LMCG. Additionally, fALFF values in RACG and LMCG were negatively correlated with HADS scores, and fALFF values in the LMCG were negatively correlated with disease duration in DON, indicating that changed brain activities in the RACG and LMCG are associated with emotional dysfunction in DON patients.
However, activity in the cingulate gyrus may also be related to visual function since ACG receives afferent neurons from the thalamus. Hence, it can be deduced that the cingulate gyrus is related to visual function. Earlier work [24] found that the ReHo values of the left marginal lobe/ACG and the right marginal lobe/ACG were significantly reduced after eye enucleation, suggesting reduced visual signals after the surgery. Similarly, previous research has also found a significantly decreased GMV value of RACG in monocular blindness, indicating a disturbance of synchronous nerve activity in these patients [25]. A decrease in fALFF of ACG in monocular blindness further confirmed this conclusion [26].
Zhai et al. [27] analyzed the role of perceptual learning in the treatment of amblyopia using fMRI. They reported that the cingulate gyrus and visual cortex activity were significantly increased in patients after treatment, suggesting a deficit of the cingulate cortex as a cause of amblyopia.
Fig. 1 shows the results of retinal fundus photography and FFA of healthy people and DON patients. However, clinical manifestations of DON are diverse. So, the diagnosis of DON is difficult from diabetic retinopathy and macular edema due to the lack of specific clinical symptoms and specific changes in ophthalmic examination results. Compared with other ocular complications, few studies focus on DON, and its pathogenesis remains unclear.
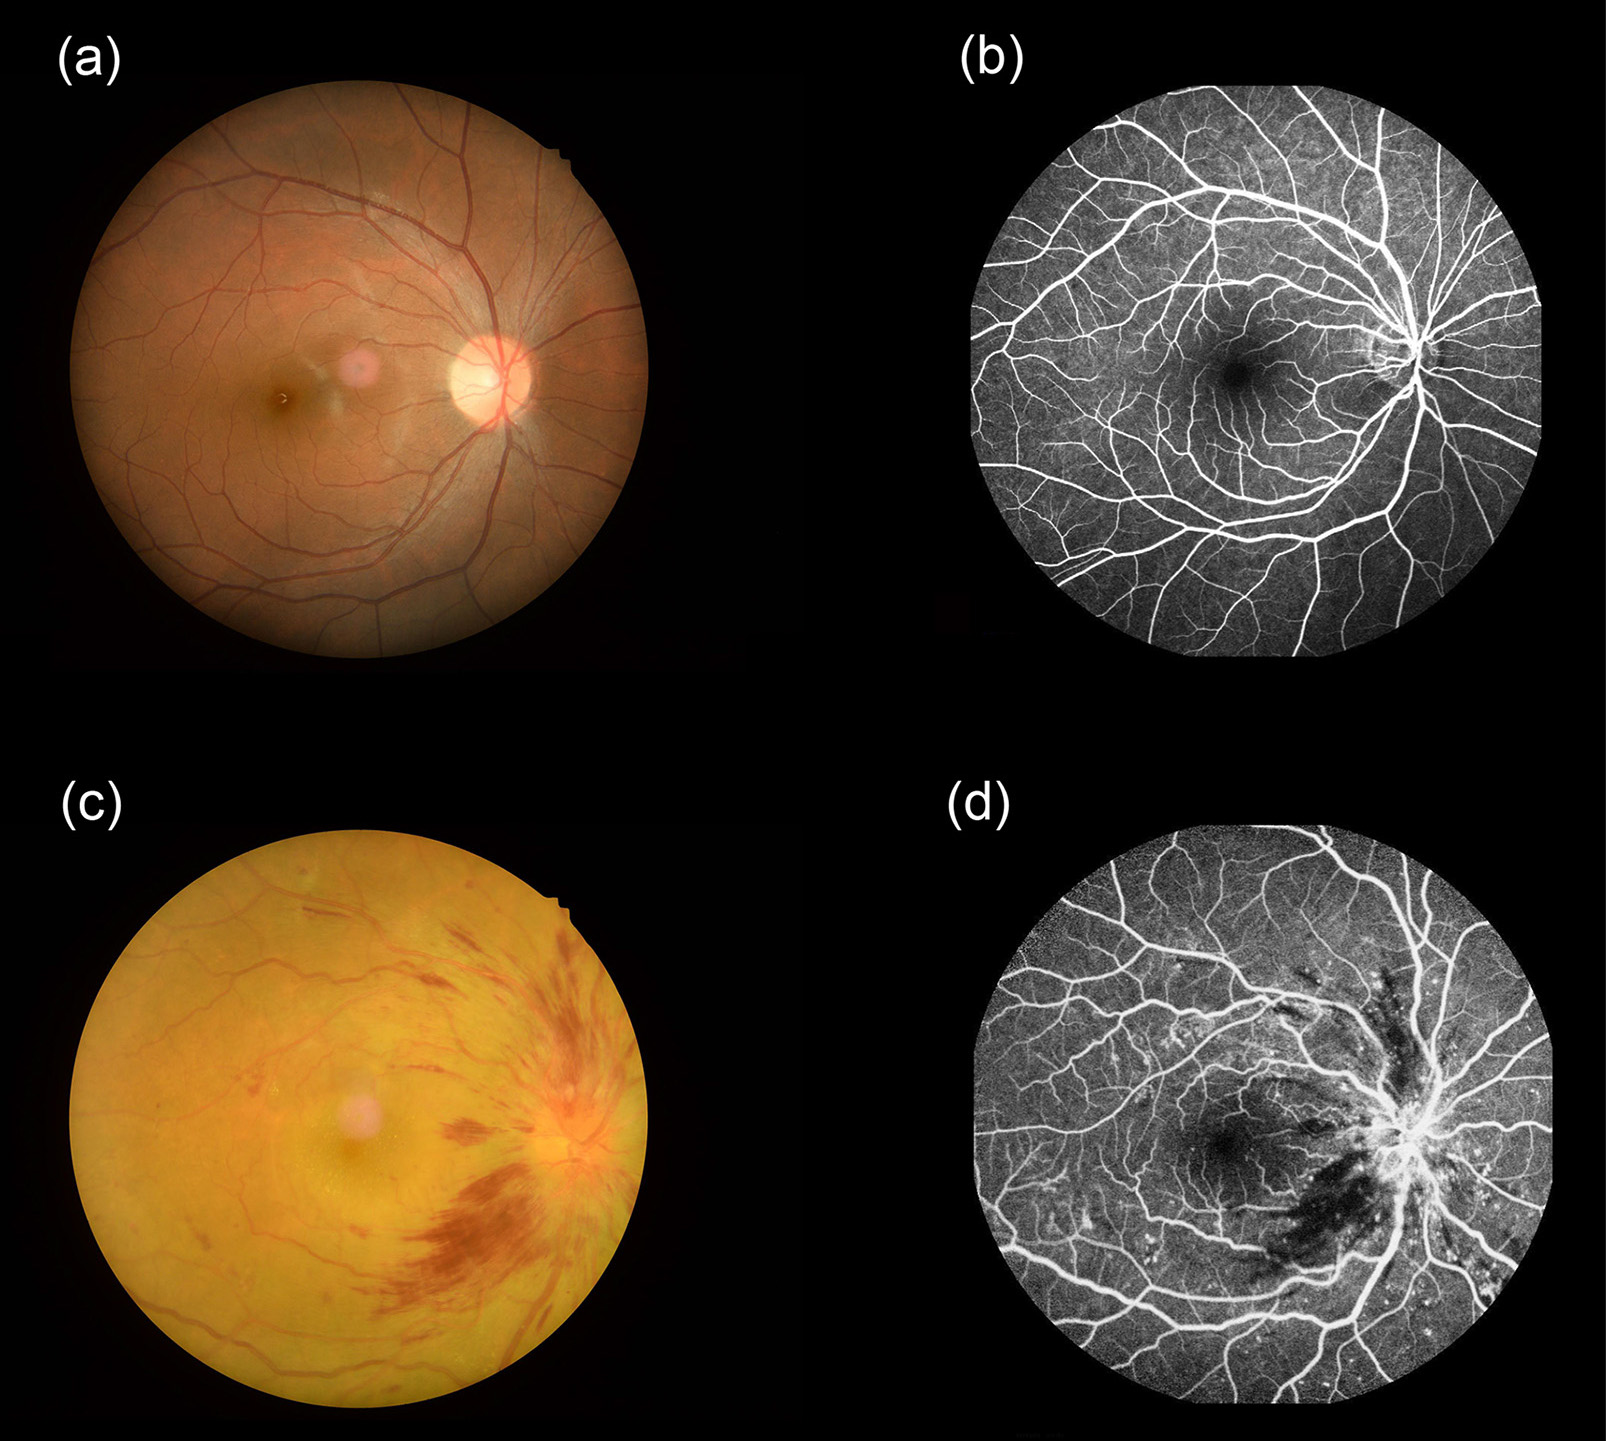 Fig. 1.
Pictures of fundus examinations. Retinal fundus photography (a) and fluorescence fundus angiography (b) images of healthy people. Typical retinal fundus photography (c) and fluorescence fundus angiography (d) images in the DON patients. Abbreviations: DON, diabetic optic neuropathy.
Functional magnetic resonance image (fMRI) is based on traditional magnetic resonance imaging. It can make full use of anatomical, imaging, and functional factors and provide technical imaging support for clinical magnetic resonance diagnosis from a single morphological study combining morphological and functional research. The technology is non-invasive, non-radioactive, and has the advantages of repeatability and high temporal and spatial resolution [7, 8]. In the past, fMRI has been applied to various psychoneurotic diseases, providing new perspectives for further understanding of their neuropathological mechanisms [9, 10]. The amplitude of low-frequency fluctuation (ALFF) method is a resting state-fMRI (rs-fMRI) approach. Based on blood oxygen level-dependent (BOLD) imaging, ALFF indicates the intensity of spontaneous local brain activity in the resting state. Therefore, ALFF may be a useful tool to measure brain activity and to better understand the pathophysiological changes. The fALFF analysis method involves the calculation of the ratio of low-frequency amplitude to whole-brain frequency. It aims to remove the influence of the cerebrospinal fluid noise signal on low-frequency amplitude. It is an analysis method for ALFF standardization.
Fourteen patients with DON were recruited from the First Affiliated Hospital of Nanchang University (Nanchang, China). The inclusion criteria for DON were: (1) a history of diabetes; (2) evidence of optic neuropathy with papilledema, ischemic optic neuropathy, optic disc neovascularization, or optic atrophy. DON was diagnosed according to clinical manifestations, visual field defect, VEP, and FFA; (3) no systemic diseases such as serious heart, liver, or kidney diseases. The exclusion criteria were: (1) current pregnancy; (2) patients with serious neurological and hematopoietic diseases; (3) patients with ocular or orbital diseases, such as corneal ulcers, glaucoma, or orbital tumor; (4) patients with systemic lesions that might cause optic disc edema; (5) history of psychiatric disease; and (6) contraindications for MRI scans, such as pacemakers or other metal implants.
In addition, 14 healthy people of similar age and education level were enrolled. The main inclusion criteria were: (1) no history of eye disease; (2) no liver, kidney, or heart disease; (3) no history of nervous system diseases; (4) no history of mental illness; (5) no contraindications for MRI scans.
A 3-Tesla MRI scanner was used. All participants were asked to breathe smoothly
and keep their eyes closed throughout the scan. A 3D metamorphic gradient
recalled-echo pulse sequence was used to obtain the functional data and 176
structural images were obtained using the parameters described previously [15].
Functional images (n = 240) were collected using the following scanning
parameters: acquisition matrix, 64
Statistical parameter maps (Statistical Parametric Mapping, SPM5;
http://www.fil.ion.ucl.ac.uk/spm/) and the
REST software (http://www.restfmri.net) were used for fMRI data processing.
The first ten time points were removed to balance the signal, and head motion
correction was performed. Data with more than 1.5 mm maximum displacement
in the x, y, or z-axes or 1.5
For data processing, the REST software was used to calculate the fALFF value of the whole brain, as the ratio of ALFF value in the low-frequency range (0.01–0.08 Hz) to that of the whole frequency range (0–0.25 Hz). This ratio reduced the effect of variance between individuals.
SPSS 20.0 software (SPSS, Chicago, IL, USA) was applied for statistical
analysis. An independent sample t-test and chi-squared test were used to
compare data between the two groups. The operating characteristic (ROC)
curves were used to assess the accuracy of the fALFF value to distinguish
DON patients from HCs. Pearson’s correlation analysis was used to look for any
association between regional fALFF values and clinical parameters of DON
patients. In all analyses, p value
No significant difference was found in age or gender between DON and HC groups
(p
| Condition | DON | HCs | t | p-value* |
| Male/female | 6/8 | 6/8 | N/A | |
| Age (years) | 54.21 |
53.45 |
0.226 | 0.783 |
| Weight (kg) | 64.33 |
60.83 |
0.168 | 0.915 |
| Handedness | 14R | 14R | N/A | |
| Duration of DON (days) | 52.14 |
N/A | N/A | N/A |
| Best-corrected VA-left eye | 0.35 |
1.05 |
–3.674 | 0.019 |
| Best-corrected VA-right eye | 0.45 |
1.05 |
–3.932 | 0.023 |
| Latency (ms)-right of the VEP | 123.76 |
103.23 |
3.617 | 0.006 |
| Amplitudes (uv)-right of the VEP | 6.77 |
14.84 |
–8.764 | 0.002 |
| Latency (ms)-left of the VEP | 113.42 |
101.76 |
5.543 | 0.019 |
| Amplitudes (uv)-left of the VEP | 11.35 |
15.04 |
–3.241 | 0.007 |
| HADS | 8.71 |
3.36 |
8.397 | |
| *, p | ||||
The fALFF values varied between brain regions. Compared with HCs, patients with DON had higher fALFF value in the right precentral gyrus (RPCG) but lower fALFF values in the right anterior cingulate gyrus (RACG) and left middle cingulate gyrus (LMCG). More details are shown in Table 2 and Fig. 2.
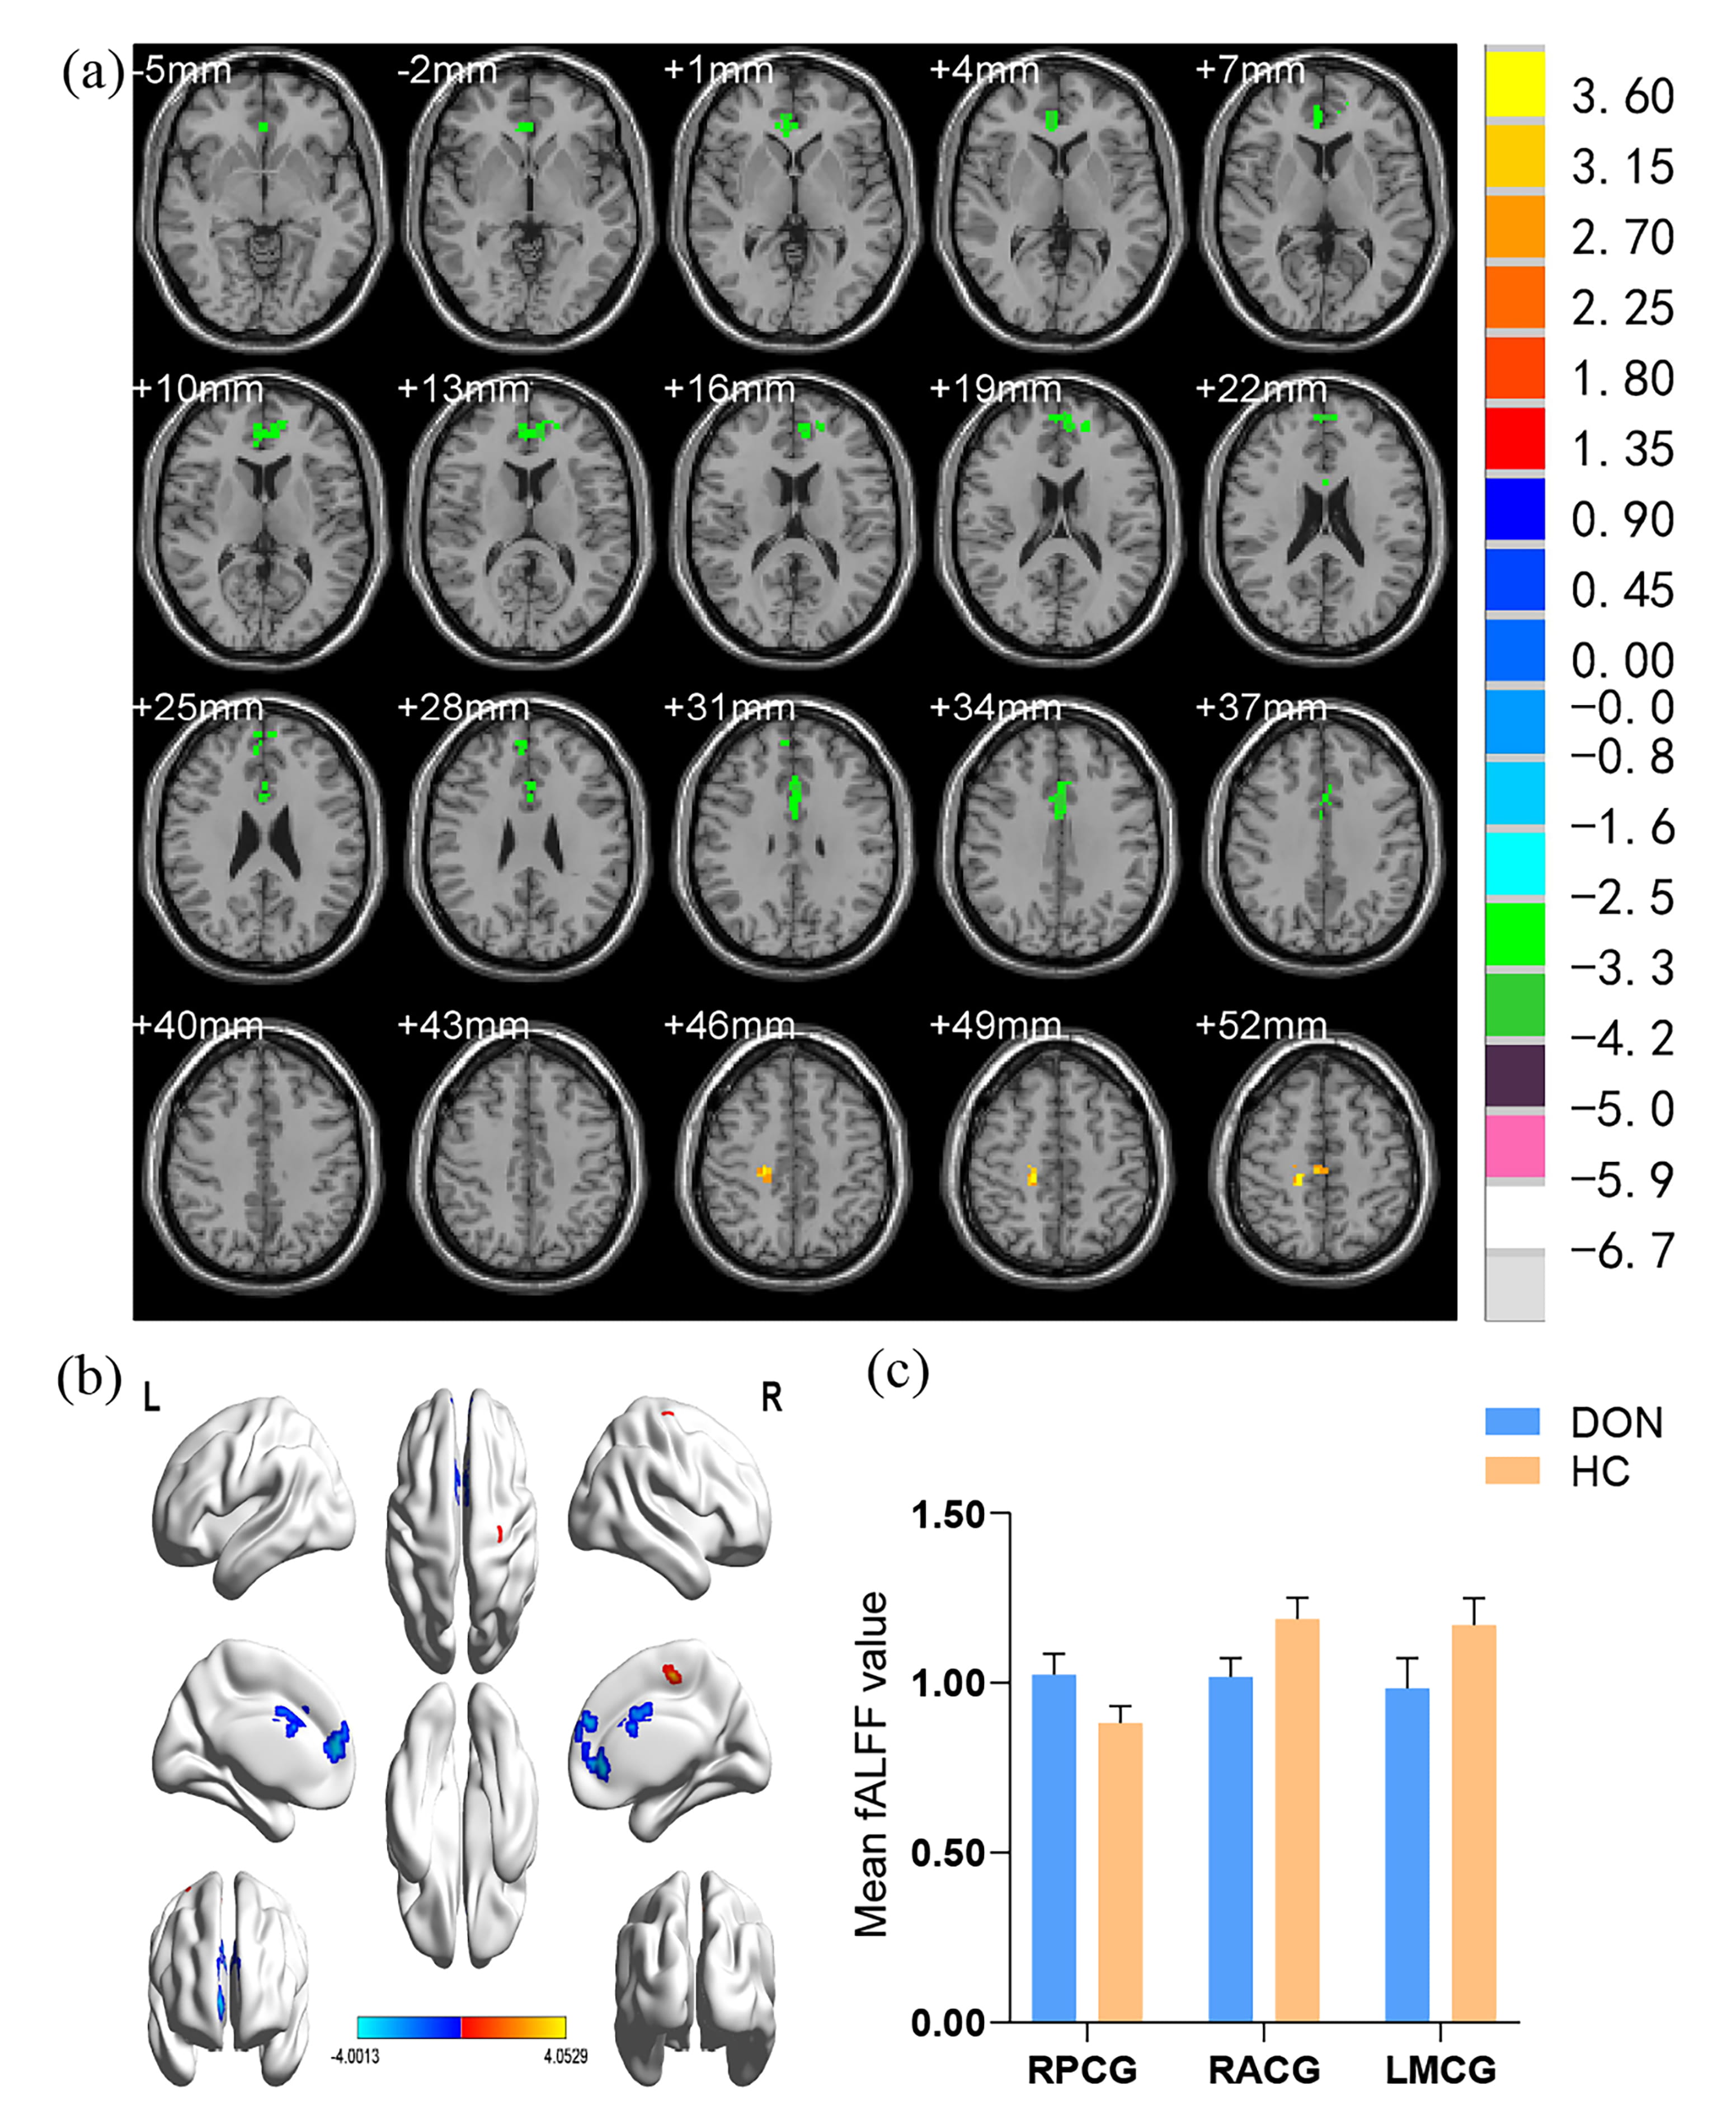 Fig. 2.
Spontaneous brain activity in the DON group and HCs measured using the fALFF method. (a) A significant difference between DON and control group was observed in the RPCG, RACG, and LMCG regions (z.2.3, p = 0.01, cluster = 40 voxels, Alphasim corrected). (b) The stereoscopic form of the cerebrum. (c) The mean fALFF values between the two groups. DON, diabetic optic neuropathy; HCs, healthy controls; fALFF, fractional amplitude of low-frequency fluctuation; RPCG, right precentral gyrus; RACG, right anterior cingulate gyrus; LMCG, left middle cingulate gyrus.
| Brain areas | t-values | voxel | MNI coordinates | |||
| x | y | z | ||||
| DON |
RPCG | 4.0529 | 63 | 18 | –27 | 48 |
| DON |
RACG | –3.8260 | 140 | 6 | 45 | 3 |
| DON |
LMCG | –4.0013 | 68 | 0 | 12 | 33 |
| The statistical threshold was set at a voxel level p | ||||||
It is assumed that the fALFF difference between the DON and HC groups will serve as a useful diagnostic marker. The ROC curve was used to analyze the ALFF values of different brain regions and the area under the curve (AUC) represented the diagnostic accuracy. The AUC of fALFF values in the RPCG, RACG, and LMCG were 0.980, 0.990, and 0.939 respectively (Fig. 3). All of the AUC values are above 0.9, indicating high diagnostic accuracy.
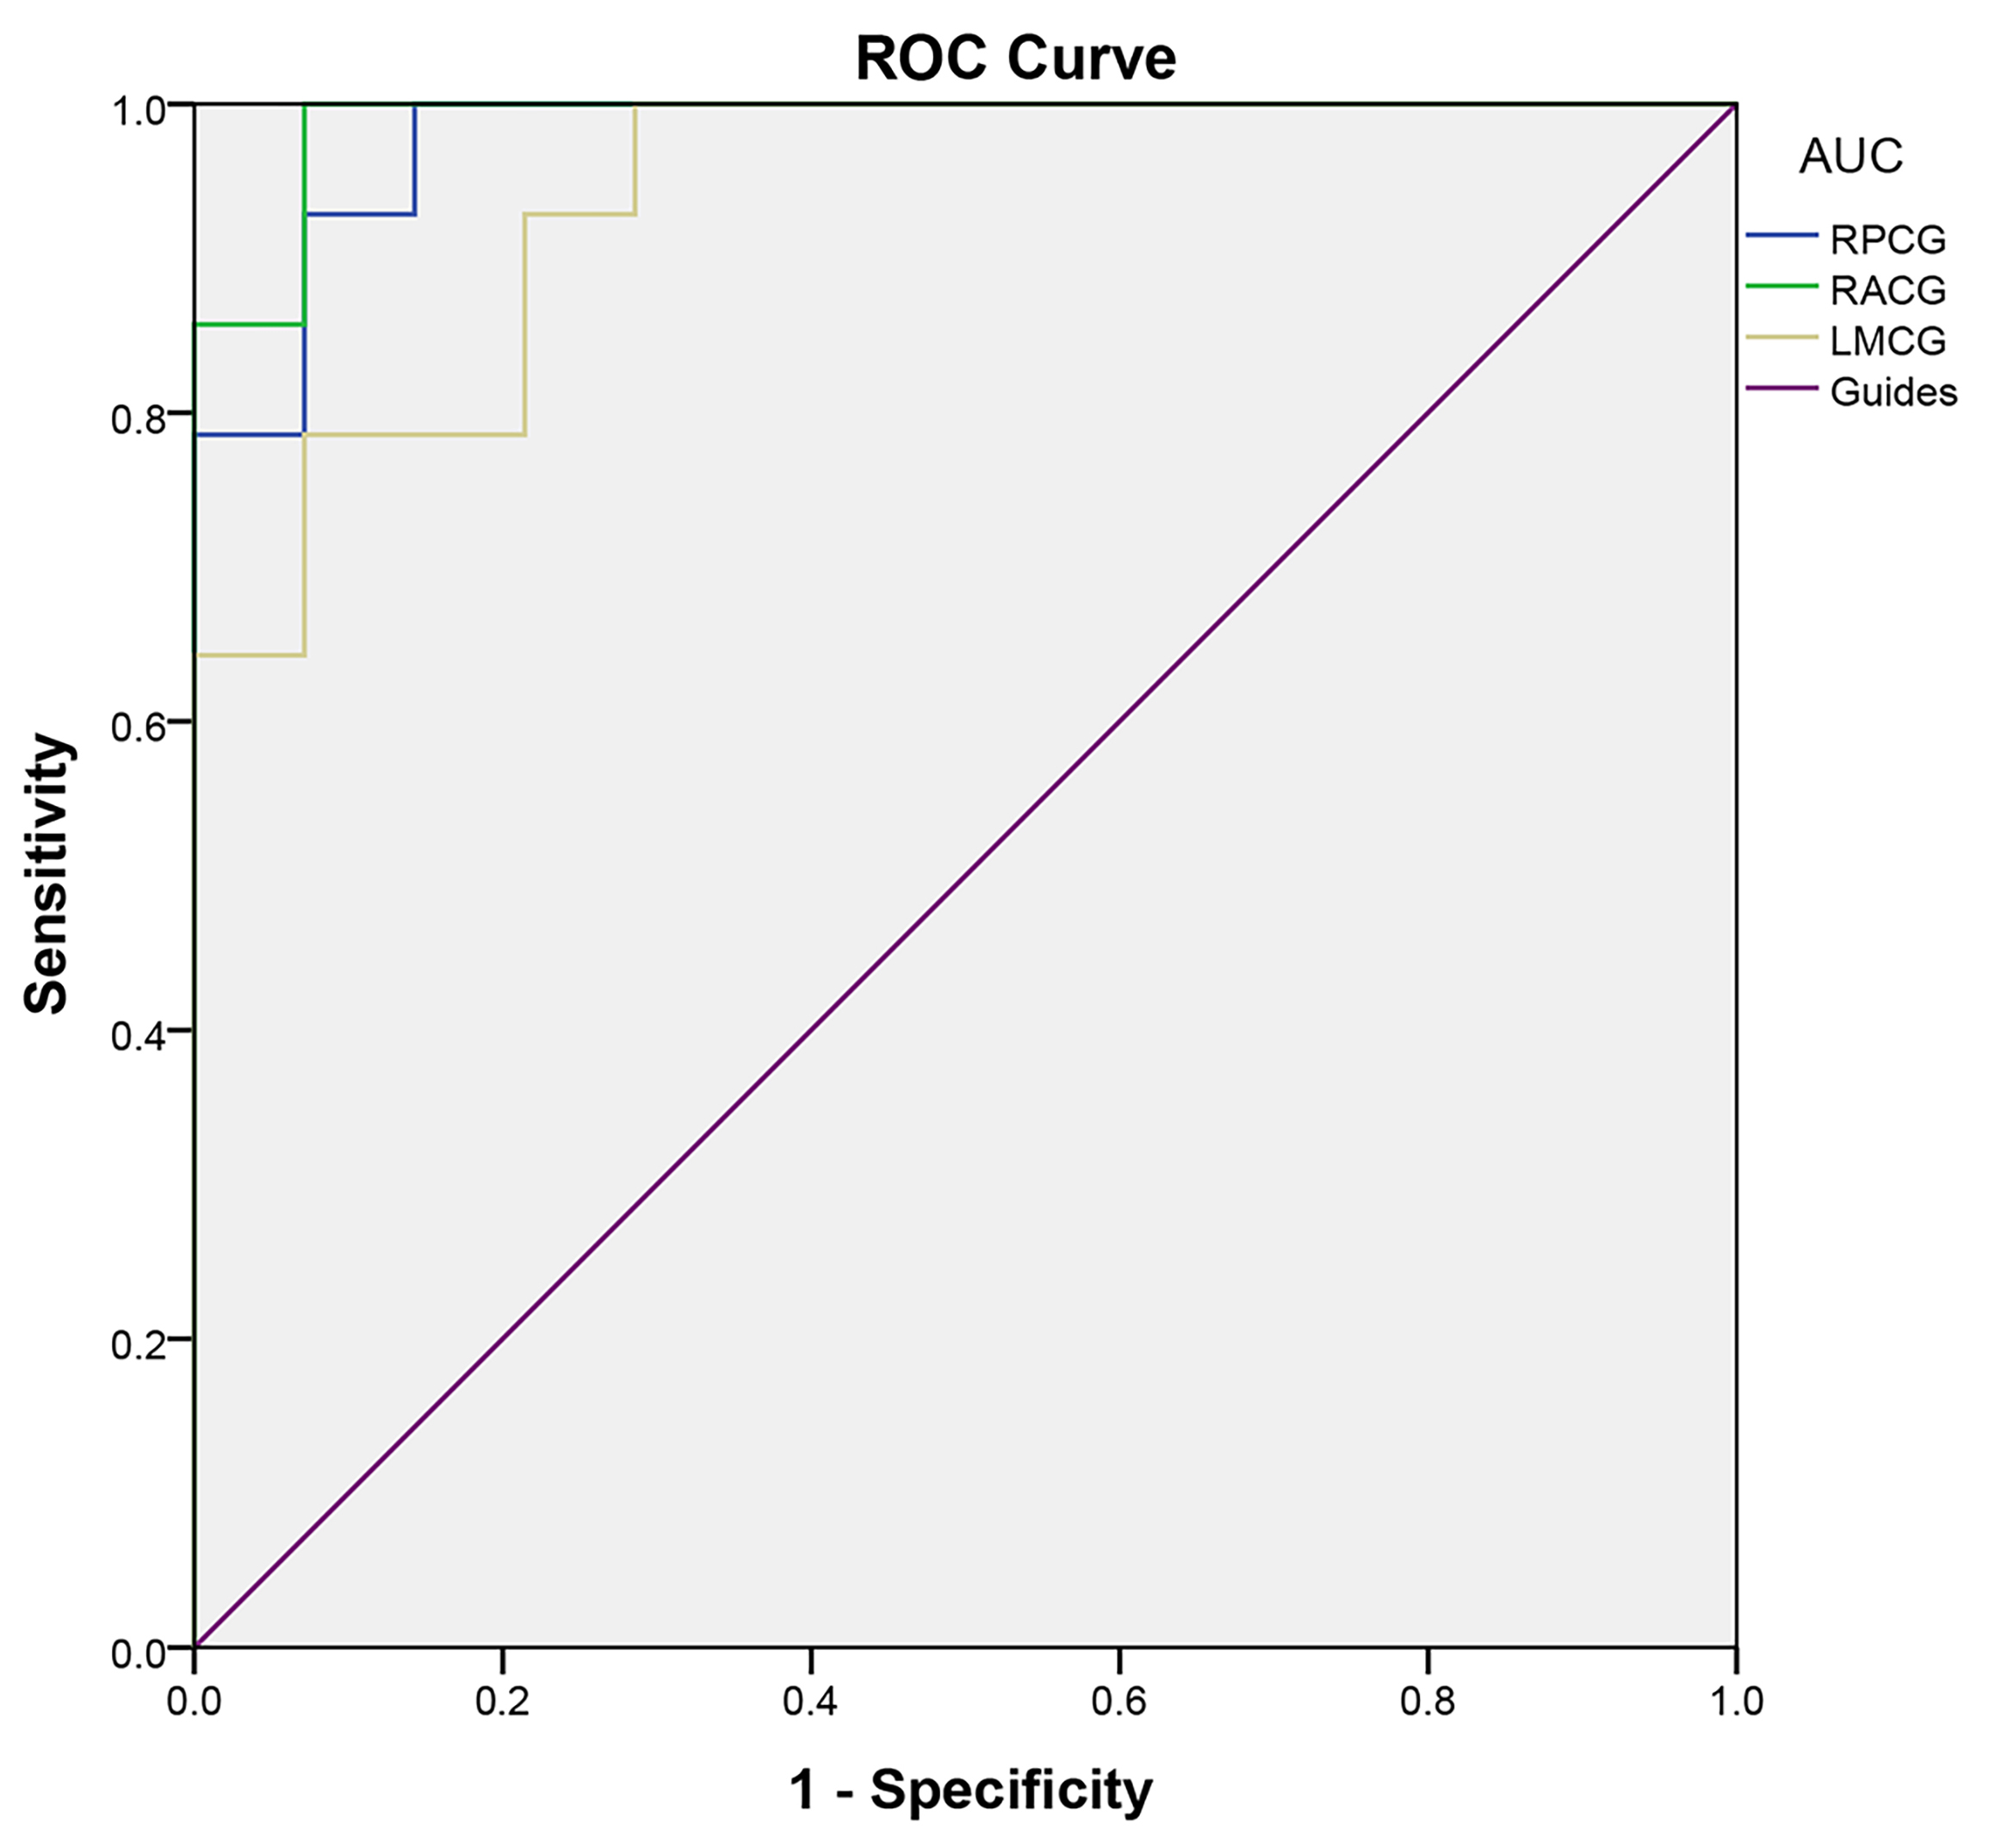 Fig. 3.
ROC curves of the fALFF values for brain regions with significant differences between DON and HC groups. The AUC of fALFF values of the RPCG, RACG, and LMCG were 0.980, 0.990, and 0.939 respectively. ROC, receiver operating characteristic; fALFF, fractional amplitude of low-frequency fluctuation; DON, diabetic optic neuropathy; HC, healthy control; AUC, area under the curve; RPCG, right precentral gyrus; RACG, right anterior cingulate gyrus; LMCG, left middle cingulate gyrus.
Pearson correlation analysis showed that the average fALFF values in the RACG and LMCG were negatively correlated with HADS scores (r = –0.8370, p =0.0313; r = –0.8582, p = 0.0476, respectively). In addition, disease duration of DON was negatively correlated with fALFF value in the LMCG (r = –0.9403, p = 0.0316). The results are shown in Fig. 4.
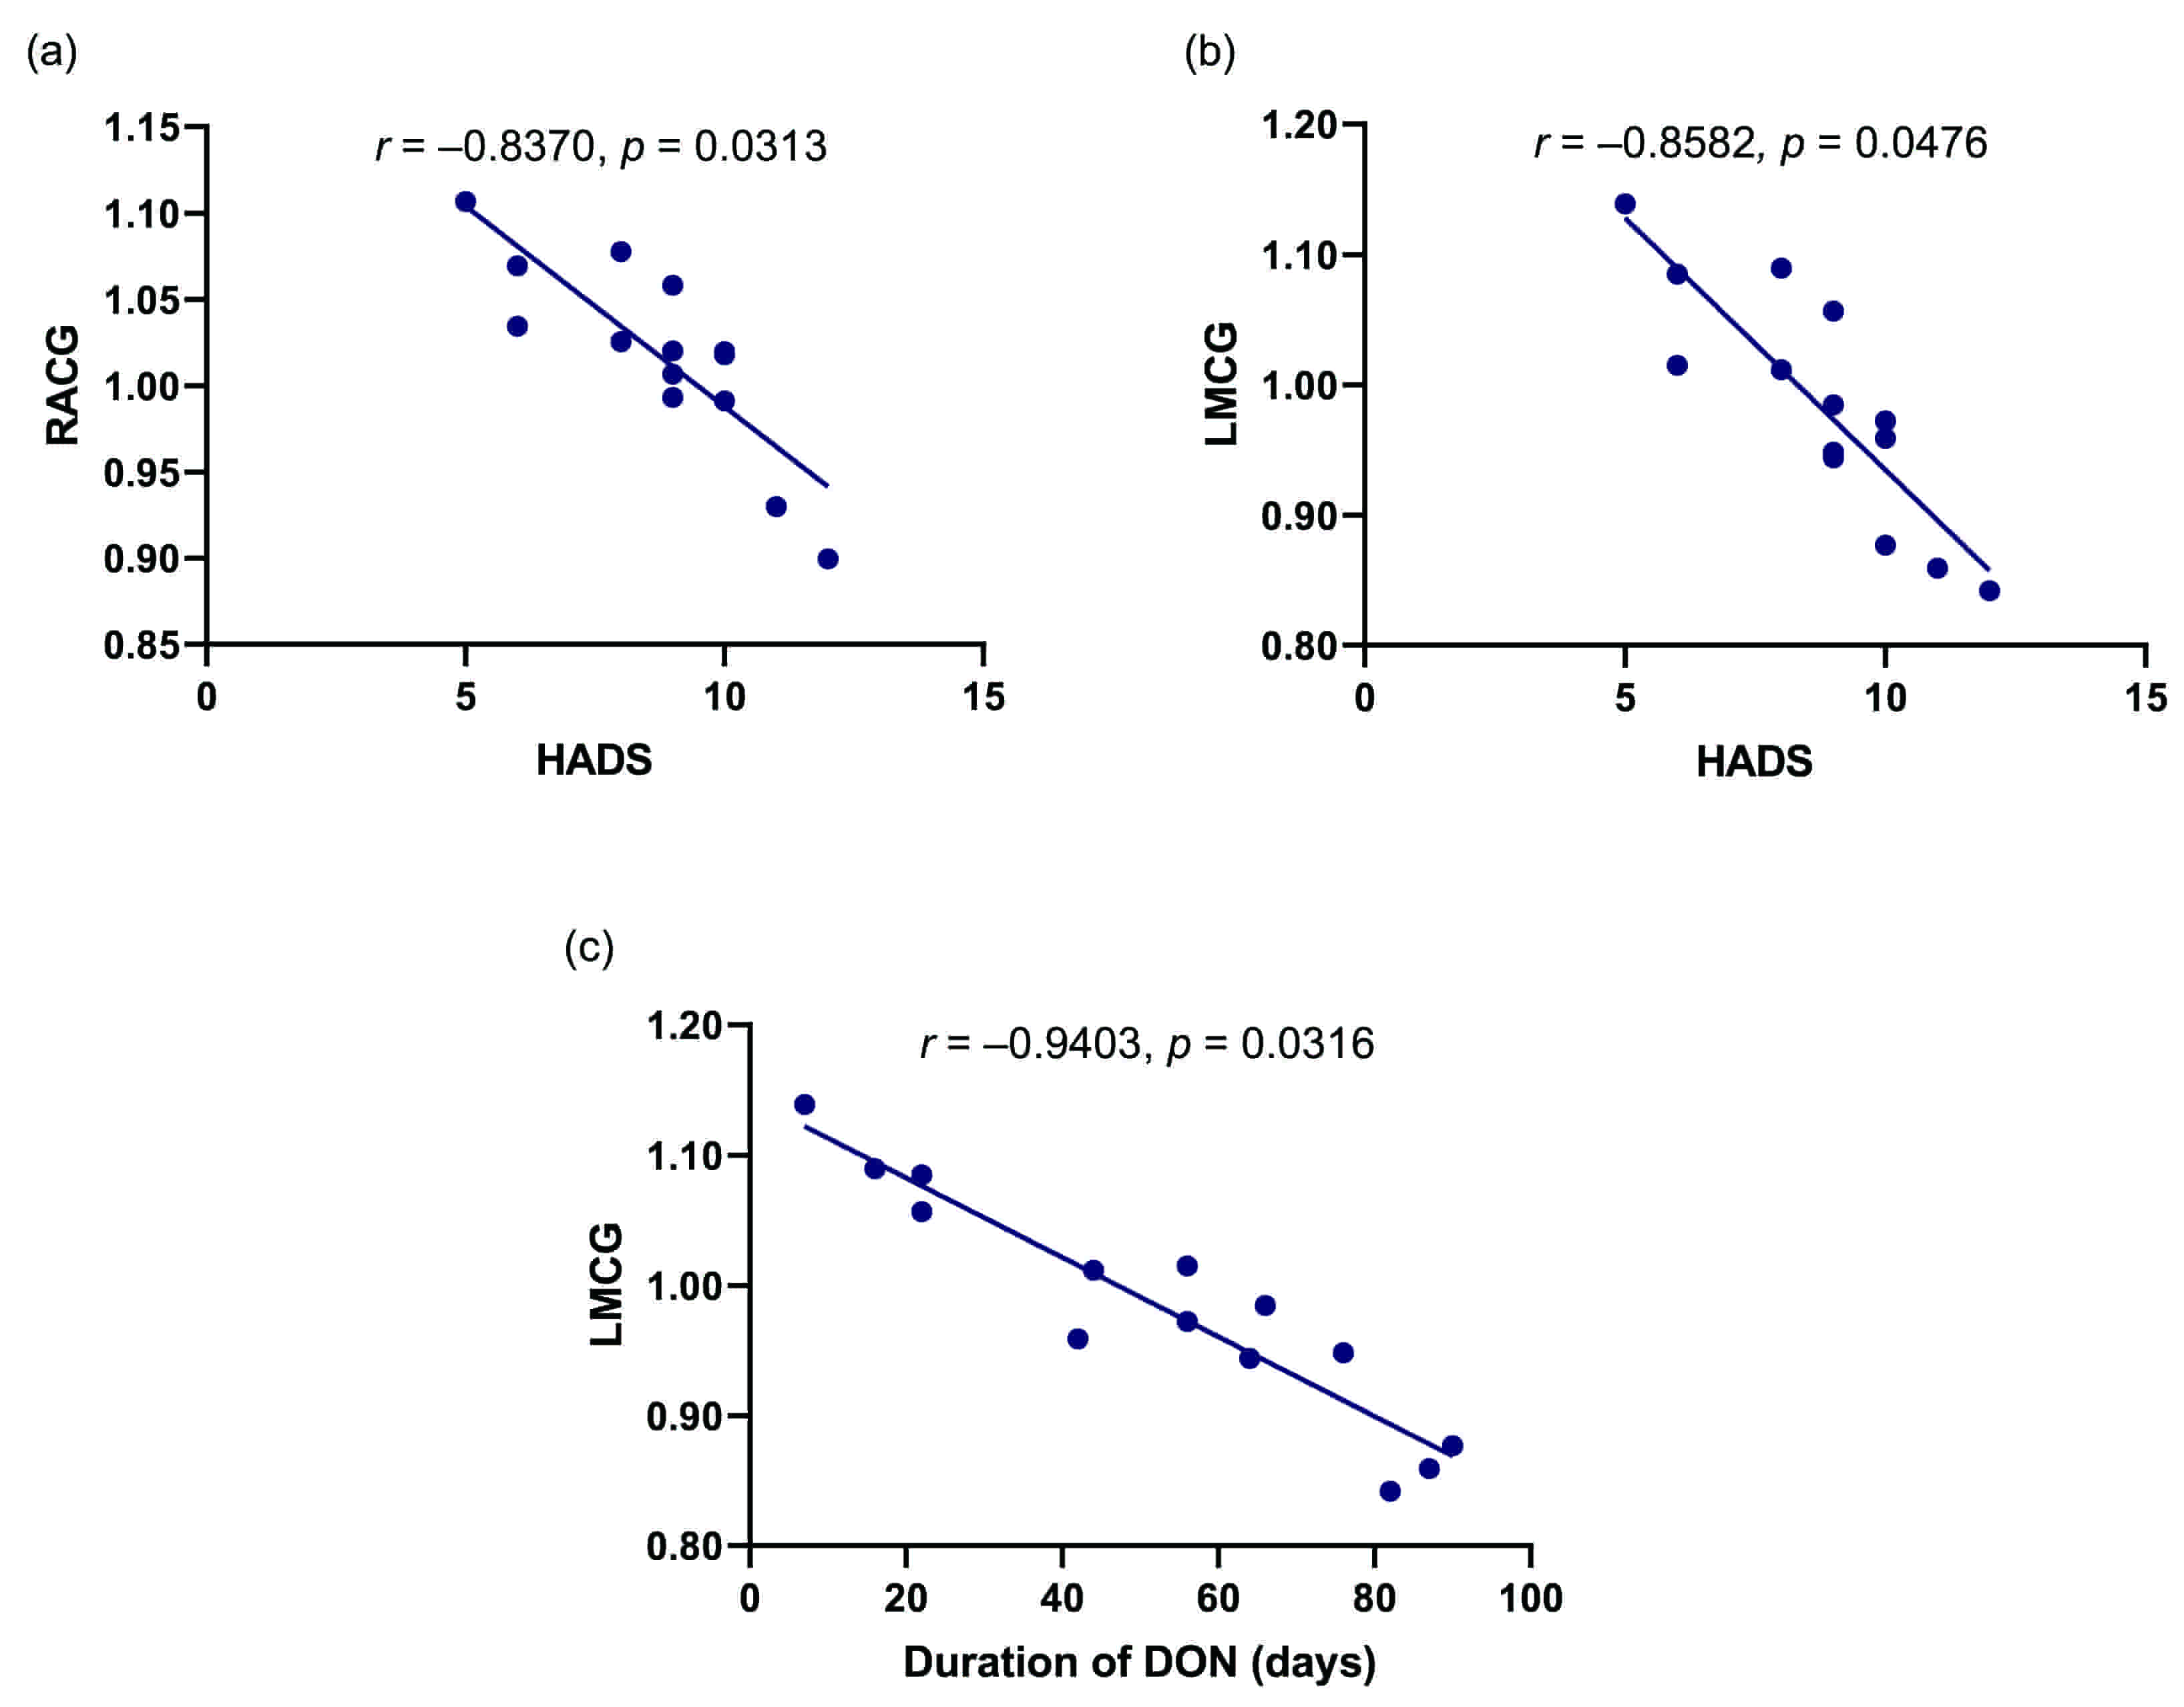 Fig. 4.
Pearson’s correlation analysis of relationships between the fALFF values of brain regions and clinical behaviors in the DON group. (a) The mean fALFF value of the RACG showed negative correlations with the HADS score (r = –0.8370, p = 0.0313). (b) There was a negative correlation between mean fALFF value of the LACG and HADS score (r = –0.8582, p = 0.0476). (c) The mean fALFF value of the LMCG was negatively correlated with the duration of DON (r = –0.9403, p = 0.0316). fALFF, fractional amplitude of low-frequency fluctuation; DON, diabetic optic neuropathy; RPCG, right precentral gyrus; HADS; Hospital Anxiety and Depression Scale; RACG, right anterior cingulate gyrus; LMCG, left middle cingulate gyrus.
As one method of rs-fMRI, fALFF has been used to investigate several ophthalmic diseases, including primary open-angle glaucoma, primary blepharospasm, retinitis pigmentosa, normal-tension glaucoma, and monocular blindness (Table 3, Ref. [16, 17, 18, 19, 20]). Our previous studies had explored the brain changes of DON patients using the degree centrality (DC) method and functional connectivity density (FCD) method [28, 29]. DC method described the connection strength between a given voxel and other nodes, and the FCD method described the synchronization between regions. None of them directly describe the intensity of brain activity in a certain region. However, fALFF can directly demonstrate the intensity of spontaneous neural activity. In addition, the simple calculation and reliable characteristics of fALFF make it a suitable and useful tool for rs-fMRI. The target of the present research was to assess regional brain function in DON using the fALFF method and explore the potential pathogenesis of this disease.
| Author | Year | Disease | Increased fALFF values | Decreased fALFF values |
| Li T et al. [16] | 2014 | Primary open-angle glaucoma | LSTG, LIPL, RMCC, RMFG | RMTG, LIG, BC, LPCG, RC/LL, LC/PC |
| Ni MF et al. [17] | 2017 | Primary blepharospasm | RCH | - |
| Huang X et al. [18] | 2018 | Retinitis pigmentosa | LSFG, LMFG, BSMA | BLG/CAL |
| Li HL et al. [19] | 2020 | Normal-tension glaucoma | - | RAG, RPC |
| Fang JW et al. [20] | 2020 | Monocular blindness | LPC, BIPL | LAC |
| fALFF, fractional amplitude of low-frequency fluctuation; LSTG, left superior temporal gyrus; LIPL, left inferior parietal lobule; RMCC, right middle cingulate cortex; RMFG, right middle frontal gyrus; RMTG, Right middle temporal gyrus; LIG, left lingual gyrus; BC, bilateral cuneus; LPCG, left postcentral gyrus; RC/LL, right calcarine/limbic lobe; LC/PC, left calcarine/posterior cingulate; RCH, right caudate head; LSFG, left superior frontal gyrus; LMFG, left middle frontal gyrus; BSMA, bilateral supplementary motor area; BLG/CAL, bilateral lingual gyrus/cerebellum anterior lobe; RAG, right angular gyrus; RPC, right precuneus; LPC, left precuneus; BIPL, bilateral inferior parietal lobe; LAC, left anterior cingulate. | ||||
In the past, fALFF has been used in post-stroke depression, borderline personality disorder, anorexia nervosa, and Alzheimer’s disease but has not been applied to DON patients [30, 31, 32, 33, 34]. Therefore, we used the fALFF technique to assess brain activity in DON patients to explore the neuropathological mechanism of this disease. We found a lower fALFF value in RACG in DON patients, which suggests that the abnormality of RACG may be part of the neuropathological mechanism of vision loss in DON patients. Our results showed vision deficits in DON patients.
In contrast to HCs, we found that the fALFF value of the RPCG in DON patients was increased, while the fALFF values of RACG and LMCG were decreased (Table 4). We know that the brain is very important as it controls the daily activities of various organs. RPCG acts as the primary motor cortex and controls body movements, including eye movements. RACG and LMCG are important components of the limbic system, which play an important role in some stages of emotional processing and visual functions [35, 36, 37, 38, 39, 40, 41, 42]. Therefore, the abnormal spontaneous brain activities we found in the above brain areas of DON patients were very meaningful findings and might partly explain the patient’s symptoms and indicate the underlying neuropathological mechanism of DON. In addition, abnormal fALFF value might be one of the hallmarks of DON patients.
| Brain areas | Study results | Brain function | Anticipant’s results |
| RPCG | DON |
Primary motor cortex, the control of eye movements | Eye movement |
| RACG | DON |
Part of the limbic system | Depression and anxiety, visual impairment |
| LMCG | DON |
Part of the limbic system | Depression and anxiety, visual impairment |
| fALFF, fractional amplitude of low-frequency fluctuation; DON, diabetic optic neuropathy; RPCG, right precentral gyrus; RACG, right anterior cingulate gyrus; LMCG, left middle cingulate gyrus; HCs, healthy controls. | |||
ROC curve analysis is often utilized to distinguish diseased from healthy states. In the present analysis, the AUC of fALFF values of the RPCG, RACG, and LMCG were 0.980, 0.990, and 0.939, respectively. All AUC of fALFF values was above 0.9, indicating significant differences in fALFF values between DON and control groups and suggesting that the changed fALFF values may be potential diagnostic biomarkers for patients with DON.
The abnormalities in the central anterior gyrus, anterior cingulate gyrus, and middle cingulate gyrus are associated with eye movement, emotional disorder, and vision loss in DON patients. Our findings help to explain the pathological mechanisms of DON. Furthermore, the fALFF abnormalities may also serve as diagnostic signs for DON patients, which is significant.
GMZ and YS designed the study; YPJ, WFL and YCP performed the research and acquired data; they contribute equally and share co-first authorship. HYS, LJZ, QYL and QMG helped analyzing data and interpret results; RBL was responsible for reagents and materials; WFL and YPJ wrote the paper. All authors contributed to editorial changes in the manuscript. All authors read and approved the final manuscript.
All research methods were approved by the medical ethics committee of the First Affiliated Hospital of Nanchang University (2015016) and were in accordance with the 1964 Helsinki declaration and its later amendments or comparable ethical standards. All participants were told about the purpose, procedure, and risks of this study and provided signed informed consent.
Not applicable.
This research got supported from the Jiangxi Province Science and Technology Project (Grant No. 20171BBG70006, 20192BAB205063); Central Government Guides Local Science and Technology Development Foundation (No: 20211ZDG02003); Key Research Foundation of Jiangxi Province (No: 20181BBG70004, 20203BBG73059); Excellent Talents Development Project of Jiangxi Province (No: 20192BCBL23020).
The authors declare no conflict of interest.