IMR Press / JIN / Volume 21 / Issue 5 / DOI: 10.31083/j.jin2105131
Open Access Original Research
Adaptation of Optokinetic Reflex by Training with Different Frequency and Amplitude
Show Less
1 Department of Otorhinolaryngology-Head and Neck Surgery, Konkuk University Medical Center, Research Institute of Medical Science, Konkuk University School of Medicine, 05030 Seoul, Republic of Korea
2 Department of Physiology, Seoul National University College of Medicine, 08826 Seoul, Republic of Korea
3 Department of Biomedical Sciences, Seoul National University College of Medicine, 08826 Seoul, Republic of Korea
4 Memory Network Research Center, Seoul National University College of Medicine, 08826 Seoul, Republic of Korea
5 Neuroscience Research Institute, Medical Research Center, Seoul National University College of Medicine, 03080 Seoul, Republic of Korea
*Correspondence: 20110552@kuh.ac.kr (Chang-Hee Kim)
Academic Editor: Rafael Franco
J. Integr. Neurosci. 2022, 21(5), 131; https://doi.org/10.31083/j.jin2105131
Submitted: 29 March 2022 | Revised: 24 April 2022 | Accepted: 5 May 2022 | Published: 22 July 2022
Copyright: © 2022 The Author(s). Published by IMR Press.
This is an open access article under the CC BY 4.0 license.
Abstract

Background: Although the occurrence of optokinetic reflex (OKR) adaptation after OKR training is well established, the dynamic properties of OKR adaptation has not been fully studied. This study aimed to examine the difference in the amount of OKR adaptation according to OKR training protocols which have different frequency or amplitude of drum oscillation. Methods: Using C57BL/6N male mice, we induced OKR adaptation by 3 different categories of learning paradigm as follows: (1) Optokinetic drum oscillation for 60 min with same amplitude and different frequency. (2) Optokinetic drum oscillation for 60 min with same frequency and different amplitude. (3) Training with serial combination of different frequency or amplitude. Results: The results show that the amount of OKR adaptation was greater after OKR training with lower frequency or amplitude than that with higher frequency or amplitude. Conclusions: This finding may suggest that the retinal slip signal with lower-velocity OKR stimulation serves as more precise instructive signal for learning, leading to induction of more efficient training effect. Another interesting finding was that the OKR gain increase tended to be greater after training composed of sequential combination of decreasing frequency or amplitude than that composed of sequential combination of increasing frequency or amplitude. Furthermore, the OKR training with high frequency or amplitude eliminated a part of learning effects which have already formed by previous training. We postulate that the stimulation during training with high frequency or amplitude may implement a disturbing instruction for OKR learning when it is conducted in mice with increased OKR gain after previous OKR training.

Keywords
optokinetic reflex
cerebellum
motor learning
adaptation
training paradigm
1. Introduction

Optokinetic reflex (OKR) and vestibulo-ocular reflex (VOR) work together to maintain retinal images. The OKR functions well at low frequencies, and VOR functions well at high frequencies [1, 2]. The VOR uses vestibular input to accommodate for retinal slip in advance, while the OKR is controlled by the retinal slide itself. The OKR permits the eyeball to follow a moving image in the same way while the head remains constant, whereas the VOR causes eyeball movements in the reverse direction. The performance of OKR and VOR together is exceptionally well, resulting in minimum visual motion over a diverse variety of movement frequencies. The gain of OKR can be increased by prolonged oscillation of optokinetic drum in the absence of head movements, and this OKR gain adaption has been employed as a good experimental paradigm for researching cerebellum-dependent motor learning [1, 3, 4, 5, 6, 7, 8, 9]. The long-term depression at parallel fibers-Purkinje cell synapses and changes in intrinsic excitability of Purkinje cells in the flocculus have been suggested as mechanism for OKR motor learning [10, 11].

Although the occurrence of OKR adaptation after OKR training is well established, the dynamic properties of OKR adaptation following training protocols with different frequency and amplitude of optokinetic drum have not been studies. For example, when we measure OKR gain with 0.5 Hz/5° drum rotation, how much learning effect can be obtained if the training for OKR gain learning is performed with different frequency (0.25 Hz or 1 Hz) or amplitude (2.5° or 10°)? Furthermore, when we measure OKR gain with 0.5 Hz/5° drum rotation, how much learning effect can be obtained if the training for OKR gain learning is performed with sequential increase of frequency (0.25 Hz 0.5 Hz 1 Hz) or amplitude (2.5° 10°) and decrease of them (1 Hz 0.5 Hz 0.25 Hz/10° 2.5°)? In the present study, we attempted to investigate the difference in the amount of OKR adaptation according to OKR training protocols which have different frequency or amplitude of drum oscillation.

2. Materials and Methods
2.1 Preparation for Behavioral Tests and OKR Setup

The black eye C57BL/6N male mice (body weight 20–25 g, 8 weeks old, OrientBio, Seoul, Korea) were employed in the experiment. Mice were equipped for behavioral tests as mentioned previously [8, 10, 12, 13]. Briefly, under general anesthesia with isoflurane, a minimal incision in the scalp was made after application of lidocaine cream to reduce pain or discomfort. The head fixation pedestal was made with tow nuts and four screws. Nuts were put on bregma and lambda of the cranium, and screws were embedded between the nuts. Then, mice were permitted to recuperate for at least 3 days after surgery. A drop of physostigmine salicylic solution (Eserine, Sigma-Aldrich Korea, Seoul, Korea) was given to the eyes in preparation for eye movement recording to keep the pupil size stable during the recording. Mice were held in a factory animal holder in the middle of a turntable, and they were adapted to constraint in an animal carrier for 15 min in the dark and then 15 min in the light without any excitation. After two days of acclimation, calibration was performed, which is the process of converting 2-demensional linear visual stimuli on the screen into angular eye movement. The radius of pupil, which is necessary for computing eye movement gain, could be measured through the calibration process. The calibration equations and processes were based on those used in Stahl et al. [14], and mice and the container were put at the same location so that calibration could be done at recordings after calibration.

CCD camera (IPX – VGA210, IMPERX, Boca Raton, FL, USA) with infrared (IR) filter (LP830) was used to capture the image of the eye, which was then transferred to a desktop PC using a camera link grabber board (PCI – 1426, National Instruments, TX, USA). A single IR-LED was put around the camera to establish a reference corneal reflex for calibration as well as IR illumination was produced using IR-LED. A motor-mounted drum with alternating black and white vertical stripes was used to provide optokinetic stimulation (AKM22E – VBBNR – 00, Kollomorgen, Radford, VA, USA). For the output and input between the PC and the monitor, a data collection (DAQ) PCI board (PCI – 6230, National Instruments, Austin, TX, USA) was utilized. Several virtual instruments built in LabView (National Instruments, Austin, TX, USA) were used to process the obtained images.

2.2 Eye Movement Recordings and Data Analysis

To assess the baseline performance of the mice utilized in the research, three baseline ocular-motor responses were investigated such as OKR, VOR in the light as well as VOR in the darkness. The horizontal OKR gain was determined by applying with 0.5 Hz frequency and 50 (peak-to-peak) amplitude of rotation in the horizontal position in the light to the drum. The hOKR gain was calculated as the ratio of peak-to-peak eye velocity to peak-to-peak drum oscillation velocity. Twelve cycles of elicited eye movements were chosen for average from sixty cycles, free of motion parallax and eye blinking, and the given stimulation and response were suited to sine curves. As previously described, we used a custum-made program in LabView to analyze the research data [8, 10, 12, 13]. The standard deviation (SD) of the group averages is represented in the text. The changes in OKR gain following hOKR training were compared between groups with different training methodologies using Mann-Whitney U test or Kruskal–Wallis test (SPSS v. 17.0, IBM Corp., Armonk, NY, USA), and significant value is considered with p value < 0.05. All procedures were approved by the Institutional Animal Care and Use Committee of Seoul National University College of Medicine.

2.3 Induction of OKR adaptation

Before induction of OKR adaptation, we examined the baseline performance of OKR in mice. The OKR gain was measured in the light condition. The OKR drum stimulation was given by 5° amplitude-sinusoidal rotation with different frequencies including 0.1, 0.25, 0.5 and 1.0 Hz. The OKR gain was calculated as the ratio of maximal eye velocity to maximal drum velocity. These baseline performance characteristics were consistent with those of our previous observations [8, 12, 13]. Then, we induced OKR adaptation by continuous oscillation of optokinetic drum while the mice are remained stationary with eyes opened. Considering that OKR gain was measured with drum oscillation of 0.5 Hz frequency and 5° amplitude, we used 3 different categories of learning paradigm as follows: (1) Optokinetic drum oscillation for 60 min with same amplitude and different frequency (0.25 Hz and 5°, 0.5 Hz and 5°, and 1 Hz and 5°; see Fig. 1). (2) Optokinetic drum oscillation for 60 min with same frequency and different amplitude (0.5 Hz and 2.5°, 0.5 Hz and 5°, and 0.5 Hz and 10°; see Fig. 2). (3) Training with serial combination of different frequency or amplitude (see Figs. 3,4).

Fig. 1.

The OKR adaptation after training protocols with different frequency of drum rotation. (A) After 60 min OKR training with 0.25 Hz and 5° drum oscillation, OKR gain was enhanced from 0.190
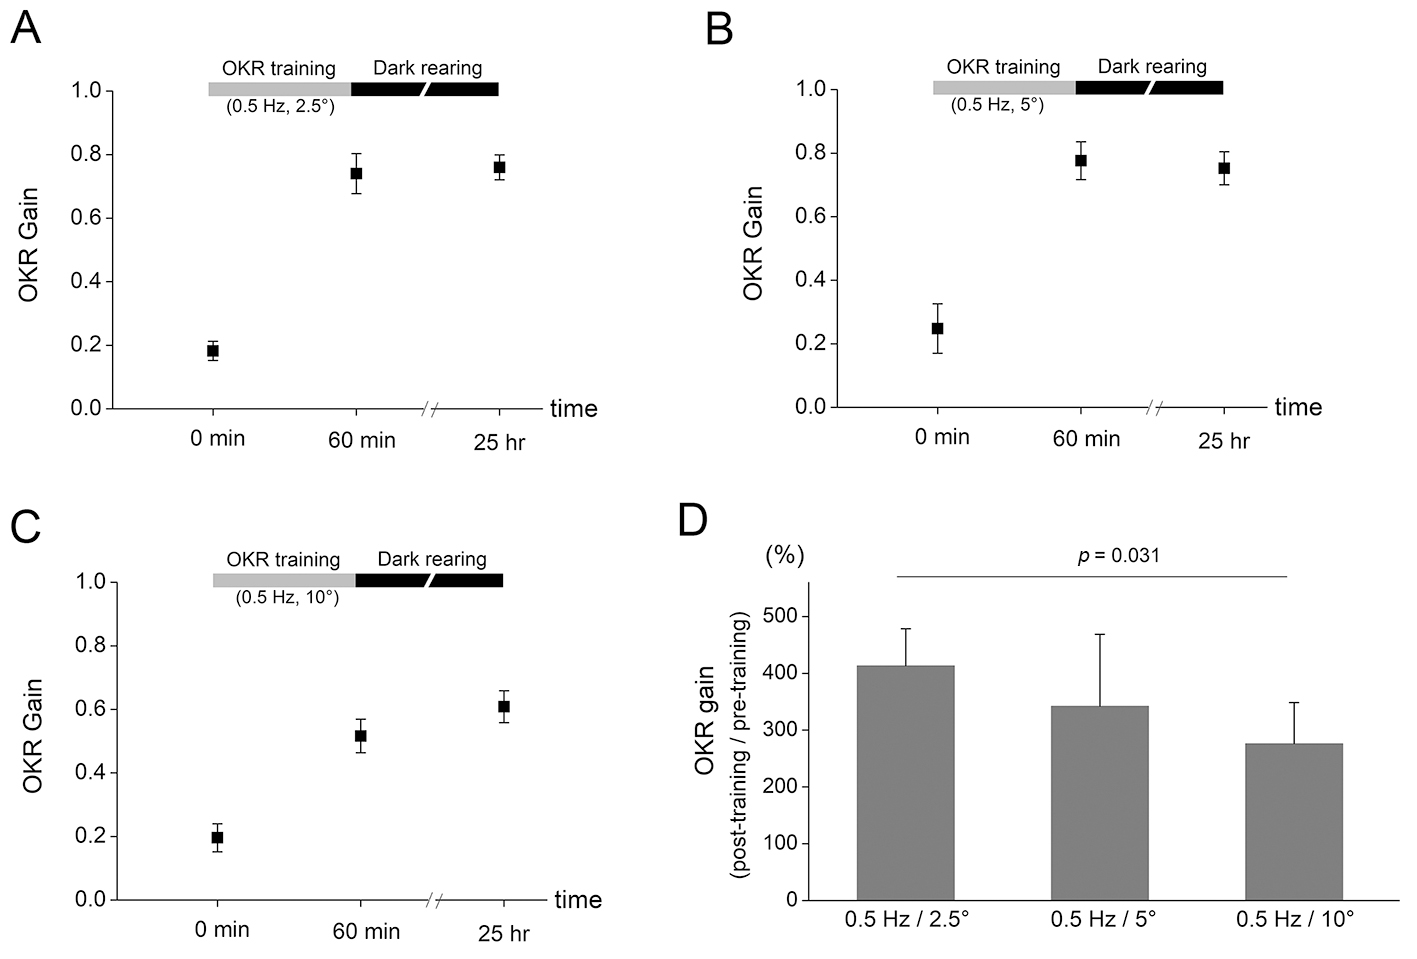
 ± 0.046 to 0.754 ± 0.074. Then, the OKR gain after 24 hr in the dark was 0.771 ± 0.049 (n = 5). (B) After 60 min OKR training with 0.5 Hz and 5° drum oscillation, OKR gain increased from 0.248 ± 0.078 to 0.776 ± 0.060. Then, the OKR gain after 24 hr in the dark was 0.753 ± 0.052 (n = 5). (C) After 60 min OKR training with 1 Hz and 5° drum oscillation, OKR gain increased from 0.233 ± 0.023 to 0.329 ± 0.015. Then, the OKR gain after 24 hr in the dark was 0.447 ± 0.018 (n = 5). (D) Comparison of OKR gain increase immediately after the 60 min training among three protocols indicated that the average ratio of post-training hOKR gain to pre-training hOKR gain was significantly different among three protocols (p = 0.008, Kruskal–Wallis test).

Fig. 2.

The OKR adaptation after training protocols with different amplitude of drum rotation. (A) After 60 min OKR training with 0.5 Hz and 2.5° drum oscillation, OKR gain increased from 0.182 ± 0.030 to 0.740 ± 0.063. Then, the OKR gain after 24 hr in the dark was 0.760 ± 0.039 (n = 5). (B) After 60 min OKR training with 0.5 Hz and 5° drum oscillation, OKR gain increased from 0.248 ± 0.078 to 0.776 ± 0.060. Then, the OKR gain after 24 hr in the dark was 0.753 ± 0.052 (n = 5). (C) After 60 min OKR training with 0.5 Hz and 10° drum oscillation, OKR gain increased from 0.196 ± 0.044 to 0.516 ± 0.053. Then, the OKR gain after 24 hr in the dark was 0.609 ± 0.050 (n = 5). (D) Comparison of OKR gain increase immediately after the 60 min training among three protocols indicated that the average ratio of post-training hOKR gain to pre-training hOKR gain was significantly different among three protocols (p = 0.031, Kruskal–Wallis test).

Fig. 3.

The OKR adaptation after training protocols with combination of different frequency of drum rotations. (A) The OKR training protocol was composed of serial combination of 20 min OKR training with 0.25 Hz and 5° drum oscillation, 20 min OKR training with 0.5 Hz and 5° drum oscillation, and 20 min OKR training with 1 Hz and 5° drum oscillation. The OKR gain was enhanced from 0.176
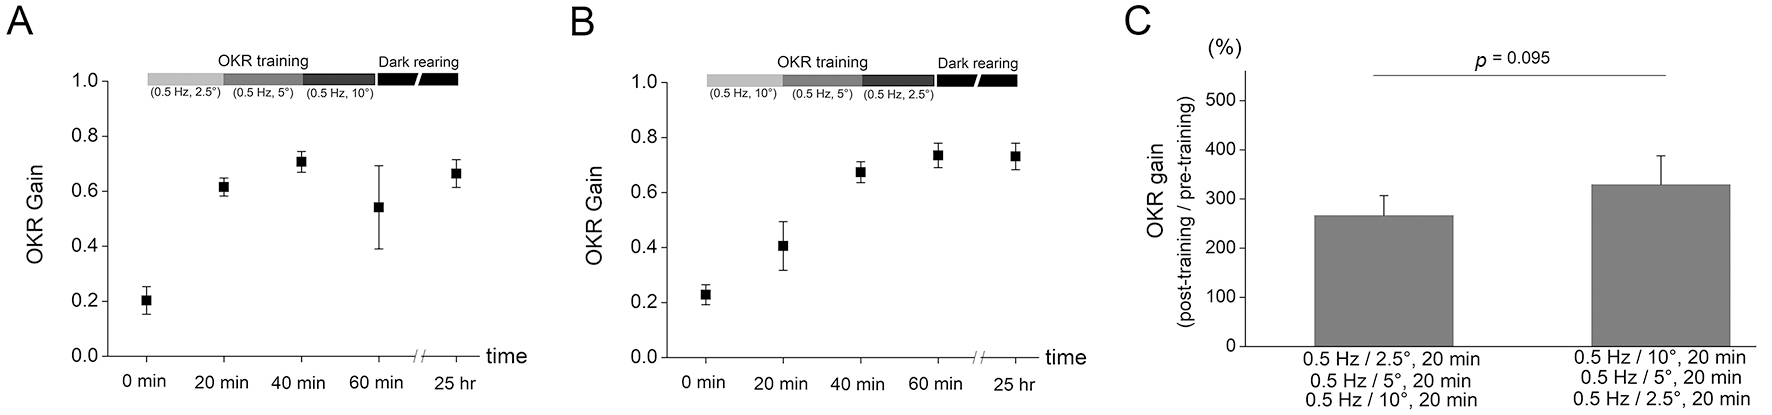
 ± 0.046 to 0.672 ± 0.109 following 20 min OKR training with 0.25 Hz and 5° drum oscillation, slightly increased to 0.755 ± 0.109 following 20 min OKR training with 0.5 Hz and 5° drum oscillation, and decreased to 0.612 ± 0.117 following 20 min OKR training with 1 Hz and 5° drum oscillation. Then, the OKR gain after 24 hr in the dark was 0.750 ± 0.060 (n = 5). (B) The OKR training protocol was composed of serial combination of 20 min OKR training with 1 Hz and 5° drum oscillation, 20 min OKR training with 0.5 Hz and 5° drum oscillation, and 20 min OKR training with 0.25 Hz and 5° drum oscillation. The OKR gain increased from 0.192 ± 0.043 to 0.249 ± 0.069 following 20 min OKR training with 1 Hz and 5° drum oscillation, increased to 0.547 ± 0.133 following 20 min OKR training with 0.5 Hz and 5° drum oscillation, and further increased to 0.753 ± 0.042 following 20 min OKR training with 0.25 Hz and 5° drum oscillation. Then, the OKR gain after 24 hr in the dark was 0.739 ± 0.028 (n = 5). (C) Comparison of OKR gain increase immediately after the 60 min training between two protocols showed that the average ratio of post-training hOKR gain to pre-training hOKR gain was not significantly different between two protocols (p = 0.841, Mann-Whitney U test).

Fig. 4.

The OKR adaptation after training protocols with combination of different amplitude of drum rotations. (A) The OKR training protocol was composed of serial combination of 20 min OKR training with 0.5 Hz and 2.5° drum oscillation, 20 min OKR training with 0.5 Hz and 5° drum oscillation, and 20 min OKR training with 0.5 Hz and 10° drum oscillation. The increase in OKR gain was obtained from 0.203 ± 0.050 to 0.598 ± 0.033 following 20 min OKR training with 0.5 Hz and 2.5° drum oscillation, slightly increased to 0.707 ± 0.038 following 20 min OKR training with 0.5 Hz and 5° drum oscillation, and decreased to 0.542 ± 0.151 following 20 min OKR training with 0.5 Hz and 10° drum oscillation. Then, the OKR gain after 24 hr in the dark was 0.664 ± 0.051 (n = 5). (B) The OKR training protocol was composed of serial combination of 20 min OKR training with 0.5 Hz and 10° drum oscillation, 20 min OKR training with 0.5 Hz and 5° drum oscillation, and 20 min OKR training with 0.5 Hz and 2.5° drum oscillation. The increase in OKR gain was obtained from 0.229 ± 0.036 to 0.406 ± 0.088 following 20 min OKR training with 0.5 Hz and 10° drum oscillation, further increased to 0.674 ± 0.038 following 20 min OKR training with 0.5 Hz and 5° drum oscillation, and slightly increased to 0.735 ± 0.045 following 20 min OKR training with 0.5 Hz and 2.5° drum oscillation. Then, the OKR gain after 24 hr in the dark was 0.731 ± 0.048 (n = 5). (C) Comparison of OKR gain increase immediately after the 60 min training between two protocols showed that the average ratio of post-training hOKR gain to pre-training hOKR gain did not exhibit significant difference between two protocols (p = 0.095, Mann-Whitney U test).

3. Results
3.1 The hOKR Adaptation after Training Protocols with Different Frequency

The OKR adaptation was investigated by measuring OKR gain change after 60 min training of which the protocol consisted of optokinetic drum oscillation with same amplitude and different frequency. After 60 min OKR training with 0.25 Hz and 5° drum oscillation, OKR gain increased from 0.190 ± 0.046 to 0.754 ± 0.074 (Fig. 1A, n = 5). Then, mice were kept for 24 hr in the dark, and OKR gain at the end of 24 hr in the dark was 0.771 ± 0.049 (Fig. 1A). After 60 min OKR training with 0.5 Hz and 5° drum oscillation, OKR gain increased from 0.248 ± 0.078 to 0.776 ± 0.060. Then, the OKR gain after 24 hr in the dark was 0.753 ± 0.052 (Fig. 1B, n = 5). After 60 min OKR training with 1 Hz and 5° drum oscillation, OKR gain increased from 0.233 ± 0.023 to 0.329 ± 0.015. Then, the OKR gain after 24 hr in the dark was 0.447 ± 0.018 (Fig. 1C, n = 5). The quantity of OKR gain increase immediately after the 60 min OKR training was evaluated among three training protocols. The average ratio of post-training OKR gain to pre-training OKR gain was 413.7 ± 91.9% in 0.25 Hz and 5° group, 342.0 ± 126.9% in 0.5 Hz and 5° group, and 142.4 ± 15.7% in 1 Hz and 5° group, which was significantly different among groups (Fig. 1D, p = 0.008, Kruskal–Wallis test).

3.2 The hOKR Adaptation after Training Protocols with Different Amplitude

Then, we investigated the amount of OKR adaptation after training protocols with different amplitude of drum oscillation. After 60 min OKR training with 0.5 Hz and 2.5° drum oscillation, OKR gain increased from 0.182 ± 0.030 to 0.740 ± 0.063 (Fig. 2A, n = 5). Then, mice were maintained for 24 hr in the dark, and OKR gain at the end of 24 hr in the dark was 0.760 ± 0.039 (Fig. 2A). After 60 min OKR training with 0.5 Hz and 5° drum oscillation, as shown in Fig. 1B, OKR gain was enhanced from 0.248 ± 0.078 to 0.776 ± 0.060. Then, the OKR gain after 24 hr in the dark was 0.753 ± 0.052 (Fig. 2B, n = 5). After 60 min OKR training with 0.5 Hz and 10° drum oscillation, the increase of OKR gain was obtained from 0.196 ± 0.044 to 0.516 ± 0.053. Then, the OKR gain after 24 hr in the dark was 0.609 ± 0.050 (Fig. 2C, n = 5). The amount of OKR gain increase immediately after the 60 min OKR training was evaluated among three training protocols. The average ratio of post-training OKR gain to pre-training OKR gain was 413.3 ± 65.2% in 0.5 Hz and 2.5° group, 342.0 ± 126.9% in 0.5 Hz and 5° group, and 276.0 ± 72.6% in 0.5 Hz and 10° group, which was significantly different among groups (Fig. 2D, p = 0.031, Kruskal–Wallis test).

3.3 The hOKR Adaptation after Training Protocols with Serial Combination of Different Frequency

The amount of OKR adaptation after training with serial combination of different frequency was tested. Training protocol consisted of three consecutive 20 min drum oscillations with different frequency while keeping the amplitude of drum rotation constant. First, the OKR training was conducted by serial combination of 20 min OKR training with 0.25 Hz and 5° drum oscillation, 20 min OKR training with 0.5 Hz and 5° drum oscillation, and 20 min OKR training with 1 Hz and 5° drum oscillation (Fig. 3A). The increase of OKR gain was obtained from 0.176 ± 0.046 to 0.672 ± 0.109 following 20 min OKR training with 0.25 Hz and 5° drum oscillation, slightly increased to 0.755 ± 0.109 following 20 min OKR training with 0.5 Hz and 5° drum oscillation, and decreased to 0.612 ± 0.117 following 20 min OKR training with 1 Hz and 5° drum oscillation. Mice were maintained in the absolute dark for 24 hr after training, and the OKR gain at the termination of 24 hr dark rearing was measured as 0.750 ± 0.060 (n = 5). Then, the OKR training was conducted by serial combination of 20 min OKR training with 1 Hz and 5° drum oscillation, 20 min OKR training with 0.5 Hz and 5° drum oscillation, and 20 min OKR training with 0.25 Hz and 5° drum oscillation (Fig. 3B). The increase of OKR gain was measured from 0.192 ± 0.043 to 0.249 ± 0.069 following 20 min OKR training with 1 Hz and 5° drum oscillation, increased to 0.547 ± 0.133 following 20 min OKR training with 0.5 Hz and 5° drum oscillation, and further expanded to 0.753 ± 0.042 following 20 min OKR training with 0.25 Hz and 5° drum oscillation. Mice were maintained in the absolute dark for 24 hr after training, and the OKR gain was measured as 0.739 ± 0.028 (n = 5) at the termination of 24 hr dark rearing. The immediate increase of OKR gain following the 60 min training was compared between the protocol with increasing frequency (Fig. 3A) and that with decreasing frequency (Fig. 3B). The average ratio of post-training OKR gain to pre-training OKR gain was lower in the protocol with increasing frequency (374.3 ± 134.8, left bar in Fig. 3C) than that with decreasing frequency (402.9 ± 59.7, right bar in Fig. 3C), which, however, was not significantly different between two protocols (p = 0.841, Mann-Whitney U test).

3.4 The hOKR Adaptation after Training Protocols with Serial Combination of Different Amplitude

The amount of OKR adaptation after training with serial combination of different amplitude was tested. Training protocol consisted of three consecutive 20 min drum oscillations with different amplitude while keeping the frequency of drum rotation constant. First, the OKR training was conducted by serial combination of 20 min OKR training with 0.5 Hz and 2.5° drum oscillation, 20 min OKR training with 0.5 Hz and 5° drum oscillation, and 20 min OKR training with 0.5 Hz and 10° drum oscillation (Fig. 4A). The increase in OKR gain was obtained from 0.203 ± 0.050 to 0.598 ± 0.033 following 20 min OKR training with 0.5 Hz and 2.5° drum oscillation, slightly increased to 0.707 ± 0.038 following 20 min OKR training with 0.5 Hz and 5° drum oscillation, and decreased to 0.542 ± 0.151 following 20 min OKR training with 0.5 Hz and 10° drum oscillation. Mice were maintained in the absolute dark for 24 hr after training, and the OKR gain at the termination of 24 hr dark rearing was measured as 0.664 ± 0.051 (n = 5). Then, the OKR training was conducted by serial combination of serial combination of 20 min OKR training with 0.5 Hz and 10° drum oscillation, 20 min OKR training with 0.5 Hz and 5° drum oscillation, and 20 min OKR training with 0.5 Hz and 2.5° drum oscillation (Fig. 4B). The increase in OKR gain was obtained from 0.229 ± 0.036 to 0.406 ± 0.088 following 20 min OKR training with 0.5 Hz and 10° drum oscillation, further increased to 0.674 ± 0.038 following 20 min OKR training with 0.5 Hz and 5° drum oscillation, and slightly increased to 0.735 ± 0.045 following 20 min OKR training with 0.5 Hz and 2.5° drum oscillation. Mice were maintained in the absolute dark for 24 hr after training, and the OKR gain at the termination of 24 hr dark rearing was measured as 0.731 ± 0.048 (n = 5). The OKR gain increase immediately after the 60 min training was compared between the protocol with increasing amplitude (Fig. 4A) and that with decreasing amplitude (Fig. 4B). The average ratio of post-training OKR gain to pre-training OKR gain was lower in the protocol with increasing amplitude (266.3 ± 40.6, left bar in Fig. 4C) than that with decreasing amplitude (329.0 ± 59.1, right bar in Fig. 4C), which, however, was not significantly different between two protocols (p = 0.095, Mann-Whitney U test).

4. Discussion

Sustained oscillation of optokinetic drum evokes remarkable retinal slip, and consequently induces the increase in OKR gain to reduce the retinal slip. The OKR is activated by genuine retinal slip, and due to the relatively considerable latency in visual processing, this OKR reaction responds late [15]. The adaptive change of OKR occurs during continuous optokinetic stimulation, which is under regulation of the cerebellar flocculus. The present study investigated if OKR adaptation is training frequency- and amplitude-specific. A frequency-specific change in gain is one of the most interesting characteristics of VOR adaptation in rabbits and monkeys [16, 17], although the neural mechanisms underlying this frequency specificity is not clear. Hübner et al. [18] reported that when VOR gain was measured at the same peak velocity and acceleration utilized during training in mice, the efficacy of VOR adaption training was maximized. Considering frequency-specific VOR adaptation, two possibilities have been offered. According to the “frequency-channel hypothesis” parallel adaptable filters with overlapping bandwidths transport data about the frequency components of head movements and central adaptive mechanisms change the tuning of these particular “channels” [19]. The “context-specific adaptation” postulates that VOR adaptation is dependent upon modification of the tonic (velocity sensitive) and phasic (acceleration sensitive) afferent signals from the vestibular periphery [20, 21]. In contrast to VOR adaptation, it has been controversial regarding frequency-specificity of OKR adaptation. Collewijn and Grootendorst [3] measured OKR gain increase after 4 hr optokinetic training with 1/6 Hz and 20° in rabbits, and showed that the amount of OKR adaptation was greater at 1/6 Hz- than 1/3 Hz- and 1/12 Hz-OKR gain test. Nagao measured OKR gain increase after 4 hr optokinetic training with 0.33 Hz and 2.5° in rabbits, and also showed that the amount of OKR adaptation was greater at the same frequency of testing than other frequencies [22]. Iwashita et al. [1] conducted OKR training with 0.4 Hz and 1.8° for 2 hr using mice, and reported that the OKR gain increase was not restricted to the oscillation frequency used for the training. The increase in OKR gain obtained from 0.58 ± 0.03 to 0.60 ± 0.05 after training when the OKR gain was tested with 0.2 Hz ± 1.8°, from 0.31 ± 0.05 to 0.55 ± 0.05 after training when the OKR gain was tested with 0.4 Hz ± 1.8°, and from 0.22 ± 0.02 to 0.53 ± 0.07 after training when the OKR gain was tested with 0.8 Hz ± 1.8° [1]. Katoh et al. [4] reported that the greater amount of OKR adaptation was induced by OKR training with 5.2°/s oscillation than 1.7°/s oscillation. They assumed that modest retinal slippage had only a minor impact on OKR increase during optokinetic stimulation with 1.7°/s while sufficient retinal slips induced OKR adaptation by 5.2°/s optokinetic stimulation [4], which was inconsistent with the results of the present study. The present study, in which we used 0.5 Hz and 5° drum rotation for every OKR gain testing, demonstrated that the amount of OKR adaptation was greater after OKR training with lower frequency or amplitude than that with higher frequency or amplitude (Figs. 1,2). It is well known that the performance of OKR is better at lower frequencies than higher frequencies, and OKR gain becomes lower as stimulating optokinetic drum frequency increases [1, 4, 8, 22, 23]. The reason OKR functions well at low frequencies is because the retinal slip is delayed (by ~100 ms) due to visual processing time [24]. The finding of the present study that the OKR adaptation was greater by OKR training with lower velocity, can be postulated that the retinal slip signal with lower velocity serves as more precise instructive signal for learning, leading to induction of more efficient training effect.

Another interesting finding of the present study was that the OKR gain increase tended to be greater after training which is composed of sequential combination of decreasing frequency (Fig. 3) or amplitude (Fig. 4) than that composed of sequential combination of increasing frequency or amplitude, although the difference was not significantly different. Furthermore, increased OKR gain was decreased by subsequent OKR training with high frequency (1 Hz and 5° for 20 min, Fig. 3A) or with high amplitude (0.5 Hz and 10° for 20 min, Fig. 4A) stimulation. Thus, the OKR training with high frequency or amplitude may eliminate part of learning effects which have already been formed by previous training. We postulate that the stimulation during training with high frequency or amplitude may implement a disturbing instruction for OKR learning when it is conducted in mice with increased OKR gain by previous OKR training. In addition, the results demonstrated that the amount of OKR adaptation was, although the maximum velocity is same between drum rotation with 0.5 Hz/10° and that with 1 Hz/5°, greater after training with 0.5 Hz/10° (Fig. 2C) than that with 1 Hz/5° (Fig. 1C). This may suggest that even when training velocity is same, the lower frequency OKR stimulation serves as more precise instructive signal.

5. Conclusions

The OKR gain increase was greater after OKR training with lower frequency or amplitude than that with higher frequency or amplitude, which may be postulated that the retinal slip signal with lower-velocity OKR stimulation serves as more precise instructive signal for learning than higher-velocity OKR stimulation.

Author Contributions

Conceptualization of the study—SJK, C-HK. Drafting the manuscript—NCP, C-HK. Data collection—NCP, YGK. Data interpretation—NCP, YGK, SJK, C-HK. Revision of the manuscript for intellectual content—SJK, C-HK.

Ethics Approval and Consent to Participate

All procedures were approved by the Institutional Animal Care and Use Committee of Seoul National University College of Medicine. The approval number is SNU-131028-1.

Acknowledgment

Not applicable.

Funding

This work was supported by the National Research Foundation of Korea (NRF) grant funded by the Korea government (MSIP) (2021R1F1A1062019, 2018R1A5A2025964).

Conflict of Interest

The authors declare no conflict of interest.

References
[1]
Iwashita M, Kanai R, Funabiki K, Matsuda K, Hirano T. Dynamic properties, interactions and adaptive modifications of vestibulo-ocular reflex and optokinetic response in mice. Neuroscience Research. 2001; 39: 299–311.
[2]
Land M. Eye movements in man and other animals. Vision Research. 2019; 162: 1–7.
[3]
Collewijn H, Grootendorst AF. Adaptation of optokinetic and vestibulo-ocular reflexes to modified visual input in the rabbit. Progress in Brain Research. 1979; 50: 771–781.
[4]
Katoh A, Kitazawa H, Itohara S, Nagao S. Dynamic characteristics and adaptability of mouse vestibulo-ocular and optokinetic response eye movements and the role of the flocculo-olivary system revealed by chemical lesions. Proceedings of the National Academy of Sciences of the United States of America. 1998; 95: 7705–7710.
[5]
Van Alphen AM, De Zeeuw CI. Cerebellar LTD facilitates but is not essential for long-term adaptation of the vestibulo-ocular reflex. European Journal of Neuroscience. 2002; 16: 486–490.
[6]
Faulstich BM, Onori KA, du Lac S. Comparison of plasticity and development of mouse optokinetic and vestibulo-ocular reflexes suggests differential gain control mechanisms. Vision Research. 2004; 44: 3419–3427.
[7]
Holland PJ, Sibindi TM, Ginzburg M, Das S, Arkesteijn K, Frens MA, et al. A Neuroanatomically Grounded Optimal Control Model of the Compensatory Eye Movement System in Mice. Frontiers in Systems Neuroscience. 2020; 14: 13.
[8]
Pham NC, Kim YG, Kim SJ, Kim C. Differential effects of inferior olive lesion on vestibulo-ocular and optokinetic motor learning. NeuroReport. 2020; 31: 9–16.
[9]
Pham NC, Kim YG, Kim SJ, Kim C. Adaptation of vestibulo-ocular and optokinetic reflexes after massed and spaced vestibulo-ocular motor learning. Behavioural Brain Research. 2022; 426: 113837.
[10]
Kim YG, Kim SJ. Decreased intrinsic excitability of cerebellar Purkinje cells following optokinetic learning in mice. Molecular Brain. 2020; 13: 136.
[11]
Inoshita T, Hirano T. Occurrence of long-term depression in the cerebellar flocculus during adaptation of optokinetic response. eLife. 2018; 7: e36209.
[12]
Ryu C, Jang DC, Jung D, Kim YG, Shim HG, Ryu HH, et al. STIM1 Regulates Somatic Ca(2+) Signals and Intrinsic Firing Properties of Cerebellar Purkinje Neurons. The Journal of Neuroscience. 2017; 37: 8876–8894.
[13]
Pham NC, Kim YG, Kim SJ, Kim C. Efficacy of spaced learning in adaptation of optokinetic response. Brain and Behavior. 2021; 11: e01944.
[14]
Stahl JS, van Alphen AM, De Zeeuw CI. A comparison of video and magnetic search coil recordings of mouse eye movements. Journal of Neuroscience Methods. 2000; 99: 101–110.
[15]
Glasauer S. Current Models of the Ocular Motor System. Developments in Ophthalmology. 2007; 40: 158–174.
[16]
Angelaki DE, Hess BJM. Visually Induced Adaptation in Three-Dimensional Organization of Primate Vestibuloocular Reflex. Journal of Neurophysiology. 1998; 79: 791–807.
[17]
Raymond JL, Lisberger SG. Behavioral Analysis of Signals that Guide Learned Changes in the Amplitude and Dynamics of the Vestibulo-Ocular Reflex. The Journal of Neuroscience. 1996; 16: 7791–7802.
[18]
Hübner PP, Khan SI, Migliaccio AA. Velocity-selective adaptation of the horizontal and cross-axis vestibulo-ocular reflex in the mouse. Experimental Brain Research. 2014; 232: 3035–3046.
[19]
Dean P, Porrill J, Ekerot C, Jörntell H. The cerebellar microcircuit as an adaptive filter: experimental and computational evidence. Nature Reviews Neuroscience. 2010; 11: 30–43.
[20]
Clendaniel RA, Lasker DM, Minor LB. Horizontal Vestibuloocular Reflex Evoked by High-Acceleration Rotations in the Squirrel Monkey. IV. Responses after Spectacle-Induced Adaptation. Journal of Neurophysiology. 2001; 86: 1594–1611.
[21]
Clendaniel RA, Lasker DM, Minor LB. Differential Adaptation of the Linear and Nonlinear Components of the Horizontal Vestibuloocular Reflex in Squirrel Monkeys. Journal of Neurophysiology. 2002; 88: 3534–3540.
[22]
Nagao S. Effects of vestibulocerebellar lesions upon dynamic characteristics and adaptation of vestibulo-ocular and optokinetic responses in pigmented rabbits. Experimental Brain Research. 1983; 53: 36–46.
[23]
Andreescu CE, De Ruiter MM, De Zeeuw CI, De Jeu MTG. Otolith Deprivation Induces Optokinetic Compensation. Journal of Neurophysiology. 2005; 94: 3487–3496.
[24]
Robinson DA. The systems approach to the oculomotor system. Vision Research. 1986; 26: 91–99.

Publisher’s Note: IMR Press stays neutral with regard to jurisdictional claims in published maps and institutional affiliations.

Share
Back to top