
Academic Editor: Hongmin Wang
Background: This study aimed to reveal the detailed immune-related mechanisms underlying ischemic stroke (IS) and identify new immune-associated biomarkers for clinical management. Methods: Differentially expressed genes (DEGs) between IS samples and normal controls were identified using the GSE16561 dataset. The feature genes of the immune cells were investigated using the GSE72642 dataset. Weighted correlation network analysis (WGCNA) was performed to reveal module genes, followed by an investigation of common DEGs and a functional enrichment analysis. Potential biomarkers were identified based on hub genes in protein-protein interaction networks and WGCNA. Finally, GSE158312 was used for biomarker verification. Results: In total, 1230 DEGs were identified between the IS samples and normal controls. Seven clinically significant modules were identified using WGCNA. The yellow module genes were positively correlated with polymorphonuclear cells (PMNC), whereas the brown module genes were positively correlated with CD4+ T cells. Eight genes were selected as hub genes. These genes are mainly involved in functions such as the innate immune response. Upregulated TLR2 and ARG1 levels were significantly different between the two groups in the verification dataset. Conclusions: Our findings suggest ARG1 and TLR2 as novel biomarkers for IS. Upregulated TLR2 might play a role in IS development by participating in the innate immune response function.
Ischemic stroke (IS) is a common stroke disease that causes a large number of deaths worldwide [1]. Many mechanisms, including inflammation, are closely related to IS pathogenesis [2, 3, 4]. To date, there is no known treatment or cure for this disease [5]. The lack of effective treatment is one of the reasons for the difficulty IS poses in clinical settings [6]. Thus, uncovering the detailed molecular mechanisms underlying IS is vital for effective clinical treatment.
Increasing evidence shows that the immune system interacts with the central nervous system in complex ways [7]. Importantly, some immune cells respond to stroke in both rodents and human patients [8]. Moreover, it has been demonstrated that peripheral immune cells can infiltrate into sites of secondary neurodegeneration after IS [9]. In fact, the brain can hardly defend itself against anti-oxidation, leading to the release of free radicals in the process of inflammation, which directly threatens the normal activity of brain tissue [10]. During these processes, some inflammatory factors play important roles in disease progression and are considered key mediators of the immune mechanism in IS [11]. A previous differentially expressed gene (DEGs) analysis related to IS suggested interleukin-8 (IL-8) as a novel target for clinical therapy [12]. Additionally, some immune-associated factors, including IL family members and T cells, participate in the development of IS, indicating a close relationship between the immune process and IS [13]. Thus, promising target interventions based on potential immune cells and associated genes may promote the development of future therapeutics for IS [14]. However, the immune-related mechanisms are still not systematically understood.
Based on gene expression profiling GSE16561 and pathway analysis, Barr et al. [15] investigated nine DEGs between IS blood samples and controls as likely biomarkers of stroke. Based on the GSE72642 dataset, Du et al. [16] identified several immune cells (including CD4+ T cells) that contribute to IS progression. In the current study, we analyzed the feature genes and pathways related to immune cells in IS using an integrated analysis of GSE16561 and GSE72642. Briefly, potential DEGs were identified between the IS samples and normal controls based on the GSE16561 dataset. The feature genes of immune cells between IS samples and controls were investigated based on the GSE72642 dataset. Weighted correlation network analysis (WGCNA) was performed to identify module genes in the GSE16561 dataset, followed by an investigation of common DEGs (co-DEGs) by intersecting DEGs and module genes. The functions and pathways enriched by the co-DEGs were further revealed. Furthermore, potential biomarkers were identified based on the previous hub genes. Finally, an additional profile GSE158312 dataset was used to verify biomarkers. In this way, the current study aimed to investigate the detailed immune-related mechanisms underlying IS and identify new immune-associated biomarkers for clinical management. A flow chart of the current study is shown in Fig. 1.
 Fig. 1.
Flow chart for the current study.
Three gene expression profiles, including the GSE16561 [15] and GSE72642 datasets [16], were downloaded from the Gene Expression Omnibus (GEO) database [17]. The GSE16561 dataset contained 63 peripheral whole blood samples, including 39 IS samples (IS group) and 24 normal samples (control group). For the GSE72642 dataset, a total of 18 cell samples (three samples for each cell type), including CD4+ T cells, CD8+ T cells, CD19+ B cells, CD56+ natural killer cells, CD14+ monocytes, and polymorphonuclear cells (PMNC), were collected from the peripheral blood of healthy individuals.
The processed gene expression matrix files of the GSE16561 and GSE72642 datasets were downloaded. The annotation files were downloaded, converted, and screened. If multiple probes were available for the same gene, the average value was taken as the expression value. The raw data of the GSE158312 dataset were standardized using the TMM algorithm in the edgeR package (version: 3.24.3, https://www.bioconductor.org/packages/release/bioc/html/edgeR.html, Walter and Eliza Hall Institute of Medical Research, Melbourne, Australia) [18] and converted to logCPM values.
The limma package (version:
3.34.7,
http://www.bioconductor.org/packages/release/bioc/html/limma.html,
Walter and Eliza Hall Institute of Medical Research, Melbourne, Australia) [19]
(version: 3.34.7) was used to analyze the DEGs between the IS and control group
in GSE16561. Then, the corresponding p values and log fold change (FC)
values of the genes were obtained. p values were adjusted (adj.
p) using the Benjamin-Hochberg method. In addition, genes with an adj.
p
The limma package was used to analyze the feature genes of each peripheral blood immune cell. Briefly, a certain cell type was compared with all other cell types, and the top 100 upregulated genes in each cell type were selected as the feature genes of the subtype according to a previous study [20]. Finally, the results were visualized as a heatmap using Pheatmap package (version 1.0.12, https://cran.r-project.org/web/packages/pheatmap/index.html) in R software (University of Auckland, Auckland, New Zealand).
Based on the expression matrix of all genes, variance analysis was used to
explore the top 2000 genes with the highest degree of variation among the samples
as the input genes, and the gene set module with the highest degree of
collaborative change was identified using WGCNA (version 1.71,
https://cran.r-project.org/web/packages/WGCNA/index.html) [21] in R software.
First, a soft threshold of 0.85 was selected for network
construction for the first time
(minModuleSize = 30; MEDissThres = 0.2). Second, a scale-free network was
constructed. The module membership (MM, representing the expression level of the
module) of each module was then calculated. The gene significance (GS) of the
genes in the module was further calculated. Finally, GS
The co-DEGs were investigated based on the intersection of DEGs and module genes
related to both disease status and immune cells using a VENN plot. GO and KEGG
pathway enrichment analyses were performed on these co-DEGs using DAVID software
(version: 6.8, https://david.ncifcrf.gov/, Laboratory of Human Retrovirology
and Immunoinformatic, Frederick, MD, USA) [22]. Finally, p
According to the STING database (version 11.0) [23], protein interactions were
extracted and PPI pairs were investigated based on a score of 0.4. The PPI
network was constructed using Cytoscape software (version
3.6.1,
http://www.cytoscape.org, National Institute of
General Medical Sciences, Bethesda, MD, USA) [24]. The node score (hub protein)
in the network was analyzed using network topology based on CytoNCA software
(Version 2.1.6, http://apps.cytoscape.org/apps/cytonca Central South University,
Changsha, China) [25], with parameter set as: without weight. Furthermore, MCODE
(version: 1.5.1,
http://apps.cytoscape.org/apps/MCODE,
University of Toronto, Toronto, Canada) [26] was used to screen outstanding
modules from the PPI network with the following parameters: Degree Cutoff = 2,
Node Score Cutoff = 0.2, K-core = 2, and Max. Depth = 100. GO and KEGG analyses
were performed on these selected modules using clusterProfiler (version:3.8.1)
[27] software. A p value
Potential biomarker genes were investigated based on the module genes enriched in multiple pathways, hub genes in the PPI network, and hub genes from the WGCNA using the LASSO algorithm. The glmnet package (version: 4.1-4, https://cran.r-project.org/web/packages/glmnet/index.html) [28] in R software was used for a regression analysis of the potential biomarkers set to screen for biomarkers for IS.
An additional dataset (GSE158312) was used for the verification. The dataset contained 24 whole blood samples, including 20 IS samples and four normal samples. All samples in the GSE158312 dataset were sequenced using the Illumina nextseq 500 (Homo sapiens). Briefly, the expression levels of biomarkers were extracted from the GSE16561 dataset. The expression levels of the corresponding genes were identified in the GSE72642 dataset, followed by comparison and visualization. Based on the different groups and the expression value of each gene, the diagnostic ROC curve of each gene was investigated using the pROC package (version: 1.18.0, https://cran.r-project.org/web/packages/pROC/index.html) [29] in R software.
A total of 1230 DEGs were investigated between the IS and control groups based on the GSE16561 dataset (Fig. 2A). The top 100 upregulated genes in each cell type in the GSE72642 dataset were selected as feature genes. A heatmap for these feature genes showed that the feature genes of each cell type were highly expressed in the corresponding cell types (Fig. 2B).
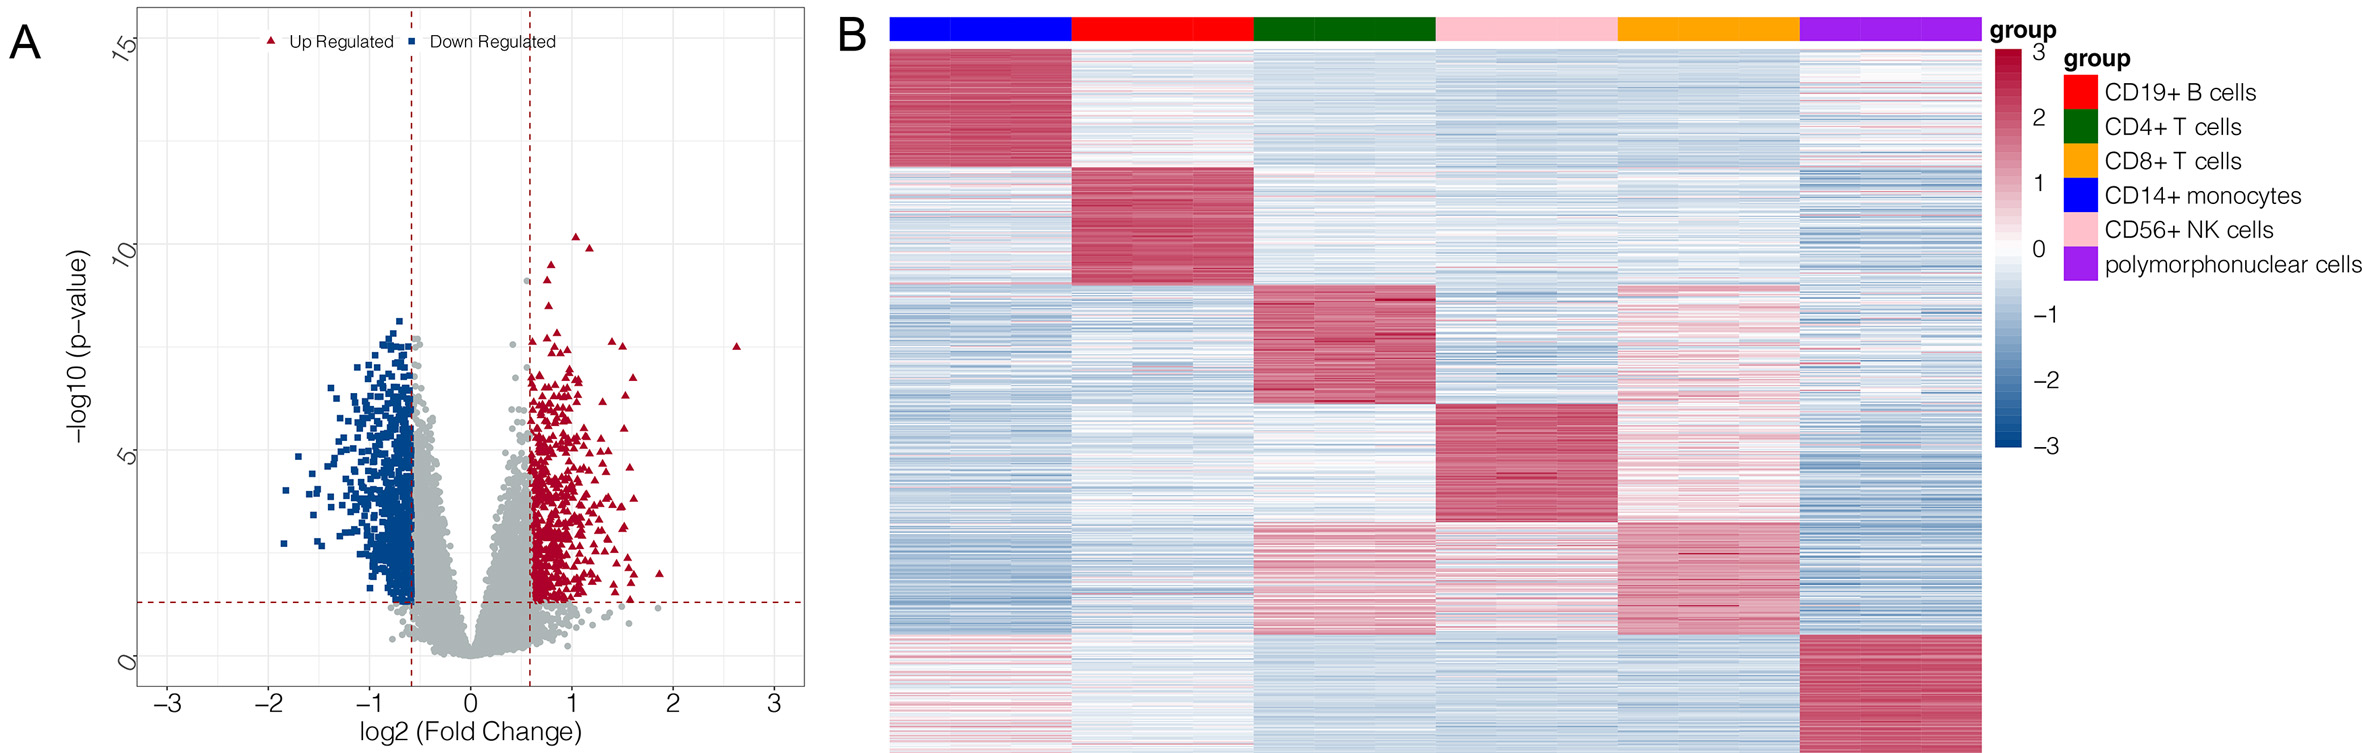 Fig. 2.
Volcano plot and heatmap for differentially expressed genes
(DEGs). (A) volcano plot for DEGs in GSE16561: the blue and red node represent
the down- and up-regulated genes; the red horizontal line represents p
WGCNA analysis was performed on the top 2000 genes that were differentially
expressed in the GSE16561 dataset at a soft threshold of 3 (Fig. 3A) and a
fitting degree of 0.8. Thus, seven modules were obtained in the current study
(Fig. 3B,C). According to the relationship between the expression values of genes
in the module, the adjacency correlation between modules and disease status was
calculated and visualized using a heatmap (Fig. 3D). The result showed that the
yellow module (including 101 genes) had the highest positive correlation with IS
(r = 0.64, p
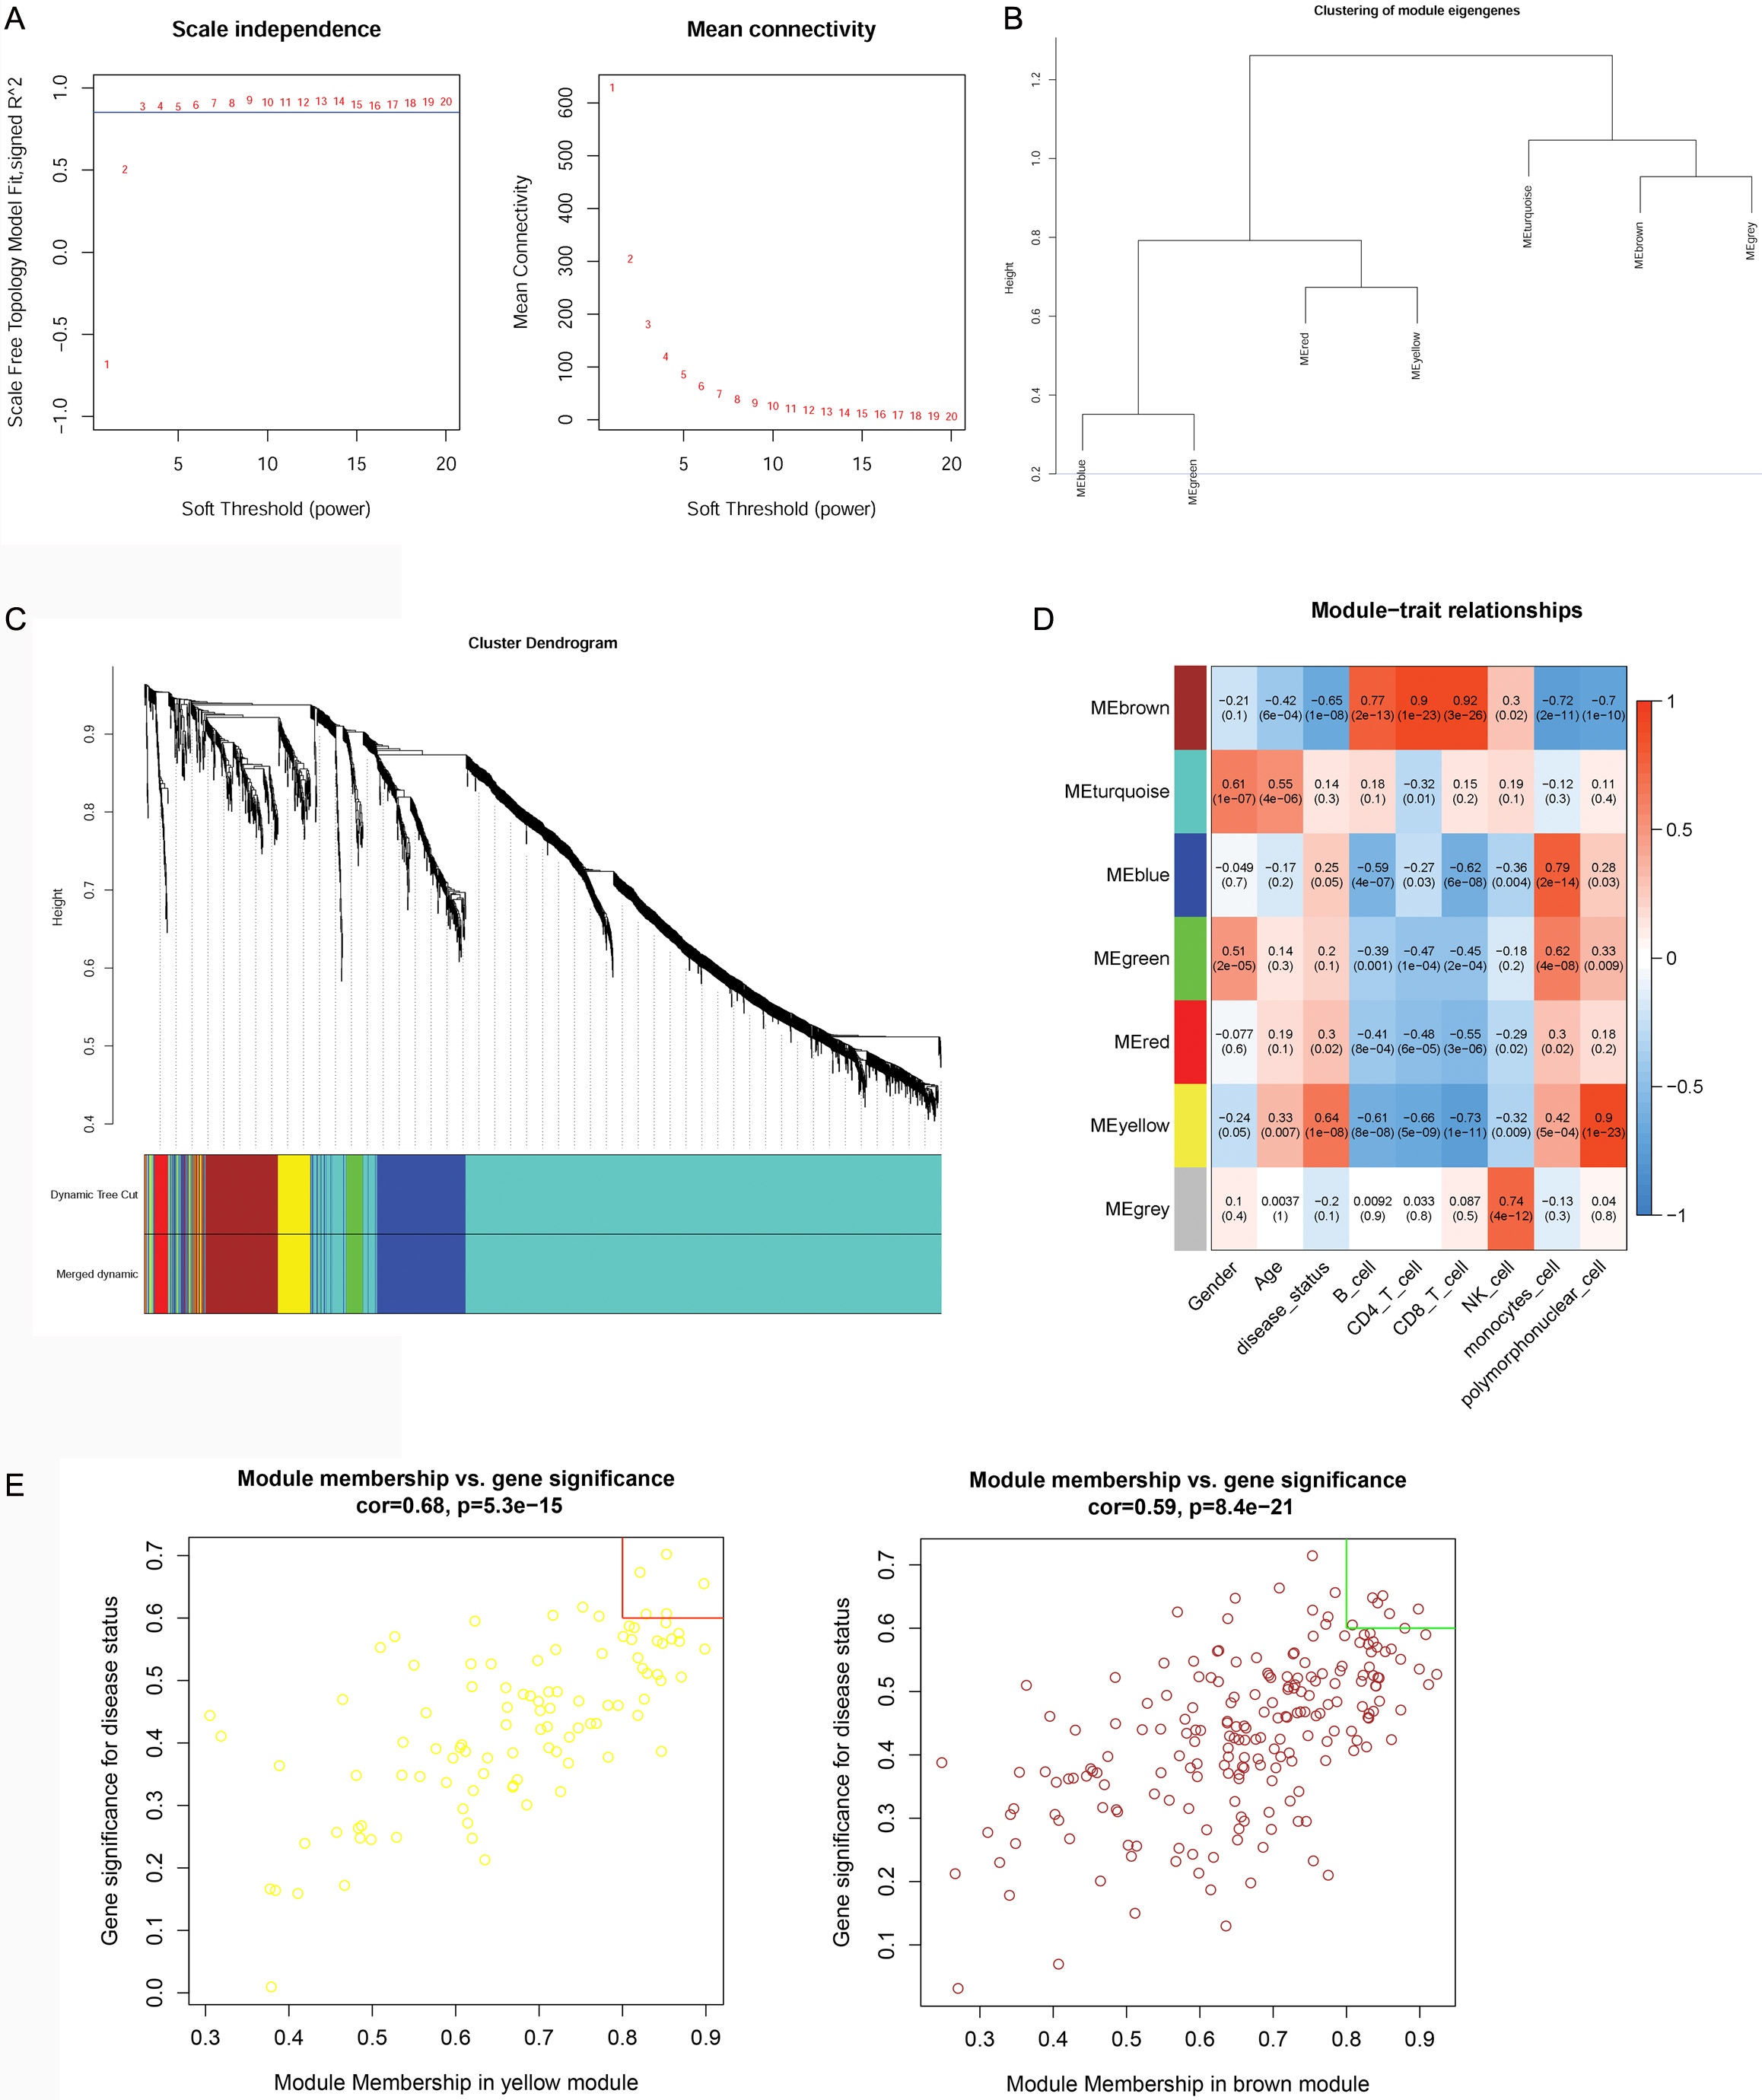 Fig. 3.
Results of the weighted correlation network analysis (WGCNA). (A) power value for the WGCNA analysis: the X-axis represents the soft threshold (power), while the Y-axis represents the scale free topology model fit. (B) Module clustering: the blue line indicated that the dissimilarity coefficient = 0.2. (C) Merging results: different colors represent different gene modules. (D) correlation analysis between modules and traits: the upper number represents correlation confidence; the lower number represents the p value. The different colors represent different modules. (E) Hub genes investigation: the X-axis represents the module membership (MM) value, while the Y-axis represents the gene significance (GS) value.
The VENN plot analysis was performed on upregulated DEGs vs. yellow module genes, as well as on downregulated DEGs vs. brown module genes. The analysis identified 74 upregulated and 137 downregulated co-DEGs that were then further investigated (Supplementary Fig. 1). These upregulated co-DEGs were mainly assembled into nine GO-biological process (BP) functions such as the innate immune response (GO:0045087; Genes: CLEC5A, CLEC4E, TLR2, etc.) (Fig. 4A). No KEGG pathway was significantly enriched in the upregulated co-DEGs. The downregulated co-DEGs were mainly assembled into 13 GO-BP functions, including immune responses (GO:0006955; Genes: V-Set Pre-B Cell Surrogate Light Chain 3 (VPREB3), CD79B, CD8A, etc.) (Fig. 4B), as well as into 10 KEGG pathways, including the primary immunodeficiency pathway (hsa05340; genes: CD40LG, CD8A, CD19, etc.) (Fig. 4C).
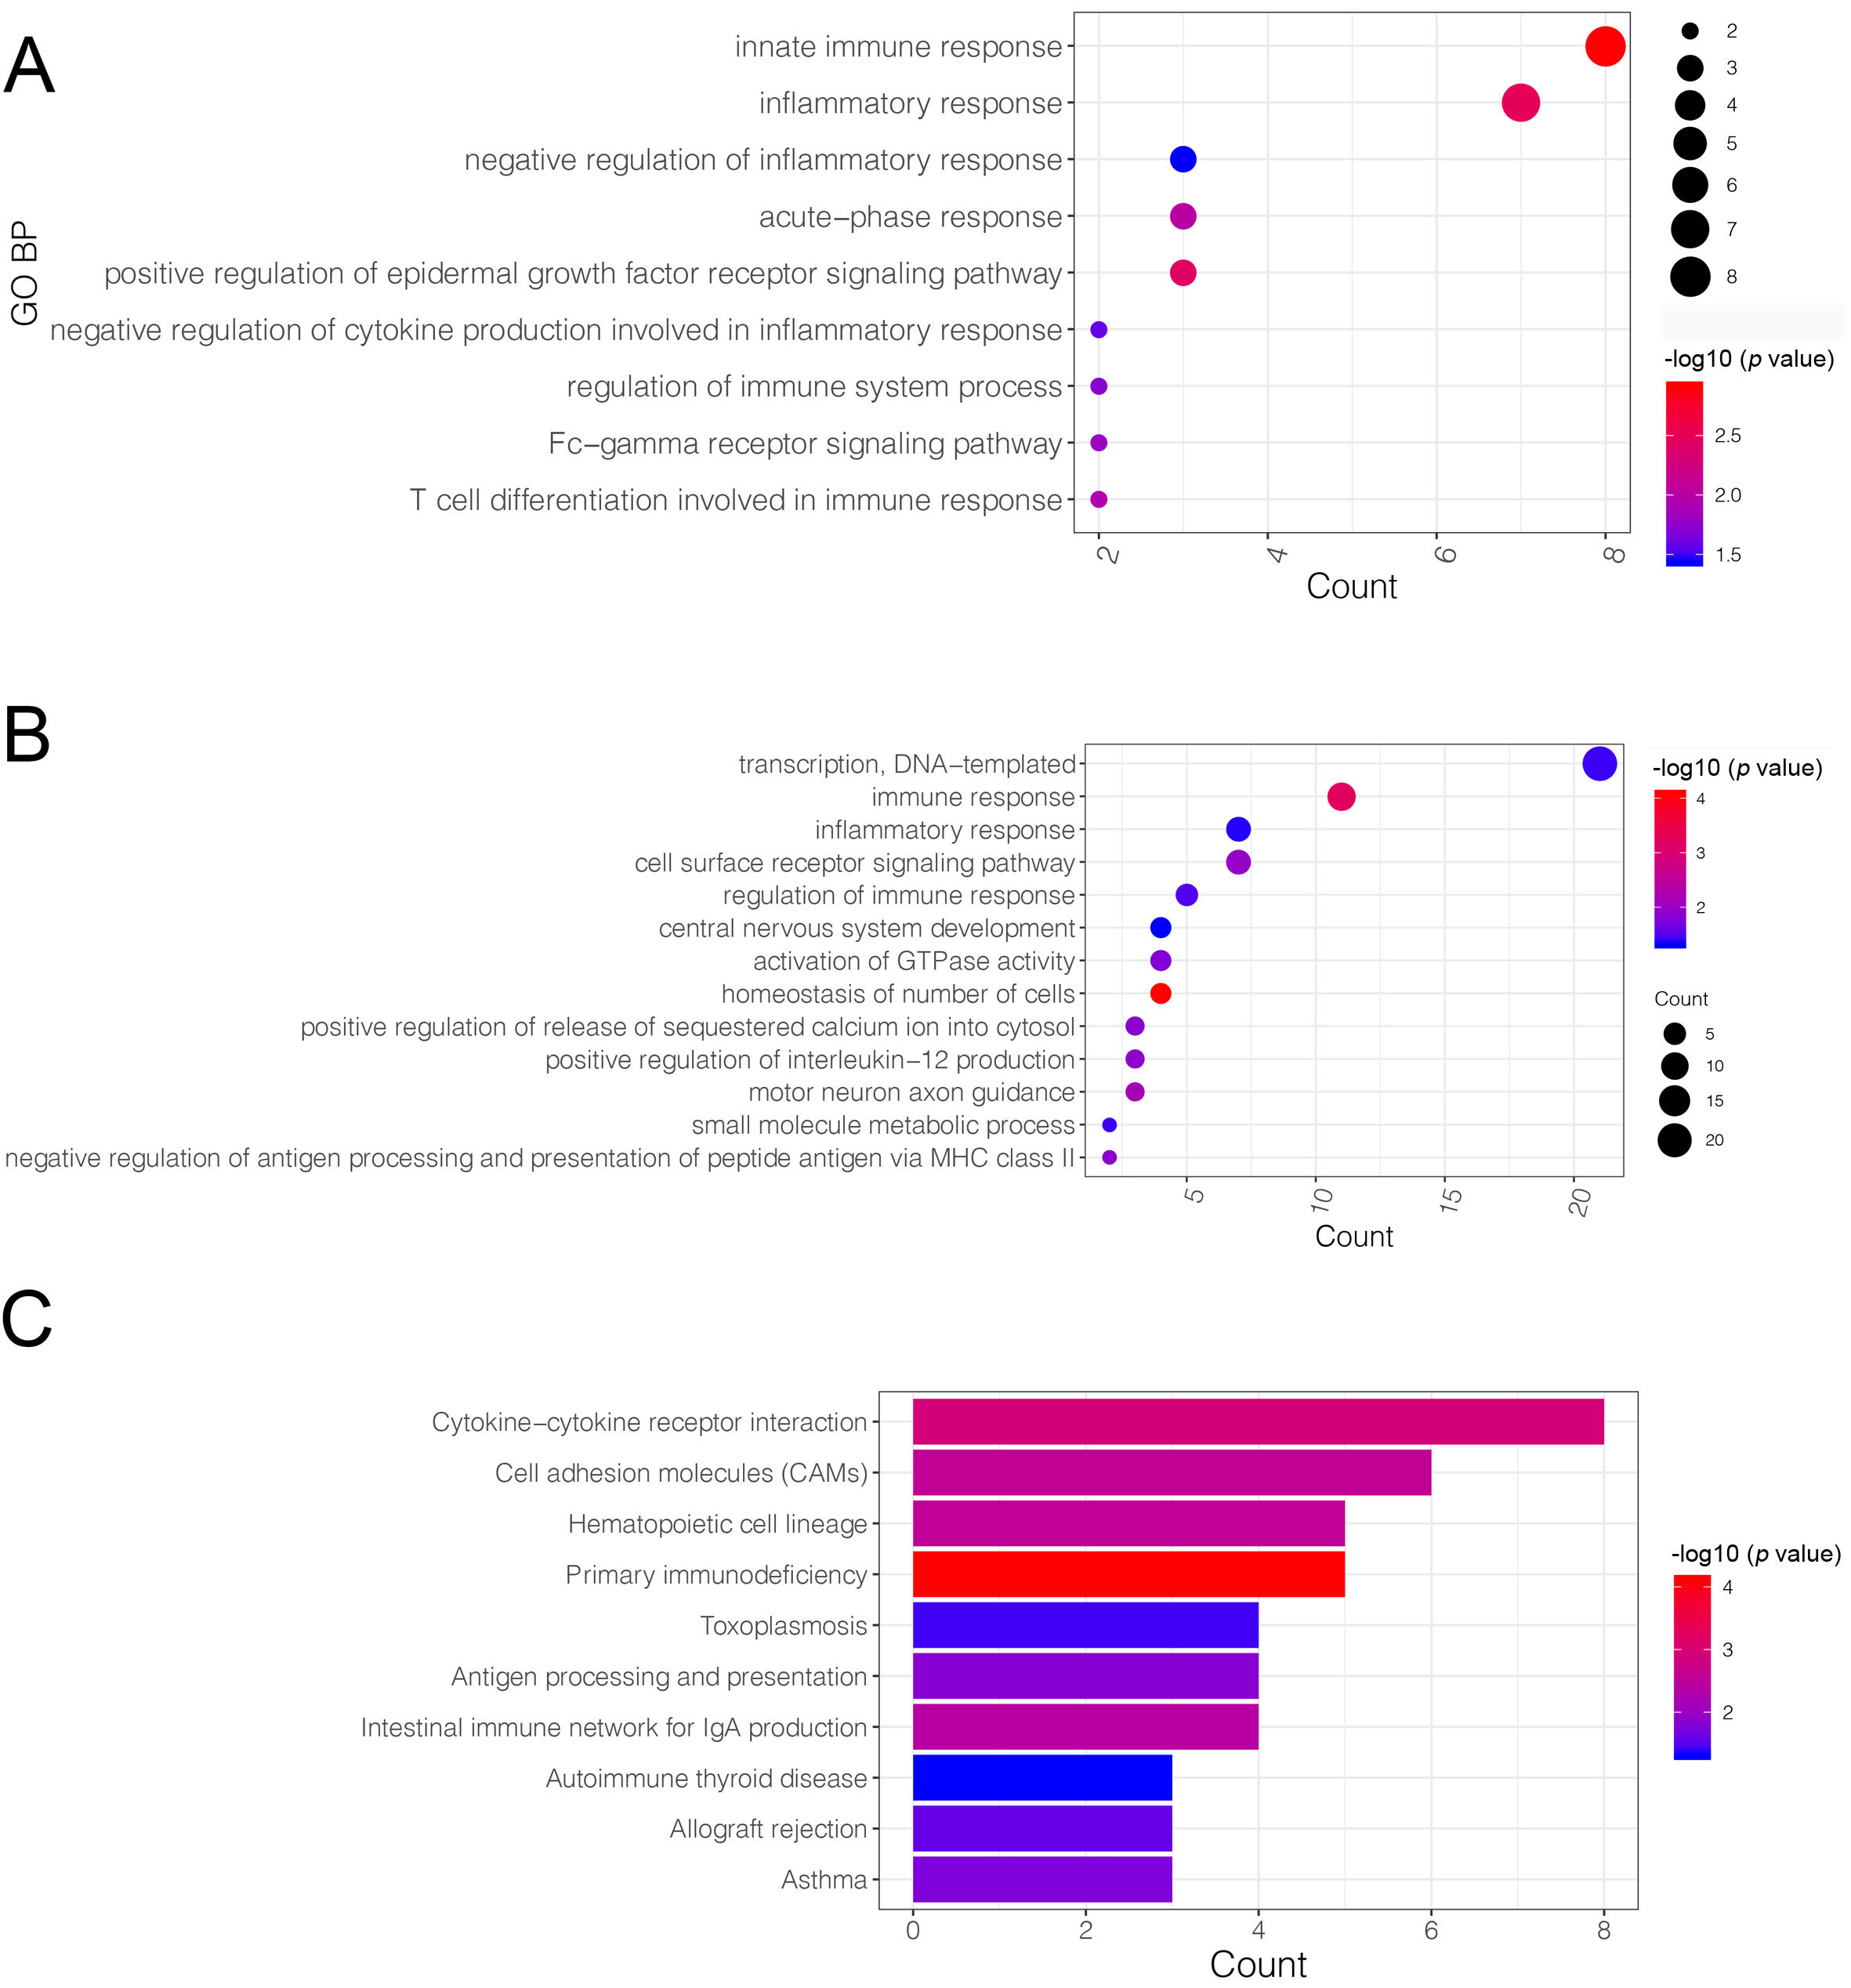 Fig. 4.
Gene ontology (GO)-biological process (BP) function and Kyoto Encyclopedia of Genes and Genomes (KEGG) pathway enrichment analysis based on common-differentially expressed genes (co-DEGs). (A) The GO-BP functions assembled by up-regulated co-DEGs: the X-axis represents the number of genes in a certain function, while the Y-axis represents the different functions. (B) The GO-BP functions assembled by down-regulated co-DEGs: the X-axis represents the number of genes in a certain function, while the Y-axis represented the different functions. (C) The KEGG pathways enriched by down-regulated co-DEGs: the X-axis represents the number of genes in a certain function, while the Y-axis represents the different pathways. The deeper the red, to more significant the p value.
The PPI network analysis was performed on the 74 upregulated and 137 downregulated co-DEGs. In total, 157 interactions and 94 nodes were identified in the current network (Fig. 5). The top 20 nodes, including TLR2, were considered hub genes in this study. A total of four modules (modules 1–4) were further extracted from the PPI network. The KEGG pathway enrichment analysis showed that only genes in modules 1 and 2 were enriched in these pathways (Table 1). Therefore, these two modules were used for further investigation.
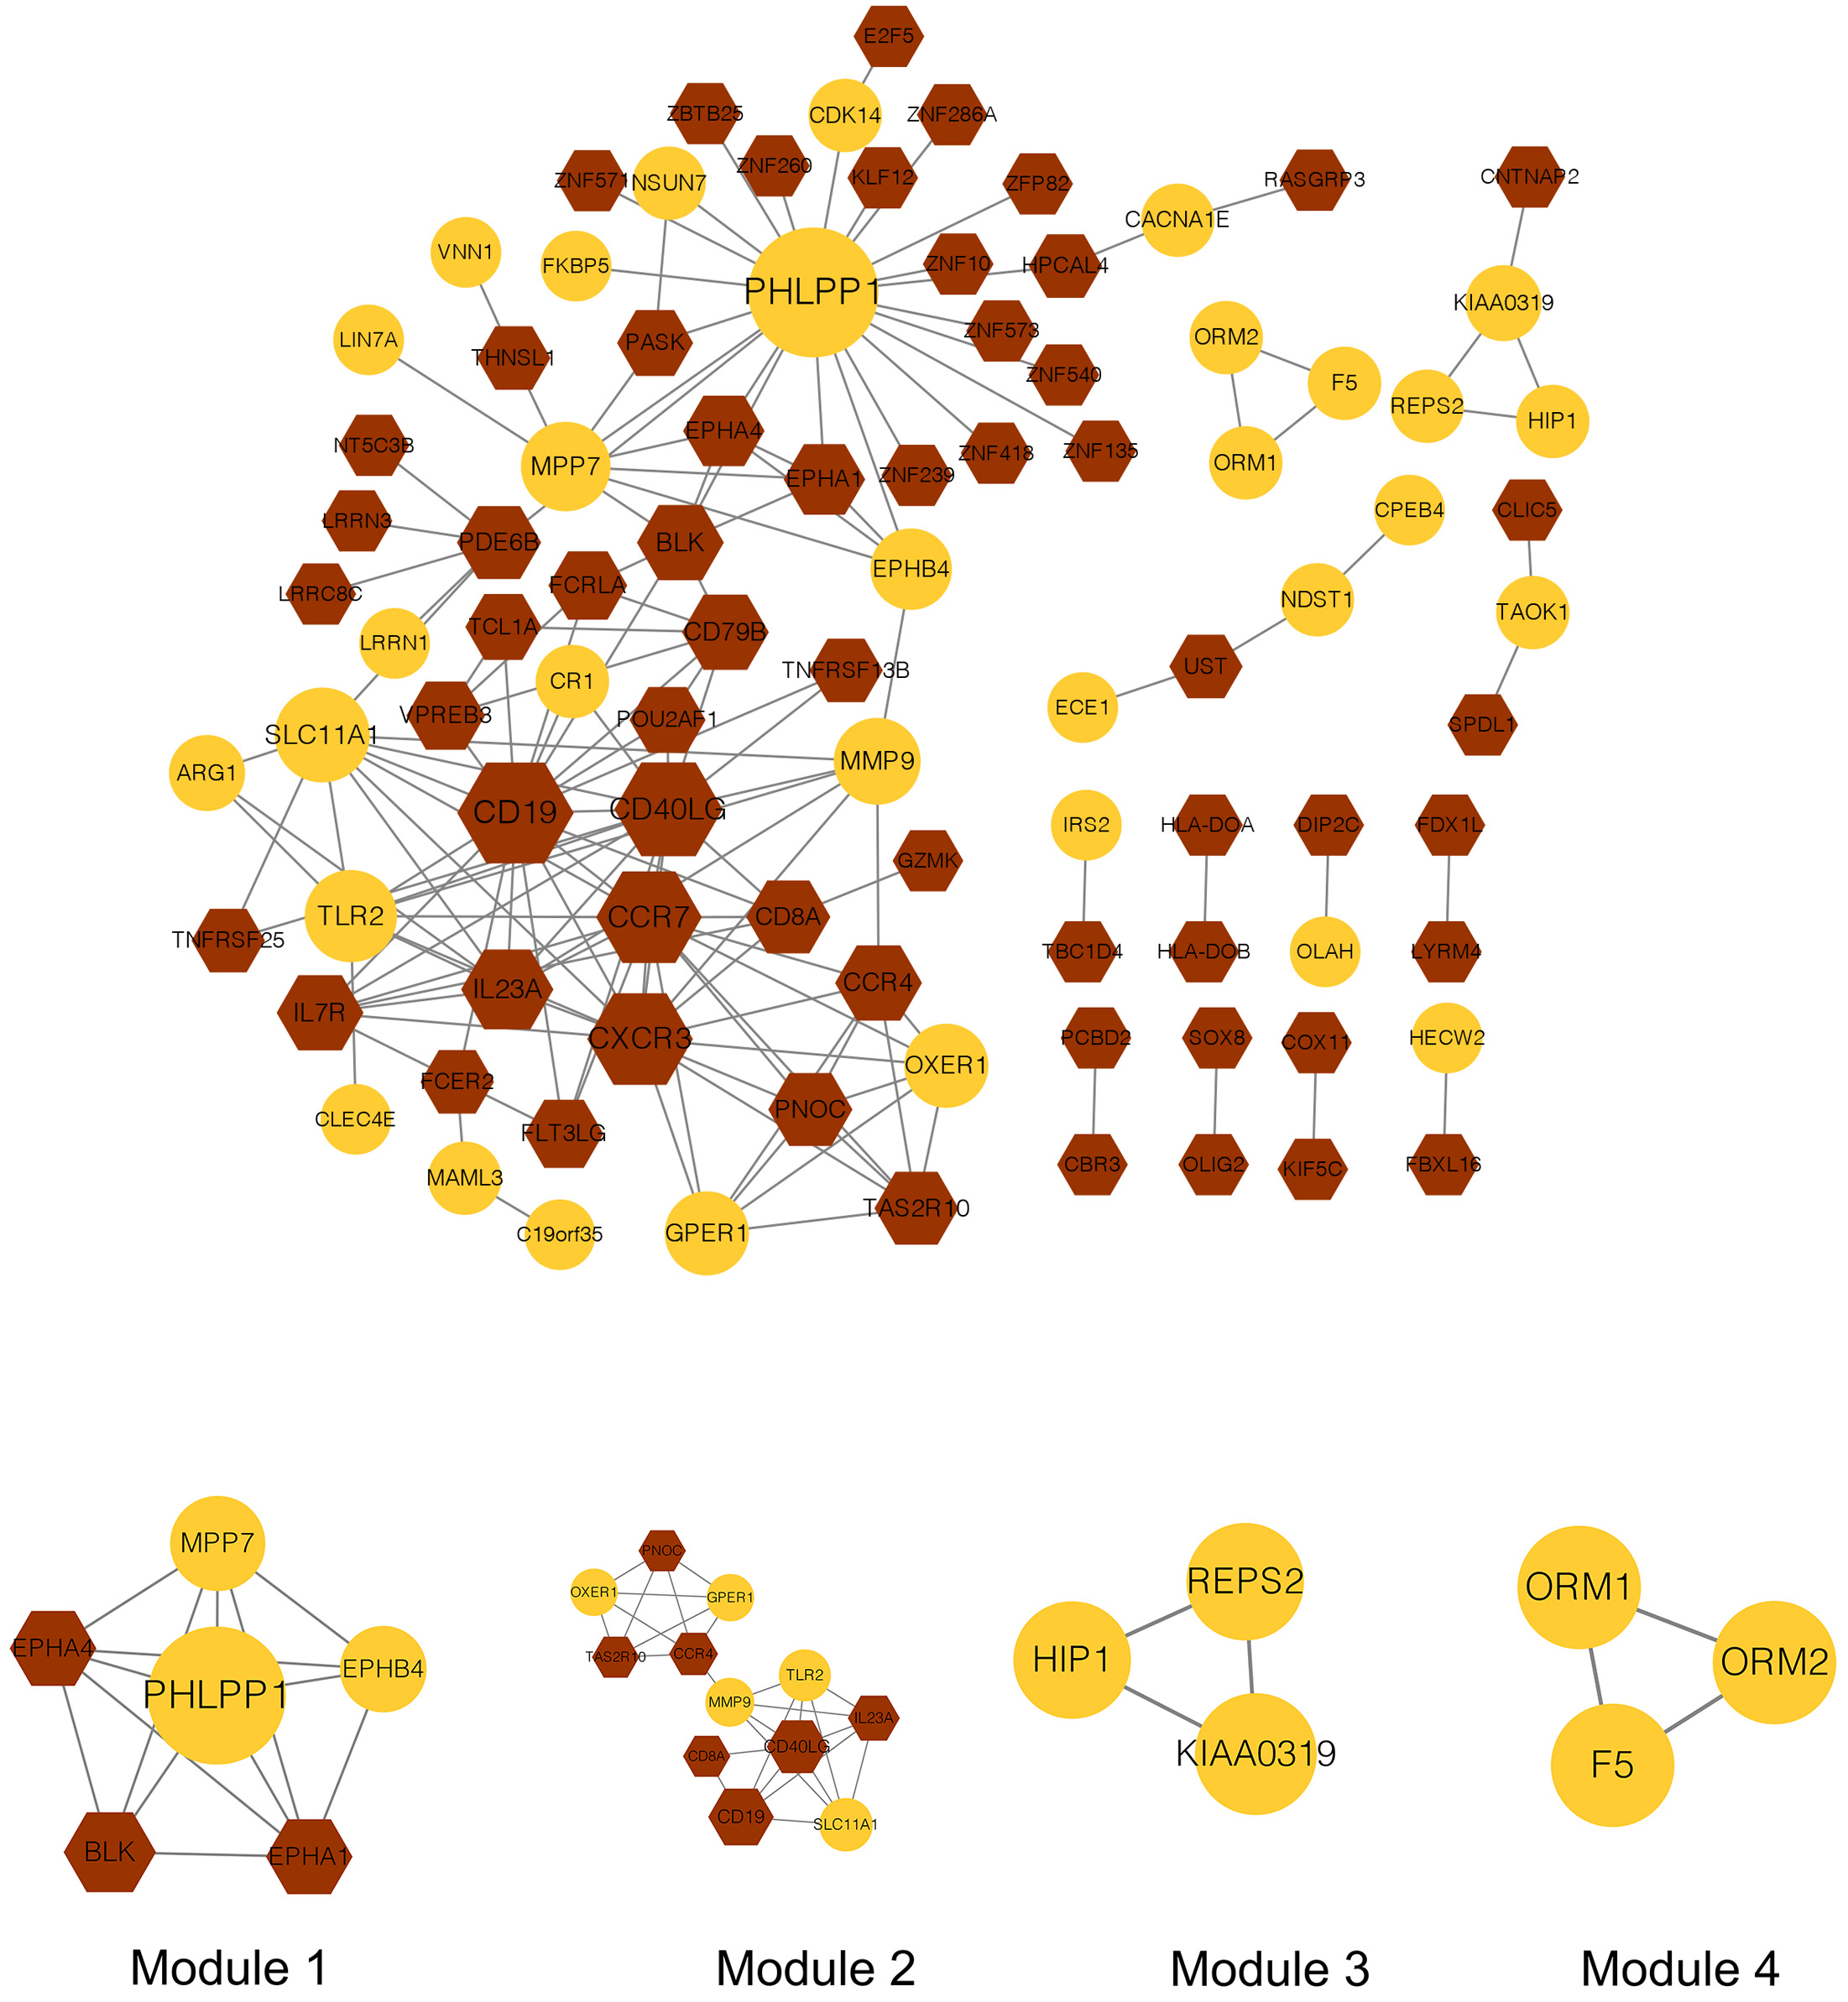 Fig. 5.
Protein-protein interaction network and modules in the current study. The yellow node represents the genes in the yellow module, while the brown node represents the genes in the brown module. The bigger the node, the larger the connectivity. The circle node represents up-regulated genes, while the hexagon represents down-regulated genes.
| Moudle | Description | p value | Count | Gene |
| module1 | Axon guidance | 4.42 × 10 |
3 | EPHA1/EPHA4/EPHB4 |
| module2 | Primary immunodeficiency | 1.13 × 10 |
3 | CD8A/CD19/CD40LG |
| module2 | Malaria | 1.64 × 10 |
2 | TLR2/CD40LG |
| module2 | Inflammatory bowel disease | 2.75 × 10 |
2 | TLR2/IL23A |
| module2 | Cytokine-cytokine receptor interaction | 4.77 × 10 |
3 | CD40LG/IL23A/CCR4 |
| module2 | Rheumatoid arthritis | 5.55 × 10 |
2 | TLR2/IL23A |
| module2 | Endocrine resistance | 6.15 × 10 |
2 | GPER1/MMP9 |
| module2 | Hematopoietic cell lineage | 6.27 × 10 |
2 | CD8A/CD19 |
| module2 | T cell receptor signaling pathway | 6.90 × 10 |
2 | CD8A/CD40LG |
| module2 | Toxoplasmosis | 7.97 × 10 |
2 | TLR2/CD40LG |
| module2 | Estrogen signaling pathway | 1.19 × 10 |
2 | GPER1/MMP9 |
| module2 | Cell adhesion molecules | 1.38 × 10 |
2 | CD8A/CD40LG |
| module2 | Hepatitis B | 1.62 × 10 |
2 | TLR2/MMP9 |
| module2 | Tuberculosis | 1.97 × 10 |
2 | TLR2/IL23A |
| module2 | Epstein-Barr virus infection | 2.45 × 10 |
2 | TLR2/CD19 |
| module2 | Proteoglycans in cancer | 2.52 × 10 |
2 | TLR2/MMP9 |
| Notes: KEGG, Kyoto Encyclopedia of Genes and Genomes. | ||||
A total of 31 genes, including the WGCNA hub genes, the PPI network hub genes, and the two PPI module genes, were selected for the exploration of biomarkers. Based on the LASSO algorithm, eight genes, including TLR2 and ARG1, were identified as potential biomarkers. Importantly, these eight genes were also included in the top 20 genes in the PPI network. The genes, including TLR2 and ARG1, were also identified as key module genes in the WGCNA analysis.
The verification analysis was performed on selected key module genes based on the additional dataset GSE158312 (Fig. 6). The results showed that only TLR2 and ARG1 were significantly differentially expressed between the IS and control groups in the GSE72642 dataset (Fig. 7). Detailed results of the ROC curve analysis for TLR2 and ARG1 are shown in Supplementary Fig. 2. The AUC values for TLR2 and ARG1 in GSE158312 were 0.863 and 0.887, respectively, and those for TLR2 and ARG1 in GSE16561 were 0.876 and 0.937. The ROC analysis yielded good prediction results for TLR2 and ARG1 in IS.
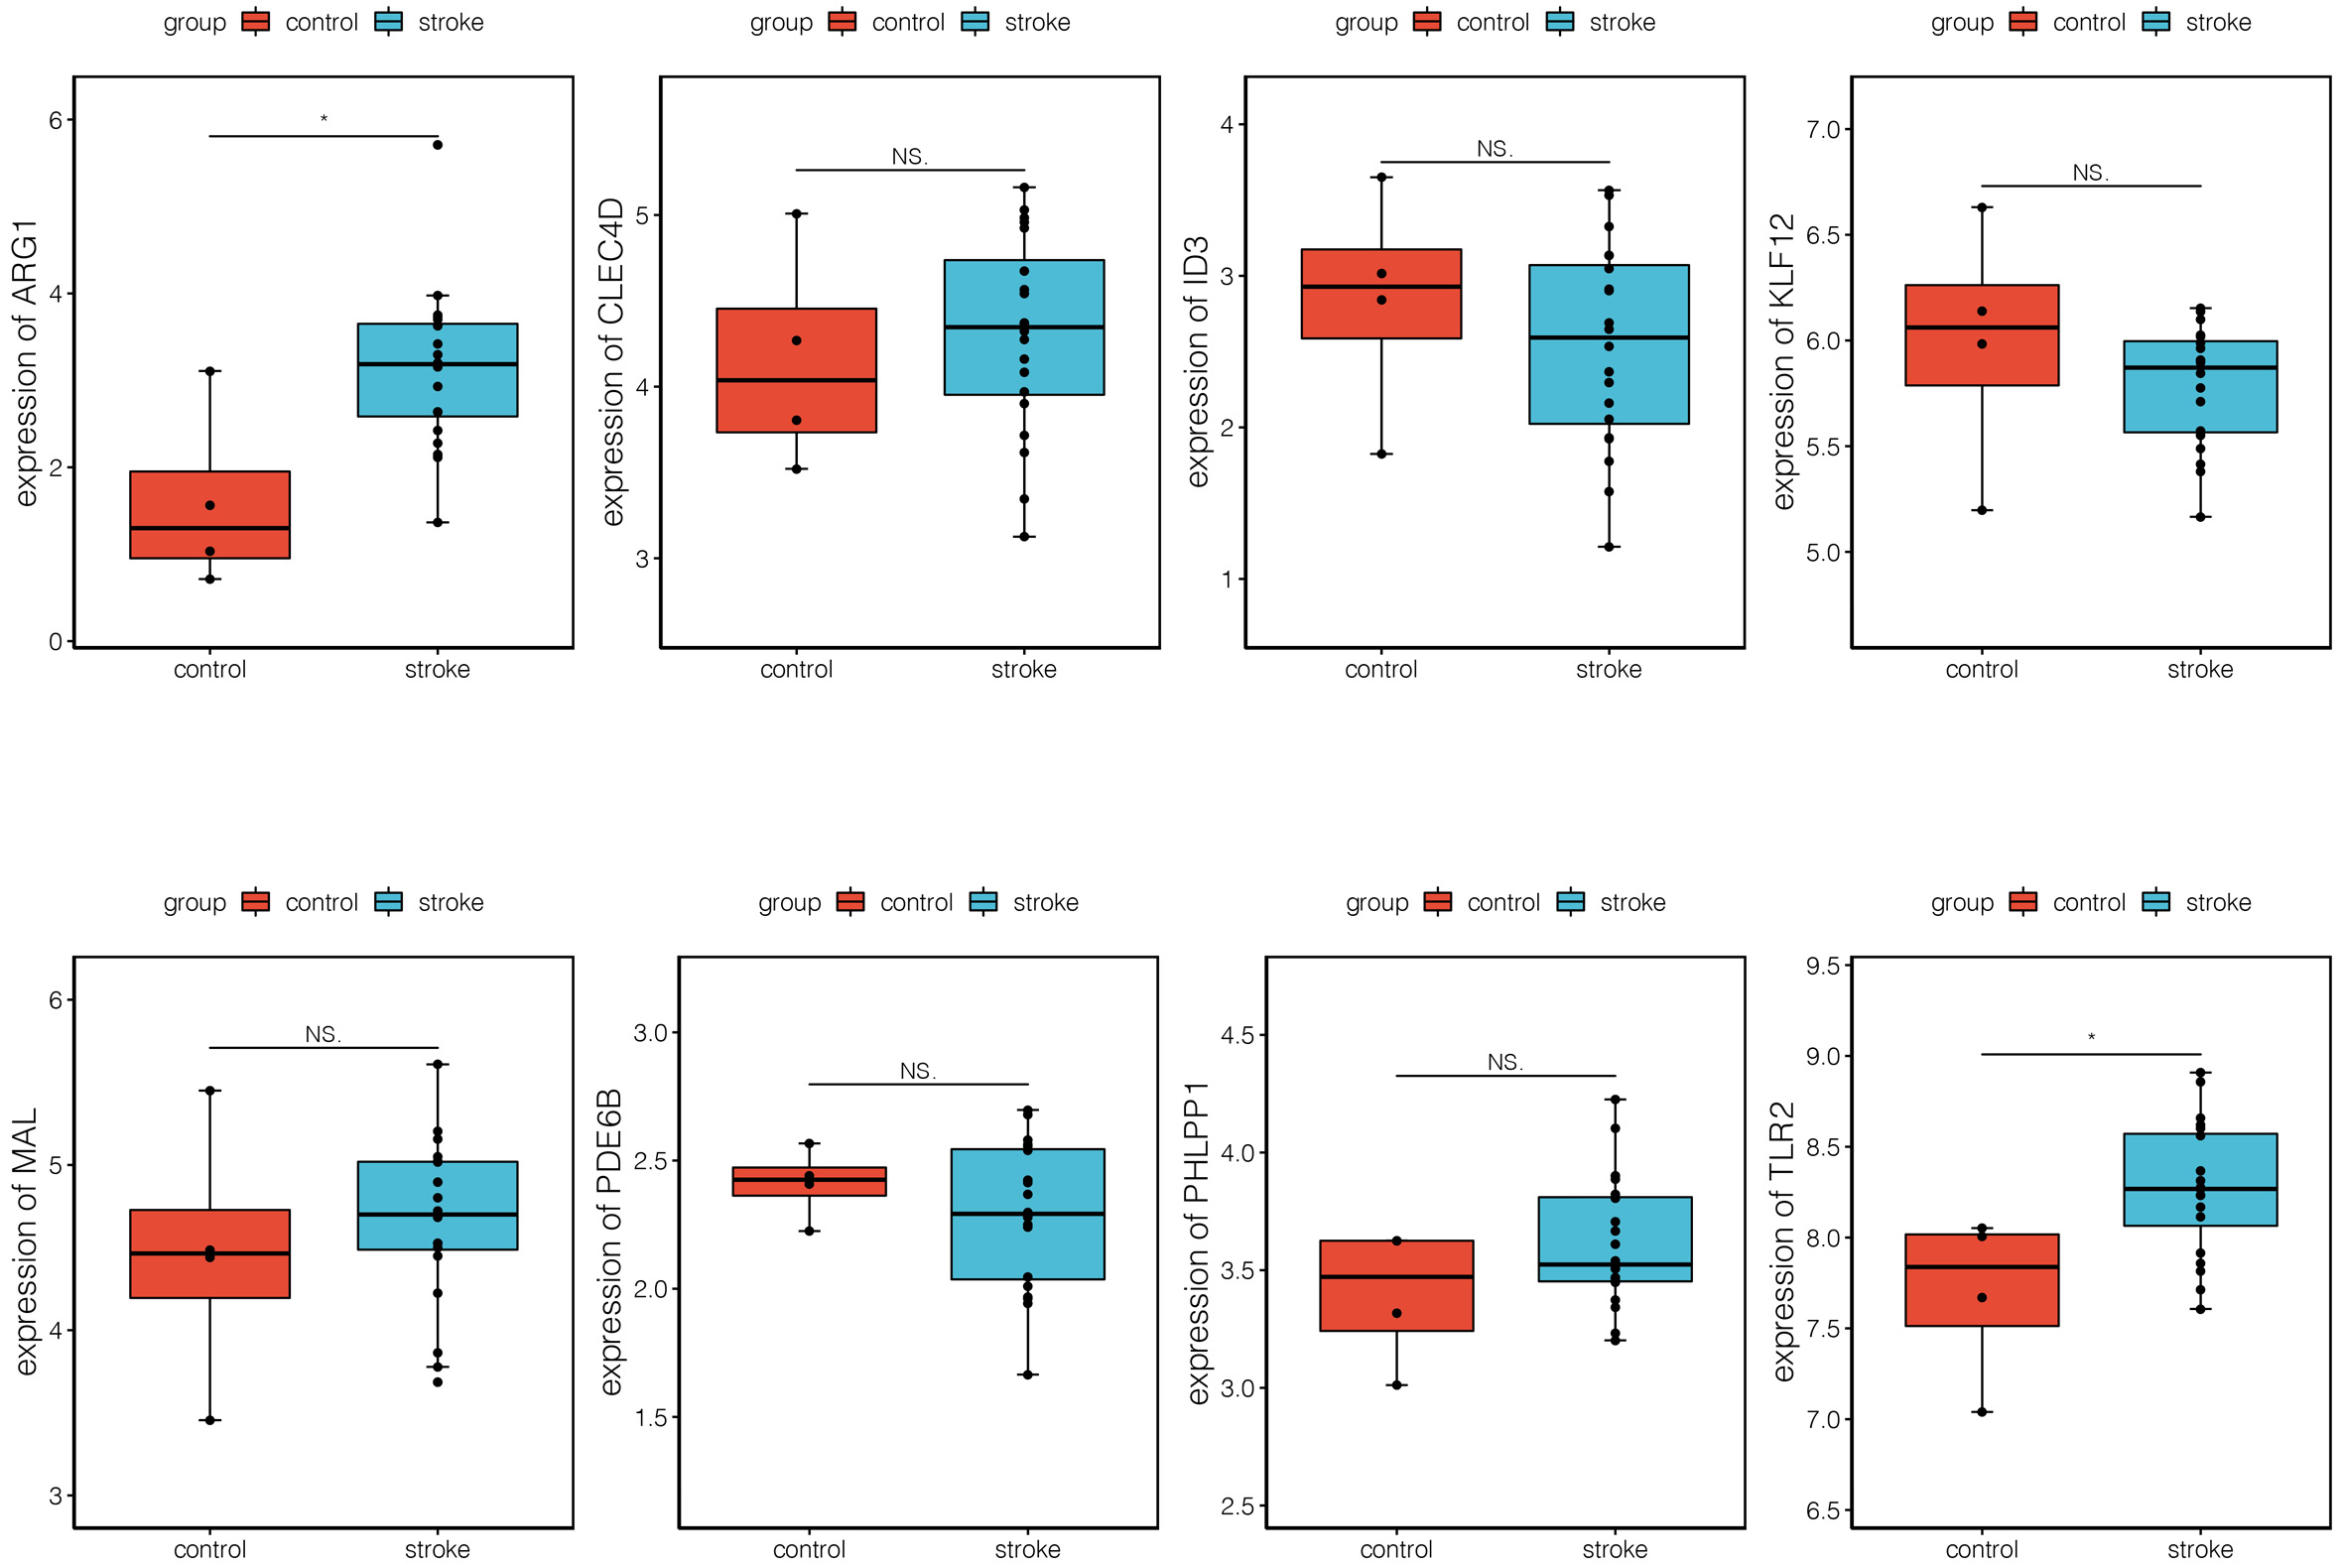 Fig. 6.
Expression levels of eight differential biomarkers between the
ischemic stroke (IS) and control group in GSE158312. The X-axis represents the
different groups, while the Y-axis represents the gene name. NS, non-significant.
*, p
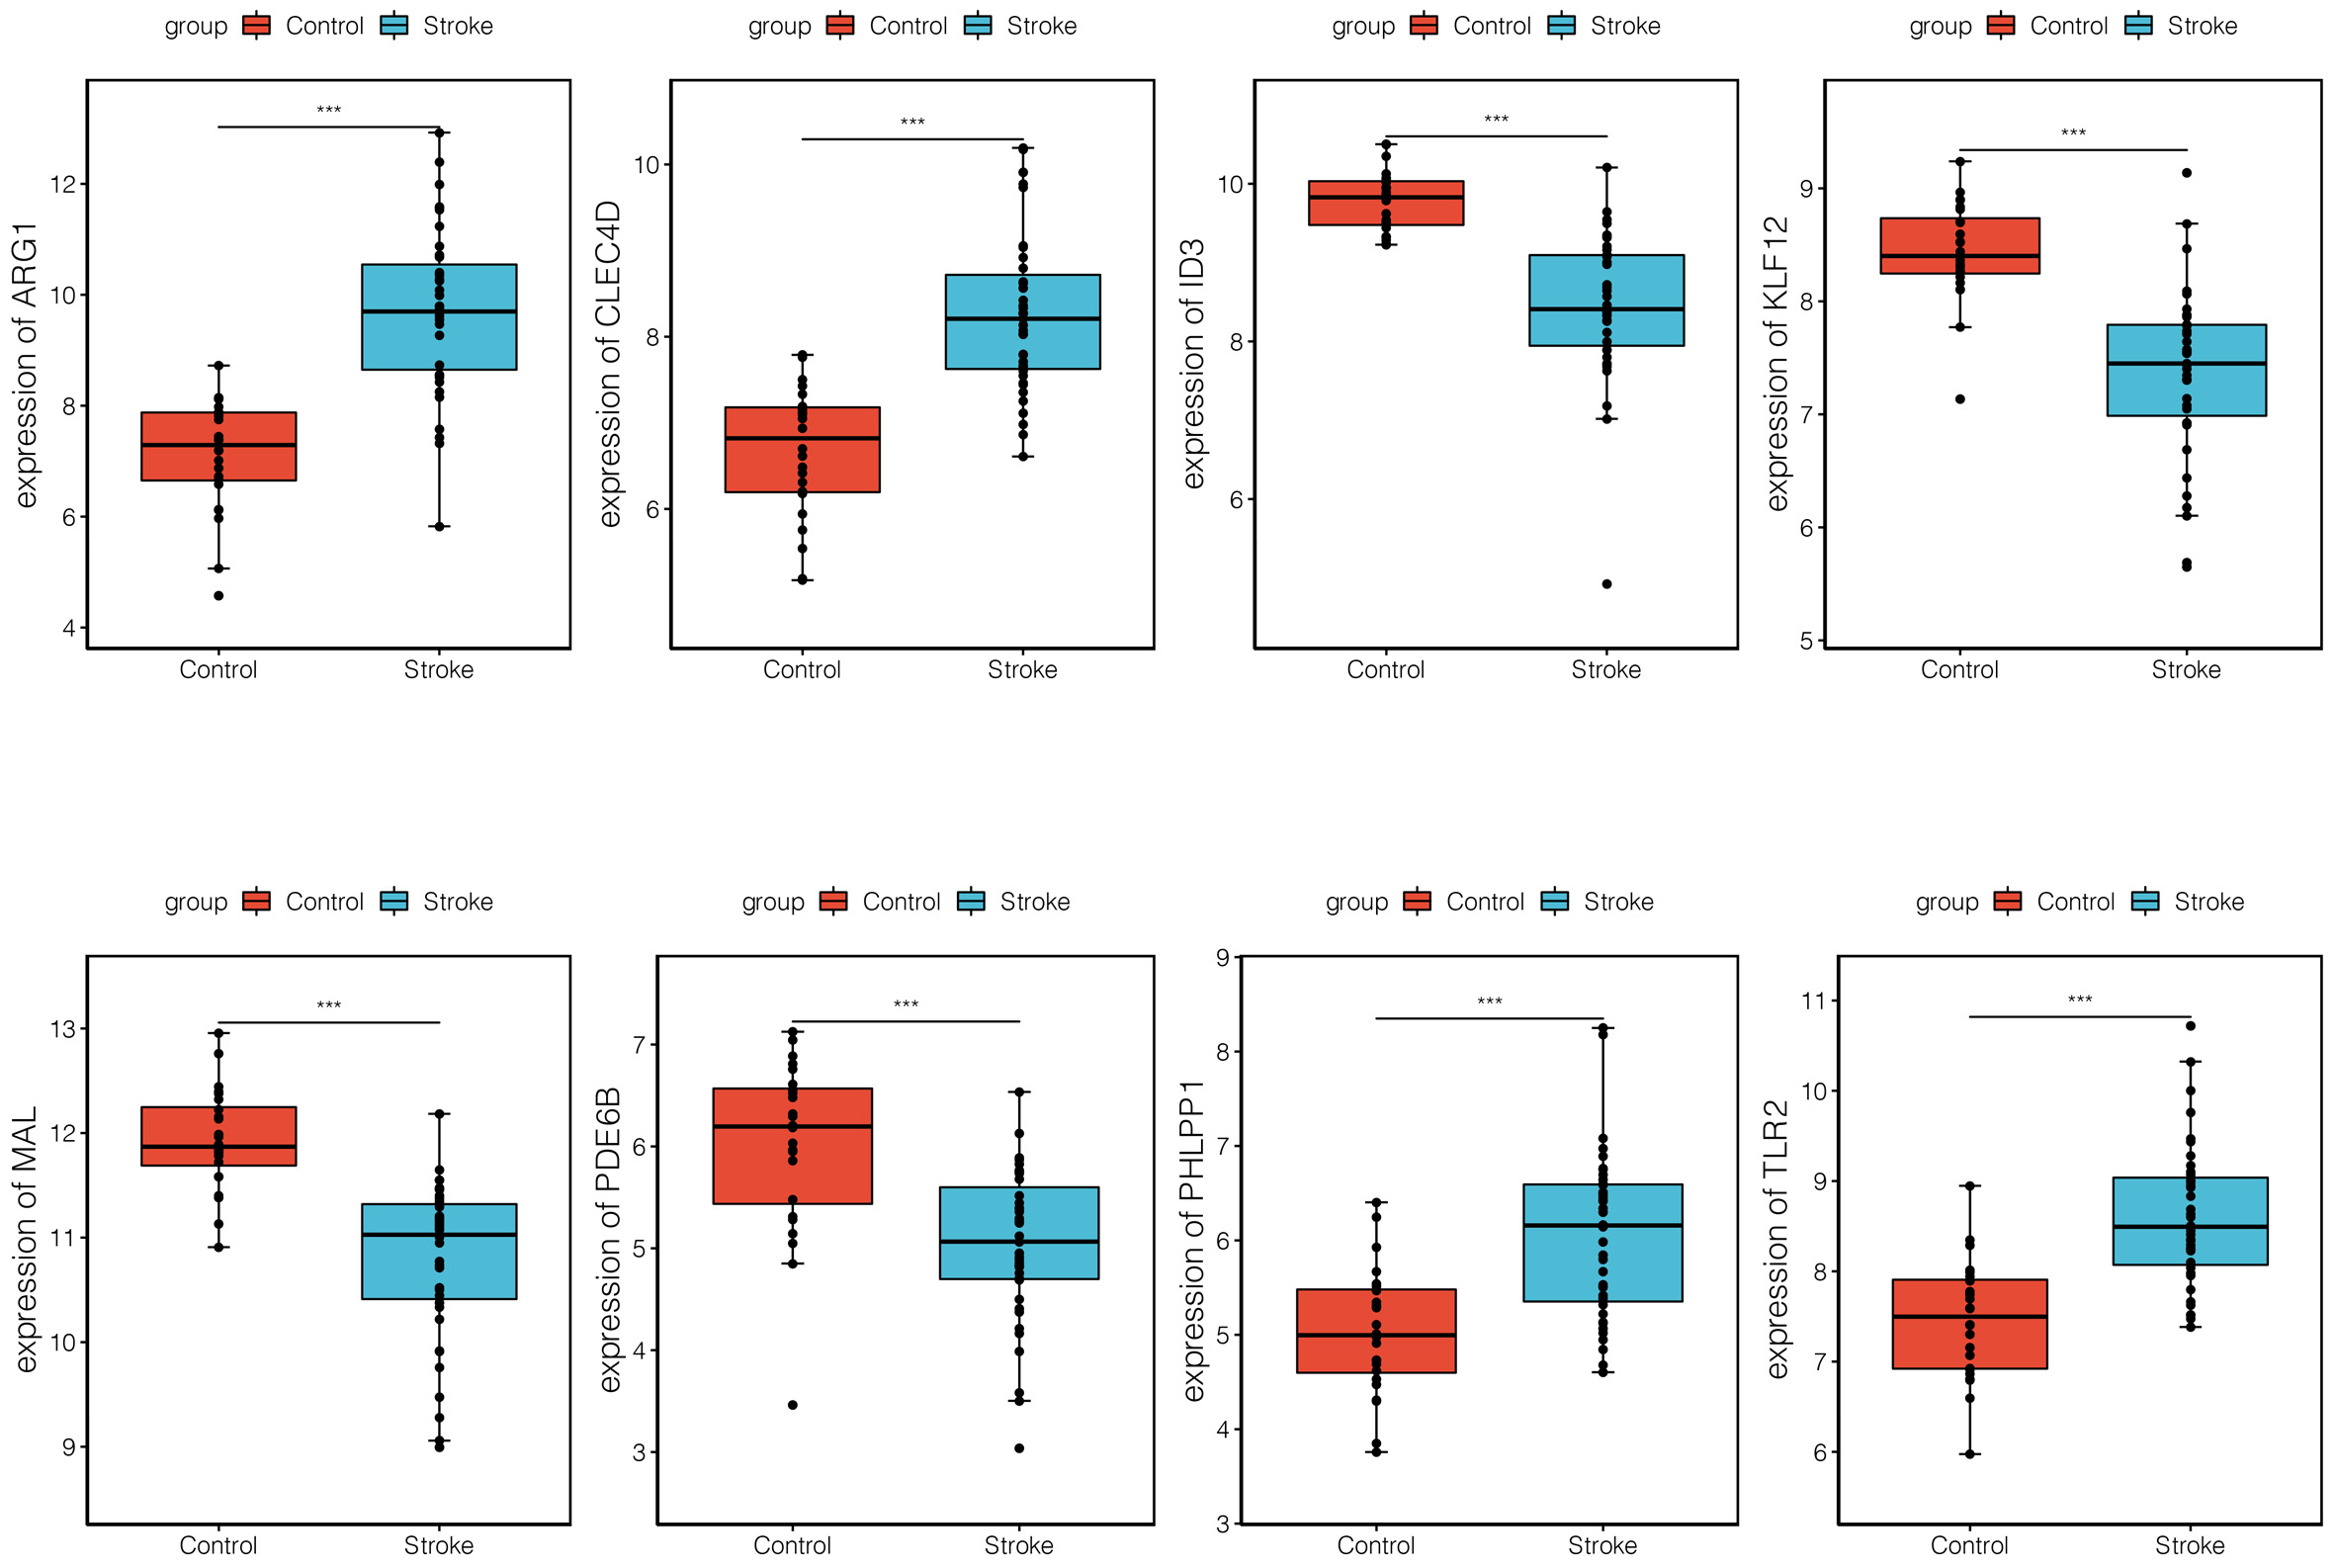 Fig. 7.
Expression levels of eight differential biomarkers between the
ischemic stroke (IS) and control group in GSE16561. The X-axis represents the
different groups, while the Y-axis represents the gene names. NS,
non-significant. *, p
Although the immune response and associated genes play important roles in the development of IS, the potential biomarkers and associated molecular mechanisms for IS progression are still unclear [30]. Our bioinformatics analysis revealed 1230 DEGs between the IS and the control group. The WGCNA analysis showed that yellow module genes were positively correlated with PMNC, while brown module genes were positively correlated with CD4+ T cells. A total of 74 upregulated and 137 downregulated co-DEGs were further investigated based on the intersection of the DEGs and module genes; these co-DEGs, such as TLR2, were mainly involved in functions such as the innate immune response. Moreover, our integrated analysis investigated eight potential biomarkers, and two genes, TLR2 and ARG1, were significantly differentially expressed between the IS and control groups in the verification dataset.
ARG1 has been shown to be a novel biomarker of vascular and immune responses, and is closed associated with IS recovery [31]. In an animal model, ARG1 promoted microglia/macrophage efferocytosis and inflammation resolution in mice with stroke [32]. ARG1 is highly expressed in humans, especially in neutrophils [33]. A previous study indicated that ARG1 is overexpressed in the blood of patients with IS [15]. Based on bioinformatics analysis, Zhu et al. [34] reported that the expression of genes including ARG1 and Kruppel-like factor 12 (KLF12) differed between IS samples and normal samples, which might contribute to the development of IS. Notably, CB-1158, an ARG1 inhibitor, has been shown to elicit immune suppression and immune-mediated antitumor responses [35, 36]. Given that immune responses play a key role in IS, the design of a new ARG1 inhibitor may be useful for IS treatment. Moreover, TLR2 plays an important role in the immune response, especially in relation to lipoproteins and lipopeptides [37]. It was first found to be an important mediator of the immune system, and is expressed in the brain after injury [38]. A previous study showed that TLR2 contributes to tissue damage when combined with the biological function of endogenous molecules during IS [39]. In addition, TLR2 has been shown to participate in the cerebral ischemia/reperfusion-induced inflammatory response [40], and salvianolic acid A (SAA) can reduce cerebral ischemia/reperfusion induced by the inhibition of the activation of TLR2 [41]. The inflammatory response has been recognized as a crucial element in the development of IS; therefore, the development of effective drugs that can effectively modulate the inflammatory response by targeting TLR2 activation may be a potential therapeutic strategy for IS. In this study, upregulated ARG1 and TLR2 were identified as hub genes. Meanwhile, a verification analysis based on additional datasets showed that ARG1 and TLR2 were significantly differentially expressed between the IS and the control group. Thus, we suggest ARG1 and TLR2 as novel biomarkers or therapeutic targets for IS.
TLR2 has been shown to activate different downstream inflammatory functions and signaling pathways, which alternatively play a role in endogenous neuroprotection [42]. The innate immune response is a downstream function induced by TLR family members [43]. This innate immune system is closely related to the occurrence and development of IS, and is, to a certain extent, related to ischemic tolerance [44]. A previous live imaging study showed that TLR2 participates in sterile inflammation and infection via the innate immune response in neonates [45]. In the current study, TLR2 was significantly upregulated in the IS group compared to the control group, and the enrichment analysis showed that TLR2 was involved in the innate immune response. Thus, we speculate that upregulated TLR2 participates in the progression of IS via participating in the innate immune response function.
PMNC are attractive effector cells for antibody-directed immunotherapy [46]. The increase in PMNC activated by the differential expression of certain genes, such as interleukin 1, plays a role in the progression of human cancer [47]. A close relationship between PMNC and stroke development has been revealed in animal models [48]. A previous study indicated that PMNC activation contributes to the systemic inflammatory response in IS [49]. The predictive value, pathophysiological consequences, and utility of PMNC as therapeutic targets in IS have been reported in a previous study [50]. A previous genomic profile analysis of human peripheral blood showed that PMNC and T cells are both closely associated with the development of IS [16]. CD4+ T cells play an important role in the invasion of B cells [51]. Li et al. [52] indicated that neutrophils are promising targets for IS therapies based on WGCNA analysis, and may become important biological targets in drug screening and drug design. In the current study, WGCNA analysis showed that yellow module genes were positively correlated with PMNC, whereas brown module genes were positively correlated with CD4+ T cells. The upregulated and downregulated co-DEGs were mainly assembled in the yellow and brown modules, respectively. Thus, we speculate that in the progression of IS, overexpressed genes are closely associated with PMNC, while downregulated genes are closely related to the relative decrease in CD4+ T cells.
However, the current study has some limitations, such as the small sample size and lack of clinical verification. Thus, further verification analyses based on larger sample sizes are required.
ARG1 and TLR2 may serve as novel biomarkers of IS. Meanwhile, upregulated TLR2 seems to be involved in the progression of IS by participating in the innate immune response. Moreover, we found that during the progression of IS, upregulated genes were closely related to the enrichment of PMNC, while downregulated genes were closely related to the relative decrease in CD4+ T cells. This study lays a foundation for gene-targeted therapy of IS in the future.
Conception and design of the research—SD and JC; acquisition of data—ZT, CW, MW and YY; analysis and interpretation of data—ZT, CW, MW and YY; statistical analysis—ZT, CW, MW and YY; obtaining funding—SD; drafting the manuscript—JC; revision of manuscript for important intellectual content—SD. All authors read and approved the final manuscript.
Not applicable.
Not applicable.
This work was supported by Provincial Natural Science Foundation (grant number ZD201418).
The authors declare no conflict of interest.
Publisher’s Note: IMR Press stays neutral with regard to jurisdictional claims in published maps and institutional affiliations.