
 , Sana Aslam 2, Jacob J. Knittel 3, Lea Alhilali 4, Ashley M. Stokes 1,5
1 Barrow Neuroimaging Innovation Center, Barrow Neurological Institute, Phoenix, AZ 85013, USA
2 Muhammad Ali Parkinson Center, Barrow Neurological Institute, Phoenix, AZ 85013, USA
3 Creighton University School of Medicine - Phoenix, Phoenix, AZ 85012, USA
4 Department of Neuroradiology, Barrow Neurological Institute, Phoenix, AZ 85013, USA
5 Department of Translational Neuroscience, Barrow Neurological Institute, Phoenix, AZ 85013, USA
Abstract
Background: Essential tremor (ET) is a common slowly-progressive neurologic disorder. It is predominantly characterized by kinetic tremors involving bilateral upper limbs. Although ET shares motor similarities with Parkinson disease (PD), there is no known relationship between ET and PD. Methods: We studied white matter differences between 17 ET and 68 PD patients using standard diffusion tensor imaging and fixel-based analysis (FBA). Diffusion magnetic resonance imaging data were acquired from two scanners (General Electric (GE) and Philips) with different numbers of diffusion directions. Fractional anisotropy maps were generated by the Oxford Centre for Functional Magnetic Resonance Imaging of the Brain (FMRIB) Software Library (FSL), and FBA was performed using MRtrix3 to obtain fiber density, fiber bundle, and fiber density bundle cross-section. Results: Compared with PD, significantly lower values of fiber density, fiber bundle, and fiber density bundle cross-section were found in the corpus callosum and left tapetum of the ET group. Additionally, significantly lower functional anisotropy values were found in the ET compared to the PD group, principally in the corpus callosum, corona radiata, and cingulum. In conclusion, differences in white matter integrity between ET and PD were observed by both FBA-based metrics and diffusion tensor imaging. Conclusions: Advanced diffusion-based metrics may provide a better understanding of the white matter microstructural characteristics in disparate motor-associated diseases with different underlying phenotypes, such as ET and PD.
Keywords
- Parkinson disease
- essential tremor
- diffusion tensor imaging
- fixel-based analysis
- diffusion magnetic resonance imaging
Parkinson disease (PD) and essential tremor (ET) are some of the most common movement disorders. In individuals older than 65, the estimated prevalence of ET and PD is 5% and 1.8%, respectively [1]. ET is predominantly characterized by kinetic or postural tremors involving bilateral upper limbs [2], while PD is characterized by asymmetric resting tremors, rigidity, and bradykinesia [3]. Additionally, PD is often associated with significant non-motor symptoms such as depression, anxiety, cognitive impairment, and sleep dysregulation. Although non-motor symptoms are increasingly reported as concomitant clinical features of ET [4, 5, 6], some studies have shown no such association [7], suggesting that the pathophysiological relevance of non-motor symptoms in ET is still unclear. While ET and PD are considered distinct diagnostic entities, the co-existence of these pathologies within individuals has been reported. Some studies have further suggested that ET may be a risk factor for PD, conferring up to a 5-fold increase in risk [8, 9], although this has not been substantiated in other studies [10, 11, 12]. Regardless, overlapping motor and non-motor symptoms can lead to ambiguity in diagnosis, further hampered by the possibility of concurrent disease.
The pathophysiology of PD is well studied and linked to neurodegeneration, but the pathophysiology of ET remains controversial. Magnetic resonance imaging (MRI) biomarkers may lend insight into the underlying pathophysiology of ET and PD. To that end, a better understanding of the pathological changes between ET and PD may aid in the differential diagnosis as well as in understanding the unique features of these movement disorders. MRI biomarkers based on diffusion properties have previously been employed to assess white matter changes associated with ET [13, 14, 15] and PD [16, 17].
Diffusion MRI (dMRI) measures the diffusion of water molecules in brain tissues, which can occur either without restriction (isotropic diffusion) or limited by obstacles, such as cell membranes (anisotropic diffusion). Diffusion tensor imaging (DTI) allows for microstructure-sensitive metrics, such as fractional anisotropy (FA) and axial and radial diffusivities (AxD and RD, respectively), to be derived. FA represents the directionality of the water diffusion [18] and provides the degree of anisotropy of the diffusion tensor. Biologically, FA is often considered a direct marker of white matter integrity and is related to several factors, including axonal count and density, degree of myelination, and fiber architecture. The diffusivity parameters AxD and RD represent the water diffusivity along and perpendicular to the principal axis, respectively [19]. AxD is generally associated with axonal damage, while RD has been associated with myelin integrity, axonal diameter and density, and fiber coherence [20, 21]. However, it is important to note that the interpretation of these DTI-related metrics may be altered in neuropathology, reflecting the differential evolution of pathophysiological changes (e.g., axonal damage and loss, demyelination) across disease types and disease progression [22, 23, 24].
Previous studies using DTI in ET have generally shown higher mean diffusivity (MD) and lower FA values compared to controls, with changes occurring predominantly in the cerebellum and brainstem, as well as in cerebral white matter tracts [25, 26]. While DTI metrics in PD have shown heterogeneous patterns in early PD [27], clearer trends of increasing MD and decreasing FA have been observed longitudinally and in the later stages of the disease [28]. Direct comparisons between ET and PD have shown white matter changes in the cerebello-thalamic cortical pathways involving the visual network [29].
Standard single-tensor DTI is a common model for studying white matter microstructural integrity; however, this method has several limitations. Notably, it cannot resolve different single-fiber orientations within each voxel. The inability of DTI to resolve intravoxel fiber orientations can impact both DTI metrics (FA, AxD, and RD) and tractography [30]. As a result, it is increasingly recognized that the direct biological interpretation of DTI-based metrics is hampered by the complex white matter fiber geometry in the brain [31, 32]. To overcome this limitation, more advanced dMRI models have been proposed to resolve multiple fiber populations inside a single voxel [33]. Fixel-based analysis (FBA) is an advanced diffusion model that estimates microstructural changes of individual populations of specific fiber bundles on a microscopic level [34], where ‘fixel’ describes a fiber population within a voxel. Physiologically, FBA-derived metrics are thought to represent intra-axonal volume changes associated with specific fiber populations (fiber density, FD) and macroscopic cross-sectional sizes of individual fiber bundles (fiber-bundle cross-section, FC) [35]. These metrics reflect on pathophysiological processes such as fiber loss or atrophy and thus allow for direct assessment of microstructural changes on a sub-voxel level [36].
In this retrospective study, we compared white matter microstructural differences between ET and PD cohorts with moderate to severe disease. Standard DTI-based FA was assessed for comparison with previous studies, while advanced FBA metrics were assessed to probe white matter microstructural differences between these groups. Our goal was to investigate regional differences in white matter microstructure between these two movement disorders.
This retrospective study was approved by the local Institutional Review Board (IRB), and a waiver of informed consent was obtained. The study consisted of a cohort of patients who underwent MRI as part of deep brain stimulation (DBS) surgery planning at Barrow Neurological Institute. As such, participants were well characterized and diagnosed with either ET or PD by a neurologist specializing in movement disorders based on the consensus criteria [37, 38]. Additionally, all participants were screened to meet the criteria for advanced disease in that they had failed and/or maximized pharmacotherapy; had functional limitations from the severity of their motor symptoms; and had a disease duration long enough to rule out atypical pathologies, thus qualifying them for advanced therapeutic interventions, i.e., DBS. Those with advanced mild cognitive impairment and dementia based on neuropsychological testing were excluded. Data were acquired as part of the clinical standard of care over 3 years between 2017 and 2020. Inclusion criteria were age over 18 and availability of dMRI data on the institutional picture archiving and communication system (PACS). Patients’ data were excluded if they were diagnosed with dementia.
A total of 85 participants were included in this study; 17 (4 females) had ET and were an average of 69 (8.3 S.D.) years old. 68 (20 females) had PD and averaged 67 (9.5 S.D.) years old. Disease duration was 13.0 (14.3 S.D.) years for the ET cohort and 8.4 (3.6 S.D.) for the PD cohort. Clinical assessments were performed for each patient and included disease severity (PD only) using the motor score (Part 3) from the MDS-Unified Parkinson’s Disease Rating Scale (UPDRS). Tremor severity for ET was not documented as part of the clinical care; however, all patients in the ET cohort had moderate-to-severe tremors as assessed by a fellowship-trained neurologist specializing in movement disorders (a requirement for DBS surgery at our institution). Complete participant characteristics are reported in Table 1. (Ref. [15, 39, 40]).
| Group | N (F) | N.GE-scanner | AGE (SD) years | Motion (SD) mm | Removed (F) (motion |
N analyzed (F) | MDS-UPDRS motor score (SD) [#] | Disease duration (years) |
| ET | 17 (4) | 6 | 68.8 (8.3) | 1.14 (1.85) | 1 (0) | 16 (4) | - | 13.0 (14.3) [15] |
| PD | 68 (20) | 21 | 66.5 (9.5) | 0.92 (1.32) | 6 (1) | 62 (19) | 41.94 (15.00) [39] | 8.4 (3.6) [40] |
| Student t-test | - | - | t = 0.956; p = 0.342 | t = 0.502; p = 0.617 | - | - | - | t = 2.249; p = 0.027 |
Abbreviations: N, number; F, females; MDS-UPDRS motor score, MDS-Unified Parkinson’s Disease Rating Scale motor score (Part 3, available only for 53 PD patients); N.GE-scanner, number of participants scanned on the GE scanner; GE, General Electric; SD, standard deviation; ET, Essential tremor; PD, Parkinson disease.
MRI data were collected at 3 Tesla using either General Electric (Signa HDxt, GE
Medical Systems, Milwaukee, WI, USA) or Philips (Ingenia, Philips Medical
System, the Netherlands) scanners as part of the presurgical standard of care.
For General Electric (GE), dMRI was performed using 25 diffusion-encoding directions (b-value = 1000
s/mm
All dMRI were converted to NIFTI format using dcm2niix (https://github.com/rordenlab/dcm2niix) and were pre-processed using MRtrix3 (https://www.mrtrix.org/) [41], Functional Magnetic Resonance Imaging of the Brain (FMRIB) Software Library (FSL) (https://fsl.fmrib.ox.ac.uk/fsl/fslwiki/FSL) [42], and the Advanced Normalization Tool (ANTs; http://stnava.github.io/ANTs/). The dMRI pre-processing steps included (a) denoising by dwidenoise (MRtrix3), (b) alignment and eddy-currents corrections by eddy (FSL), and (c) bias field correction (ANTs). The eddy QC tools were used to evaluate the quality of each dMRI dataset. Using the eddy and eddy QC tools (FSL), we assessed the head motion of each participant during the dMRI acquisition. The image slices with signal loss caused by the participant’s movement coinciding with the diffusion encoding were detected and replaced by predictions made by a Gaussian process. To increase anatomical contrast and improve downstream template generation, registration, tractography, and statistics, the dMRI was up-sampled to 1.25 mm by mrgrid (MRtrix3); subsequently, the brain extraction on the up-sampled b0 images was computed by dwi2mask (MRtrix3). FA maps were generated by dtifit (FSL) with a weighted least squares fit [43]. Before voxel-based analysis, all FA maps were normalized to the Montreal Neurological Institute (MNI) 1 mm standard space using ANTs symmetric image normalization (SyN) coregistration [44].
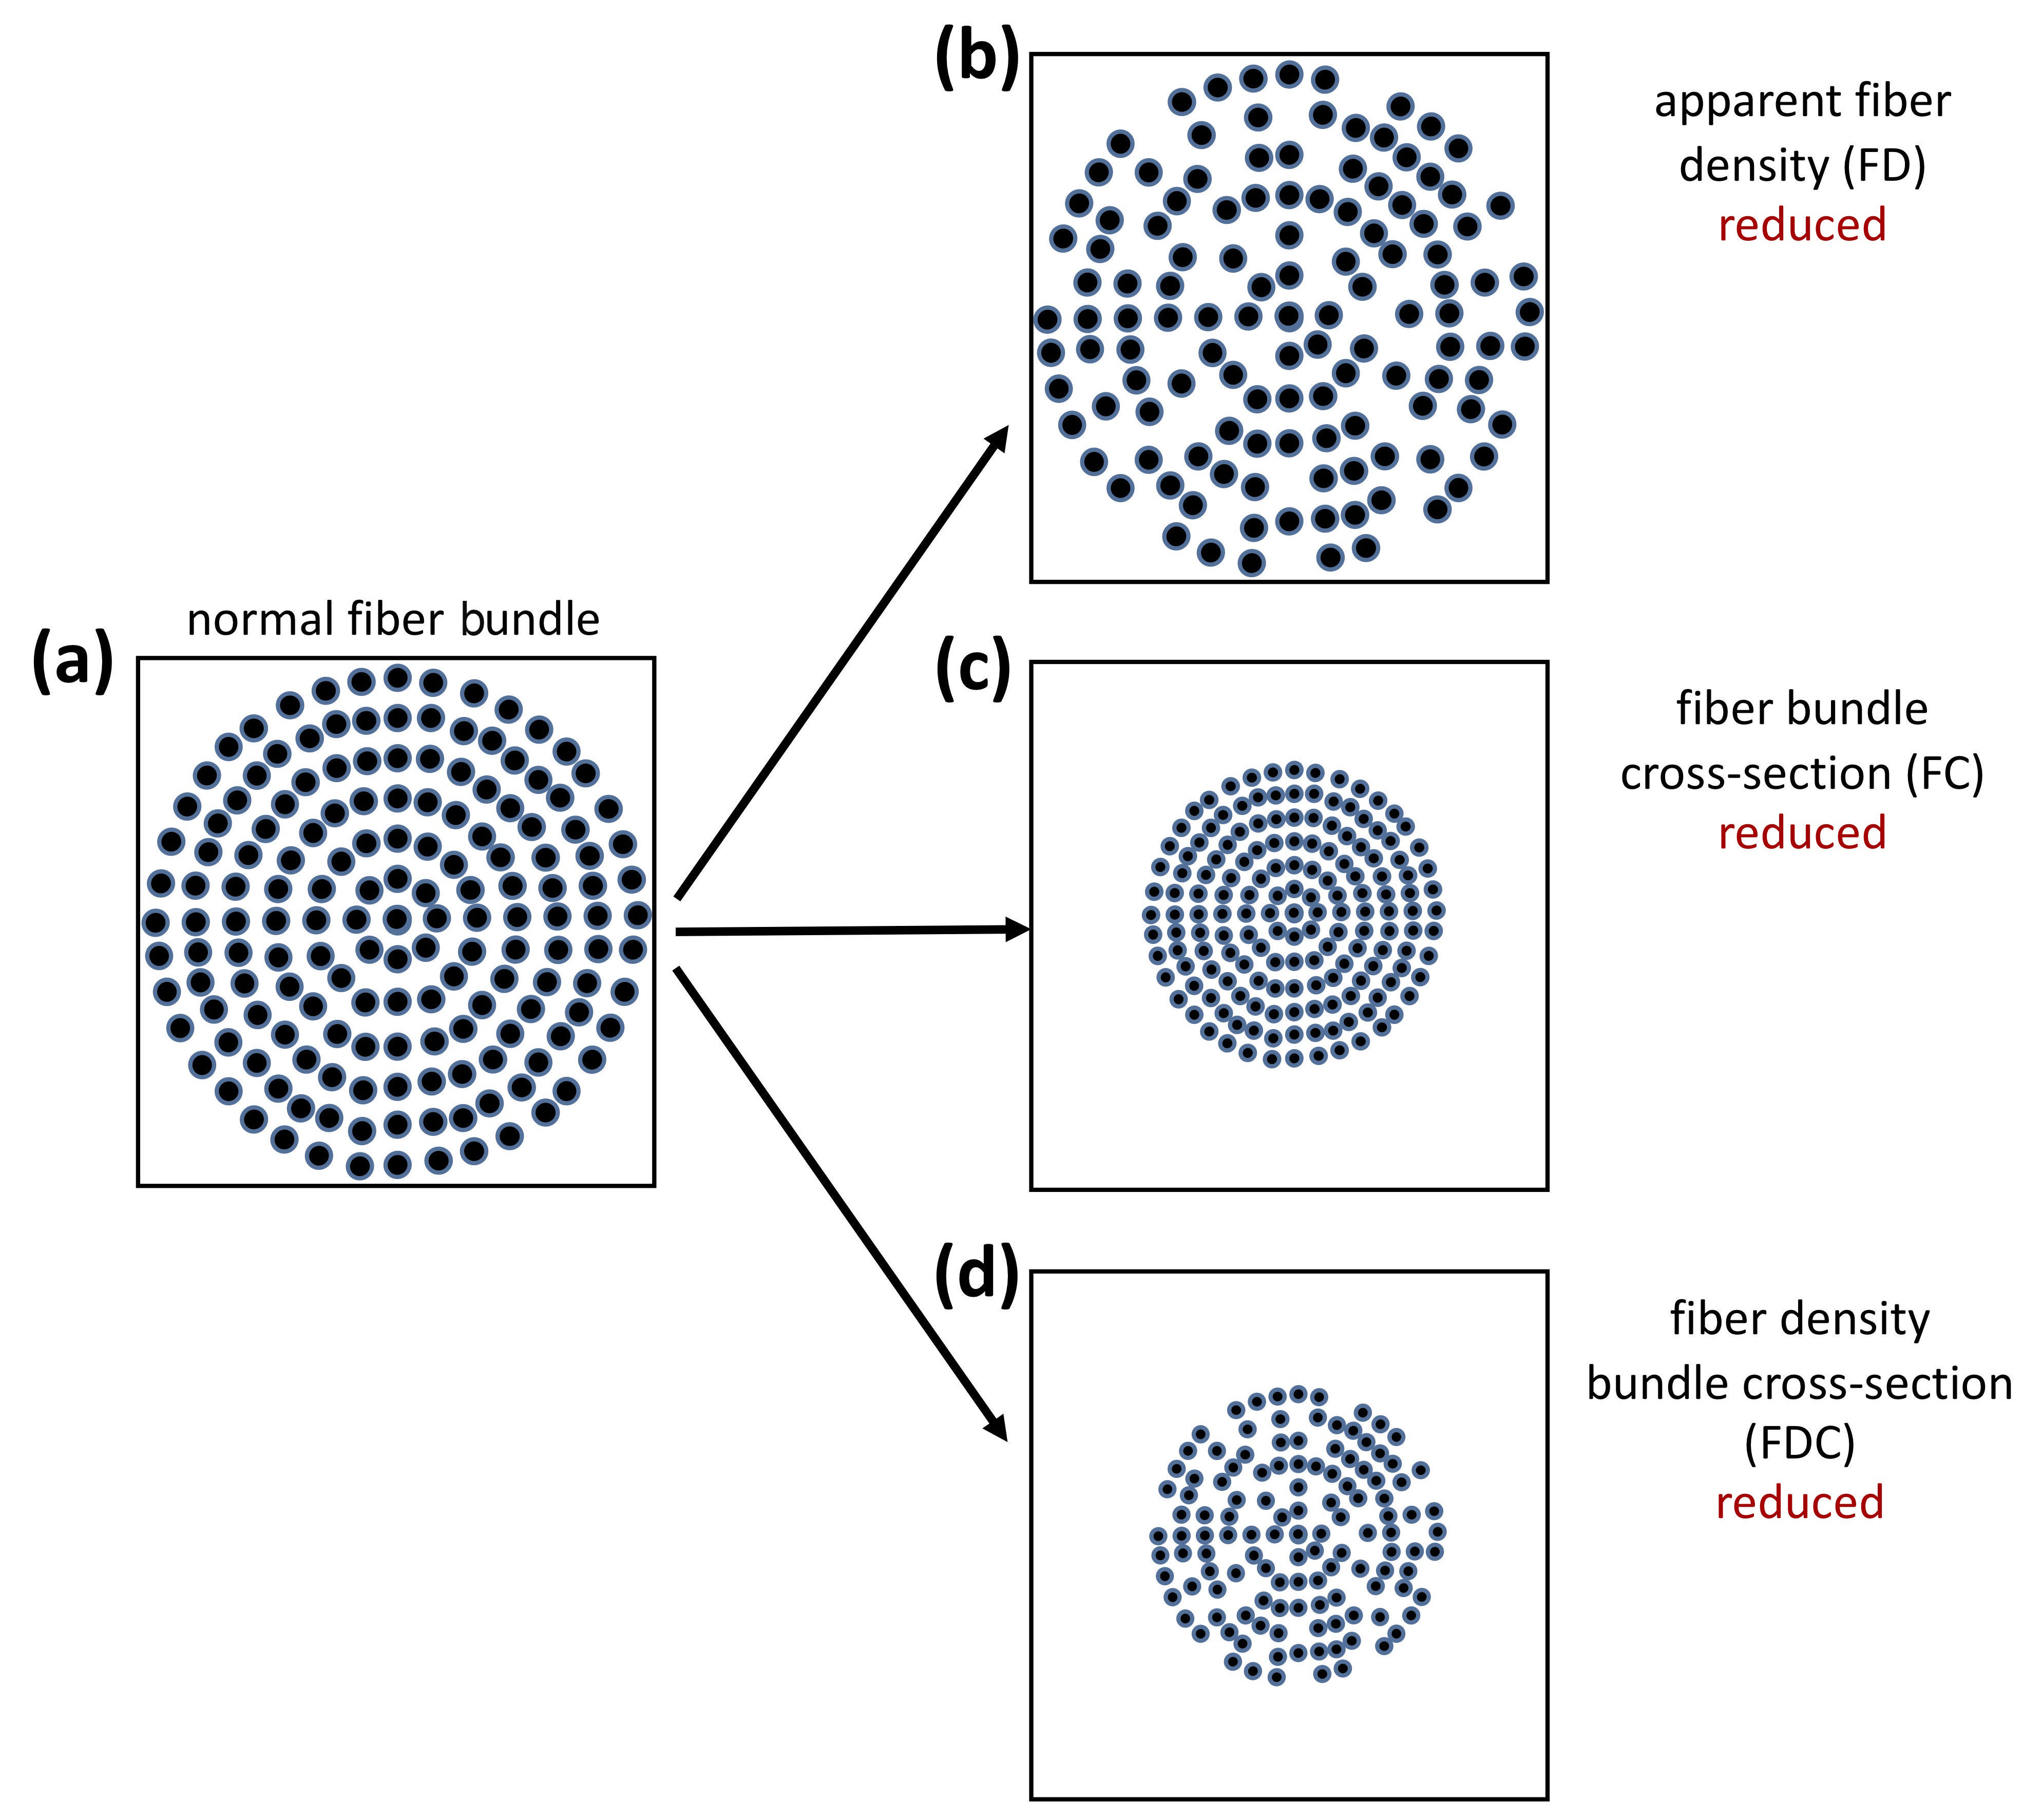
FBA processing was performed as recommended in the MRtrix3 documentation. Briefly, the following steps were performed: (a) estimation of the fiber orientation distribution (FOD) in each voxel using multi-tissue constrained spherical deconvolution [45]; (b) creation of a study-specific, unbiased FOD template with all participants with PD and ET, in order to (c) warp all participant FOD images to this FOD template; (d) template mask and white matter template mask creation; followed by (e) calculation of apparent FD and FC within each voxel. Additionally, the combined measure of FD and cross-section (FDC) was derived by multiplying FD and FC (Fig. 1) [46].
 Fig. 1.
Interpretation of FBA-derived measurements. (a) The fiber bundle inside a voxel in a theoretically healthy person. Fixel-based analysis (FBA) changes associated with (b) reduced apparent fiber density inside a voxel, (c) reduced fiber bundle cross-section inside a voxel, and (d) reduced fiber density bundle cross-section inside a voxel. (Reproduced with permission from Raffelt DA, Investigating white matter fibre density and morphology using fixel-based analysis. 2017 [46]).
Age and MDS-UPDRS are presented as mean and standard deviation (S.D.) for each group. The Student’s t-test was used to evaluate age differences between the groups.
Each voxel of the FA maps was fit to a linear model using FSL Randomise
[47]. FBA at the voxel level was performed using connectivity-based fixel
enhancement and non-parametric permutation testing through MRtrix3
fixelcfestats [34]. For both analyses, we used 5000 permutations with
the threshold-free cluster enhancement (TFCE) method for DTI analysis [48] and
the connectivity-based fixel enhancement (CFE) method for FBA [49], with
correction for multiple comparisons via family-wise error (FWE) rate at the voxel
level (significance at FWE
The resulting significant clusters, in MNI space for FA and template space for FBA, from group comparisons and correlations were labeled using the ICBM-DTI-81 white matter labels atlas [50].
Participant characteristics are summarized in Table 1. No significant
differences in head motion were detected between PD and ET (t = 0.502; p
= 0.617) patients; however, 1 ET and 6 PD patients were excluded from the
analysis due to substantial motion during the dMRI scan (motion
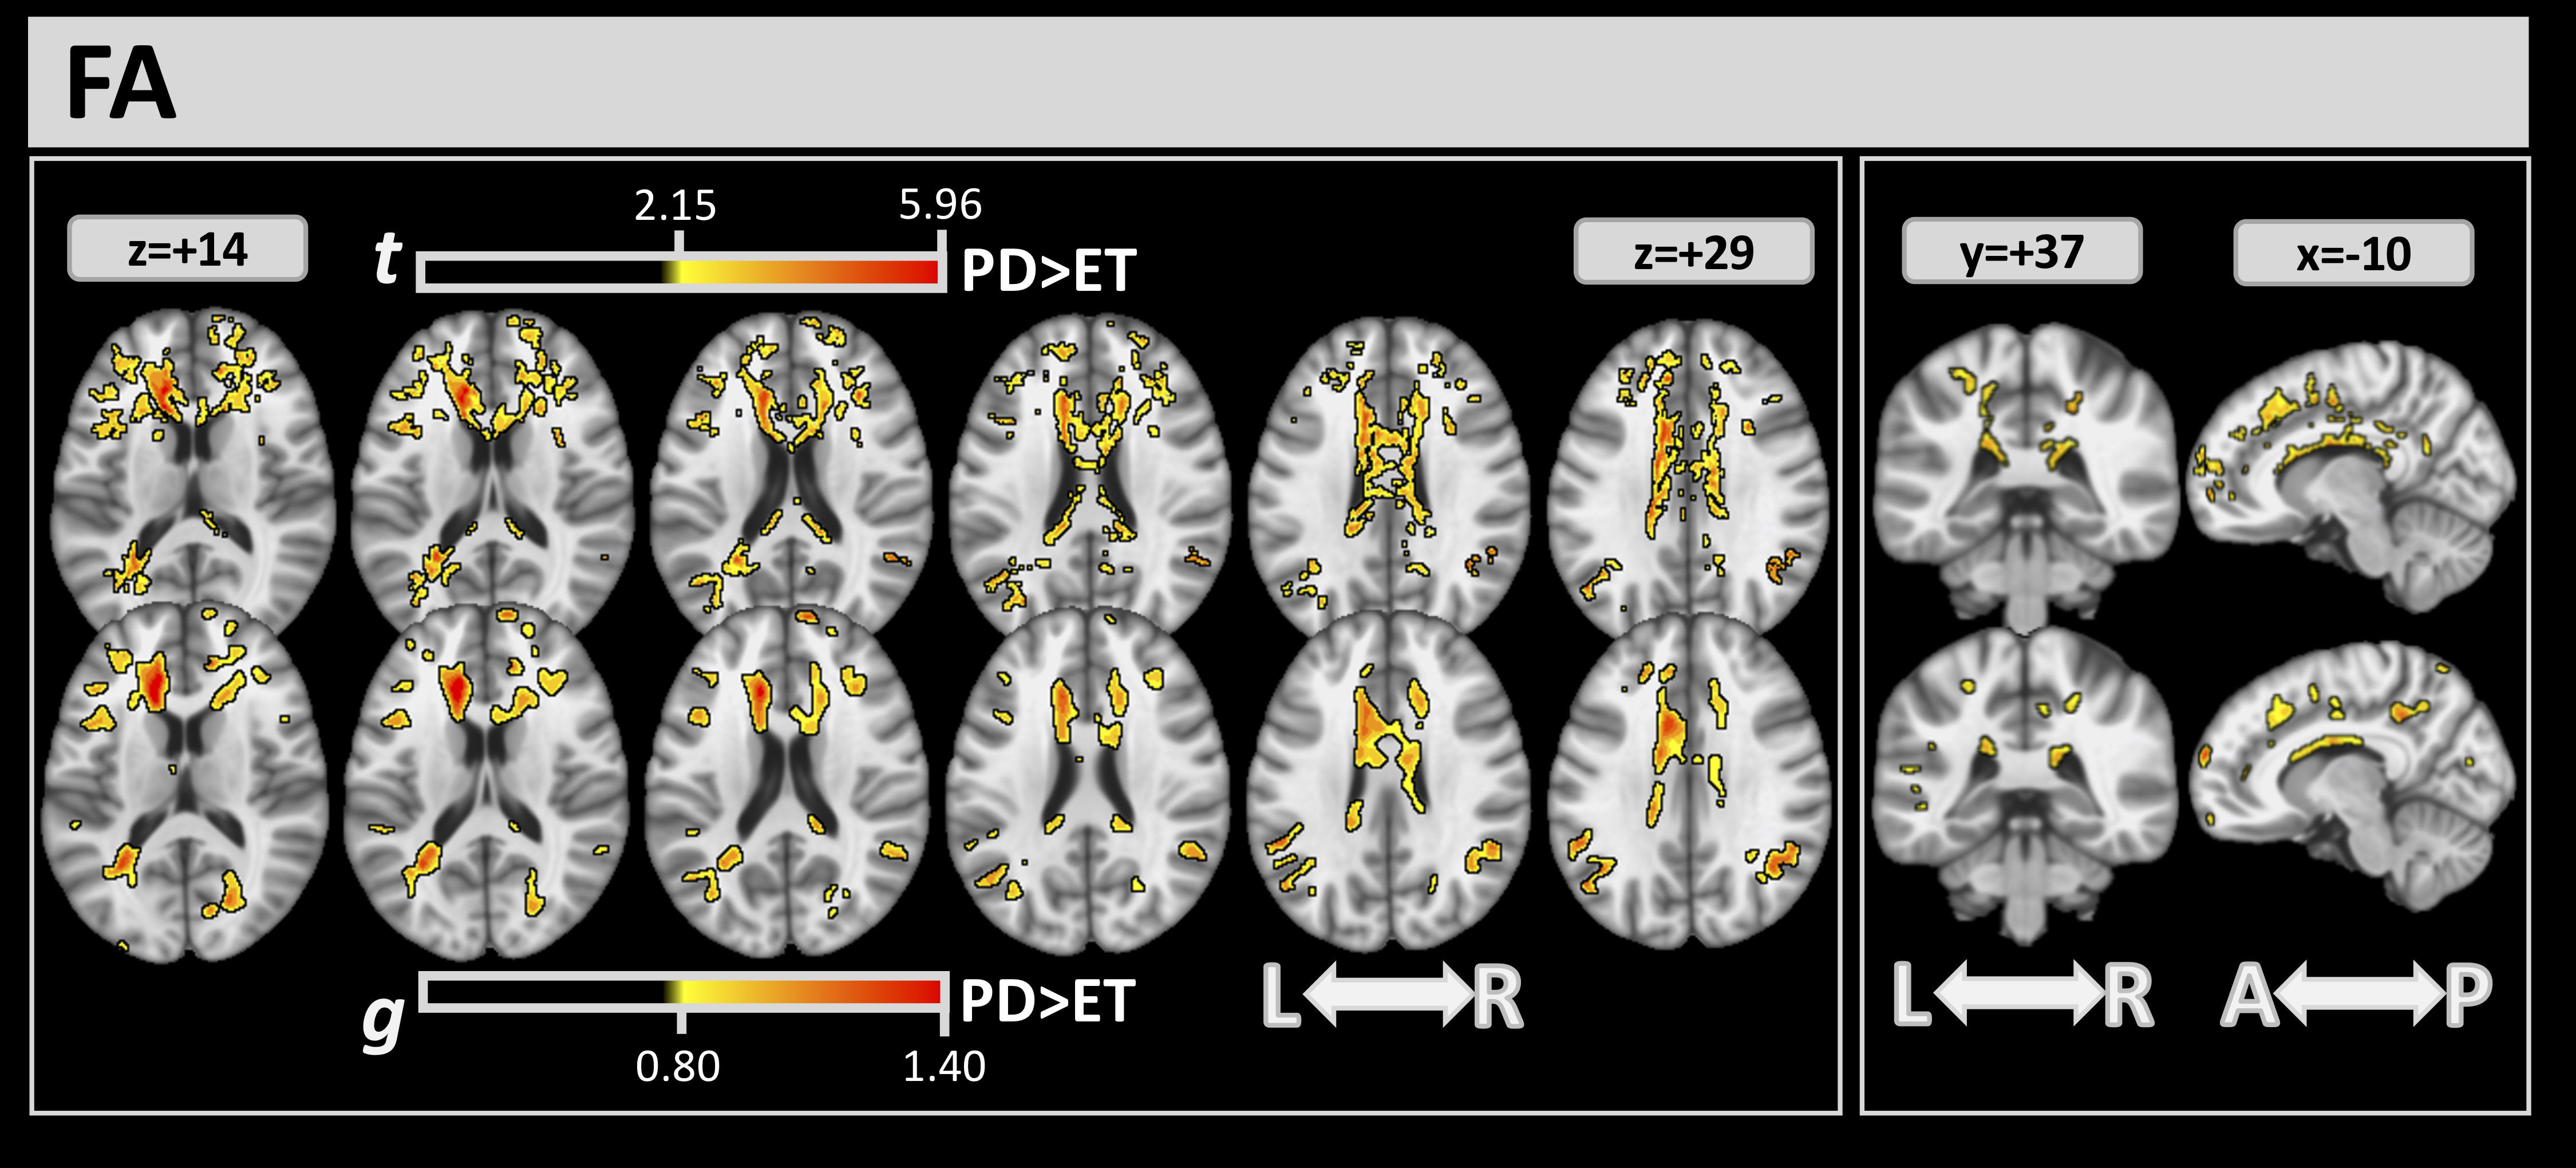
Differences between the 2 groups detected by DTI through the FA index are shown
in Fig. 2. Through FWE and effect-size analysis, several significant clusters in
white matter were found where the ET group had lower FA values than the PD group.
Table 2 reports the complete list of clusters detected by FA analysis, with their
volume percentage, t, and g values. FA analysis showed large clusters of
difference in the corpus callosum (CC) (volumes:
 Fig. 2.
For FA, significant clusters at FWE
| FA FWE |
FA g | |||
| ICBM-DTI 81 | Vol % | t | Vol % | g |
| Genu of corpus callosum | 31.00 | 2.973 | 19.67 | 0.976 |
| Body of corpus callosum | 44.93 | 2.624 | 24.21 | 0.852 |
| Splenium of corpus callosum | 11.41 | 2.542 | 4.89 | 0.836 |
| Anterior limb of internal capsule L | 29.62 | 2.829 | 22.73 | 0.904 |
| Anterior corona radiata R | 25.57 | 2.489 | 10.13 | 0.823 |
| Anterior corona radiata L | 41.02 | 2.620 | 14.75 | 0.883 |
| Superior corona radiata R | 12.99 | 2.412 | 3.16 | 0.800 |
| Superior corona radiata L | 7.07 | 2.455 | 2.25 | 0.820 |
| Posterior corona radiata L | 4.55 | 2.452 | 3.53 | 0.864 |
| Posterior thalamic radiation L | 12.14 | 2.587 | 10.11 | 0.921 |
| External capsule L | 9.18 | 2.774 | 6.80 | 0.882 |
| Cingulum (cingulate gyrus) R | 29.72 | 2.517 | 4.36 | 0.870 |
| Cingulum (cingulate gyrus) L | 37.73 | 2.562 | 31.59 | 0.894 |
| Cingulum (hippocampus) L | 0.26 | 2.240 | - | - |
| Superior longitudinal fasciculus R | 0.68 | 2.303 | - | - |
| Superior longitudinal fasciculus L | 0.21 | 2.505 | 0.15 | 0.854 |
| Tapetum R | 1.51 | 2.198 | - | - |
| Tapetum L | 50.67 | 2.928 | 35.33 | 0.944 |
Abbreviations: g, mean effect-size values inside the clusters; t, mean of the t values inside the clusters; Vol%, volumes (in %) covered from the cluster inside the corresponding white matter atlas area.
FA, fractional anisotropy; FWE, family-wise error.
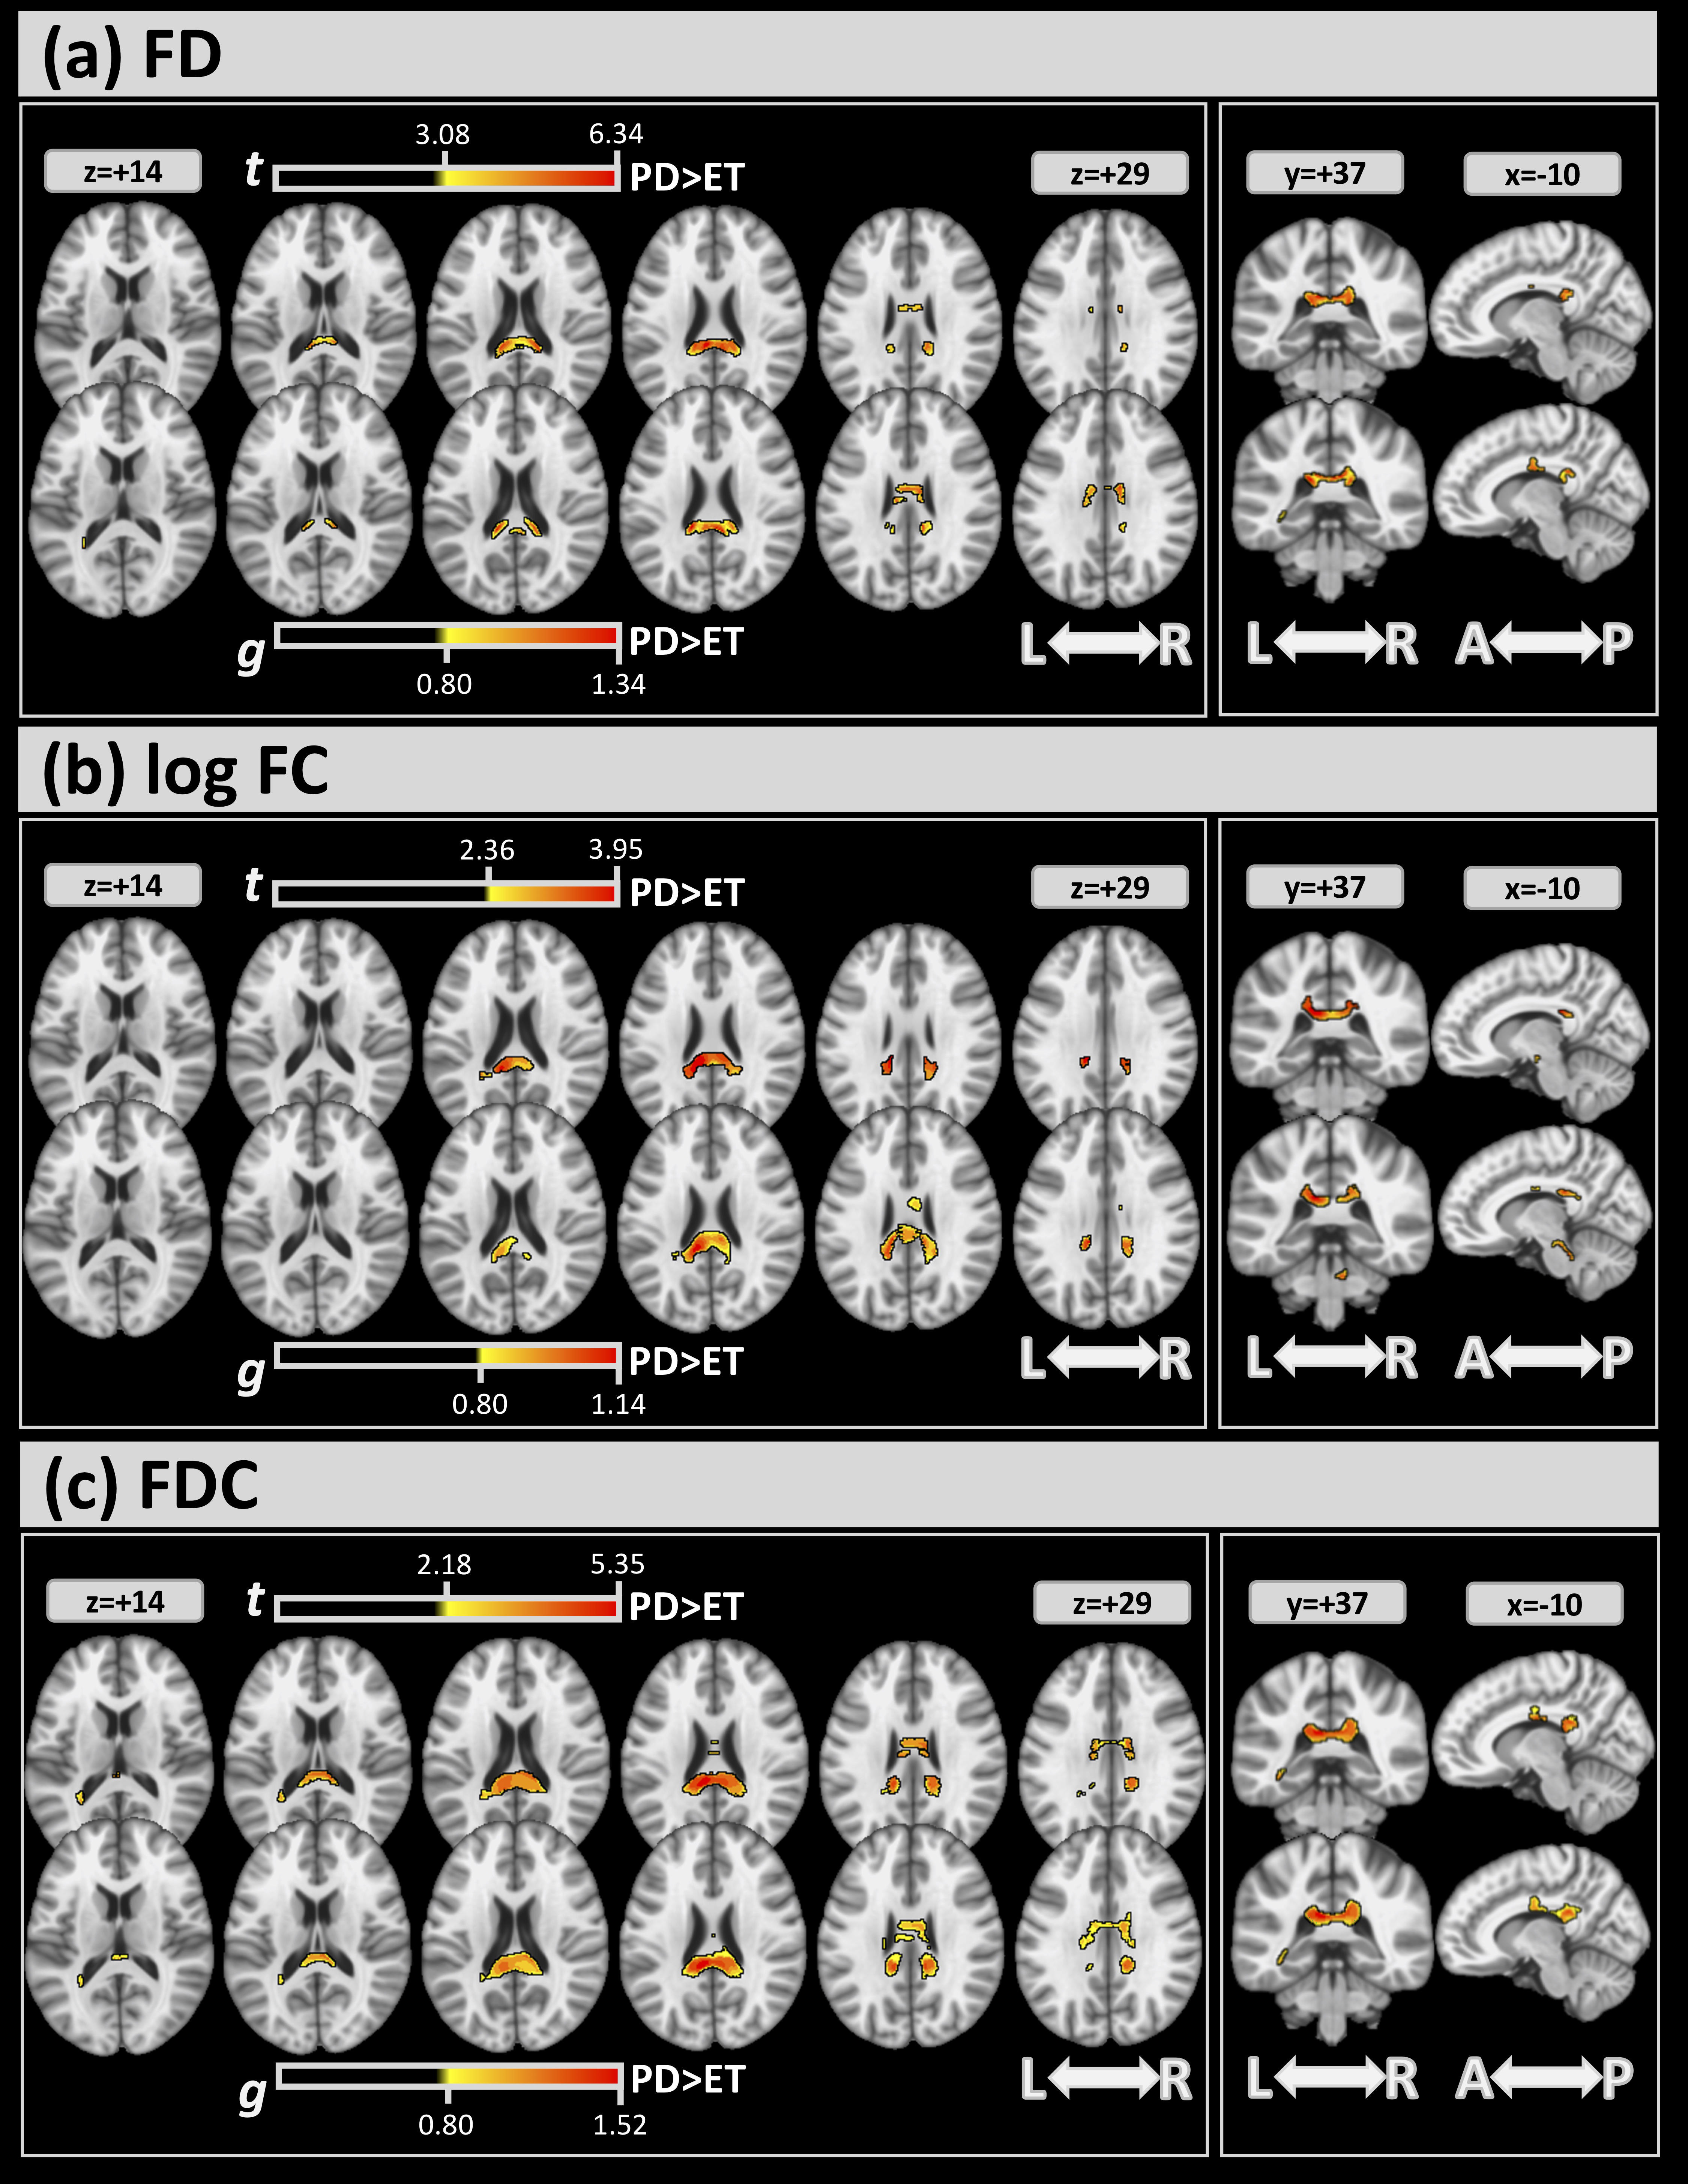
Fig. 3 shows the differences in FBA (FWE and effect size) between the 2 groups.
For all metrics, significant clusters of differences between the 2 groups (top
sub-panels of (a)-(c)) were found mainly in the CC (
 Fig. 3.
For FBA, significant clusters at FWE
| FD FWE |
FD g |
log FC FWE |
log FC g |
FDC FWE |
FDC g | |||||||
| ICBM-DTI 81 | Vol % | t | Vol % | g | Vol % | t | Vol % | g | Vol % | t | Vol % | g |
| Body of corpus callosum | 2.40 | 3.875 | 8.07 | 0.956 | 0.52 | 3.407 | 4.41 | 0.895 | 10.68 | 3.148 | 16.24 | 0.941 |
| Splenium of corpus callosum | 14.24 | 4.843 | 10.80 | 0.951 | 15.47 | 3.294 | 18.39 | 0.914 | 25.47 | 3.788 | 27.68 | 1.083 |
| Medial lemniscus R | - | - | - | - | - | - | 7.54 | 0.884 | - | - | - | - |
| Superior cerebellar peduncle R | - | - | - | - | - | - | 0.50 | 0.820 | - | - | - | - |
| Cerebral peduncle R | - | - | - | - | 6.28 | 3.075 | 13.48 | 0.857 | - | - | - | - |
| Cerebral peduncle L | - | - | - | - | - | - | 5.84 | 0.878 | - | - | - | - |
| Posterior limb of internal capsule R | - | - | - | - | 0.59 | 3.107 | 0.85 | 0.822 | - | - | - | - |
| Posterior limb of internal capsule L | - | - | - | - | - | - | 2.35 | 0.866 | - | - | - | - |
| Superior corona radiata R | - | - | 0.17 | 0.859 | - | - | - | - | 0.28 | 2.687 | 3.76 | 0.893 |
| Superior corona radiata L | - | - | 0.15 | 0.828 | - | - | - | - | - | - | 1.51 | 0.893 |
| Posterior corona radiata L | - | - | - | - | - | - | - | - | 1.51 | 2.411 | - | - |
| Sagittal stratum L | 0.76 | 3.647 | 0.45 | 0.807 | - | - | - | - | 2.96 | 2.926 | 1.61 | 0.909 |
| Cingulum (cingulate gyrus) R | - | - | - | - | - | - | - | - | 0.30 | 2.821 | 1.62 | 0.861 |
| Cingulum (cingulate gyrus) L | - | - | - | - | - | - | - | - | 0.22 | 2.644 | - | - |
| Tapetum L | 16.50 | 3.504 | 13.00 | 0.854 | 4.50 | 2.986 | 2.67 | 0.853 | 56.33 | 2.595 | 38.67 | 0.914 |
Abbreviations: g, mean effect-size values inside the clusters; t, mean of the t values inside the clusters; Vol%, volumes (in %) covered from the cluster inside the corresponding white matter atlas area.
FD, fiber density; FC, fiber-bundle cross-section; FDC, fiber density bundle cross-section.
As a secondary analysis to confirm that the scanner covariate did not drive the group-wise results, Supplementary Fig. 1 and Supplementary Table 1 show the results from the same statistical analysis for FBA for GE and Philips scanners separately. Similar regional trends are observed for Philips (top sub-panels) and GE (bottom sub-panels) for each FBA metric ((a)-(c)), and in general, these trends match those of Fig. 2 and Table 2. Notably, differences between groups in the CC and left tapetum were confirmed for both combined and separate analyses.
In this study, we evaluated white matter tract differences between a well-characterized clinical cohort of advanced ET and moderate-to-severe PD using a novel fixel-based method. FBA overcomes several limitations associated with standard DTI; most notably, DTI cannot differentiate multiple sub-voxel fiber orientations often present in crossing fibers, which may lead to inaccurate DTI metrics. Additionally, FBA allows for the estimation of different orientations of fibers within a voxel, yielding metrics reflecting FD, FC, and a combination of these measures. For comparison, results from standard DTI are also presented. With standard DTI-based FA, widespread non-specific differences were observed between ET and PD groups, with many changes occurring more superior and anterior. On the other hand, results from FBA demonstrated significant differences were primarily concentrated in posterior regions of the corpus callosum, as well as the cerebral peduncle and left tapetum.
Understanding the advanced stages of the disease, particularly in patients seeking neurosurgical interventions, may reveal unique regional vulnerabilities in white matter pathways that may be a factor underlying treatment outcomes with DBS in tremors. A previous study by Juttukonda et al. [29] considered DTI-based changes in a similar cohort of ET and PD patients presenting for DBS. In that study, the authors found lower FA in ET patients compared to PD patients in white matter tracts posteriorly along the cerebello-thalamo-cortical network, as well as in the splenium of the corpus callosum and tapetum. These results are consistent with our results showing lower FA in ET than PD group, including in the tapetum; however, our standard DTI-based FA showed greater involvement of anterior cortical projections, including the genu/body of corpus callosum, anterior corona radiata, and cingulum (cingulate gyrus). Interestingly, the FBA results showed posterior-dominant involvement, most notably in the splenium of the corpus callosum and tapetum, which anatomically aligns with the prior study. Taken together, the previous findings of lower FA and higher RD and the current findings of reduced FD and FDC may indicate demyelination processes in the splenium and tapetum of ET patients. However, caution is warranted in directly interpreting dMRI metrics, as these metrics may reflect complex biological processes that cannot be fully modeled [36]. Nonetheless, the findings of white matter microstructural differences between ET and PD groups are strongly bolstered by consistent findings replicated across studies and populations. Furthermore, these findings support the hypothesis that a vulnerable white matter pathway may exist in ET.
The involvement of the corpus callosum in PD has been previously noted in several studies. Compared to healthy controls, PD patients have shown decreased FD in the corpus callosum with increased FD in the corticospinal tract, possibly reflecting a compensatory process [51]. Additionally, decreased FDC has been observed longitudinally in the splenium in PD patients, as well as in the tapetum [52]. To our knowledge, no studies have previously investigated FBA-based changes in ET; however, standard DTI has shown variable results in comparisons between ET and healthy controls. For example, 2 studies in ET revealed significant differences in diffusivity measures in the cerebellum [53] and red nuclei [15] but no corresponding FA differences. On the other hand, decreased FA has been observed using a white matter skeletonized approach in the corpus callosum and cortical spinal tract, as well as in the frontal, occipital, and temporal white matter [54]. Although the present study did not compare to healthy controls, our results suggested differences in white matter integrity in the corpus callosum.
Interestingly, few similarities were observed between regions identified by FA and FBA-based metrics. Although the same underlying data with inherent sensitivity to white matter microstructure are used for both analyses, the model used for each is fundamentally different. As noted above, DTI models a single component within each voxel, while FBA can resolve multiple fiber populations within each voxel. Recent studies have suggested that the majority of cerebral white matter (up to 90% [39]) contains multiple fiber bundles, which may lead to erroneous inferences using DTI-based FA alone [32]. For example, we recently demonstrated that an observed paradoxical increase in FA in Alzheimer disease (conventionally interpreted as higher white matter integrity) could be rather attributed to sub-voxel neurodegeneration; by correcting for this factor, the resulting FA changes were more consistent with known Alzheimer disease pathology [55]. Interestingly, increased FA remained after correction in several regions, including the cortical spinal tract; using an advanced anisotropy metric (the mode of anisotropy), we showed that these changes were indicative of degeneration in crossing fiber populations that are not accounted for by free-water correction. On the other hand, FBA estimates tissue microstructure for multiple compartments using constrained spherical deconvolution, which has previously been shown to provide reliable and stable measurements over time [56]. As a result, FBA is likely more reliable in assessing white matter changes in voxels with multiple fiber populations. Other studies comparing DTI and FBA metrics in various pathologies have similarly shown disparate results, suggesting that these models may detect different underlying microstructural changes [57, 58].
The FBA framework provides an advanced analysis pipeline for assessing
fiber-specific features associated with white matter in the brain. These features
are extracted from dMRI data, allowing the FBA framework to overcome many known
challenges associated with more conventional DTI analysis. The currently
recommended dMRI protocol for FBA analysis is acquisitions with greater than 45
directions and b-values greater than 3000 s/mm
There are limited studies assessing unique pathological processes in ET compared to other movement disorders such as PD. Interestingly, the ET group in our analysis showed lower FA compared to the PD group, suggesting disruption of white matter pathways. Pathological understanding of ET is limited, with changes in cerebellar Purkinje neurons primarily reported by some groups [40, 61, 62]. Other groups have refuted these findings and have demonstrated a lack of cerebellar involvement [63, 64, 65]. Although our findings did not demonstrate cerebellar group differences, this may be attributed to sample size or methodological differences. It should be noted that the disease stage of both groups is more advanced, reflecting the typical population referred for DBS. Although the exact mechanism is unknown, differential white matter changes between ET and PD have been observed previously [29] and are confirmed herein. Future work should investigate the association of these white matter changes with neurofunctional scores in PD and ET, thus allowing a better understanding of the role of white matter abnormalities on both motor and non-motor symptoms.
In addition to white matter, microstructural changes observed using dMRI and white matter hyperintensities (WMH) are commonly observed in aging populations [66]. They may be associated with a range of neurodegenerative diseases, including both PD [67] and ET [68]. dMRI studies have shown that WMH are associated with reduced FA, reflecting decreased white matter integrity [68]. Additionally, WMHs may be associated with cortical microstructural changes [69], suggesting an interplay between white matter (WM) and gray matter neurodegenerative processes. Differences in WMH burden could contribute to the group-wise differences observed herein, and future studies should investigate the impact of WMH on dMRI biomarkers across groups and whether these changes extend beyond WM tract integrity.
There are some limitations in the present study. The sample sizes were not matched between the two cohorts, and as noted above, the ET cohort was relatively small (n = 17). For this reason, we also analyzed the effect size. Additionally, ET diagnosis was performed based on the 1998 criteria [37], and we did not stratify the ET cohort into different subtypes [70, 71], as this information was not available as part of this retrospective study. Future prospective studies should investigate unique white matter changes across these subtypes. Although our main goal was to analyze white matter differences between PD and ET, the present study lacked a healthy control cohort for comparison. However, several previous studies have analyzed white matter differences between healthy control and PD cohorts [72] and between healthy control and ET cohorts [73], while the focus herein was to investigate regional differences between these 2 movement disorders. Another limitation of our retrospective analysis is the unmatched protocols between the 2 clinical scanners used; to overcome this limitation, we performed a secondary analysis for each scanner independently that corroborated the combined results. Additionally, the dMRI acquisition differed from current recommendations, which may limit the biological interpretation of our findings. Another minor limitation is that full coverage of the cerebellar grey matter was not obtained in the clinical protocol; as all white matter tracts were included in the group template, this did not impact our analysis. Future prospective studies with larger cohorts and at earlier stages are needed to validate and expand the current findings.
In conclusion, the present study showed significant differences in white matter integrity between ET and PD cohorts in the later stages of the disease. Differences in posterior white matter projections were observed using advanced FBA-based metrics, which permits the modeling of multiple intra-voxel fiber orientations. Standard DTI-based FA was also included for comparison and showed group differences in several brain regions. In both cases, white matter integrity was more impacted in ET than PD in regions previously implicated in these diseases. Advanced diffusion-based metrics may provide a better understanding of the similarities and differences in white matter microstructure between these disparate motor-associated diseases with different underlying phenotypes.
The datasets generated and/or analyzed during the current study are not publicly available due to clinical purpose but are available from the corresponding author on reasonable request.
Conceptualization: MB, SA and AMS; Methodology: SA and AMS; Software: MB; Validation: MB, SA and AMS; Formal Analysis: MB; Data Curation: MB and JJK; Visualization: SA and AMS, LA; Writing, Original Draft Preparation: MB, SA and AMS; Writing, Review & Editing: MB, SA, LA and AMS; Supervision: SA and AMS. All authors contributed to editorial changes in the manuscript. All authors read and approved the final manuscript. All authors have participated sufficiently in the work and agreed to be accountable for all aspects of the work.
A waiver of informed consent was obtained for this retrospective study. This study was conducted according to the guidelines of the Declaration of Helsinki and was approved by the Institutional Review Board of St. Joseph’s Hospital and Medical Center (protocol PHX-22-500-031-73-04, approved 08/13/2021).
The authors would like to thank Dr. Holly Shill for helpful discussions.
This work was supported by the Barrow Neurological Foundation, Sam & Peggy Grossman Family Foundation, and Samuel P. Mandell Foundation.
The authors declare no conflict of interest.
References
Publisher’s Note: IMR Press stays neutral with regard to jurisdictional claims in published maps and institutional affiliations.