
- Academic Editors
†These authors contributed equally.
Background: Sleep deprivation (SD) has emerged as a significant public health concern because of its adverse effects on cognition and behavior. However, the influence of circadian rhythms on SD and brain activities has been less studied. This study employed functional magnetic resonance imaging (fMRI) and functional connectivity density (FCD) metrics to investigate the interaction between sleep pressure and circadian rhythms during SD. Methods: Thirty-six volunteers with good sleep habits underwent a sleep deprivation trial. Sleepiness was assessed using the Stanford Sleepiness Scale (SSS) at multiple time points, and fMRI scans were conducted to derive global and local FCD (gFCD and iFCD) values. This study focused on specific brain regions and networks, including the thalamus, the frontoparietal network (FPN), and the default mode network (DMN). Results: Analysis indicated significant changes in gFCD and iFCD values in several key brain regions. A strong correlation was found between sleepiness and both gFCD and iFCD values in certain areas, such as the left superior temporal gyrus and left thalamus. The gFCD values in these regions showed a gradual increase across sessions, while iFCD values in the right superior frontal gyrus decreased. Conclusions: This study revealed that SD leads to enhanced functional activities in the DMN and thalamus and decreased activity in the FPN. These changes in brain activity were significantly correlated with increases in sleepiness, as measured by the SSS. Our findings underscore the importance of understanding the neural underpinnings of SD and could guide future clinical interventions aimed at mitigating its effects.
Sleep deprivation (SD), i.e., a lack of sleep, can lead to numerous physiological, psychological, and behavioral changes [1, 2]. Prominent features of SD include poor concentration, increased rate of microsleeps, prolonged reaction times, and reduced productivity [3]. In terms of cognition, SD adversely affects working memory, decision-making, motor control, and attention [4, 5, 6]. Given the rapid societal and economic advancements of recent decades, long-term SD has become an increasingly common condition among workers, such that it is now a significant public health concern [7]. Therefore, exploring the effects of SD on sleepiness and neural activities, and subsequently implementing appropriate interventions and treatments, is of high clinical significance.
With the rapid progression of neuroimaging technology, functional magnetic resonance imaging (fMRI) has been extensively employed to study the alterations of brain activities induced by SD [8]. In the past, studies typically explored the effects of SD on behavior and brain activation by comparing data obtained after normal sleep with that obtained after SD [9]. These investigations provided important insights, including demonstrating reduced activation following SD in particular brain regions, such as the thalamus, superior parietal gyrus, inferior frontal gyrus, paracentral lobule, medial frontal gyrus, and supplementary motor area [10, 11]. However, they often overlooked the interaction between sleep homeostasis and circadian rhythms, which is an essential aspect of sleep regulation [12]. Previous studies have indicated that (1) cognitive capabilities are affected to varying degrees by SD and that (2) brain activities are closely regulated by circadian signals [13]. Through the collection of sleepiness and fMRI data every 2 hours (from 10:00 PM to 6:00 AM; five data points total), the present study aimed to provide further insight into SD by considering the influence of circadian rhythms. This method provided a more nuanced understanding of how sleep pressure and circadian rhythms interact to affect sleepiness and brain activities during SD.
To improve our understanding of the interaction between sleep pressure and circadian rhythms, we derived functional connectivity density (FCD) data from resting-state fMRI scans [14]. FCD is a quantifiable measure of how each voxel in the brain connects to all other voxels, thereby indicating the local and global information processing efficiency of the brain. An effective metric in neuroimaging research, FCD has facilitated significant advances in understanding the pathophysiology of various neurological conditions and mental illnesses [15, 16]. The Default Mode Network (DMN) is a well-established brain network known to decrease in activity during tasks that demand attention and increase during rest or introspection [17, 18]. Over recent years, its importance has been underscored in various cognitive processes, including self-referential thought, mind wandering, and memory consolidation. While many studies have explored the DMN’s general function and role, there is still limited understanding of its behavior under sleep-deprived conditions. Sleep deprivation, prevalent in today’s fast-paced society, has profound cognitive and physiological consequences. Understanding how sleep deprivation impacts the DMN and its associated cognitive processes could provide essential insights into the brain’s adaptive mechanisms during periods of reduced sleep. The Frontoparietal Network (FPN) is a key cognitive control network, crucial for orchestrating attention and executive functions [19]. It dynamically cooperates with other networks to facilitate a broad range of cognitive tasks. Recent literature suggests that the FPN is particularly sensitive to the state of alertness and cognitive load, making it a prime candidate for study under conditions of sleep deprivation [20]. Conversely, the thalamus, nestled deep within the brain, acts as a pivotal relay hub, transmitting sensory and motor signals to the cerebral cortex. More than just a passive relay, the thalamus plays an active role in cognitive functions, sleep regulation, and consciousness. Its central role in information processing makes it a region of interest, especially when considering the impacts of sleep deprivation on brain function [21]. Based on the current understanding of the effects of sleep deprivation on brain function, and considering the interplay between sleep pressure and circadian rhythms, we hypothesized that sleep deprivation would lead to distinct changes in the functional connectivity density within vital brain regions, particularly in the thalamus and in networks such as the DMN and FPN. Furthermore, we anticipated that these neural alterations would correlate with the cognitive deficits typically observed during sleep deprivation periods. By investigating these alterations, we aimed to achieve a more comprehensive understanding of the interaction effect of circadian rhythms and sleep pressure on brain connectivity.
This study was designed as a cross-sectional observational investigation
conducted at the Xijing Hospital affiliated with the Air Force Medical University
(Xi’an, Shaanxi, China). The research spanned one year, from January 2022 to
December 2022. This study primarily recruited undergraduate and postgraduate
student volunteers from various colleges in Xi’an, China. The inclusion criteria
were: (1) right-handedness; (2) aged 18–30 years; (3) normal intelligence level;
and (4) no contraindications for magnetic resonance imaging (MRI) scanning.
Participants were excluded if they had a history of alcohol or drug abuse; any
neurological condition, mental illness, or sleep disorder; or if they were an
extreme “morning type” or “evening type” according to the Munich Chronotype
Scale [22]. All participants were asked to record their sleep and wake times on
weekdays and weekends. In total, 54 healthy volunteers, consisting of 29 male and
25 female participants with an average age of 22.46
Participants were required to visit the laboratory twice. The first visit, which
took place 1 week before the trial, involved a brief introduction to the
experimental procedure and completion of the informed consent process.
Participants were also given a wristwatch (Mini Mitter; Philips Respironics,
Murrysville, PA, USA) to monitor their sleep patterns over the following week,
during which they were asked to maintain their normal sleep habits. During the
second visit, volunteers reported to the laboratory no later than 6:00 PM to
start the trial. During the trial, participants could read, watch TV, or surf the
Internet, but they were not permitted to engage in strenuous activities or leave
the laboratory. Two research assistants ensured participants did not fall asleep
during the trial. MRI scans were conducted every 2 hours from 10:00 PM to 6:00 AM
(T
MRI data were collected using a Discovery MR750 3.0-T superconducting magnetic
resonance scanner (GE, Boston, MA, USA) equipped with an 8-channel head coil.
Rubber pads and earplugs were provided to mitigate noise during the scan.
Participants were instructed to keep their eyes open throughout the scan.
Research assistants confirmed that participants remained awake throughout the
entire process. For resting-state fMRI, a single-excitation spin plane echo
imaging sequence was performed. An axial scan was acquired with the scanning
angle parallel to the anterior-posterior commissure line. The scanning parameters
were as follows: echo time, 30 ms; repetition time, 2000 ms; slice thickness, 3.0
mm; slices, n = 36; scanning mode, continuous with no interval; field of view,
240 mm
In the preprocessing stage of our imaging data, scans were thoroughly reviewed
by experienced imaging specialists. They ensured that there were no evident
structural abnormalities or overt issues in any of the brain regions of our
subjects. Pre-processing of fMRI data was performed using the Data Processing &
Analysis of Brain Imaging (http://rfmri.org/DPABI) and Statistical Parametric
Mapping 12 (SPM 12; https://www.fil.ion.ucl.ac.uk/spm/) toolboxes in the MATLAB
(ver. 2016b; MathWorks, Natick, MA, USA) environment. The pre-processing steps
included: (1) conversion of the original Digital Imaging and Communications in Medicine (DICOM) data into an analyzable Neuroimaging Informatics Technology Initiative (NIFTI)
format; (2) removal of fMRI data acquired at the first 10 time points for each
participant; (3) time slice correction to eliminate interslice signal differences
caused by varying acquisition times; (4) motion correction to exclude
participants with translational movement
FCD is computed through a series of steps. First, whole-brain voxel-wise correlation is performed to identify all voxels that show a significant temporal correlation with the seed voxel. The threshold for significance is set at a correlation coefficient of 0.6. The number of significantly correlated voxels is then determined to generate the global FCD (gFCD) value for the seed voxel. This process is repeated for every voxel in the brain, producing a 3D map of gFCD. The short-range functional connectivity density index (iFCD) is derived in a similar way to the gFCD value, but connections are counted only if significantly correlated voxels are located within a radius of 12 mm. The gFCD reflects the strength and extent of functional connections between spatially distant or interregional brain regions; in contrast, the iFCD provides an index of the degree of local integration within the brain network, reflecting the strength and extent of functional connections between neighboring regions. Finally, normalized FCD values are computed for subsequent statistical analysis. For our study, we adopted a whole-brain approach to ensure comprehensive coverage and understanding of potential neural changes. This meant that we did not limit our analysis to predefined regions but investigated the entirety of the brain to detect any alterations in functional connectivity.
Demographic data were statistically analyzed using SPSS software (version 24.0;
IBM Corp., Armonk, NY, USA). Given the longitudinal nature of the experiment, a
one-way repeated-measures analysis of variance (ANOVA) was used to compare
differences in SSS values at multiple time points. Post hoc analysis further
explored differences in SSS values between pairs of time points. False discovery
rate (FDR)-corrected p-values
Thirty-six volunteers completed the SD trial. All volunteers had good sleep
habits; on average, they fell asleep at 10:29
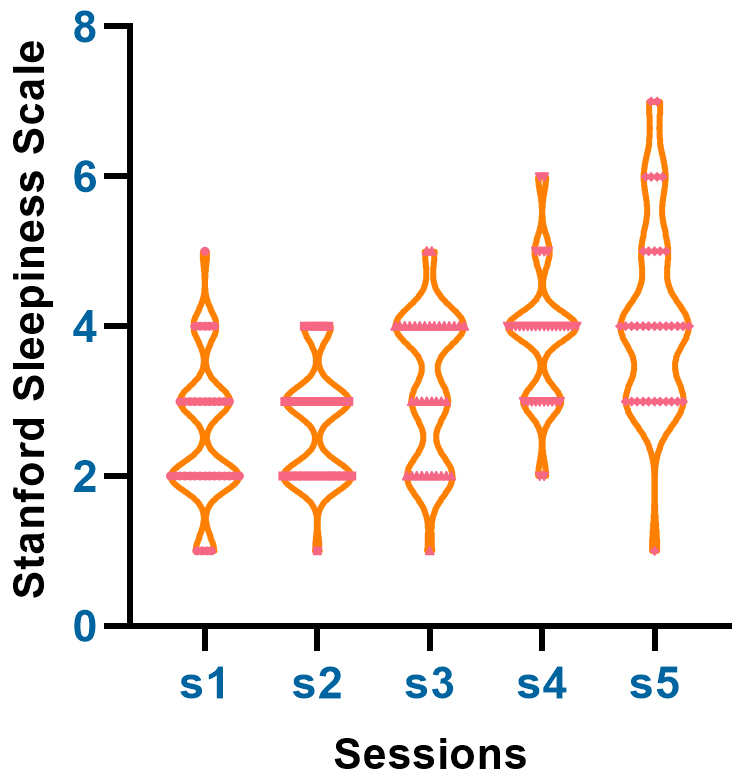 Fig. 1.
This figure depicts the time-dependent changes in Stanford
Sleepiness Scale (SSS) scores during sleep deprivation. Data were collected at
five different time points (T
A one-way repeated-measures ANOVA indicated significant changes in gFCD values in the frontal gyrus (right middle, right superior, and left medial), parietal gyrus (bilateral superior), temporal gyrus (left superior and left middle), occipital gyrus (right superior), left precentral gyrus, bilateral thalamus, right middle cingulate gyrus, and right angular and left supramarginal gyrus (Table 1). Significant changes in iFCD values were mainly found in the frontal gyrus (right middle, right superior and left medial), parietal gyrus (bilateral superior), temporal gyrus (left superior), bilateral thalamus, bilateral precentral gyrus, and middle temporal gyrus (Table 2). The overall gFCD and iFCD findings are shown in Fig. 2.
| Region | Hemisphere | MNI Coordinates | Cluster (Voxels) | F value | ||
| X | Y | Z | ||||
| SPG | L | –32 | –60 | 58 | 509 | 21.67 |
| SPG | R | 26 | –60 | 50 | 527 | 20.15 |
| PreCG | L | –52 | 8 | 38 | 501 | 18.63 |
| STG | L | –52 | –32 | 20 | 352 | 17.85 |
| THA | R | 12 | –16 | 6 | 294 | 17.65 |
| MFG | R | 40 | 52 | 10 | 258 | 17.53 |
| MCG | R | 7 | 28 | 40 | 107 | 16.82 |
| THA | L | –8 | –12 | 6 | 327 | 16.23 |
| SOG | R | 24 | –60 | 46 | 103 | 16.07 |
| PreCG | R | 36 | –2 | 46 | 497 | 15.92 |
| SFG | R | 20 | 44 | 38 | 205 | 15.26 |
| SFGmed | L | –8 | 68 | 10 | 198 | 14.72 |
| SMG | L | –52 | –34 | 26 | 147 | 14.62 |
| MTG | L | –54 | –32 | 10 | 167 | 13.71 |
| ANG | R | 26 | –58 | 48 | 159 | 11.51 |
Note: All reported regions were corrected for multiple comparisons on a cluster
threshold of p
| Region | Hemisphere | MNI Coordinates | Cluster (Voxels) | F value | ||
| X | Y | Z | ||||
| SPG | L | –39 | –11 | 59 | 354 | 19.32 |
| SPG | R | 27 | –60 | 51 | 398 | 18.31 |
| STG | L | –51 | –33 | 21 | 237 | 17.39 |
| PreCG | L | –51 | 9 | 36 | 381 | 16.63 |
| THA | R | 12 | –15 | 9 | 237 | 16.56 |
| MFG | R | 39 | 54 | 9 | 173 | 15.72 |
| PreCG | R | 33 | –6 | 51 | 407 | 15.54 |
| SFG | R | 36 | –6 | 60 | 87 | 15.42 |
| THA | L | –12 | –12 | 3 | 219 | 14.29 |
| SFGmed | L | –9 | 66 | 12 | 106 | 11.64 |
| MTG | L | –63 | –27 | 6 | 98 | 11.37 |
Note: All reported regions were corrected for multiple comparisons on a cluster
threshold of p
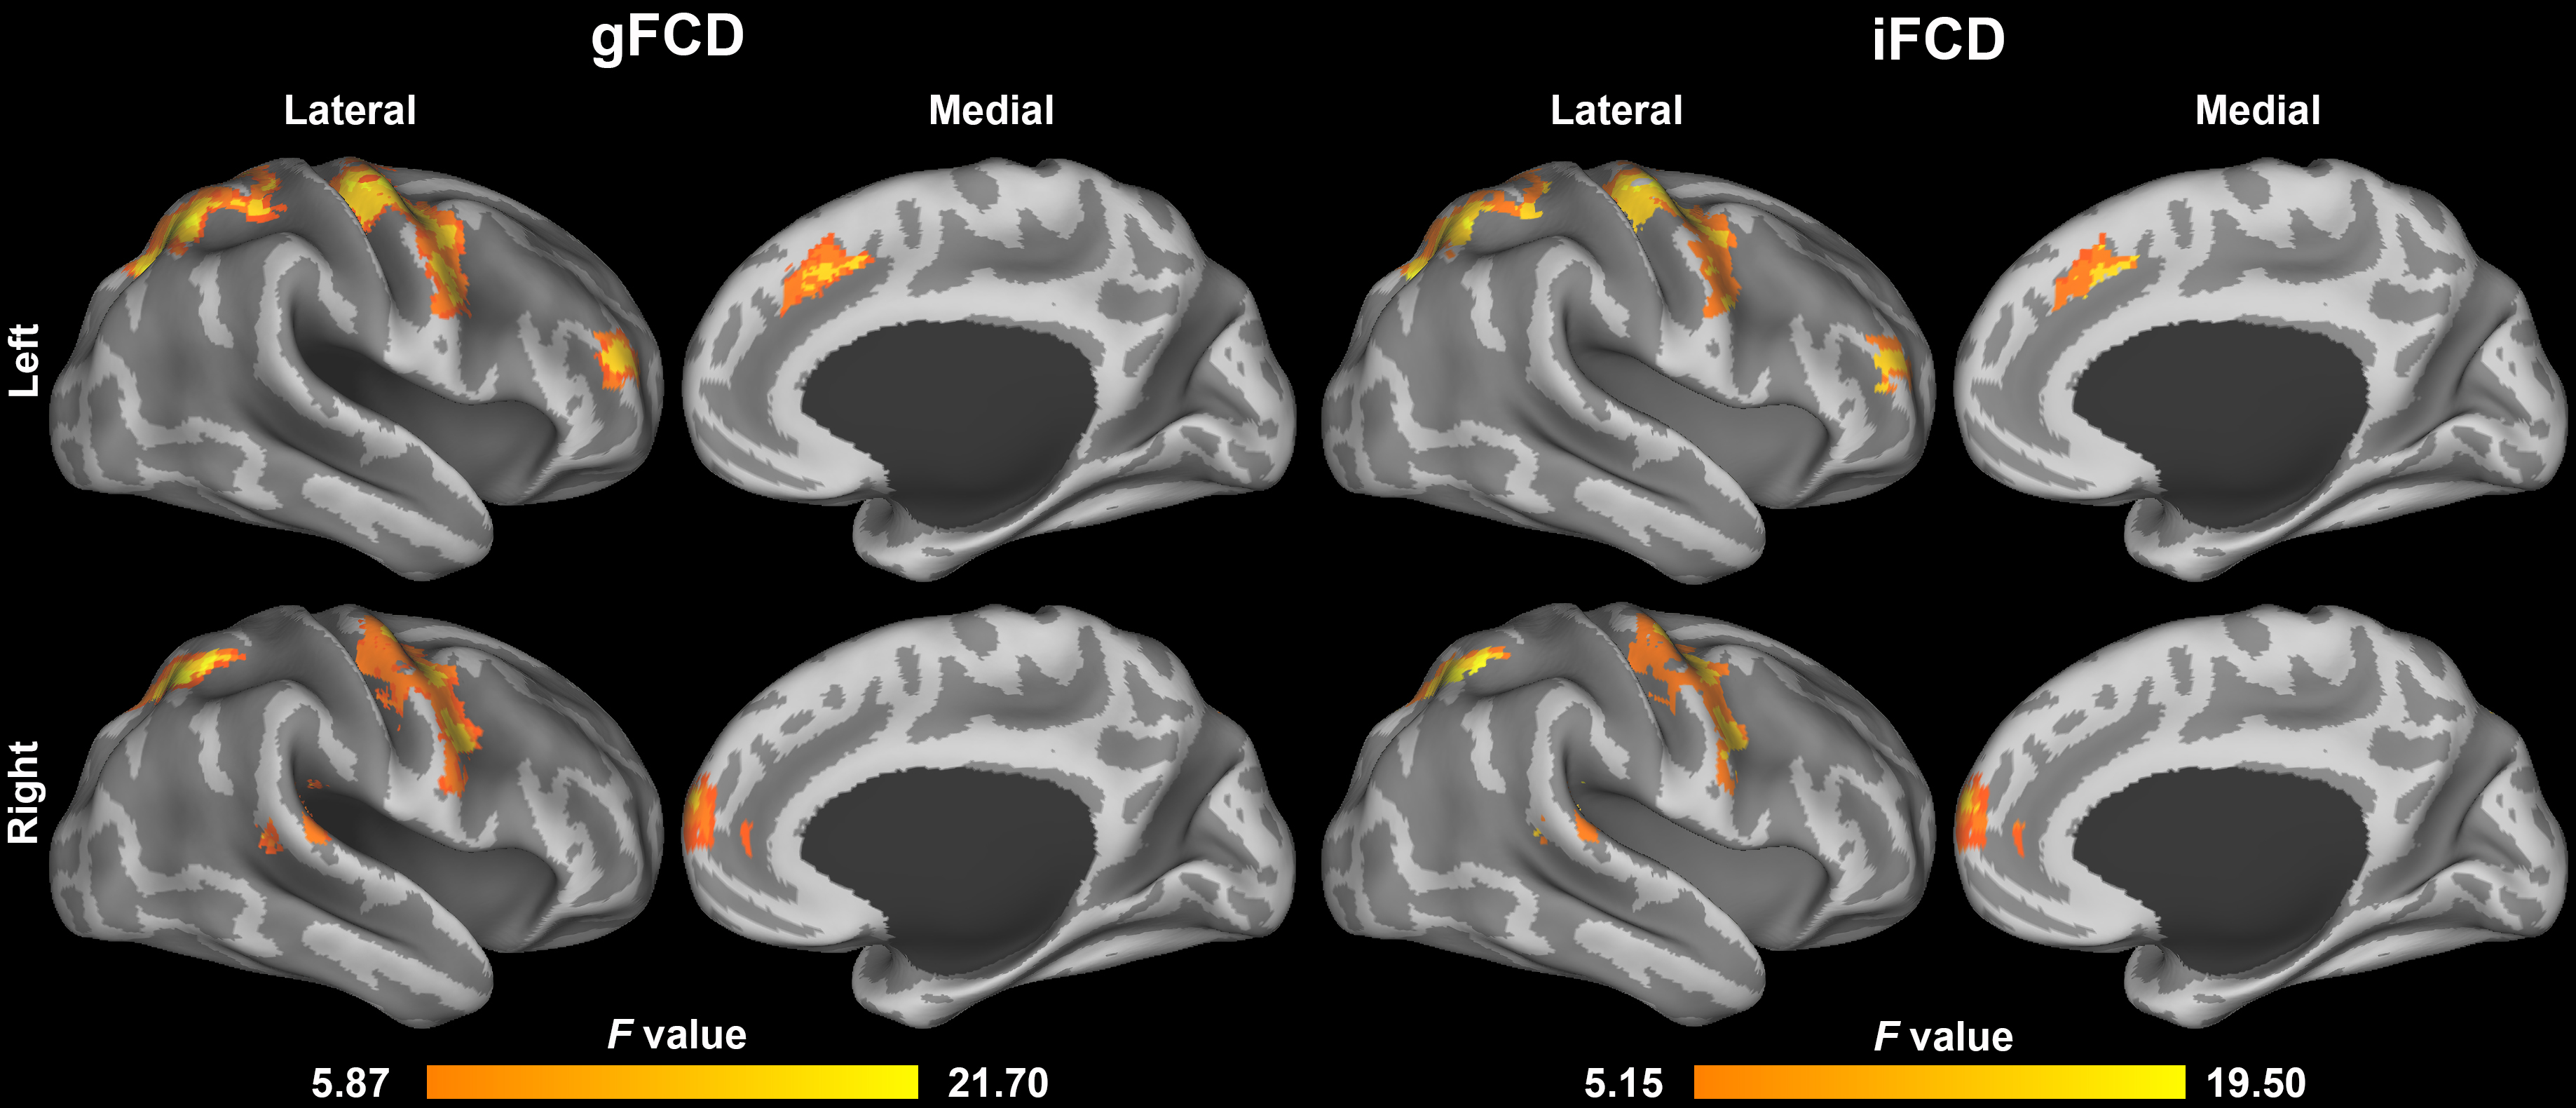 Fig. 2.
This figure summarizes the significant changes in global and local functional connectivity density (gFCD and iFCD) in various brain regions during sleep deprivation. Results from a one-way repeated-measures ANOVA are highlighted, showing alterations in frontal, parietal, temporal, and other key brain regions. Specific FCD changes are listed in Table 1 and Table 2. FCD, functional connectivity density.
To investigate the influence of sleepiness on functional connectivity during SD,
Pearson correlation analysis was used to evaluate the relationship between
sleepiness and gFCD/iFCD values in the brain areas mentioned above. The gFCD
values of the left superior temporal gyrus and left thalamus were positively
correlated with the SSS scores (r = 0.423, p
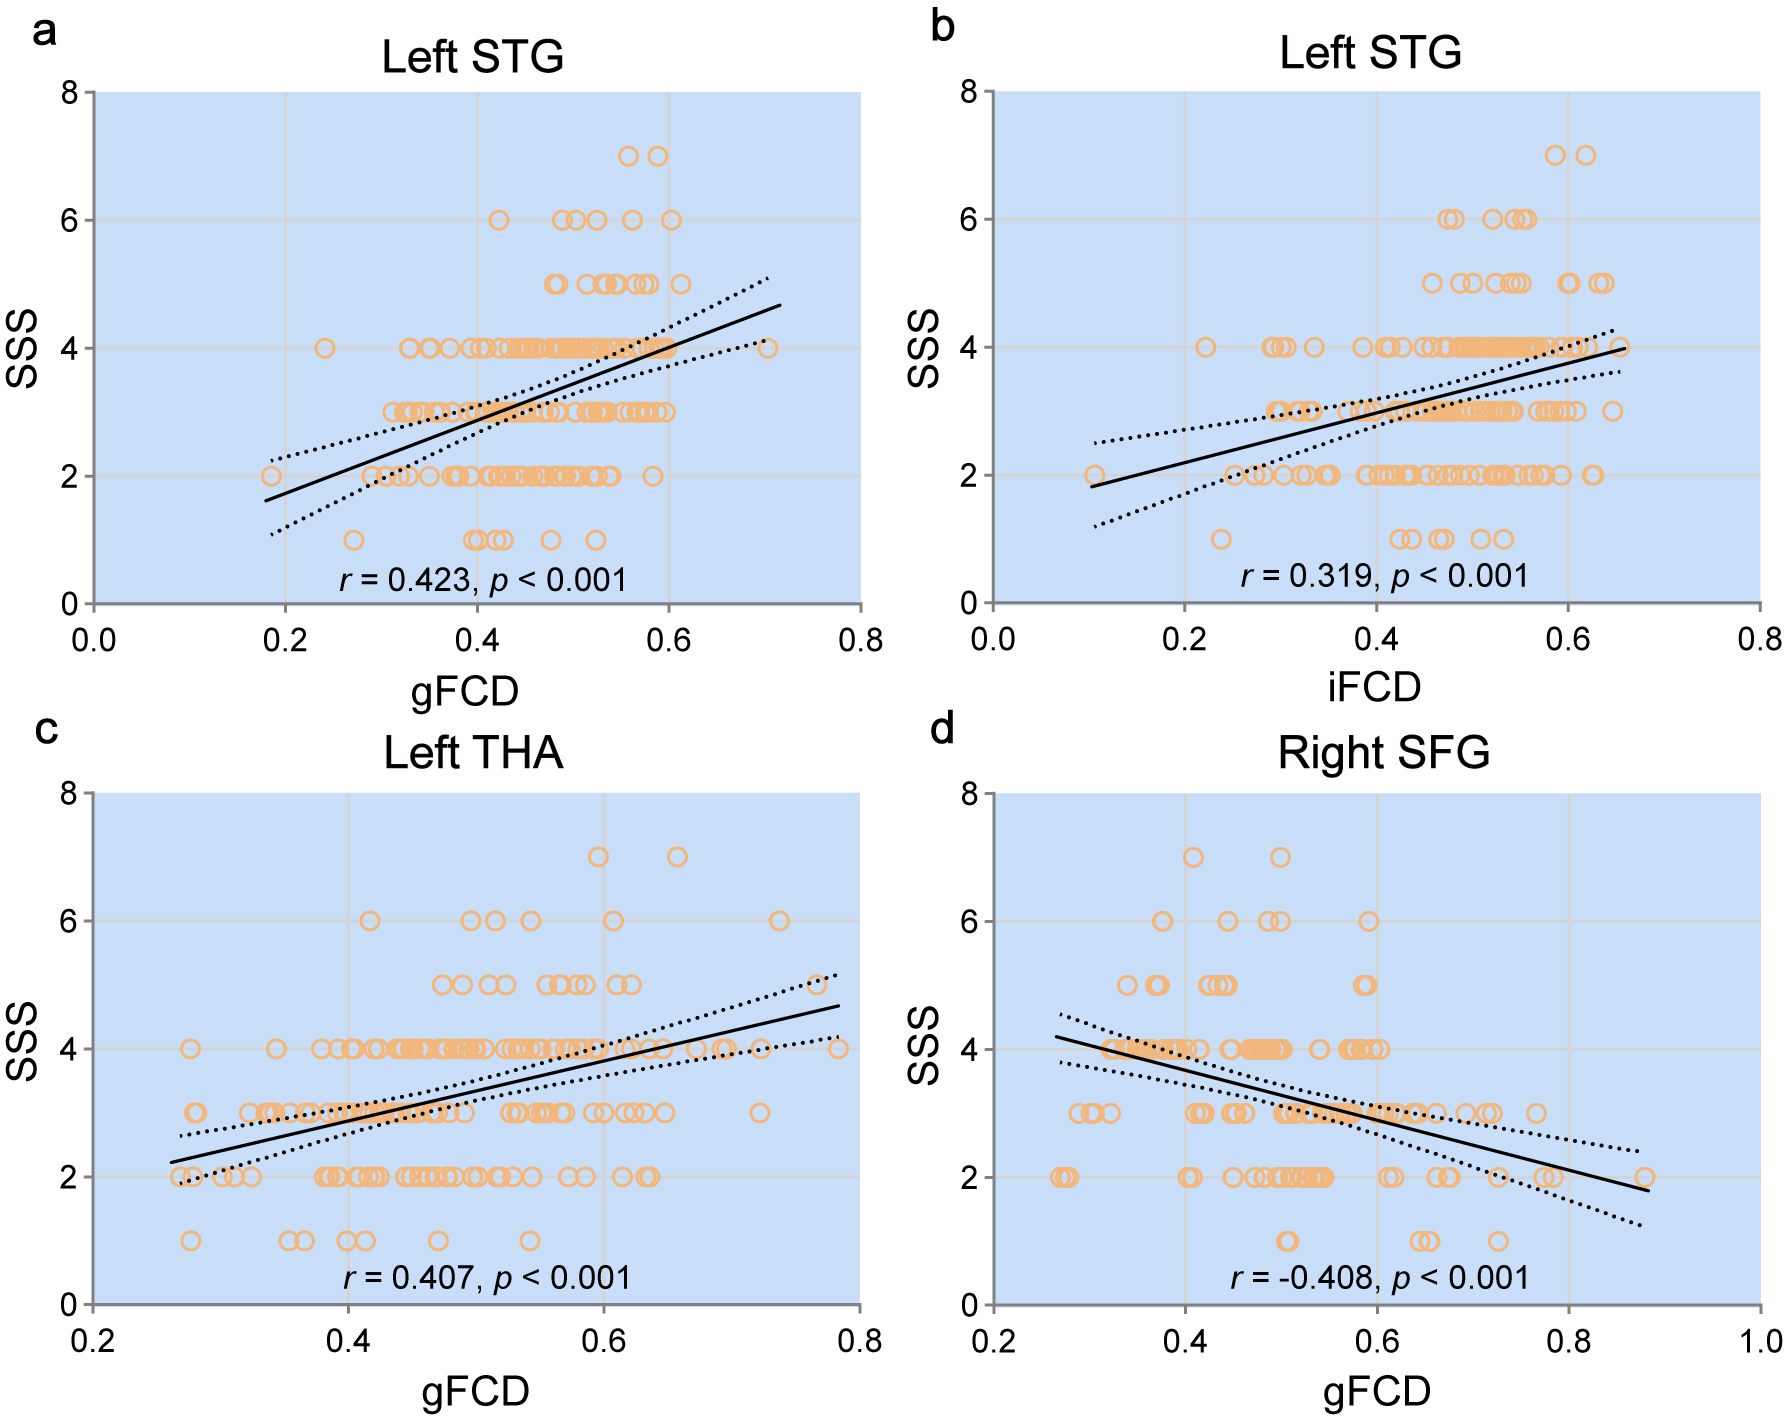 Fig. 3.
This figure displays the Pearson correlation analysis between Stanford Sleepiness Scale (SSS) scores and functional connectivity density (FCD) values in selected brain regions. Significant positive correlations were found in the left superior temporal gyrus (a,b) and left thalamus (c), while a negative correlation was found in the right superior frontal gyrus (d). The strength and significance of each correlation are noted.
To reveal detailed dynamic changes in these regions, the gFCD/iFCD values for each region and session were extracted and are displayed in Fig. 4. The gFCD values in the left superior temporal gyrus and left thalamus, as well as the iFCD values in the left superior temporal gyrus, gradually increased across the five sessions, while the iFCD values in the right superior frontal gyrus gradually decreased.
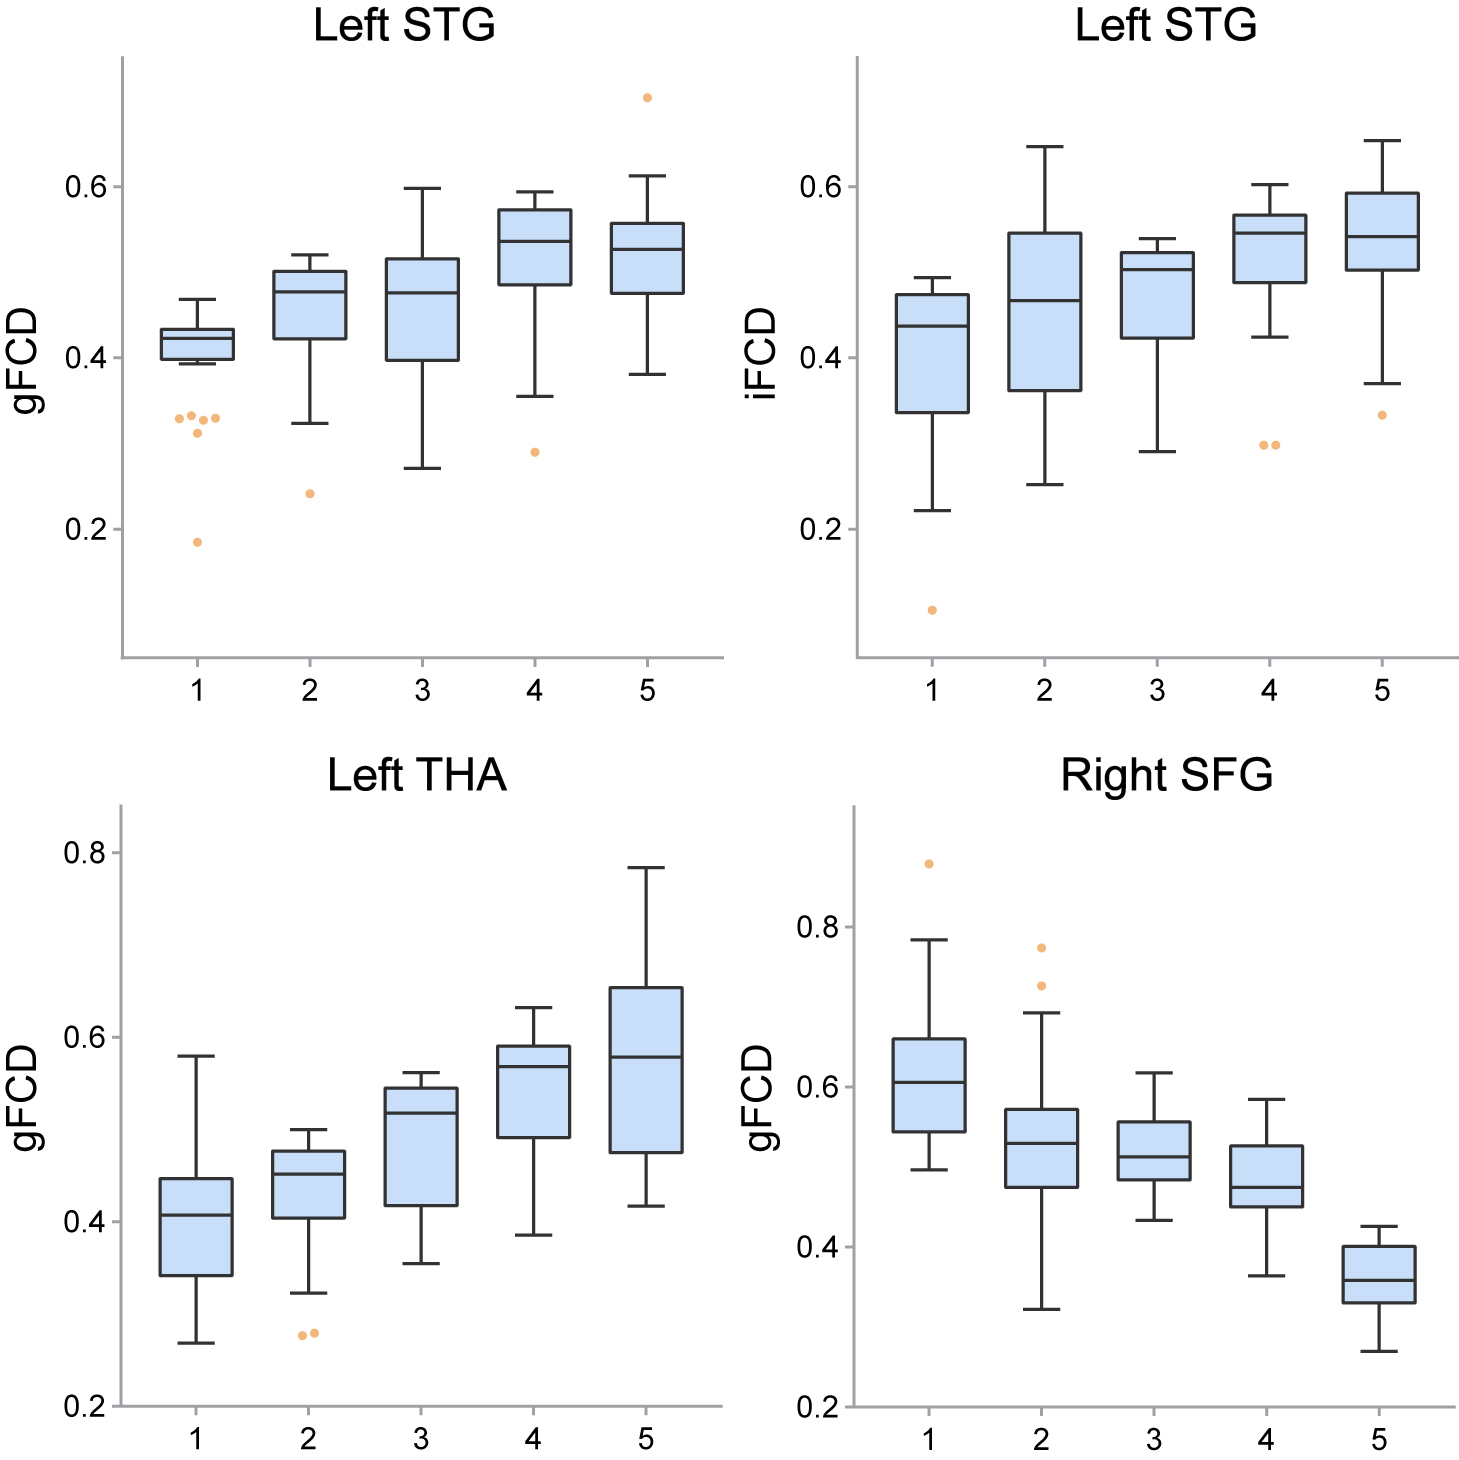 Fig. 4.
This figure shows the dynamic pattern of FCD alterations during sleep deprivation. The gFCD and iFCD in the left superior temporal gyrus and the gFCD in the left thalamus gradually increased, while the gFCD in the right superior frontal gyrus gradually decreased.
In this investigation, five time points (10.00 PM, 12.00 PM, 2.00 AM, 4.00 AM, and 6.00 AM) were selected to dynamically observe changes in brain connectivity using the iFCD. This dynamic research method using multiple time points allowed observation not only of the influence of SD on brain function but also of dynamic shifts in brain activity in relation to sleep pressure and circadian rhythm variation. This approach provides a more comprehensive picture than that given by prior studies that only compared pre- and post-SD states. Our results revealed significant differences in FCD among the frontal, parietal, and temporal lobes, as well as the subcortical thalamus and cingulate. Additionally, the FCD values in these brain regions exhibited a gradually increasing or decreasing trend. Notably, as sleepiness increased over the five sessions the gFCD/iFCD values within the left superior temporal gyrus and the gFCD values within the left thalamus also increased, while the iFCD in the right superior frontal gyrus gradually decreased. The identification of abnormalities in these brain regions could be important for guiding clinical interventions; for example, they may aid target identification in non-invasive stimulation treatments.
In our investigation, we identified significant alterations in global and local functional connectivity, predominantly within the middle/superior temporal gyrus and the medial prefrontal cortex. These core regions of the DMN play pivotal roles in an array of behavioral, cognitive, and physiological activities. We noted a progressive increase in gFCD/iFCD values in the left middle temporal gyrus as sleep deprivation advanced. This uptick in activity within the DMN suggests it could be instrumental in the initiation of drowsiness. Past research, utilizing methodologies like independent component analysis and seed-based correlation analysis, has revealed irregular functional connections within the DMN and between the DMN and other cerebral networks [23]. Building on our prior findings, we observed that during the slowest 20% of reactions in psychomotor vigilance tasks, there was a linear escalation in task-related activation within the DMN [24]. The confluence of these observations underscores the hypothesis that heightened activity in the DMN might be the neural underpinning for the inattention and propensity for mind-wandering exhibited during prolonged wakefulness. Further, these discoveries, set within the broader landscape of DMN research, emphasize the essential role of sleep in modulating this pivotal network and its broader implications for cognitive health and attentional capacities.
In this study, low gFCD/iFCD values were also found in the superior frontal gyrus and superior parietal gyrus, which together comprise the FPN. Functional connectivity in the right superior parietal gyrus decreased linearly during SD, indicating that high-order FPN activities were heavily influenced by circadian rhythms and sleep pressure. Numerous neuroimaging studies have detected abnormal functional activity in the FPN after SD compared with that seen after normal sleep. Drummond et al. [25] observed that the degree of activation within the prefrontal cortex, parietal lobe, and premotor cortex decreased significantly after SD. Similarly, our previous positron emission tomography study revealed that glucose metabolism within the prefrontal cortex, parietal lobe, and thalamus dropped significantly after SD [26]. Moreover, our recent studies indicated that the FPN plays an essential role in maintaining cognitive stability; SD-resistant individuals showed more efficient information transmission than SD-vulnerable individuals [27].
The thalamus, strategically positioned within the central nervous system, is pivotal in governing the transmission of awakening signals from the brain stem and acts as a linchpin in maintaining the arousal state of an organism [28]. It’s no surprise that a multitude of studies spanning disciplines, from physiology to genetics, have highlighted the thalamus’s multifaceted roles in regulating consciousness, orchestrating both sleep and wake states [29]. Our central observation during sleep deprivation concerns the left Mediodorsal Thalamus (MD thalamus). The intricate connectivity of the MD thalamus with the prefrontal cortex is key to various cognitive functions, ranging from attention to executive decision-making. Under sleep deprivation, these connections could be disrupted, potentially leading to observed cognitive deficits, such as reduced attention and executive function capabilities.
The implication of sleep deprivation on the thalamus is profound. An unstable state of thalamic activity might be incited by sleep deprivation. Enhanced thalamic activity ensures effective transmission of ascending arousal signals from the brain stem to the DMN and FPN networks, preserving their intrinsic antagonistic dynamics [30]. Conversely, a decline in this activity could intercept these arousal signals within the thalamus itself, thereby upsetting the equilibrium between the default and attention networks. However, our study ascertained that thalamic activity consistently augmented during SD. Such a surge in activity may symbolize a compensatory mechanism, striving to counteract sleep deprivation’s adverse impacts, and thus aiding individuals in preserving normal behavior and performance. In summary, our results accentuate the quintessential role of the thalamus, especially the MD thalamus, in upholding wakefulness during episodes of sleep deprivation.
This study had several limitations. A notable limitation of our study pertains to the determination of sample size. The chosen sample size was guided by practical considerations, previous literature, and the feasibility within the study’s timeframe. We did not conduct a formal power analysis or sample size calculation due to the exploratory nature of our research and the lack of specific prior data on which to base such calculations. This omission could influence the robustness and generalizability of our findings, and future studies with larger, predetermined sample sizes based on power analyses might provide more conclusive insights. Second, the participants were primarily local university students aged 19–26 years; therefore; they may not be representative of the general population. Third, despite collecting both heart and breathing rate data during the MRI scans to verify wakefulness, we cannot guarantee the absence of microsleeps or short sleep periods. Future studies should monitor participants’ sleep more accurately using MRI-compatible electroencephalogram (EEG) devices. While our study provides insights into the neural connectivity alterations during sleep deprivation, the fourth limitation is the absence of direct measures of arousal, which could have played a contributory role in the observed functional connectivity changes. Finally, numerous factors, such as age, gender, work and rest patterns, physical fitness, mental state, and the surrounding environment can influence the sleep state. The reliability of the current results needs to be verified by large, multicenter studies.
In this investigation, we applied fMRI combined with FCD metrics to understand the neural impact of SD with a particular focus on the DMN, FPN, and thalamus. Our findings indicated that SD contributes to heightened functional activities in the DMN and thalamus. In contrast, there was a noticeable decrease in the activity within the FPN. These observed functional changes in key brain areas correlated significantly with reported increases in sleepiness, as determined by the SSS. The progressive enhancement in the functional activities of the DMN and the thalamus, juxtaposed with the decline in the FPN, emphasizes the pivotal role these regions play during SD. Understanding these neural dynamics is essential for devising future clinical interventions to address the adverse cognitive and behavioral outcomes of SD.
The datasets used and/or analyzed during the current study are available from the corresponding author upon reasonable request.
YJC, JMZ and YQZ designed the study. PT, YL, SNW and MG collected the data. XLW, BH and FHJ analyzed the data. XLW, BH and SNW drafted the manuscript. JMZ and YJC edited and approved the manuscript. All authors contributed to editorial changes in the manuscript. All authors read and approved the final manuscript. All authors have participated sufficiently in the work and agreed to be accountable for all aspects of the work.
This investigation was performed in accordance with the Declaration of Helsinki and was approved by the Ethical Committee of the Institute of Xijing Hospital (Approval No.: KY20183005-1). All participants involved in the study have signed the informed consent form, adhering to the ethical guidelines.
We thank Liwen Bianji (Edanz) (https://www.liwenbianji.cn) for editing the language of a draft of this manuscript.
This study has received funding by the Key R&D Program Projects of Shaanxi, China (2022JM-575 and 2021SF-287), Fast Response Program of Air Force Medical University (2023KXKT050), Boost Program of Xijing Hospital (JSYXM28, JSYXZ08 and XJZT21CM21), China Postdoctoral Science Foundation (2019M653963), and Military Medical Science and Technology Youth Training Program (20QNPY049).
The authors declare no conflict of interest.
Publisher’s Note: IMR Press stays neutral with regard to jurisdictional claims in published maps and institutional affiliations.