
- Academic Editor
†These authors contributed equally.
Purpose: White matter hyperintensity (WMH) is suggested to cause stroke
and dementia in older adults. Retinal structural thicknesses revealed by optical
coherence tomography (OCT) are associated with structural changes in the brain.
We aimed to explore the association between the peripapillary retinal nerve fiber
layer (RNFL) and cerebral microstructural changes in participants with white
matter hyperintensities (WMH). Methods: Seventy-four participants (37
controls, healthy control (HC), and 37 older adults with WMH) underwent retinal
and brain imaging using OCT and magnetic resonance
imaging (MRI) respectively. Peripapillary RNFL thickness was assessed by the OCT.
Gray matter volume (GMV) was assessed from a T1-weighted MRI. White matter
integrity was assessed with diffusion tensor imaging (DTI) while WMH severity was
assessed with the Fazekas scale. All participants underwent a
neuropsychological examination (Mini-Mental State Examination, MMSE).
Results: Older adults with WMH showed thinner peripapillary RNFL
(p = 0.004) thickness when compared with the control group after
adjusting for age, hypertension and gender. In our older adults with WMH, RNFL
thickness correlated with fractional anisotropy (FA) in the superior longitudinal
fasciculus (SLF) (Rho = –0.331, p
White matter hyperintensity (WMH) of presumed vascular origin is a major cause of stroke and dementia in the aging population [1, 2], however, its underlying mechanism remains unclear and treatments are limited. Recent reports [1, 3] suggested that WMH is associated with cerebral vascular impairment. WMH is a feature of cerebral small vessel disease (SVD) and is common in older adults. WMH can be seen on magnetic resonance imaging (MRI) scans as hyperintense on T2-weighted scans.
The retina and the brain share many features such as embryologic origin, precise neuronal cell layers, blood barriers, and microvasculature [4]. As opposed to the brain, the retina is directly visible using standard ophthalmology tools. Since the retina is visible and shares a similar neurobiology with the brain, it can be used to develop a point-of-care test that can detect disease-related biomarkers at an early stage. It has been reported that subtle alterations in the retina may reflect the pathological changes of the brain during a disease cascade [5]. The retinal nerve fiber layer (RNFL) has been reported to be a useful structural biomarker for neurodegeneration in the eye [6]. Optical imaging modalities such as spectral-domain optical coherence tomography (SD-OCT) provide a non-invasive in vivo visualization and quantification of the RNFL thickness.
Previous reports have shown significant macula thinning in patients with WMH [7], dementia [8], and mild cognitive impairment when compared with healthy controls. A previous report with a large sample size showed that thinning of the RNFL is associated with a higher risk of increasing dementia and proposed that alterations in the RNFL may be a structural biomarker for dementia [9, 10, 11, 12]. Ong et al. [13] recruited elderly adults without dementia and found an association between the changes in the RNFL thickness and changes in the mediotemporal lobe volumes. Cerebral imaging modalities such as diffusion tensor imaging (DTI) has been reported to be a good imaging technique for the evaluation of white matter integrity of the brain [14, 15]; it is also sensitive to global age-related changes that occur in the brain and may be useful in the retinal changes as well.
Here, we investigated the associations between retinal thickness measured using OCT and microstructural volume measures from brain MRI and DTI measurements of white matter microstructural integrity in older adults with WMH.
Older adults who were
Older adults (
This study was approved by the Ethics Committee of the Second Affiliated Hospital and Yuying Children’s Hospital of Wenzhou Medical University (Ethics Approval No. 10 [2017], Clinical Science Review) and all participants gave written informed consent. All procedures in this study followed the Declaration of Helsinki.
Clinical information such as hypertension, diabetes mellitus, hyperlipidemia, smoking, and alcohol were recorded. Resting blood pressure measurements were also done for all participants. All participants underwent neuropsychological tests before MR imaging and OCT imaging. Mini-Mental State Examination, which is a dementia screening tool with a total score of 30; a higher score represents better cognition.
Full details of the brain imaging scanning protocol have been published [16]. Briefly, a Siemens 3 Tesla Trio MRI scanner (Signa HDxt GE Healthcare, Milwaukee, WI, USA) equipped with a 32-channel head coil was used for all imaging; a standardized protocol was used in all patients including Tl-weighted images, T2-weighted images, and fluidattenuated inversion recocery (FLAIR) imaging. WMH was evaluated on FLAIR images using the Fazekas scale [17]. WMH severity was rated (0–3) separately for deep and periventricular regions of the brain, with the sum of the scores representing the total WMH burden as shown in Fig. 1.
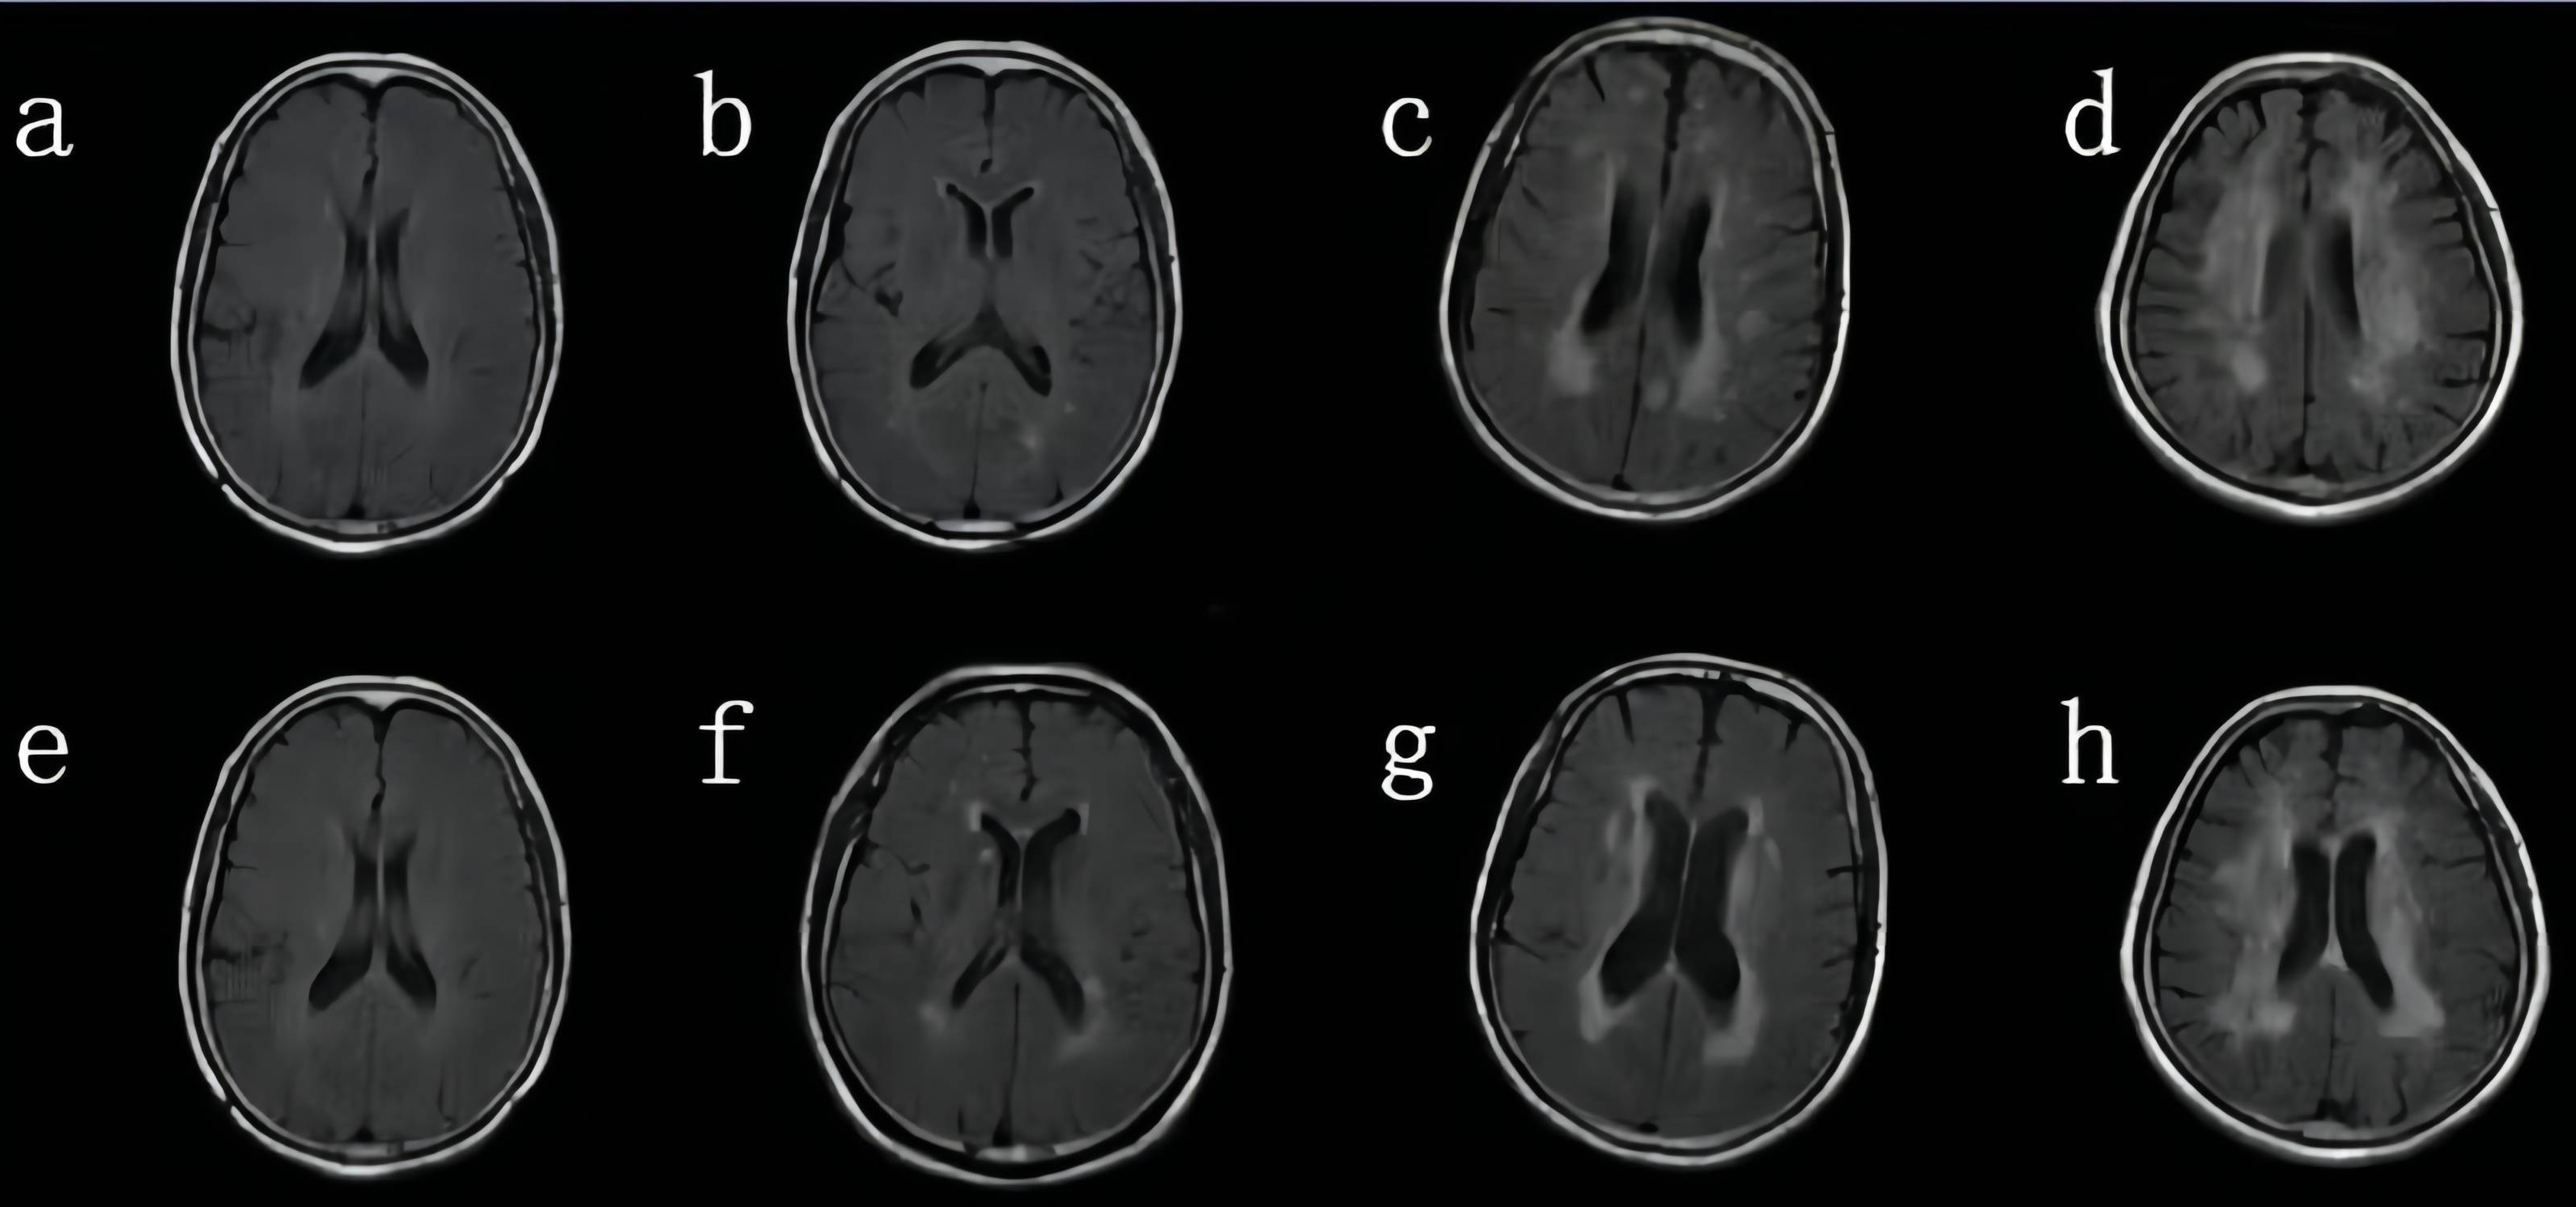 Fig. 1.
Visual rating of white matter hyperintensities (WMH) using the Fazekas scale. (a–d) Subcortical deep white matter hyperintensity—0 score: no lesion (a); 1 score: punctate lesion (b); 2 scores: lesion fusion (c); 3 scores: large area fusion of lesion (d); (e–h) paraventricular WMH—0 score: no lesion (e); 1 score: pencil or false thin layer lesion (f); 2 scores: smooth halo (g). 3 scores: irregular paraventricular high signal intensity extending to the deep white matter (h); the lesion scores of the two sites were added (minimum 0 scores, maximum 6 scores).
Image processing for calculating brain gray matter volume based on voxel-based
morphometry (VBM). The voxel-based morphological determination is carried out by
using the FSL-VBM software package (Analysis Group, FMRIB, Oxford, UK), and
all imaging images are processed in the default standard mode as follows: (1) The
graphic format is changed by MRICRO software (https://www.nitrc.org/projects/mricron/, Analysis Group, FMRIB, Oxford,
UK) to convert the digital imaging and communications in medicine (DICOM) data of
3DT1 images into NII format, so that they can be recognized and processed by fmrib software library (FSL),
and the tissues with artifacts are removed manually. (2) Use the brain extraction
(BET) toolkit of FSL software to remove the skull of all
the included brain magnetic resonance images, and manually screen the processed
images. If they do not reach the standard, adjust the corresponding parameters in
the BET software (Analysis Group, FMRIB, Oxford, UK), and repeat the above
steps until the ideal image is obtained. (3) Using the fully automatic
recognition and cutting tool tissue type segmentation (FAST4) in FSL, the image
obtained in step 2 is segmented and divided into gray matter, cerebrospinal
fluid, white matter and other tissues. Using linear registration (FLIRT) tool (Analysis Group, FMRIB,
Oxford, UK), the recognized gray matter image and its mirror data are
registered to the standard Montreal Neurological Institute (MNI) template of FSL,
and the gray matter image and mirror image registered to the standard template
are automatically synthesized into a 4D image. A template based on this study
[spatial resolution (2
Diffusion imaging was used to assess white matter integrity in our study
participants. Image analysis is carried out by the process of tract-based spatial
statistics (TBSS) in FSL software. Data were inspected for movement artifacts
using FSL-MCFLIRT (https://fsl.fmrib.ox.ac.uk/fsl/fslwiki/MCFLIRT) (
VBM and TBSS are both whole-brain comparisons. We locate gray matter differential brain regions based on the anatomical automatic labeling 3 (AAL3) brain template [19]. We position white matter fiber bundles based on the international consortium for brain mapping-diffusion tensor imaging (ICBM-DTI-81) white-matter labels atlas (https://cmrm.med.jhmi.edu/) [20]. We then extracted signals from different brain regions for further analysis. During processing, the average map is produced to register into a standard MNI152 space.
Participants also underwent fundus and optic disc imaging using fundus photography. Abnormalities of the optic disc and macular were defined as present if any of the following were detected: retinal and/or optic nerve head hemorrhage, soft and hard exudates, retinal and/or optic disc edema, papilledema and optic disc atrophy. If a participant presented with any of these abnormalities, the participant was excluded from our study.
The Avanti RTVue-XR (software version 2017.100.0.1, Optovue, Fremont, CA, USA) was used to image the retinal structure for all participants. The imaging tool has a scan speed of 100 KHz, a wavelength of 840 nm with a tuning range of 100 nm. The image resolution was 5.3 mm axially and 18 mm laterally. In our study, the mean peripapillary retinal nerve fiber layer (RNFL) was automatically generated by the optical coherence tomography (OCT) tool. The RNFL thickness was acquired using the optic nerve head (ONH) map protocol, with a scanning range covering a diameter of 3.45 mm centered on the optic disc as shown in Fig. 2. OCT images with ophthalmic disorders such as age-macular degeneration, severe cataracts, optic neuritis, diabetic retinopathy, glaucoma, and optic neuritis were excluded. If a participant presented with any of these disorders in one eye, the other eye was used; if both eyes had the disorders aforementioned, the participant was excluded from the study. OCT images with a signal quality of less than 7 were excluded from our study. OCT data displayed in our study followed the OSCAR-IB quality criteria [21] and the Advised Protocol for OCT Study Terminology and Elements (APOSTEL) recommendation [22].
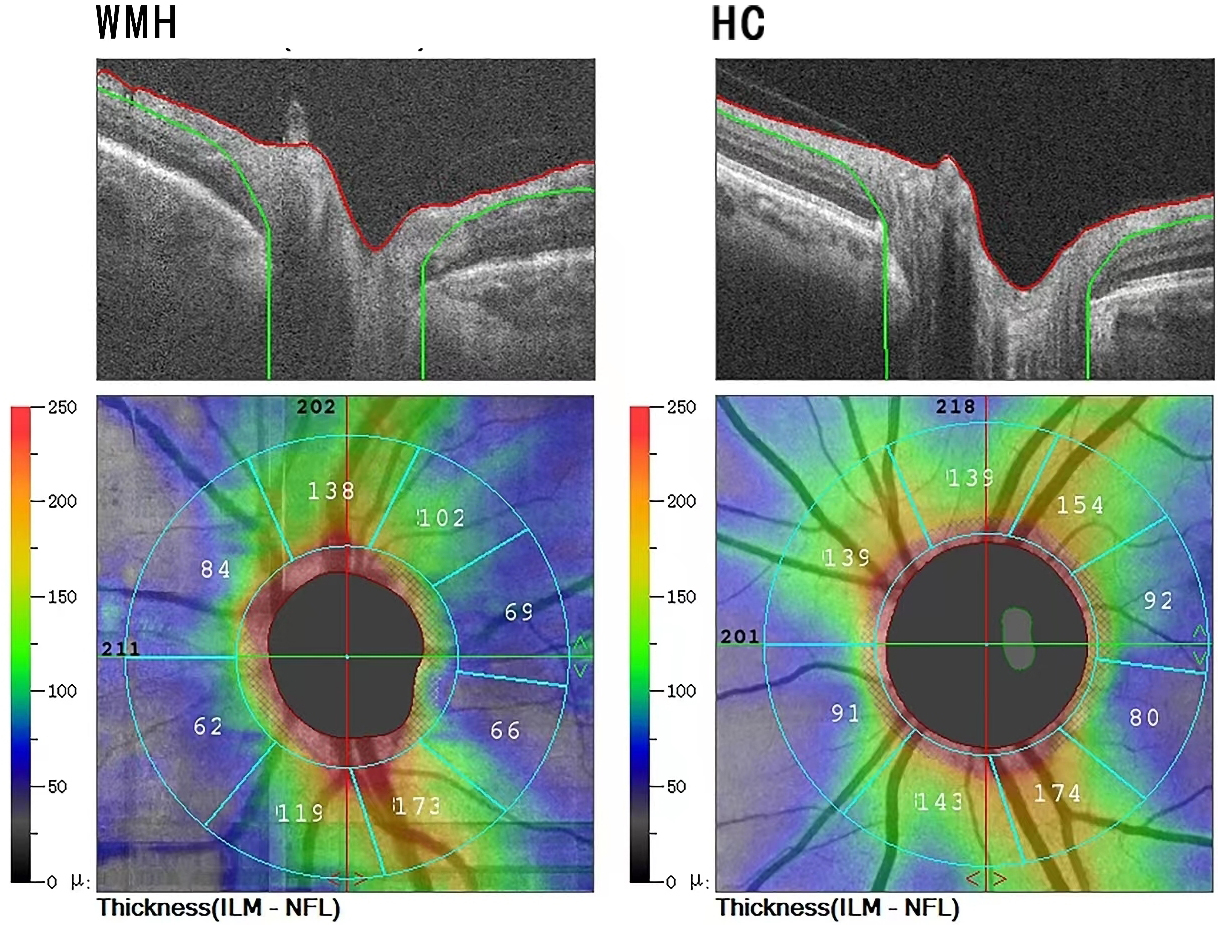 Fig. 2.
Segmentation of optical coherence tomography (OCT) images. The upper row represents the Spectral domain optical coherence tomography (SD-OCT) tomographic images; the system automatically recognizes the peripapillary retinal nerve fiber layer (pRNFL) and calculates its thickness, using color to represent the thickness, cool color (green) represents thinner pRNFL thickness, and warm color (red) represents thicker thickness. The lower row represents the retina SD-OCT image; The retina SD-OCT image is automatically extracted to calculate the pRNFL thickness. The left is the representative picture of the WMH group, and the right is the healthy control group (HC). ILM-NFL, Inner limiting membrane-Nerve fiber layer.
The normality of data was done by visual inspection of the distribution and Kolmogorov-Smirnov test. Consecutive variables with normal distribution were expressed as mean and standard deviation (SD). Categorical variables are presented as frequencies and percentages (%).
Non-parametric statistical analyses “Randomize” were used to compare
differences in grey matter volume between the two groups. Multiple comparisons
correction was performed using threshold-free cluster enhancement (TFCE) option
with 5000 permutations. p
Using tract-based spatial statistics tools, a voxel-wise spatial statistical
analysis comparing both groups was performed using a ‘randomized’ program within
FSL, which involves permutation testing [18]. The mean FA skeleton was used as a
mask (threshold at a mean FA value of 0.2), and the number of permutations was
set to 5000. Thresholding was performed using threshold-free cluster enhancement,
a new method for finding significant clusters in MRI data without having to
define them as binary units [23]. Clusters were assessed for multiple comparisons
using the family-wise error rate (p
An eye of each participant was included in the data analyses. In cases where both eyes met the criteria, the eye was selected according to the higher signal strength index of the macular in the OCT-A imaging; when the signal strength index (SSI) of OCT-A images was the same in both eyes, the quality of ONH images was decisive. Multiple linear regression models using generalized estimation equations (GEE) were done to analyze changes that occur in WMH and healthy control (HC) and associations between the RNFL and cerebral parameters. The models were adjusted for signal strength index (SSI), age, hypertension, eye used (whether left or right), and sex. p values less than 0.05 were considered statistically significant. All statistical analyses were performed using SPSS version 21 (IBM Corp., Armonk, NY, USA).
We identified 43 older adults with WMH and 45 older adults without WMH as
controls. Participants were excluded because of either poor MRI scans, macular
pathologic findings, or poor-quality OCT scans as shown in Supplementary
Fig. 1. Table 1 displays the characteristics of our study participants.
Thirty-seven WMH participants (mean age = 66.19 years) and 37 controls (mean age
= 64.91 years) were included in the data analyses. Significant changes
(p
| WMH | Controls | p value | |
| (n = 37) | (n = 37) | ||
| Gender, males | 22 (59.5%) | 24 (64.8%) | 0.716 |
| Age, years | 66.19 |
64.91 |
0.358 |
| Education, years | 7.01 |
7.95 |
0.855 |
| Smokers, n (%) | 12 (32.4%) | 14 (37.8%) | 0.377 |
| Drinkers, n (%) | 5 (13.5%) | 6 (16.2%) | 0.821 |
| Hypertension, n (%) | 12 (32.4%) | 10 (27.0%) | 0.376 |
| Diabetes mellitus, n (%) | 3 (8.10%) | 2 (5.40%) | 0.887 |
| BMI, kg/m |
23.94 |
22.58 |
0.812 |
| SBP, mmHg | 135.51 |
133.41 |
0.849 |
| DBP, mmHg | 78.75 |
76.54 |
0.784 |
| MAP, mmHg | 95.12 |
94.32 |
0.910 |
| Fazekas score | 3.70 |
1.0 |
|
| MMSE score | 21.09 |
26.30 |
|
| HbAlc, % | 6.61 |
6.01 |
0.901 |
| TG, mmol/L | 1.42 |
1.20 |
0.090 |
| TC, mmol/L | 4.81 |
4.25 |
0.558 |
| LDL-c, mmol/L | 2.65 |
2.22 |
0.685 |
| HDL-c, mmol/L | 1.42 |
1.56 |
0.758 |
| Hcy, µmol/L | 12.33 |
10.08 |
0.772 |
| Scr, µmol/L | 77.25 |
82.45 |
0.651 |
| SE, D | 0.53 |
0.63 |
0.950 |
| IOP, mmHg | 12.51 |
11.64 |
0.782 |
| BCVA | 0.97 |
1.04 |
0.071 |
| AL, mm | 23.38 |
22.98 |
0.985 |
| pRNFL, µm | 110.0 |
116.92 |
0.004* |
BMI, body mass index; SBP, systolic blood pressure; DBP, diastolic blood pressure; MAP, mean arterial pressure; MMSE, Mini-Mental State Examination; HbA1c, hemoglobin A1c; TG, triglycerides; TC, total cholesterol; LDL-c, low-density lipoprotein cholesterol; HDL-c, high-density lipoprotein cholesterol; Hcy, homocysteine; Scr, serum creatinine; SE, spherical error; IOP, intraocular pressure; BCVA, best corrected visual acuity; AL, axial length; pRNFL, peripapillary retinal nerve fiber layer.
*p value was adjusted for age, gender, hypertension, signal quality of retinal image and eye used.
Table 2 and Fig. 3 show the comparison of cerebral microstructural volume
between the groups. Older adults with WMH showed significantly reduced gray
matter volume (GMV) in the left frontal inferior orbital gyrus (p =
0.014), left superior temporal gyrus (p = 0.04), left frontal middle
orbital gyrus (p = 0.013), left cerebellum (p
| Region | Ba | Cluster size, mm |
MNI coordinates | ||
| x | y | z | |||
| L frontal inferior orbital gyrus | 47 | 116 | –38 | 34 | –6 |
| L superior temporal gyrus | 48 | 135 | –48 | –36 | 24 |
| L frontal middle orbital gyrus | 11 | 242 | –32 | 38 | –20 |
| L cerebellum | 295 | –22 | –58 | –62 | |
| L inferior temporal gyrus | 20 | 4509 | –46 | 2 | –38 |
MNI, Montreal Neurological Institute; Ba, Brodmann area; GMV, gray matter volume.
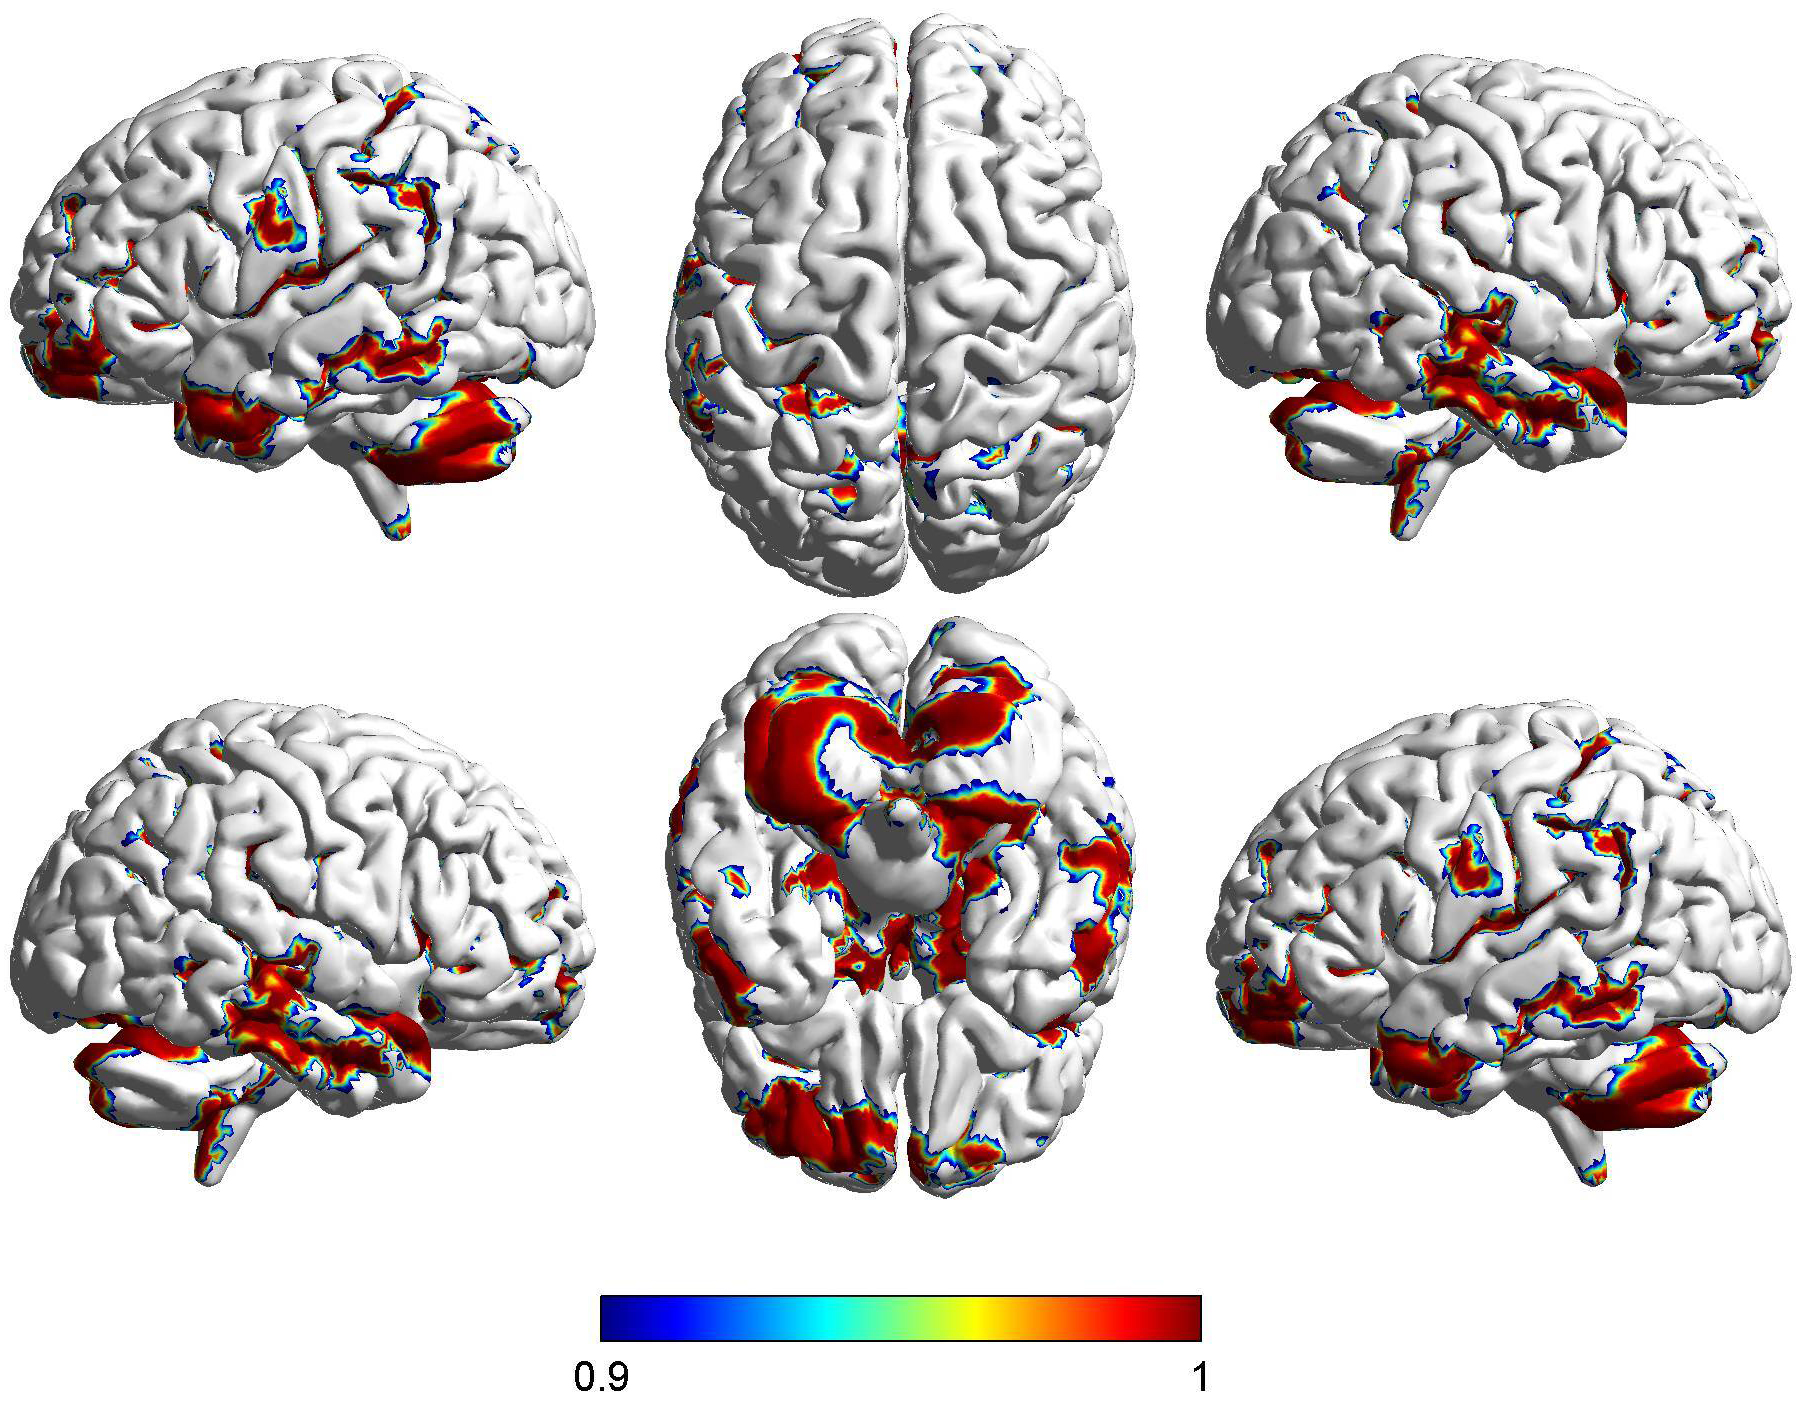 Fig. 3.
Difference in cortical volume between WMH and healthy controls.
FSL-voxel-based morphometry (VBM) showed brain regions with differences in
cortical volume in the WMH group compared with the control group, which was
demonstrated by the Montreal Institute of Neurology model. The cortical volume of
WMH group became smaller, which was indicated by red. The brain regions that show
differences in cortical volume between the WMH group and the control group are as
follows: left frontal inferior orbital gyrus, left superior temporal gyrus, left
frontal middle orbital gyrus, left cerebellum, left inferior temporal gyrus. The
value of the colour bar indicates 1-P. The red colour indicates the direction in
which the difference between the two groups is large, while the blue colour
indicates the direction in which the difference between the two groups is
relatively small. p
Compared to the control group, older adults with WMH had lower FA in the
superior longitudinal fasciculus (SLF) (p = 0.027) and splenium of
corpus callosum (p
| Region | Region size (voxels) | MNI coordinates | ||
| x | y | z | ||
| Superior longitudinal fasciculus | 29 | –38 | –25 | 45 |
| Splenium of corpus callosum | 98 | 14 | –46 | 10 |
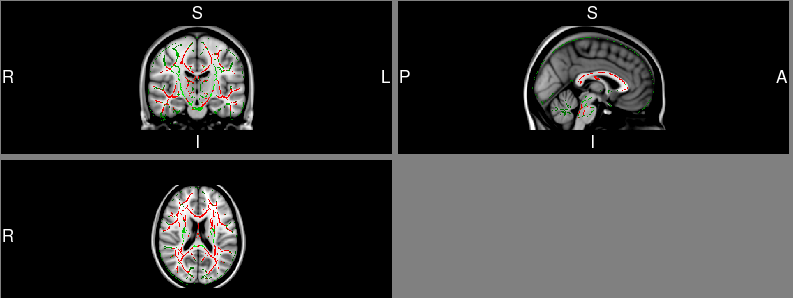 Fig. 4.
Difference in fractional anisotropy (FA) values between WMH and
healthy controls. WMH participants shown significantly reduced FA values in
superior longitudinal fasciculus (SLF), and splenium of corpus callosum when
compared to healthy control (HCs). Green is the standard whole-brain fibre
skeleton, and red indicates fibre bundles that are significantly different
between the two groups. p
In older adults with WMH, RNFL thickness correlated with GMV in the left frontal inferior orbital gyrus (Rho = –0.506, p = 0.002) and left frontal middle orbital gyrus (Rho = –0.424, p = 0.010).
In our older adults with WMH, RNFL thickness correlated with FA changes in the
SLF (Rho = –0.331, p
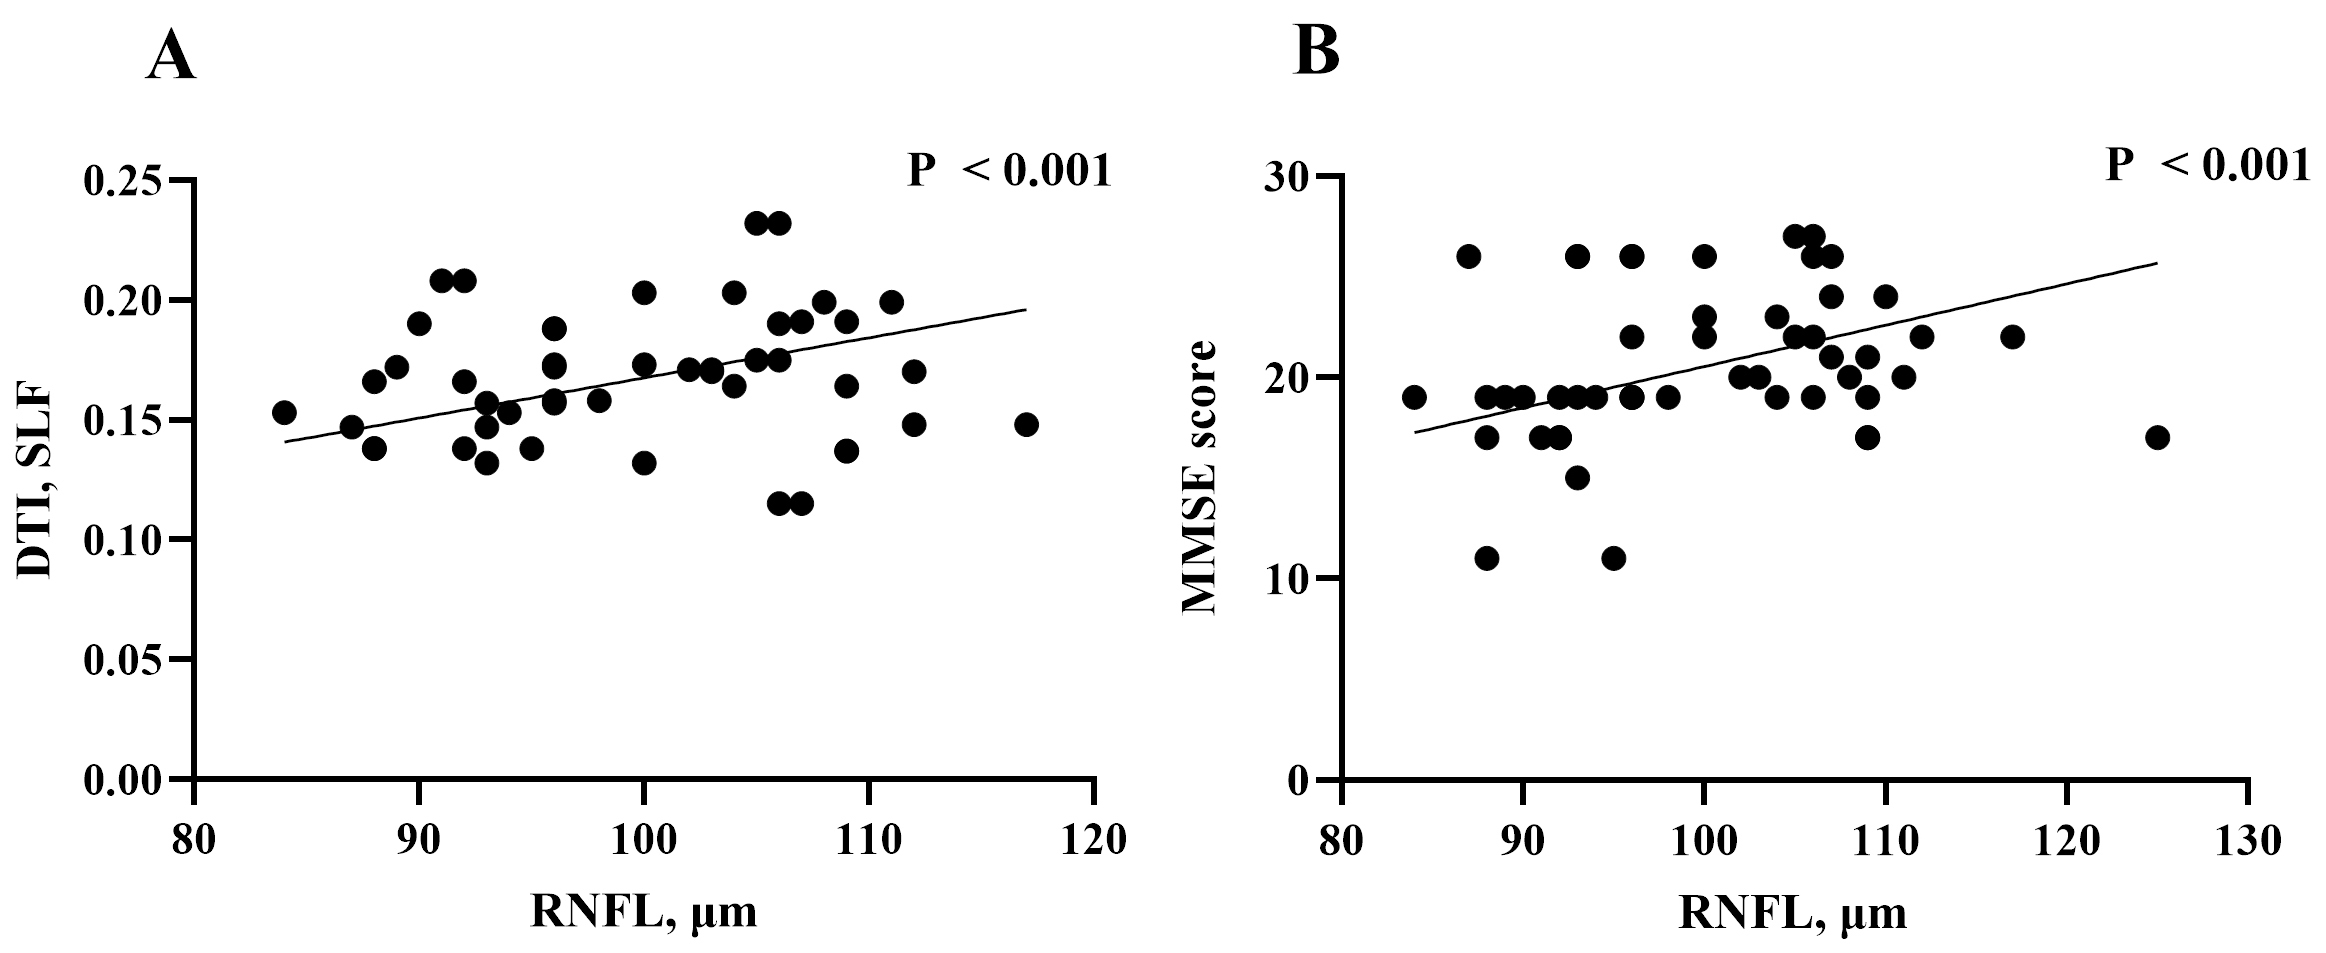 Fig. 5.
The relationship of DTI variables, clinical parameters and RNFL thinkness in WMH participants. (A) Correlation of retinal nerve fiber layer (RNFL) thickness and DTI variables in WMH participants. (B) Correlation of RNFL thickness and clinical parameters in WMH participants.
In older adults with WMH, RNFL was significantly associated with MMSE scores
(Rho = 0.422, p
This observational study demonstrates that thinner RNFL thickness in older adults with WMH was associated with reduced GMV and FA parameters. We also showed that thinner RNFL thickness in older adults with WMH correlated with increased Fazekas scores and lower montreal cognitive assessment (MoCA) scores.
Previous studies [12, 16, 24, 25] showed WMH participants have thinner RNFL thickness compared to controls and suggested that the thinning of the RNFL may be due to transneuronal retrograde degeneration. Here we showed the peripapillary RNFL thickness was thinner in older adults with WMH when compared to controls. The peripapillary RNFL is located around the optic nerve head and is mainly composed of ganglion cell axons [5, 13]. Besides, it is suggested that this retinal parameter is sensitive to white matter microstructural changes in the brain [5, 26]. Here, we suggest that changes in the peripapillary RNFL may reflect the axonal damage (neurodegeneration) occurring in the brain.
Accumulating studies [26, 27, 28] have shown that retinal structural changes are associated with white matter microstructural changes, yet how these structural changes are related to other brain parameters is underexplored. We showed that in older adults with WMH, the GMV of the left superior temporal gyrus and inferior temporal gyrus was reduced when compared with the control group. The Wernick area is behind the left superior temporal gyrus and is responsible for language understanding. These structural changes may be the anatomical basis of cognitive function changes in patients with WMH. Besides, we showed that the GMV in the left cerebellum of the WMH group was reduced when compared to the control group. The cerebellum is an important regulatory center of movement, with a large number of incoming and outgoing connections. Also, it plays an important role in maintaining body balance receives information from the vestibular organs, and changes the tension of muscles in different parts of the body through outgoing connections, so that the body maintains a balanced posture during acceleration or rotation under the action of gravity. Importantly, it plays an important role in vision. Thus, any damage to this structure can lead to damage to the sensory system and gait disturbances, as previously reported [29, 30]. Here we suggest that these GMV differences seen between older adults with WMH and controls may reflect the widespread degeneration.
We also showed GMV was lower in the left frontal inferior orbital gyrus and left frontal middle orbital gyrus of older adults with WMH when compared with the control group; moreover, an association was shown between the RNFL thickness and the left frontal inferior orbital gyrus and left frontal middle orbital gyrus respectively in older adults with WMH. The left frontal inferior orbital and left frontal middle orbital gyrus are part of the orbitofrontal cortex, which sits above the orbits. The orbitofrontal cortex has extensive connections with sensory areas as well as limbic system structures involved in emotion and memory. A previous report [31] showed that cerebral small vessel disease patients with gait impairments have significantly reduced orbitofrontal cortical thickness. Our current report suggests that changes in the orbitofrontal cortex occur during the subclinical phase of neurodegenerative disease; the association between these cerebral structures and the RNFL suggests that changes in these cerebral structures may reflect the changes in the eye echoing the association between the brain and the eye.
Reduced FA occurs in WMH and indicates sub-visible alterations in the axonal integrity, fiber density, or myelin structure [32]. Here we found that thinner peripapillary RNFL thickness in older adults with WMH was associated with sub-visible white matter damage (reduced FA in the superior longitudinal fasciculus and splenium of corpus callosum) in keeping with increased demyelination and axonal loss [33, 34]. It will be important to assess whether early retinal structural changes can predict WMH progression and white matter damage in the long term.
WMH is a common characteristic of SVD on brain MRI. Previous studies used the Fazekas score to represent WMH severity and showed retinal structural thicknesses correlated with increased Fazekas score [12, 16]. Here, worse WMH scores (assessed by visual rating) correlated with thinner peripapillary RNFL thickness in older adults with WMH.
Pivotal methodologies for diagnosis of cognitive functioning are based on neuropsychological assessments such as mini-mental state examination scores (MMSE) [35]. In our current study, we found a significant association between the MMSE score and the RNFL which is congruent with previous reports [11, 27]. An association between the RNFL and MMSE scores suggests that the neurodegeneration associated with the WMH causes neuro-axonal damage resulting in the decline of cognitive functioning.
An important aspect of this study was a comprehensive brain imaging protocol that produced key metrics about the brain. We would like to acknowledge some limitations in our study. To begin with, the observational cross-sectional design of our study confines us to draw assumptions about the cause and effect; longitudinal studies with larger sample sizes are needed to investigate more on our current study and validate our hypotheses. As with most diagnostic tests, patient cooperation is an obligation. Head and/or eye movement from the participant can diminish the quality of the image and some participants were excluded from the study because of eye movement during the examination as such some images were excluded due to poor imaging which may introduce bias. This is important in clinical studies that are more likely exhibit movement compromising the quality of the data. Before actual scanning, study participants can be trained on a mock scanner to mitigate this issue. Movement can also be accounted for in the analysis phase. There are several pitfalls to TBSS, including the inability to correct misalignment and a lack of sensitivity and specificity. As in most previous studies, differences in white matter were observed in the corpus callosum and other large matter pathways. DTI has problems with kissing and crossing fibers. In neural areas with multiple fiber paths crossing, this model has difficulty modeling them accurately. Consideration should be given to techniques more robust to such intersection such as high angular diffusion magnetic imaging (HARDI) or diffusion spectral imaging (DSI). Another limitation of our study is the lack of evaluation of other layers of the retina structures; however, we used the OCT machine to evaluate the peripapillary RNFL. Reports with a segmentation algorithm of the retina are needed to elucidate the association between the macular thickness and cerebral metrics.
In conclusion, we showed neurodegeneration of peripapillary RNFL changes in older adults with WMH were associated with cerebral microstructural volume, impaired cerebral axonal damage, and cognitive performances. Our current report suggests that OCT measures hold promise to reflect neurodegenerative processes in WMH that may subsequently progress to a clinically apparent phase.
The datasets used and analyzed during the current study are available from the corresponding author on reasonable request.
ZH, YW and JY designed the research study. YW and JY performed the research. ZH and YC provided help and advice on resources and data interpretation. YW, JY, LX, CX, MZ, ZZ, YL and XL analyzed the data. YW and JY wrote the manuscript. All authors contributed to editorial changes in the manuscript. All authors read and approved the final manuscript. All authors have participated sufficiently in the work and agreed to be accountable for all aspects of the work.
The studies involving human participants were approved by the Ethics Committee of the Second Affiliated Hospital and Yuying Children’s Hospital of Wenzhou Medical University (Ethics Approval No. 10 [2017], Clinical Science Review) and written informed consent was obtained from each participant. All subjects were treated following the tenets of the Declaration of Helsinki.
Not applicable.
This study was funded by Clinical Scientific Research Fund of the Second Affiliated Hospital of Wenzhou Medical University [SAHoWMU-CR2017-01-212], the National Natural Science Foundation of China (Grant no. 82271344, 81771267).
The authors declare no conflict of interest.
Publisher’s Note: IMR Press stays neutral with regard to jurisdictional claims in published maps and institutional affiliations.