
- Academic Editor
Background: Electroencephalography (EEG) stands as a pivotal non-invasive tool, capturing brain signals with millisecond precision and enabling real-time monitoring of individuals’ mental states. Using appropriate biomarkers extracted from these EEG signals and presenting them back in a neurofeedback loop offers a unique avenue for promoting neural compensation mechanisms. This approach empowers individuals to skillfully modulate their brain activity. Recent years have witnessed the identification of neural biomarkers associated with aging, underscoring the potential of neuromodulation to regulate brain activity in the elderly. Methods and Objectives: Within the framework of an EEG-based brain-computer interface, this study focused on three neural biomarkers that may be disturbed in the aging brain: Peak Alpha Frequency, Gamma-band synchronization, and Theta/Beta ratio. The primary objectives were twofold: (1) to investigate whether elderly individuals with subjective memory complaints can learn to modulate their brain activity, through EEG-neurofeedback training, in a rigorously designed double-blind, placebo-controlled study; and (2) to explore potential cognitive enhancements resulting from this neuromodulation. Results: A significant self-modulation of the Gamma-band synchronization biomarker, critical for numerous higher cognitive functions and known to decline with age, and even more in Alzheimer’s disease (AD), was exclusively observed in the group undergoing EEG-neurofeedback training. This effect starkly contrasted with subjects receiving sham feedback. While this neuromodulation did not directly impact cognitive abilities, as assessed by pre- versus post-training neuropsychological tests, the high baseline cognitive performance of all subjects at study entry likely contributed to this result. Conclusion: The findings of this double-blind study align with a key criterion for successful neuromodulation, highlighting the significant potential of Gamma-band synchronization in such a process. This important outcome encourages further exploration of EEG-neurofeedback on this specific neural biomarker as a promising intervention to counter the cognitive decline that often accompanies brain aging and, eventually, to modify the progression of AD.
Lifespan is increasing worldwide, giving rise to new medical and socio-economic challenges. In this respect, developing strategies for promoting successful aging has become a cornerstone of cognitive neuroscience research.
Cognitive difficulties occur with aging, even in the absence of brain disease. For instance, it is frequent that healthy elderly subjects present everyday memory complaints, such as forgetting where they put their glasses or keys, which likely involves poor encoding and/or retrieval processes linked to reduced attentional resources that mainly depend on the prefrontal cortex [1, 2, 3]. This is important because it suggests that developing strategies for improving attention in the elderly may be beneficial for healthy aging.
Neurofeedback is one such promising strategy, relying on a training approach to achieve conscious self-modulation of specific brain waves on the basis of real-time feedback [4, 5, 6, 7]. For example, neurofeedback training, through electroencephalography (EEG) passive Brain-Computer Interfaces (BCI), has been found to improve attention in the elderly when focused on the Peak Alpha Frequency (PAF) — a neural biomarker of aging [8, 9, 10]. Notably, it is well documented that the PAF (i.e., the frequency of the spectral power density peak within the extended alpha band, 8–13 Hz) increases from early childhood until adolescence, remains stable during adulthood, and starts to decrease with age [1, 2, 11]. In patients suffering from either mild cognitive impairment [12] or Alzheimer’s disease (AD) [8], the PAF becomes pathologically lower than expected for healthy elderly subjects. Several positive correlations between PAF and speed of information processing, PAF and memory performance, PAF and inhibitory control have been reported [13, 14]. Another neural biomarker of aging is the synchronization of neural activity in the gamma frequency band, which decreases with age, and even more in patients suffering from AD [15]. Specifically, Gamma-band synchronization has been associated with multiple cognitive functions according to its role in neural systems for attention, memory, motivation, and behavioral control [16]. Additional biomarkers that may be disturbed in the aging brain include decreased EEG complexity, as well as an increased power of EEG low frequencies (i.e., delta and theta rhythms) together with a decreased power of high EEG frequencies (i.e., alpha, beta, and gamma rhythms) [17, 18, 19]. In particular, Theta/Beta ratio (TBR) has been claimed as a potential biomarker of attention control [20], and has also proved useful for detecting underlying cognitive impairments [21, 22, 23, 24].
The efficacy of EEG-neurofeedback can be measured based on cognitive outcomes [1, 2, 25, 26], but a prominent and more direct first outcome changes is at the level of brain activity itself [27]. Indeed, it is hypothesized that EEG-neurofeedback could activate self-regulatory responses which, in turn, would lead to the normalization of abnormal neural patterns. However, the lack of appropriate double-blind protocols has thrown some doubt on the efficacy of neurofeedback interventions [28].
This work presents a double-blind study conducted following a placebo-controlled approach on a sample of healthy elderly subjects with subjective memory complaints. Our primary goal was to investigate whether these subjects could use EEG-neurofeedback to modulate three EEG biomarkers that are often linked to impaired neuronal activities in the aging brain, namely PAF, Gamma-band synchronization, and TBR. More precisely, we aimed at studying the changes in neuronal dynamics of these EEG biomarkers, pre- versus post-neurofeedback training, in order to explore their potential for self-modulation of brain activity by elderly subjects. Of note, with the purpose of developing a friendly-use and affordable BCI system, this exploratory study was implemented on the basis of a multi-session neurofeedback training protocol employing a relatively limited number of electrodes. We investigated the feasibility of EEG-neurofeedback within this constrained framework.
To carry out this double-blind study, 37 subjects were recruited at the Institut de la Mémoire et de la Maladie d’Alzheimer (IM2A), in the Salpêtrière hospital (Paris, France). The study was approved by the ethical committee for the Protection of Persons of Ile-de-France XI and performed in accordance with the Declaration of Helsinki (the approval number: 2017-A02610-53). All subjects gave written informed consent prior to the experiments.
Participants were cognitively healthy subjects aged over 55, with a Mini-Mental
State Examination (MMSE; [29]) score
In this double-blind, placebo-controlled study, subjects were randomly assigned either to a real EEG-neurofeedback group (referred to as Group A) or to a sham feedback group (referred to as Group B), stratified by age, gender, and education level. The sham feedback was based on an electromyography biofeedback. The allocation of subjects to each of these two groups was performed by one of the collaborators not involved in the experiments, and remained hidden from the investigators until the end of the data analysis.
Fig. 1 displays a schematic representation of the study based on the timeline of the experimental protocol. The subjects were asked to participate in a research, neuromodulation protocol, over a three-month period (for each subject), during which they completed 22 visits: one pre-training visit (V0), 20 training visits (V1 to V20), and one post-training visit (V21). Neuropsychological and EEG data analyses performed in this work exploited the data collected during the pre- and post-training visits (V0 and V21) in order to investigate potential changes in the neural dynamics before and after training, as well as their possible impact on subjects’ cognition.
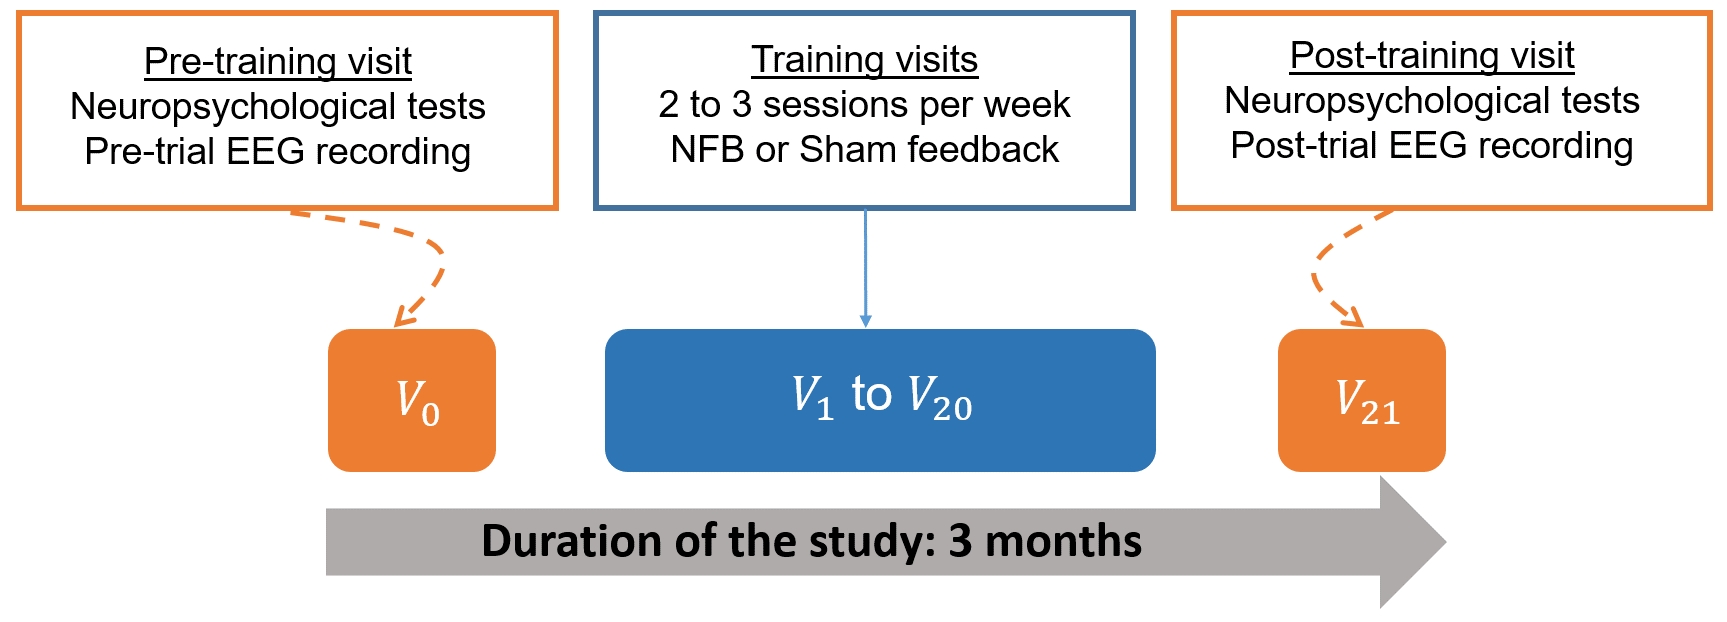 Fig. 1.
Schematic representation of the experimental protocol. NFB, neurofeedback; EEG, electroencephalography.
The battery of neuropsychological tests administered to subjects in V0 and V21, included the MMSE [29] that is a measure of global cognition, the FCSRT [30], a memory test that controls attention and cognitive processing to better investigate episodic memory performance, as well as other tests focused on attention and executive functions [31], such as the Trail-Making Test A and B (TMT A and B; [32]), the Digit span forward and backward, and the Frontal Assessment Battery (FAB; [33]). Additional instruments included the 15-item version of the McNair Frequency of Forgetting Questionnaire [34], the Geriatric Depression Scale (GDS; [35]), and the State-Trait Anxiety Inventory (STAI A and B; [36]) for assessing, respectively, memory complaints, mood, and anxiety disturbances.
At V0, and upon completion of the neuropsychological tests, EEG data resting
state was acquired for 150 seconds: 75 seconds with eyes closed, and 75 seconds
with eyes open looking at a fixation cross on the screen. A similar EEG
acquisition was performed at V21, the post-training visit, for the subjects who
completed the full training protocol. For both sessions (V0 and V21), the same
EEG amplifier with the same recording parameters were used: a 20-electrodes cap
with a traditional 10–20 electrodes layout and a NIC® EEG
amplifier system (Neuroelectrics, Barcelona, Spain). The left earlobe electrode
was used as the EEG reference [37]. The impedance of all electrodes was kept
below 10 k
The training started up to seven days after the pre-training visit (V0). It was performed in three blocks of 10 minutes per biomarker (30 minutes per session) during 20 visits over three months.
In practical terms, when the subject arrived, he/she was invited to sit in front of a screen. For the first session, the investigator explained to the subject how the EEG is performed and how the feedback will appear on the screen. Then, the technician places the EEG system (Neuroelectrics, Barcelona, Spain) on the scalp and two electromyography (EMG) sensors on the trapezius muscles of each subject (from either the real or the sham feedback group). The feedback information was provided visually to each subject as a picture of a tree on her/his computer screen (see Fig. 2 ). There were three different tree models: for each session, a different tree was assigned randomly to each biomarker. Subjects were only instructed to concentrate in order to make the tree grow. All subjects were asked to make the tree grow the same way; however, the feedback presented to subjects of Group A was based on their brain dynamics, while the feedback presented to subjects of Group B was based on their muscular activity. All precautions were taken to prevent the experimenters and subjects from identifying the task type (neurofeedback or shame/control). The task design was performed with the MATLAB Psychtoolbox (version 3, https://www.psychtoolbox.net/) [38], and the EEG synchronized and the stimuli presentation on the screen was performed with the System Level Simulations (SLS) library (https://fr.mathworks.com/matlabcentral/fileexchange/134292-wireless-system-level-simulations-sls-event-logger-) [39].
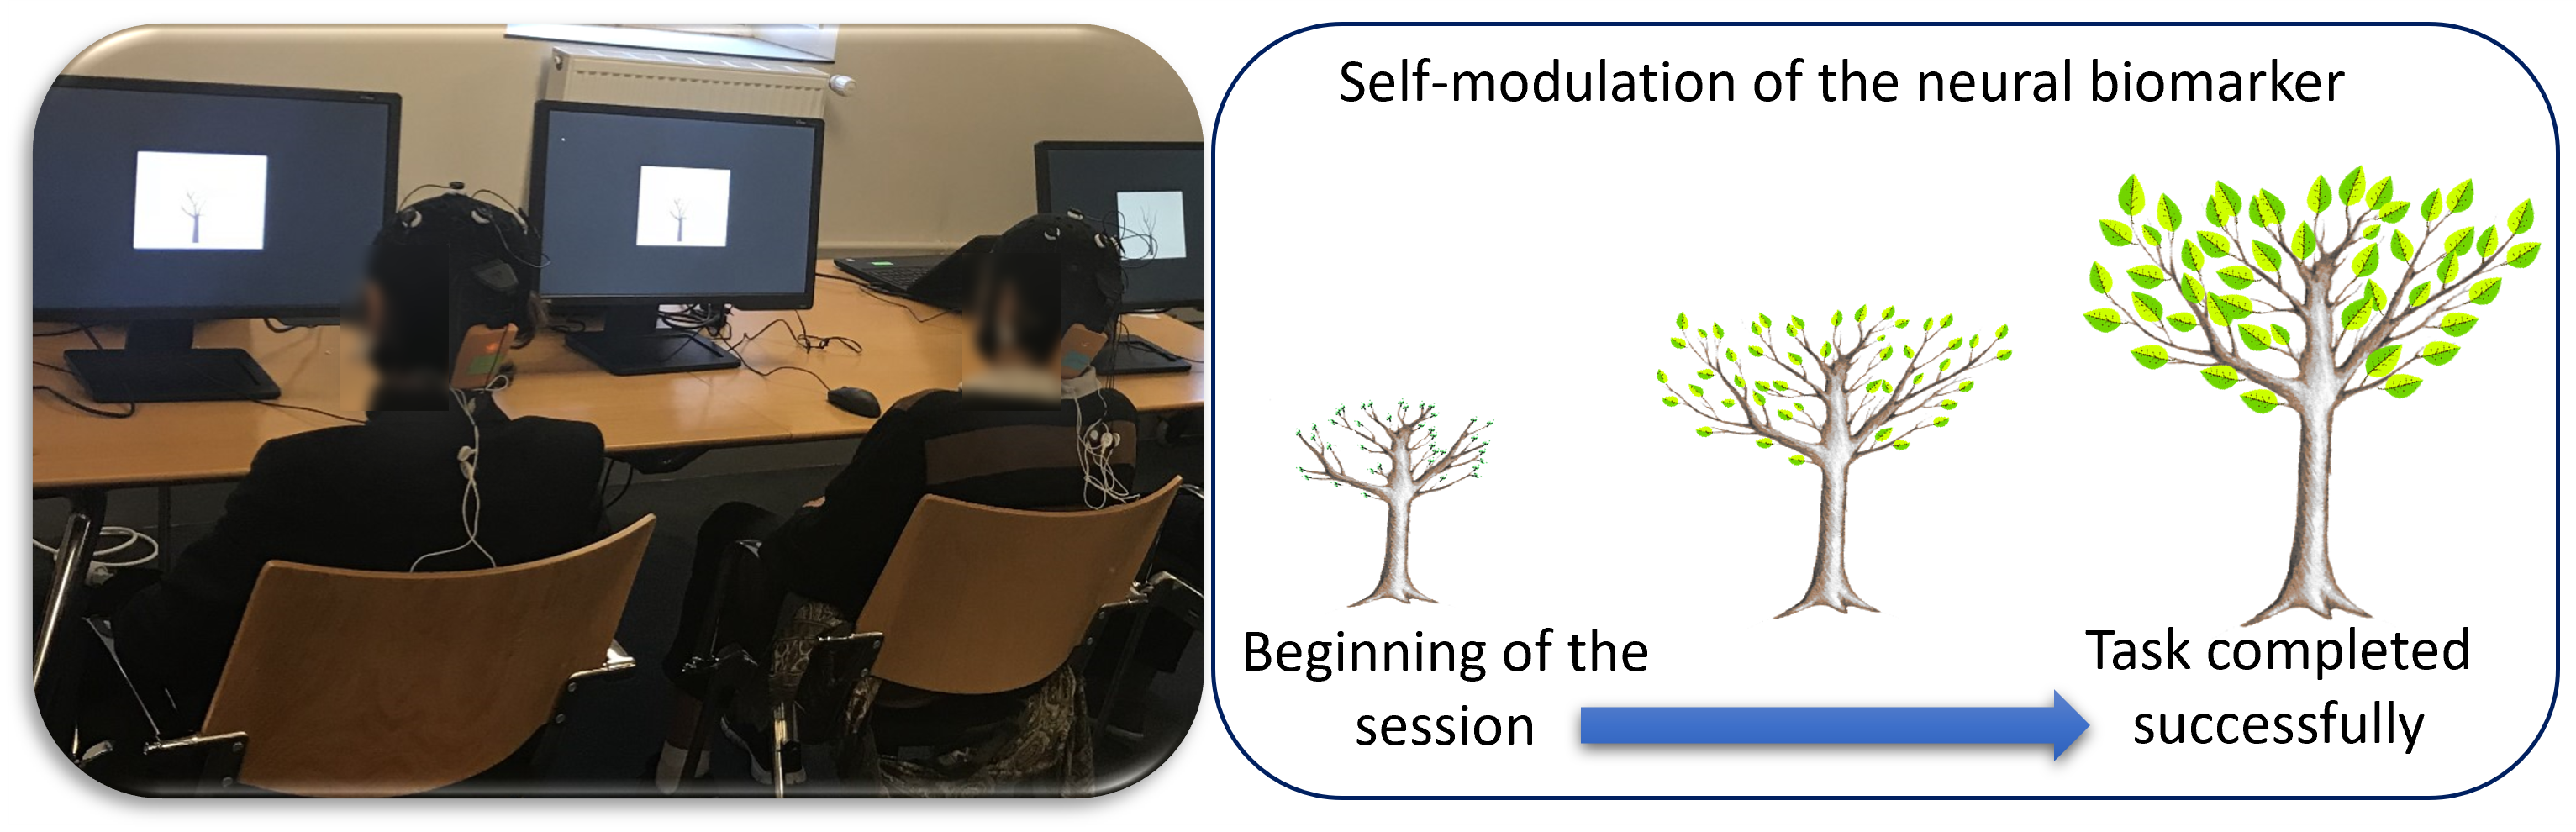 Fig. 2.
Brain-Computer Interface training. Left: Picture of two subjects during a session of the training phase. Right: The image of the feedback task is displayed on the screen.
At the beginning of each visit, one minute of the resting state EEG was recorded. These data were used to compute the threshold values of the subject’s biomarkers. During training, each biomarker was computed, in real-time, from the recorded signals. If the actual computed value of the biomarker was higher than the threshold, the tree grew up; otherwise, the tree size remained constant. The same protocol was followed for subjects submitted to sham feedback.
For neuromodulation, we built an EEG-neurofeedback BCI based on a small set of EEG electrodes. Indeed, as mentioned earlier in the introduction, our aim was to study the feasibility of EEG-neurofeedback in a constrained context with a limited number of electrodes for a low-cost and portable BCI. We considered five fronto-central and parieto-central electrodes: Fz, Cz, Pz, C3, C4. These electrodes were chosen based on experiments that we had carried out on an EEG database of 22 subjects with Subjective Cognitive Impairment (SCI) and 28 mild AD patients. EEG data were recorded during resting state eyes-closed condition, using a Deltamed digital EEG acquisition system (http://medicalsystems.ma/) with 30 scalp electrodes positioned over the whole head according to the 10–20 international system [19]. To discriminate between SCI and AD groups, we considered different combinations of a small number of electrodes among the 30 available, on which we computed an average Phase Synchrony measure [40] at different frequency bands. Then, such average synchrony value was used as input of a Linear Discriminant Analysis classifier to evaluate the discrimination performance in terms of specificity (SCI correctly classified) and sensitivity (AD correctly classified). The best performances (specificity = 81.8% and sensitivity = 71.4%) were obtained using EEG electrodes of fronto-central and parieto-central sites, namely Cz, Pz, Fz, C3, and C4.
Thirty-seven subjects were initially included and randomly assigned into two groups, called Group A and Group B for preserving the double-blind approach. Six subjects were desisted for personal and scheduling reasons at the beginning of the protocol, thus explaining the unbalanced number of subjects in the groups: 17 subjects in Group A and 14 subjects in Group B.
Neuropsychological and EEG data analyses were performed on the data collected in
pre- and post-training visits from the 31 subjects who completed the study. As
summarized in Table 1, a significant difference in terms of gender ratio was
observed between the two groups, with a more significant proportion of women in
Group A (p = 0.05, Fisher’s test), while no significant differences were
found between the groups for age and education level. Note that categorizations
of the education level into “high” and “low” or “intermediate” are as
indicated in [31]. In short, more than 80% of our participants had an education
level score
| Group A (n = 17) | Group B (n = 14) | p-value (Intergroup A vs B) | All (n = 31) | |
| Gender (M/F; % M, % F) | 4/13; 24% M, 76% F | 6/8; 43% M, 57% F | 0.05* | 10/21; 33% M, 67% F |
| Age: mean |
71 |
73 |
0.44 | 72 |
| Education level (% High) | 82% | 86% | 0.77 | 84% |
p-values were computed using a Wilcoxon-Mann-Whitney test for the numerical variables (Age) and Fisher’s exact test for categorical variables (Gender, Education level). Significant differences are indicated by an asterisk. SD, standard deviation; M, male; F, female.
Due to the high number of artifacts on eyes-open EEG recordings, the EEG analysis was performed only on the data collected from the eyes-closed condition [41], and considering only Fz, Cz, Pz, C3 and C4 electrodes, as explained in Section 2.2.3.
The pre-processing of the resting-state EEG signals was performed on MATLAB version 2016b (The MathWorks, Natick, MA, USA), using the Brainstorm software [42, 43] in combination with custom scripts developed internally within the MATLAB environment (MathWorks). The sampling rate of the data during the acquisition was 500 Hz, and no downsampling was applied in the pre-processing steps.
Data cleaning includes space separation to remove eye blink and saccade artifacts. Then, EEG signals were notch-filtered at 50 Hz to remove the power line noise and band-pass-filtered in the four frequency bands corresponding to theta [4–8 Hz], alpha [8–13 Hz], beta [13–25 Hz], and gamma [35–45 Hz] bands. The filtered data, which had a total duration of 75 seconds per acquisition and per subject, were segmented into 2-second epochs. All the epochs with a kurtosis below one or above five, or a peak-to-peak amplitude exceeding 100 µV, were considered rejected from the analysis. The remaining epochs were visually checked, and the bad segments were identified and rejected. The final number of epochs without artifacts per acquisition ranged from 32 to 37 for each subject. For the analysis, we kept the same amount of data from each subject, thus retaining 32 epochs of 2 seconds per subject.
Finally, values of the three biomarkers of interest were extracted from the pre-processed epochs at pre- and post-training visits, and considering only the five electrodes (Fz, Cz, Pz, C3, C4): (i) the PAF that measures the frequency with the highest magnitude within the alpha rhythm sub-band spectrum after estimating Welch’s Power Spectral Density (PSD), on 1 s-window with 25% overlapping; (ii) Gamma-band synchronization that relies on the computation of Phase Synchrony [40] between all pairs of EEG signals in gamma band; (iii) the TBR calculated by dividing average theta power by average beta power after a Welch’s PSD estimation on 1 s-window with 25% overlapping. More precisely, the PAF and TBR biomarkers were computed on each epoch from the signal captured by a single electrode; hence, five features were extracted per epoch from the PAF and five from the TBR. By contrast, Gamma-band synchronization requires two electrodes; 10 pairwise combinations of five electrodes exist, and ten features were computed from that biomarker. Therefore, for each subject, 20 features were extracted per epoch.
To assess the effectiveness of our EEG-neurofeedback framework, we adopted two statistical approaches for data analysis based on classical statistical tests and machine learning methods [44], as explained in the following sections.
Since most neuropsychological and EEG data were not found to be normally
distributed, non-parametric tests were performed in the analysis (for further
details, see section 3). All statistical analyses were conducted using R version
3.6.1 (R Development Core Team, 2019, https://www.r-project.org/), and plots were
generated with the ggplot2 package (https://cran.r-project.org/web/packages/ggplot2/index.html) [45]. The level of statistical significance
was set at p
To evaluate the effectiveness of EEG-neurofeedback training, we conducted both inter-group and intra-group data analyses. Therefore, four classifiers were designed for four different purposes: (i) discriminating subjects of Group A from subjects of Group B, using the EEG epochs recorded during V0 (inter-group analysis at V0); (ii) discriminating subjects of Group A from subjects of Group B, using the EEG epochs recorded during V21 (inter-group analysis at V21); (iii) discriminating epochs recorded from subjects of Group A during V0 from epochs recorded from the same subjects during V21 (intra-group analysis, V0 versus V21 within Group A); (iv) discriminating epochs recorded from subjects of Group B during V0 from epochs recorded from the same subjects during V21 (intra-group analysis, V0 versus V21 within Group B).
As above-mentioned, each subject (among the 31) has 32 epochs at session V0 and 32 epochs at session V21, all contributing to the data set available for classifier design. On each epoch, 20 features were extracted (five PAF values, five TBR values, and 10 Gamma-band synchrony values). To compute such features and train the classifiers, we used the SIGMABox (https://github.com/tmedani/SIGMAbox) [47], a homemade MATLAB toolbox for EEG signal processing and classification.
As all features may not be equally relevant for the classification, a subsequent feature selection procedure was applied to discard irrelevant features. The procedure has two steps: Orthogonal Forward Regression (OFR) for ranking the features in order of decreasing relevance, followed by the random probe method to find the threshold rank for rejecting irrelevant features [48]. The random probe method consists of generating random variables (called probes) by shuffling the components of the vectors of the candidate variables (corresponding to the real features), ranking the candidate variables and the probes in a single ranked list, and estimating the acceptable risk value that a random variable can explain the output process more reliably than one of the selected real features.
For inter-group analyses (classifiers (i) and (ii)), the number of epochs available for the design of the classifier was 32 epochs per subject, hence 992 examples were available for classifier design. For intra-group analyses, the number of epochs available for the design was 64 epochs per subject, as the epochs to be classified were recorded during V0 and V21, hence 1088 and 896 examples were available for classifiers (iii) and (iv), respectively. Table 2 summarizes the number of subjects and epochs.
| Training set (70%) | Test set (30%) | All data (100%) | ||
| Classifiers (i) and (ii) | Subjects | 22 | 9 | 31 |
| Epochs | 704 | 288 | 992 | |
| Classifiers (iii) | Subjects | 12 | 5 | 17 |
| Epochs | 768 | 320 | 1088 | |
| Classifiers (iv) | Subjects | 10 | 4 | 14 |
| Epochs | 640 | 256 | 896 |
The subjects of Group A and Group B were randomly assigned to the training set (70%) and the test set (30%). The four classifiers were designed to perform epoch-wise classification from the features; the classification of subjects was performed according to the following rule: a subject was assigned to the class to which the majority of his/her epochs (at least 17) had been assigned by the epoch-wise classifier.
We used Support Vector Machines (SVM) with linear soft-margin classifiers [44].
The estimation of the regularization constant of the SVM was performed by
leave-one-subject-out cross-validation. Due to the small size of the test set,
the estimation of the performance of the classifier may vary with the partition
of the examples into training set and test set. In order to decrease the variance
of that estimation, 100 different partitions of the complete data set were
performed, ascertaining that the number of inclusions Ni of each subject
i in the test set was such that 5
The results of the neuropsychological tests are detailed in the supplementary material (Supplementary Tables 1–3). Importantly, at study entry (V0), subjects’ performance across the entire battery of tests was within the normal range, and often close to the upper reference limit. Non-parametric tests were used (ɑ = 0.05) because the criteria of normality were not verified for all the data. Overall, we observed only one significant result for subjects’ performance on the TMT-A with an improvement between V0 and V21 for subjects of Group A and Group B together (p = 0.005), as well as for each group separately, being significant for Group A (p = 0.02) and a trend for Group B (p = 0.051). This suggests that subjects had a faster processing speed while performing this test at V21, regardless of the type of feedback training they received. Concerning the other neuropsychological tests, we did not observe any significant change between visits (V21 vs V0, intra-group analysis) nor between groups (Group A vs Group B, inter-group analysis) at V21, including also, in this case, the TMT-A test. In fact, rather than suggesting a specific effect of feedback training, the improvement observed in the TMT-A test at V21 (the post-training visit), points to a possible gain related to the previous exposure to this relatively simple attention test at V0, which is known as a practice effect. With regard to complaints about mood, anxiety, or memory, an absence of significant differences was also observed in the intra-group and inter-group analyses.
To investigate whether the two groups (A and B) were different regarding their EEG activity at V0 (before the 20 training sessions), Mann-Whitney non-parametric tests were applied on the 20 features extracted from the three biomarkers of interest. For each subject and each of the 20 features, a value was computed for each of the 32 epochs; then the mean of these 32 values was used as the biomarker associated to each subject. As shown in Supplementary Table 4, irrespective of the biomarker or the electrode, there were no significant differences between groups at V0. This confirms that Group A and Group B were not significantly different regarding the three biomarkers of interest at the beginning of the study.
Inter-group analysis was also performed at V21 to determine whether the 20
training sessions had a significantly different effect on the EEG dynamics of the
two groups (A vs B). Mann-Whitney non-parametric tests were applied on features
(same procedure as presented in the previous section). As shown in
Supplementary Table 5, we observed a significant difference between
groups regarding the Gamma-band synchronization for three pairs of electrodes:
Pz/C4, Pz/Fz, and C4/Fz, with greater values of gamma-synchrony for Group A. A
significant difference between groups was also found for this biomarker when
considering the mean over all electrodes (p
To investigate changes in brain dynamics between pre- and post-training sessions
(V0 vs V21), we compared, for each group, the feature values computed at both V0
and V21. Thus, Mann-Whitney non-parametric tests were applied separately for each
group (A and B), and each biomarker. As shown in Supplementary Table 6,
there were significant changes regarding the features computed for the Gamma-band
synchronization for both Group A and Group B. However, for Group B (sham
feedback), the difference was only observed in one pair of electrodes (Pz/Fz,
p
As described in Section 2.3.4, classifications were based on subjects’ epochs (epoch-wise classification). For inter-group comparison (Group A vs Group B, at V0 and V21 separately), a subject of the test set was considered as belonging to the group (A or B) to which more than 50% of her/his epochs were assigned. For intra-group comparison (V0 vs V21, Group A and Group B separately), the subject’s data of the test set was considered as belonging to the session (V0 or V21) to which more than 50% of her/his epochs were assigned.
We trained a SVM classifier to discriminate subjects of Group A from those of Group B based on their EEG data at V0. Using the three biomarkers, 20 features were extracted and the most relevant ones were selected with the OFR algorithm and the random probe, as explained in Section 2.3.4. A 20% risk of selecting a candidate variable although it is irrelevant turned out to be a reasonable choice, resulting in selecting seven features (among the 20). Table 3 shows that Gamma-band synchronization biomarker is predominant in the selected variables.
| Features | Electrodes | |
| 1 | Gamma band synchronization | C4/C3 |
| 2 | Gamma band synchronization | Pz/C3 |
| 3 | Theta/Beta ratio | Pz |
| 4 | Gamma band synchronization | Pz/C4 |
| 5 | Gamma band synchronization | Cz/Pz |
| 6 | Gamma band synchronization | Cz/C3 |
| 7 | Theta/Beta ratio | Cz |
OFR, Orthogonal Forward Regression.
These selected seven features were then used by the classifier for inter-group classification, to determine which epochs belonged to Group A or Group B. Table 4 reports the confusion matrix resulting from the cross-test procedure described in Section 2.3.4.
| Population (N = 31) | Group A | Group B |
| Group A (N = 17) | 9 | 8 |
| Group B (N = 14) | 6 | 8 |
The accuracy of the classifier estimated by cross-test was 54.8%. It is good practice to compare the results of a classifier to the results that would have been obtained by a baseline classifier (called “zero-classifier”), which assigns all examples to the most populated class (Group A in our case), irrespective of the features. If a classifier does not significantly outperform this baseline, it indicates a limitation in classification ability. In this instance, the accuracy of our classifier matches that of the “zero-classifier”, implying an inability to distinguish between the two groups based on the three selected biomarkers. This strongly suggests that the EEG biomarkers computed from both groups (A and B) were similar at V0 before training.
Here, the purpose of the classifier was to discriminate subjects of Group A from those of Group B based on their EEG data at V21. Interestingly, at V21, among the 20 features extracted from the three biomarkers, seven relevant features were also selected with the OFR algorithm and the random probe method, all belonged to the Gamma-band synchronization. Such selected features were then used as inputs to the SVM classifier.
As presented in the confusion matrix resulting from cross-test (Table 5), the SVM classifier was able to discriminate subjects from Group A and Group B with a global accuracy of 71.0%. As the obtained accuracy is greater than 54.8% (the “zero-classifier”, see section 3.3.1), this result strongly suggests that the selected Gamma-band synchronization features were able to distinguish, post-training, subjects of Group A (with real neurofeedback) from those of Group B (sham feedback).
| Population (N = 31) | Group A | Group B |
| Group A (N = 17) | 11 | 6 |
| Group B (N = 14) | 3 | 11 |
To validate the feature selection procedure performed by the random probe method, three classifiers (i.e., one classifier per biomarker) were designed to perform the same inter-group analysis at V21, without the application of feature selection.
As presented in Table 6, the classifier whose feature inputs were extracted from the Gamma-band synchronization had an accuracy of 71%, while the accuracy of the classifiers trained with features extracted from either the TBR or the PAF was 61.3% (estimated by cross-test).
| Classification based on each biomarker | Gamma-band synchronization | Theta/Beta ratio | Peak Alpha Frequency |
| Group A (n = 17) | 12/17 | 11/17 | 11/17 |
| Group B (n = 14) | 10/14 | 8/14 | 8/14 |
| Accuracy | 71% | 61.3% | 61.3% |
For more details, see supplementary material (Supplementary Tables 7–9).
These results confirm that Gamma-band synchronization biomarker is more pertinent for inter-group classification at V21 than the other two biomarkers. Interestingly, the accuracy of the classifier whose features were computed from the Gamma-band synchronization alone (see Table 6) considering all the 10 features, was equal to the accuracy of the classifier that considered only the seven selected features among the 10 Gamma-band synchronization features. Again, this finding confirms the result of the feature selection by the random probe method, namely that the selected Gamma-band synchronization features was particularly relevant to discriminate subjects of the two groups based on their respective epochs.
Finally, we aimed to determine whether there was a significant difference between V0 and V21, within each group separately. In other words, we wondered whether subjects of Group A and Group B, separately, were able to self-modulate their brain dynamics on the basis of the three biomarkers of interest.
Table 7,8 show that the classifiers that used features extracted from the Gamma-band synchronization and the PAF were able to discriminate between epochs recorded at V21 and those recorded at V0, only for subjects of Group A (accuracies of 67.6% and 61.8%, for the Gamma-band synchronization and the PAF, as shown in Table 7, versus accuracies of 35.7% and 32.1% regarding the same biomarkers in Group B, as shown in Table 8). By contrast, the classifiers using features extracted from the TBR were unable to discriminate V0 from V21 in Group A (Table 7) and Group B (Table 8).
| Group A | Gamma-band synchronization | Theta/Beta ratio | Peak Alpha Frequency |
| V0 (n = 17) | 11/17 | 6/17 | 10/17 |
| V21 (n = 17) | 12/17 | 8/17 | 11/17 |
| Accuracy | 67.6% | 41.2% | 61.8% |
For more details, see supplementary material (Supplementary Tables 10–12).
| Group B | Gamma-band synchronization | Theta/Beta ratio | Peak Alpha Frequency |
| V0 (n = 14) | 6/14 | 7/14 | 5/14 |
| V21 (n = 14) | 4/14 | 1/14 | 4/14 |
| Accuracy | 35.7% | 28.6% | 32.1% |
For more details, see supplementary material (Supplementary Tables 13–15).
It is worth noting that these results were obtained in a double-blind setting: the information that subjects who received real neural feedback belonged to Group A, and subjects who received sham feedback belonged to Group B, was disclosed after completion of data collection and analysis.
The neurophysiological hallmark of brain aging is characterized by a loss of synapses and neuronal apoptosis, leading to age-dependent decline of cognitive (but also motor and sensory) functions [49, 50]. Importantly, however, growing evidence has shown plastic compensatory mechanisms that maintain neural functions, as in the case of the neuronal and synaptic death that may occur in the absence of cognitive symptoms for an unknown duration [51]. A combination of cognitive strategies and adjuvant interventions, such as EEG-neurofeedback training, might strengthen such mechanisms. Specifically, the current study aimed to determine whether healthy elderly with subjective memory complaints could learn to modulate their brain activity, through EEG-neurofeedback training (as opposed to sham feedback training), by focusing on EEG biomarkers of aging, and whether it could have a positive effect on their cognitive abilities. Based on neuropsychological tests, results showed that there were no significant effects of the feedback training (either EEG-neurofeedback or sham feedback) on subjects’ cognition. However, these subjects should have only slight potential for improvement at V21 given that their performance in these tests was already within the normal range and often close to the upper reference limit at baseline (V0). The TMT-A test—a relatively simple timed test in which subjects are required to draw a line to connect consecutive numbers from 1 to 25—was the only neuropsychological test in which the whole sample (n = 31) or each group, separately, significantly improved their score at V21. Yet, rather than reflecting an improvement related to the feedback training, this finding suggests a processing-speed improvement probably due to a practice effect (i.e., improvements in cognitive test performance due to repeated evaluation with the same test materials [52]). Notably, the subjects’ education level was high, without significant differences between groups, which may have contributed to these cognitive results.
Based on the EEG data analysis, the machine learning method not only confirmed but further detailed the differences between biomarkers and between groups already verified with classical statistical tests: specifically, seven features were identified as the most relevant for distinguishing Group A from Group B, all belonging to Gamma-band synchronization. Using these selected features, the SVM classifier was able to correctly classify the epochs of 11 (out of 17) subjects in Group A, and the epochs of 11 (out of 14) subjects in Group B, reaching an accuracy of 71%. The same accuracy was obtained by the SVM classifier based on all the 10 features extracted from the Gamma-band synchronization. When considering the PAF or the TBR features, a lower accuracy value (accuracy = 61.3%) was obtained to distinguish between the epochs of the two groups. These classification-based results are in accordance with the statistical analyses on EEG biomarkers, which revealed a significant difference between groups regarding Gamma-band synchronization with greater synchrony values for Group A at V21.
To further investigate the relevance of each biomarker, we performed intra-group analysis and compared, within Group A and within Group B, neural changes relative to each biomarker from V0 to V21. Our findings revealed that the features extracted from the Gamma-band synchronization, as well as from the PAF, were able to correctly classify the epochs of subjects of Group A (that is, epochs corresponding to 12/17 and 11/17 subjects for the Gamma-band synchronization and the PAF, respectively), but not to discriminate the epochs of subjects of Group B (that is, epochs corresponding to only 4/14 subjects, for either the Gamma-band synchronization or the PAF).
Taken together, these results pointed out that subjects of Group B, who underwent the sham feedback, seemed unable to modulate any of the neural biomarkers. On the contrary, the results strongly suggest that subjects of Group A, who underwent the EEG-neurofeedback training, were able to improve the Gamma-band synchronization, but not the PAF nor the TBR, although apparently more able to modulate the PAF than the TBR, as reported in Table 7. Interestingly, contrary to the PAF and the Gamma-band synchronization, the association between age and TBR remains unclear in the literature, with research evidence indicating that TBR might be more useful as a biomarker of attentional control and cognitive performance anxiety than a biomarker that typically declines with age [53]. While the current study offers valuable insights, it is important to note that longer EEG recordings during resting states could further enhance the precision and depth of our results, providing a more comprehensive understanding of the neurophysiological changes associated with neurofeedback training in the aging population.
Overall, our findings are in line with one of the main criteria for successful neurofeedback [54], clearly distinguishing subjects of Group A from those of Group B, based on EEG changes pre- versus post-training (V0 vs V21). In particular, they provide robust evidence that elderly subjects can learn to self-modulate their brain activity, specifically enhancing the Gamma-band synchronization that supports higher cognitive processes (often disrupted by aging) [55], through EEG-neurofeedback training. Last, these results also validate our portable, non-invasive, and low-cost BCI, comprising only five EEG electrodes, as a pragmatic tool for neurofeedback training.
The neuromodulation effect observed in this double-blind study is a very encouraging outcome, which fits into growing evidence suggesting that EEG-neurofeedback constitutes a promising non-pharmacological intervention for the effective improvement of brain activity in the elderly. Such evidence may prove extremely valuable in the development of combined strategies aimed at preserving a healthy brain during the aging process, given the increased risk of neurodegenerative disorders, like AD, with advancing age.
Note that gamma rhythms have been implicated in recruiting neuronal and glial responses to effectively reduce amyloid pathology levels in a mouse model of AD [56, 57]. This is of utmost relevance because it suggests a potential therapeutic benefit of training brain oscillations in the Gamma-band in elderly subjects at high risk of developing this neurodegenerative disorder. Hence, it would be of major interest to investigate whether our results can be extended to patients suffering from AD at its earliest stages [31], and further explore whether, in this case, EEG-neurofeedback targeting this specific Gamma-band synchronization biomarker could have a positive impact on patients’ cognition, but also on the clearance of AD-pathology, ultimately delaying the course of this devastating disorder. Following on from the previously cited research on mouse models of AD, a recent study also conducted by Li-Hue Tsai demonstrated that 40 Hz light and sound stimulation in humans can induce gamma entrainment in multiple brain regions, including subcortical areas. Remarkably, this study further revealed lesser ventricular dilation and lesser hippocampal atrophy in mild AD patients receiving 40 Hz stimulation daily for three months [58]. In line with these pioneering findings, the current work supports the potential of Gamma-band synchronization as a promising neural biomarker for meaningful interventions to tackle the cognitive decline that often accompanies brain aging and, eventually, to modify the progression of AD. These premises need to be validated in a large, placebo-controlled trial on this specific biomarker from the preclinical stages of this neurodegenerative disorder.
The data generated and analyzed in this study cannot be shared publicly. This is due to the RGPD (Europe) and french laws. Clinical data cannot be shared publicly. However, de-identified raw data could be shared under specific requests from the corresponding author [KA].
KA co-conceived the hypothesis, designed and wrote the protocol, acquired clinical data, and conducted the study as principal investigator. She also wrote the first draft, reviewed and coordinated the final version of the manuscript. NH participated in the design of the protocol and contributed critically to the conception of the EEG-based brain-computer interface. She also participated in the discussion of the results and further contributed to the major revision of the final manuscript. SR and TG participated in the acquisition of EEG data, performed behavioral and EEG analyses after the preprocessing step, discussed the results, and contributed to the text, tables, and artwork of the draft and the final manuscript. GD and AK contributed to the discussion of the results and to the writing of the final manuscript. GD further conducted machine learning analysis. BD contributed to the discussion of the protocol and final results. FV co-conceived the hypothesis and the design of the protocol; co-developed the brain-computer interface task; and contributed to the analysis and discussion of the results. TM co-designed and co-developed the brain-computer interface task; participated in the acquisition of data and in the coordination of EEG preprocessing, further contributing to the discussion of the results. He also participated in the writing of the first draft, reviewed and made critical contributions to the final manuscript. All authors contributed to editorial changes in the manuscript. All authors read and approved the final manuscript. All authors have participated sufficiently in the work and agreed to be accountable for all aspects of the work.
The study was approved by the ethical committee for the Protection of Persons of Ile-de-France XI and performed in accordance with the Declaration of Helsinki (the approval number: 2017-A02610-53). All subjects gave written informed consent prior to the experiments.
Our warmest thanks go to all the subjects who took part in the current study for their strong commitment to this research. We are also grateful to the IM2A research team, whose expertise in neuropsychological testing and subject recruitment played an important role in the success of this study.
Finally, we wish to thank our colleague Dimitrios Pantazis, director of the MEG Laboratory and principal investigator at the McGovern Institute, MIT, for his careful reading and insightful suggestions.
This study was supported by URGOTECH, the start-up of Group URGO, Paris, France.
The authors declare no conflict of interest.
Publisher’s Note: IMR Press stays neutral with regard to jurisdictional claims in published maps and institutional affiliations.