


 , Miguel Molina-Alvarez 1,2,3, Carmen Rodriguez-Rivera 2, David Pascual 2, Carlos Goicoechea 2,3
1 Escuela Internacional de Doctorado, Faculty of Health Sciences, Universidad Rey Juan Carlos, 28922 Alcorcón, Spain
2 Area of Pharmacology and Nutrition and Bromatology, Department of Basic Health Sciences, School of Health Sciences, Universidad Rey Juan Carlos, High Performance Experimental Pharmacology Research Group, Universidad Rey Juan Carlos (PHARMAKOM), Associated Unit R+D+i Institute of Medicinal Chemistry (IQM-CSIC)-URJC, 28922 Alcorcón, Spain
3 Cognitive Neuroscience, Pain, and Rehabilitation Research Group (NECODOR), Faculty of Health Sciences, Rey Juan Carlos University, 28922 Alcorcón, Spain
Abstract
Background: The understanding of neuropathic pain remains incomplete, highlighting the need for research on biomarkers for improved diagnosis and treatment. This review focuses on identifying potential biomarkers in blood and cerebrospinal fluid for neuropathic pain in different neuropathies. Methods: Searches were performed in six databases: PubMed, Web of Science, Scopus, Cochrane Library, EMBASE, and CINAHL. Included were observational studies, namely cross-sectional, cohort, and case-control, that evaluated quantitative biomarkers in blood or cerebrospinal fluid. Data were qualitatively synthesized, and meta-analyses were conducted using R. The study is registered with PROSPERO under the ID CRD42022323769. Results: The literature search resulted in 16 studies for qualitative and 12 for quantitative analysis, covering patients over 18 years of age with painful neuropathies. A total of 1403 subjects were analyzed, identifying no significant differences in levels of C-Reactive Protein (CRP), Interleukin-6 (IL-6), and Tumor Necrosis Factor-alpha (TNF-alpha) between patients with and without pain. Despite the high inter-rater reliability and adequate bias assessment, the results suggest negligible differences in inflammatory biomarkers, with noted publication bias and heterogeneity among studies, indicating the need for further research. Conclusions: Our review underscores the complex nature of neuropathic pain and the challenges in identifying biomarkers, with no significant differences found in CRP, IL-6, and TNF-alpha levels between patients with and without pain. Despite methodological robustness, the results are limited by publication bias and heterogeneity. This emphasizes the need for further research to discover definitive biomarkers for improved diagnosis and personalized treatment of neuropathic pain.
Keywords
- pain
- biomarker
- inflammation
- neuropathy
- neuropathic pain
Neuropathies encompass a variety of conditions characterized by nerve damage that arises from multiple etiologies. These conditions and the extent to which they impact different neural pathways result in a range of dysfunctions in nerve transmission, leading to diverse health consequences for patients [1].
Among the spectrum of neuropathies, peripheral neuropathies are the most prevalent, affecting approximately 2.4% of the global population. This prevalence increases to up to 8% among the elderly [2]. Peripheral neuropathies comprise disorders of the peripheral neurons and fibers, manifesting from a broad spectrum of underlying causes [3]. These conditions can be categorized based on the extent of injury (mononeuropathies, multifocal neuropathies, polyneuropathies), the nature of the neuropathy (compressive or non-compressive, axonal, or demyelinating), and the disease progression (chronic or acute) [4]. Various factors, including genetic predispositions, nerve compression or injury (as in carpal tunnel syndrome), exposure to toxins (e.g., methanol, alcohol), nutritional deficiencies, and diabetes mellitus, can trigger these neuropathies [5]. Notably, peripheral neuropathy remains idiopathic in 25% to 46% of cases [6].
Translating pathology into symptomatology, many of the signs depend on the extent and type of neuropathy, ranging from motor and cognitive alterations to sensory dysfunction and painful neuropathies.
Neuropathic pain is defined by the International Association for the Study of Pain (IASP) [7] as pain caused by a lesion or disease of the somatosensory nervous system. Most of the time these lesions are chronic and peripheral sensitization magnifies the condition. Peripheral sensitization refers to an increase in the magnitude of responsiveness at the peripheral ends of sensory nerve fibers to any stimulus. This results from the release of a chemical mediator by nociceptors and other non-neuronal cells such as immune cells, endothelial cells, keratinocytes, and fibroblasts at the site of tissue injury or inflammation [8], thereby resulting in increased nociceptor excitability through changes in protein phosphorylation and activity, contributing to both acute and long-term pain sensitivity [9, 10, 11, 12].
Neuropathic pain significantly diminishes patients’ quality of life and is characterized by persistent or intermittent spontaneous pain, development of allodynia, and hyperalgesia [1]. Despite extensive characterization, many aspects of the underlying mechanisms of neuropathic pain remain elusive, underscoring the need for further research. Moreover, the process of peripheral sensitization, crucial for the diagnosis, treatment, and progression of neuropathy beyond clinical signs, highlights the importance of identifying biomarkers. Biomarkers, including proteins, metabolites, and genetic polymorphisms, offer pathophysiological insights into the condition, exhibit minimal variability, and change in expression in response to disease, treatment, or pathological states. Once validated, biomarkers enable the prediction of disease outcomes or responses to interventions, facilitating disorder screening, diagnosis, and personalized therapeutic strategies [13].
This review therefore investigated inflammatory mediators in blood and/or cerebrospinal fluid to identify potential differential and prognostic biomarkers of neuropathic pain among patients with varying presentations of neuropathy.
The systematic review and meta-analysis were conducted in accordance with the Cochrane Handbook for Systematic Reviews of Interventions [14] and the Preferred Reporting Items for Systematic Reviews and Meta-Analyses (PRISMA) checklist (Supplementary Table 1) [15]. The protocol was registered in PROSPERO (CRD42022323769). Searches were performed in databases such as PubMed, Web of Science, Scopus, Cochrane Library, EMBASE, and CINAHL up to April 5, 2022. Details of the search strategy can be found in Supplementary Table 2.
Observational studies, including cross-sectional, cohort, and case-control designs were incorporated, provided they featured quantitative measures of biomarkers in blood or cerebrospinal fluid. Inclusion criteria necessitated a control group of patients with neuropathy but without pain. Studies not in English, case series, conference abstracts, randomized controlled trials, studies with incomplete data sets, those without their own control groups, involving non-human subjects, not focusing on nervous system injury biomarkers, employing non-quantitative methods for biomarker assessment, or failing to clearly include neuropathy among participant conditions were excluded.
Duplicates were identified and removed using Rayyan software (Rayyan, Cambridge, MA, USA) [16]. Following the removal of duplicates, titles and abstracts were independently screened by MS-G and MM-A to determine whether each citation met the eligibility criteria. Subsequently, a thorough evaluation of the full-text articles of potentially eligible studies was conducted. Any disagreements between the two authors during the screening and evaluation process were resolved through discussion. In cases where a consensus could not be reached, conflicts were resolved by CR-R.
Data extraction from the included studies was performed by MS-G and DP. The
following information was collected: author/year, participant characteristics,
diagnosis details, specific diagnostic criteria used, group classifications, mean
duration of diagnosis at the time of sample collection, biomarker information,
type of sample analyzed, peripheral neuropathy (PN) concentrations (mean
standard deviation (SD) or standard error of the mean (SEM)), non-peripheral
neuropathy (non-PN) concentrations (mean (SD or SEM)), and reasons for study
exclusion when applicable. To evaluate inter-rater reliability, the kappa
(
Selection was limited to biomarkers related to the inflammatory system from blood or cerebrospinal fluid, reflecting the role of inflammation in the chronification of pain [18].
The risk of bias in the included studies was evaluated using the Newcastle Ottawa Scale (NOS) [19]. The full-text articles were independently evaluated by two reviewers (MM-A and MS-G). In cases where a consensus could not be reached through discussion, a final decision was made by a third member of the review team (CR-R).
The data collected was subjected to qualitative analysis and summarized in
evidence tables. In cases where the studies reported data in terms of SEM, all
values were transformed into SD using the following equation: SD = SEM
To assess heterogeneity among the trials, statistical measures such as
Cochrane’s Q and the I
Potential publication bias was examined through the visual inspection of funnel plots [24].
The literature search yielded 16,278 records, from which 6399 duplicates were
removed. Following initial screening, 9784 studies were excluded. After full-text
assessment, 79 articles were further excluded, leaving 16 studies for qualitative
analysis, with 12 of these included in the quantitative synthesis (Fig. 1).
Inter-rater reliability for study selection was high (
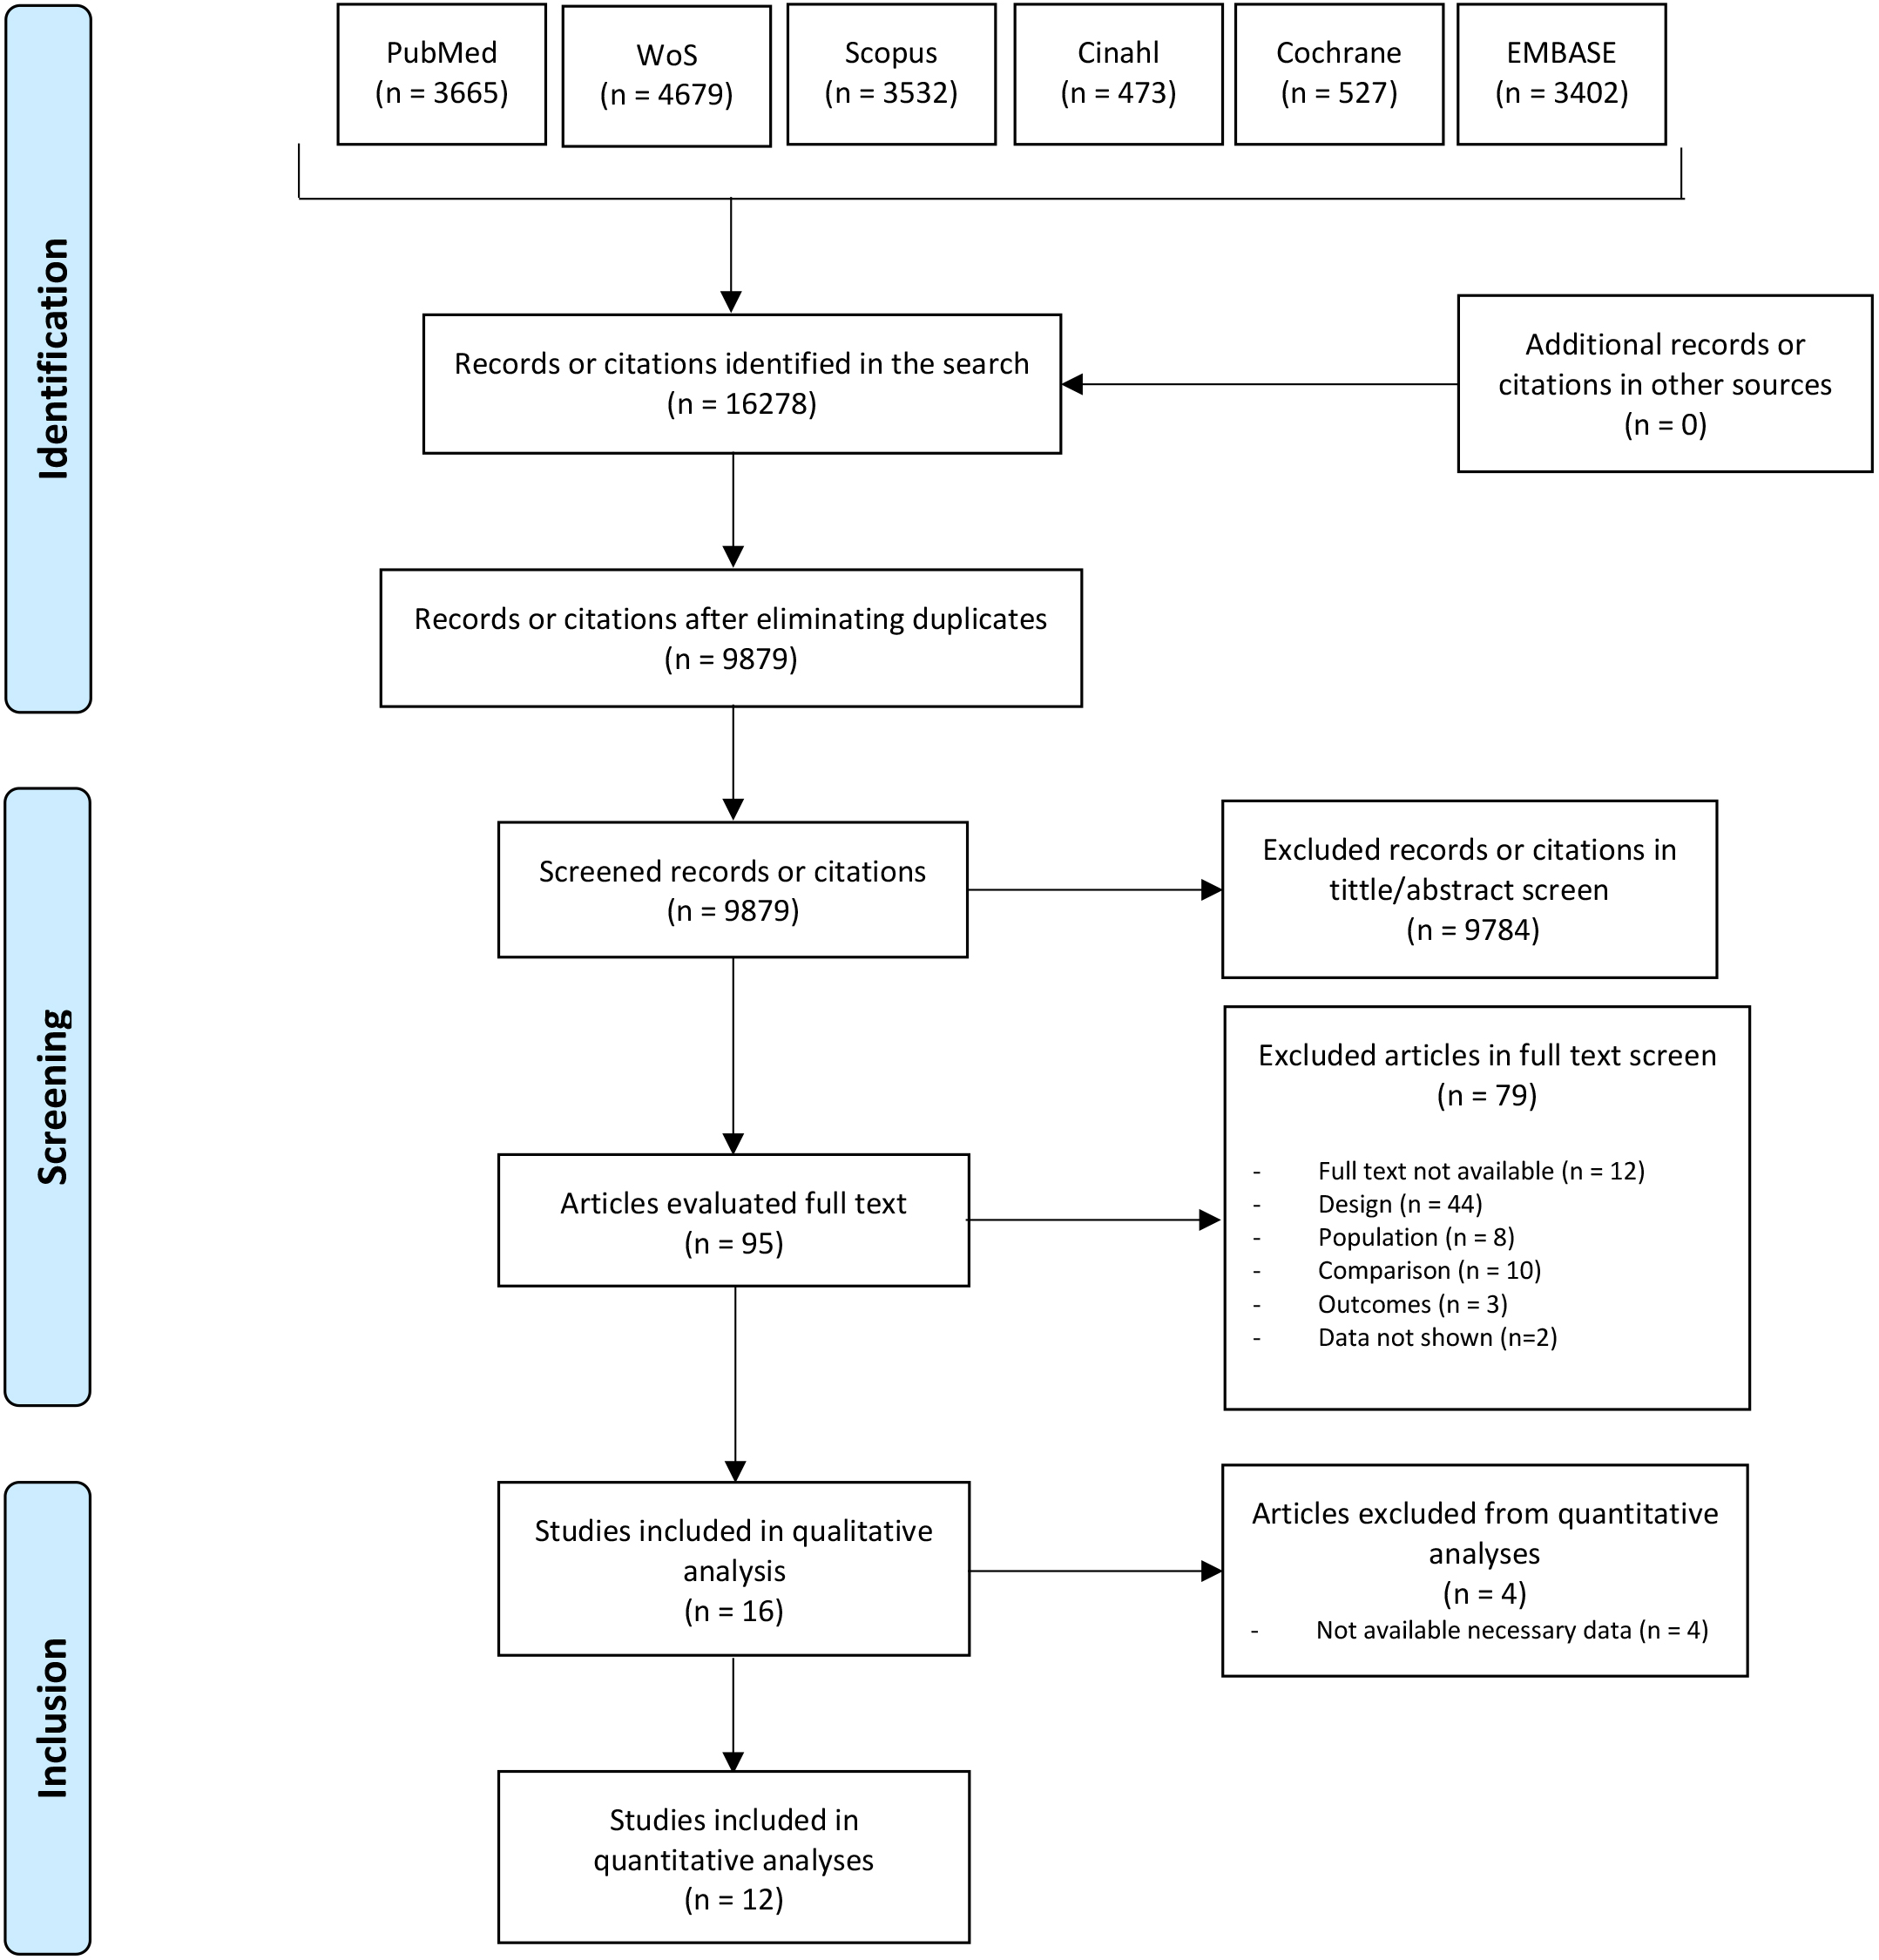 Fig. 1.
Main reporting Items for Systematic Reviews and Meta-Analyses (PRISMA) flow diagram.
The studies spanned from 2001 [25] to 2022 [26]. They involved patients over 18 years old with diagnosed painful neuropathies. Inclusion required the availability of quantitative data from non-blood or non-cerebrospinal fluid bio-samples. The control groups were composed of individuals over 18 years old with neuropathies but without pain. A total of 1403 subjects were included in the quantitative analysis, 784 of whom had painful neuropathies. Various diagnostic methods were utilized, including the Neuropathy Symptom Score (NSS) [27, 28, 29], the Leeds Assessment of Neuropathic Symptoms and Signs (LANSS) [30, 31], and the Toronto Clinical Scoring System (TCSS) [26, 32]. Studies were required to present data from non-blood and non-cerebrospinal fluid bio-samples to be included. The primary focus was on inflammatory mediators in blood and/or cerebrospinal fluid as potential biomarkers of neuropathic pain. The main characteristics of the studies are detailed in Table 1 (Ref. [25, 26, 27, 28, 29, 30, 31, 32, 33, 34, 35, 36, 37, 38, 39, 40]).
| Author/year | Participants | Diagnosis | Diagnostic criteria | Groups | Mean duration of diagnosis at sample collection | Type of sample | Biomarker |
| Alkhatatbeh and Abdul-Razzak 2019 [34] | n = 239 | Peripheral Diabetic Neuropathy | PainDETECT questionnaire | DM Non-PN (n = 117) | Years: 6 (3–10) | Serum | FBG, HbA1c and 25-hydroxyvitamin D |
| Female (n = 140) | DM Unclear PN (n = 58) | ||||||
| Age (years): 56.51 (9.03) | DM PN (n = 64) | ||||||
| Angst et al. 2020 [33] | n = 39 | Leprosy | EFNS recommendations | Leprosy PN (n = 22) | NA | Serum | IL1-b, IL-6, IL-10, IL-17, TNF, CCL, 2/MCP-1, IFN-g, CXCL-10/IP-10 and TGF-b |
| Female (n = 17) | Leprosy Non-PN (n = 17) | ||||||
| Age (years): 55.5 (16.6) | |||||||
| Chanda et al. 2022 [26] | n = 57 | Peripheral Diabetic Neuropathy | HbA1c and TCS | DM PN (n = 20) | Years: 8.8 (1.4–17) | Blood | IL-6 |
| Female (n = NA) | DM Non-PN (n = 10) | ||||||
| Age (years): 48.3 (4.4) | DM w/o neuropathy (n = 12) | ||||||
| Healthy controls (n = 15) | |||||||
| Conti et al. 2005 [35] | n = 26 | Peripheral neuropathies | Hematological examination, electromyography and electroneurography | PN (n = 9) | NA | CSF | PEDF |
| Female (n = 12) | Non-PN (n = 8) | ||||||
| Age (years): 49.88 (14.53) | Healthy controls (n = 9) | ||||||
| Cuce et al. 2019 [31] | n = 22 | Spinal cord injury | LANSS and NRS | PN (n = 15) | PN (years: 6.7) | Blood | Cortisol |
| Female (n = 3) | Non-PN (n = 7) | Non-PN (years: 3.4) | |||||
| Age (years): 40 (18–67) | Healthy controls (n = 10) | ||||||
| Doupis et al. 2009 [27] | n = 212 | Peripheral Diabetic Neuropathy | NSS, NDS, QST | PN (n = 46) | PN (years: 17 (11)) | Serum | HbA1c, Creatinine, HDL, cholesterol, PDGF AA, PDGF AB/BB, EGF, FGF, VEGF, RANTES, OPG, Receptor activator for nuclear factor κB ligand, G-CSF, IP-10, Myeloperoxidase, sE-Selectin, sICAM-1, CRP, TNF-alpha and fibrinogen |
| Female (n = 36) | Non-PN (n = 31) | Non-PN (years: 23 (16)) | |||||
| Age (years): 57.6 (42–70) | DM with neuropathy (n = 77) | DM w neuropathy (years: 20 (13)) | |||||
| DM w/o neuropathy (n = 80) | |||||||
| Healthy controls (n = 55) | DM w/o neuropathy (years: 14 (11)) | ||||||
| Empl et al. 2001 [25] | n = 24 | Various neuropathies | Dyck Neurological Disability Score and McGill pain questionnaire | PN (n = 16) | PN (months: 18 (18.48)) | Serum | TNF-RI |
| Female (n = 9) | Non-PN (n = 8) | Non-PN (months: 68.29 (70.77)) | |||||
| Age (years): 59.1 (13.4) | |||||||
| Hyun et al. 2021 [36] | n = 38 | Neuromyelitis optica spectrum disorder | PainDETECT questionnaire | PN (n = 22) | PN (years: 10.3 (5.3)) | Serum | GFAP, TNF-alpha, IL-6 and IL-10 |
| Female (n = 20) | Non-PN (n = 16) | Non-PN (years: 11 (6.4)) | |||||
| Age (years): 44.5 (6.0) | |||||||
| Li et al. 2018 [37] | n = 43 | Parkinson’s disease | Standards of the Movement | PN (n = 20) | PN (years: 4.54 (3.76)) | Blood | IL-1, IL-6, IL-10, and TNF-alpha |
| Female (n = 18) | Disorder Society Clinical Diagnostic Criteria for Parkinson’s disease | Non-PN (n = 23) | Non-PN (years: 3.5 (3.25)) | ||||
| Age (years): 67 (7) | |||||||
| Lim et al. 2017 [38] | n = 51 | Intervertebral disc degeneration | Oswestry Disability Index, VAS and McGill pain questionnaire | PN (n = 13) | NA | CSF | Cystatin C and Hemopexin |
| Female (n = 22) | Non-PN (n = 12) | ||||||
| Age (years): 45 (5) | Healthy controls (n = 25) | ||||||
| Pai et al. 2018 [39] | n = 626 | Peripheral Diabetic Neuropathy | MNSI and DN4 questionnaire | DM PN (n = 100) | DM PN (years: 16 (8.8)) | Serum | HbA1c, LDL, HDL and Triglycerides |
| Female (n = 293) | DM Non-PN (n = 175) | DM Non-PN (years: 15.8 (9.3)) | |||||
| Age (years): 72.9 (10.5) | DM w/o neuropathy (n = 351) | DM w/o neuropathy (years: 15.1 (8.1)) | |||||
| Rosales-Hernandez et al. 2014 [32] | n = 70 | Peripheral Diabetic Neuropathy | TCS and UENS | DM PN (n = 47) | DM PN (years: 7.1 (4.7)) | Plasma | HbA1c, Cholesterol, Triglycerides, HDL and LDL |
| Female (n = 24) | DM Non-NP (n = 23) | DM Non-PN (years: 6.8 (4.2)) | |||||
| Age (years): 60.1 (10) | |||||||
| Skapare et al. 2013 [28] | n = 187 | Peripheral Diabetic Neuropathy | NSS, NDS and CPT | DM1 Non-PN (n = 43) | DM1 Non-PN (years: 10.5 (6)) | Blood | glyoxalase 1 (Glo1) enzyme |
| Female (n = 107) | DM1 PN (n = 51) | DM1 PN (years: 19 (7)) | |||||
| Age (years): 48 (12.25) | DM2 Non-PN (n = 45) | DM2 Non-PN (years: 5.5 (2)) | |||||
| DM2 PN (n = 48) | DM2 PN (years: 1 (4)) | ||||||
| Uçeyler et al. 2007 [40] | n = 52 | Various neuropathies | NRS, NPSI, GCPS and NPSD | PN (n = 32) | PN (years: 4) | Plasma | IL-2, TNF-alpha, IL-4, IL-10 |
| Female (n = 17) | Non-PN (n = 20) | Non-PN (years: 6) | |||||
| Age (years): 65 | |||||||
| Yesil et al. 2018 [30] | n = 93 | Rheumatoid arthritis | LANSS and VAS | PN (n = 31) | PN (months: 24.29 (43.75)) | Serum | Vitamin D |
| Female (n = 75) | Non-PN (n = 62) | Non-PN (months: 17.73 (25.06)) | |||||
| Age (years): 59.88 (9.45) | |||||||
| Ziegler et al. 2019 [29] | n = 462 | Peripheral Diabetic Neuropathy | NRS, NSS, TCS, QST and NSI | PN (n = 304) | PN (years: 13.5 (9.6)) | Serum | LDL, HDL, Creatinine, HbA1c, Oncostatin M, TNSF10, TNSF12, TNSF14, CCL4, CCL8, CCL20, CCL28, CXCL1, CXCL11, HGF, TGF-alpha, LAP-TGFbeta1, Neurotrophin-3, TNFRSF5, DNER, AXIN1, MMP1, IL-6, IL-18, CCL19, CCL23, CCL25, FGF19, FGF21, IL18R1, LIF-R, 4E-BP1, MMP10, SIRT2, SLAMF1, ST1A1 and UPA |
| Female (n = 138) | Non-PN (n = 158) | Non-PN (years: 7.6 (5.8)) | |||||
| Age (years): 69.5 (7) |
DM, Diabetes mellitus; PN, Painful Neuropathy; Non-PN, Non Painful Neuropathy; EFNS, European Federation of Neurological Societies; LANSS, Leeds Assessment of Neuropathic Symptoms and Signs; NRS, Numerical Rating Scale; CSF, Cerebrospinal fluid; QST, Quantitative Sensory Testing; NSS, Neuropathic Symptom Score; NDS, Neuropathy Disability Score; VAS, Visual Analogue Scale; DN4, Douleur Neuropathique-4; CPT, Current Perception Threshold; NPSI, Neuropathic Pain Symptom Inventory; MNSI, Michigan Neuropathy Screening Instrument; GCPS, Graded Chronic Pain Scale; NPSD, German version of the Neuropathic Pain Scale; TCS, Toronto Clinical Neuropathy Score; UENS, Utah Early Neuropathy Score; NSI, Neuropathy Screening Instrument; NA, not available; PainDETECT, painDETECT questionnaire; HbA1c, Hemoglobin A1c; FBG, Fibrinogen; IL, Interleukin; TNF, Tumor Necrosis Factor; CCL, C-C Motif Chemokine Ligand; MCP-1, Monocyte chemoattractant protein-1; IFN, interferon; CXCL, C-X-C Motif Chemokine Ligand; IP-10, Interferon Gamma-Induced Protein 10; TGF, Transforming Growth Factor; PEDF, Pigment epithelium-derived factor; HDL, High-Density Lipoprotein; PDGF AA, Platelet-Derived Growth Factor AA; PDGF AB/BB, Platelet-Derived Growth Factor AB/BB; EGF, Epidermal Growth Factor; FGF, Fibroblast Growth Factor; VEGF, Vascular Endothelial Growth Factor; RANTES, Regulated upon Activation, Normal T Cell Expressed and Presumably Secreted (also known as CCL5); OPG, Osteoprotegerin; G-CSF, Granulocyte Colony-Stimulating Factor; sICAM-1, Soluble Intercellular Adhesion Molecule 1; CRP, C-Reactive Protein; sTNF-RI, Soluble Tumor Necrosis Factor Receptor I; LDL, Low-Density Lipoprotein; TCS, Toronto Clinical Scoring system; TNSF, Tumor Necrosis Factor Superfamily Member; HGF, Hepatocyte Growth Factor; TGF, Transforming Growth Factor; LAP-TGFbeta1, Latency-Associated Peptide Transforming Growth Factor Beta 1; TNFRSF5, Tumor Necrosis Factor Receptor Superfamily Member 5; DNER, Delta/Notch-like EGF Repeat Containing; AXIN1, Axis Inhibition Protein 1; MMP, Matrix Metallopeptidase; LIF-R, Leukemia Inhibitory Factor Receptor; 4E-BP1, Eukaryotic Translation Initiation Factor 4E-Binding Protein 1; SIRT2, Sirtuin 2; SLAMF1, Signaling Lymphocytic Activation Molecule Family Member 1; ST1A1, Sulfotransferase Family 1A Member 1; UPA, Urokinase-type Plasminogen Activator.
The adequacy of bias was assessed, with results summarized in Table 2 (Ref. [25, 26, 27, 28, 29, 30, 31, 32, 33, 34, 35, 36, 37, 38, 39, 40]). Each article was evaluated using the NOS, where the main issue of contention was the “additional factors” category, often due to a lack of double comparison between groups [25, 26, 33]. Despite this, all articles were deemed adequate for inclusion, with high scores indicating effective screening [25, 26, 27, 28, 29, 30, 31, 32, 33, 34, 35, 36, 37, 38, 39, 40], though multiple classifications for varying exposure categories were lacking.
| Author and publication year | Representative of the exposed cohort | Selection of external control | Ascertainment of exposure | Outcome of interest not present at the start of the study | Main factor | Additional factor | Assessment of outcomes | Sufficient follow-up time | Adequacy of follow-up | Total |
| Alkhatatbeh and Abdul-Razzak 2019 [34] | ✗ | 8 | ||||||||
| Angst et al. 2020 [33] | ✗ | ✗ | 7 | |||||||
| Chanda et al. 2022 [26] | ✗ | ✗ | 7 | |||||||
| Conti et al. 2005 [35] | ✗ | 8 | ||||||||
| Cuce et al. 2019 [31] | ✗ | 8 | ||||||||
| Doupis et al. 2009 [27] | 9 | |||||||||
| Empl et al. 2001 [25] | ✗ | ✗ | 7 | |||||||
| Hyun et al et al. 2021 [36] | ✗ | 8 | ||||||||
| Li et al. 2018 [37] | - | 8 | ||||||||
| Lim et al. 2017 [38] | ✗ | 8 | ||||||||
| Pai et al. 2018 [39] | ✗ | 8 | ||||||||
| Rosales-Hernandez et al. 2014 [32] | 9 | |||||||||
| Skapare et al. 2013 [28] | ✗ | 8 | ||||||||
| Uçeyler et al. 2007 [40] | - | 8 | ||||||||
| Yesil et al. 2018 [30] | ✗ | 8 | ||||||||
| Ziegler et al. 2019 [29] | ✗ | 8 |
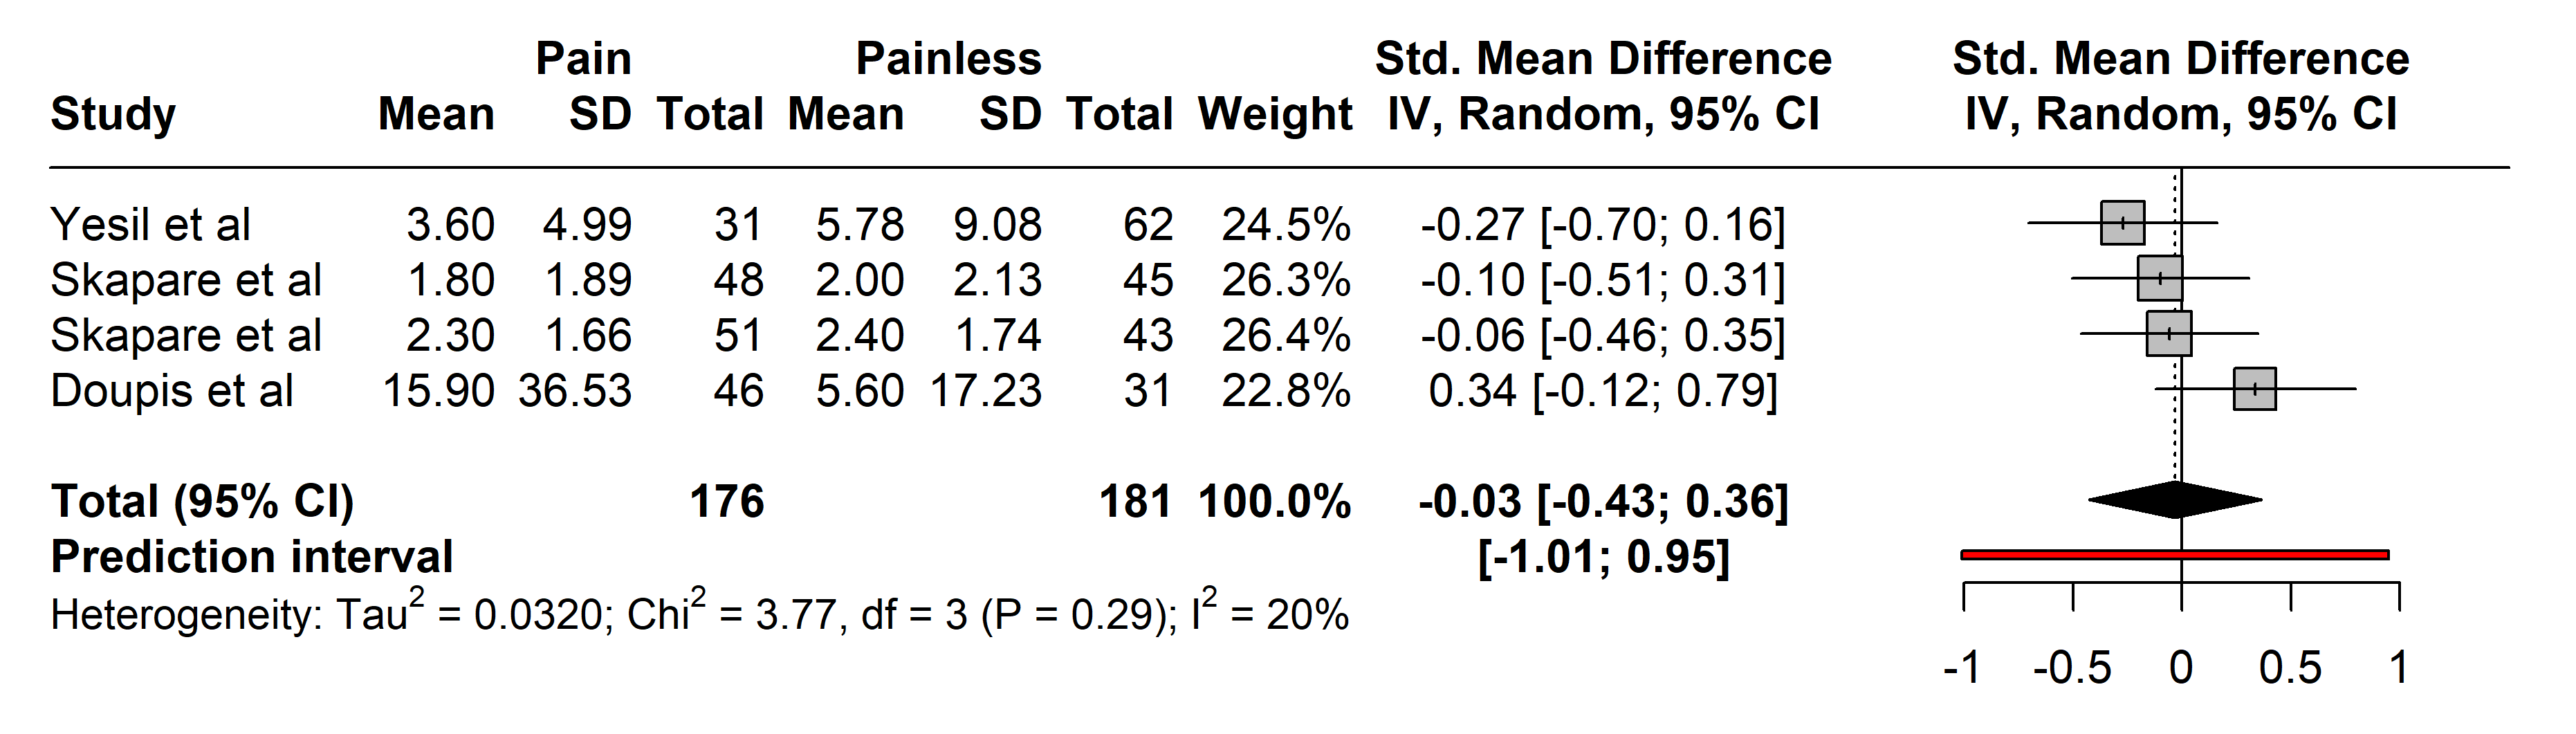
3.2.2.1 C-Reactive Protein (CRP)
In the studies assessing CRP, 176 subjects with painful neuropathies were compared with 181 with painless neuropathies, primarily from arthritis [30] and diabetes mellitus types 1 and 2 cohorts [33].
Diagnostic tools varied, with most authors utilizing the NSS and Neuropathy
Disability Score (NDS), except for Yesil et al. [30] who used who
employed LANSS. No significant differences were observed in CRP levels between
the groups (SMD –0.03 [95% CI [–0.43, 0.36]], p = 0.8179;
heterogeneity [Q = 3.77, p = 0.2876], [I
 Fig. 2.
Meta-analysis of articles that showed CRP protein levels. Positive values = In favor of significant difference and potential biomarker role/Negative values = In favor of not consider it as a pain biomarker. SD, standard deviation; std., standard; IV, inverse variance 495; CI, confidence interval; CRP, C-Reactive Protein.
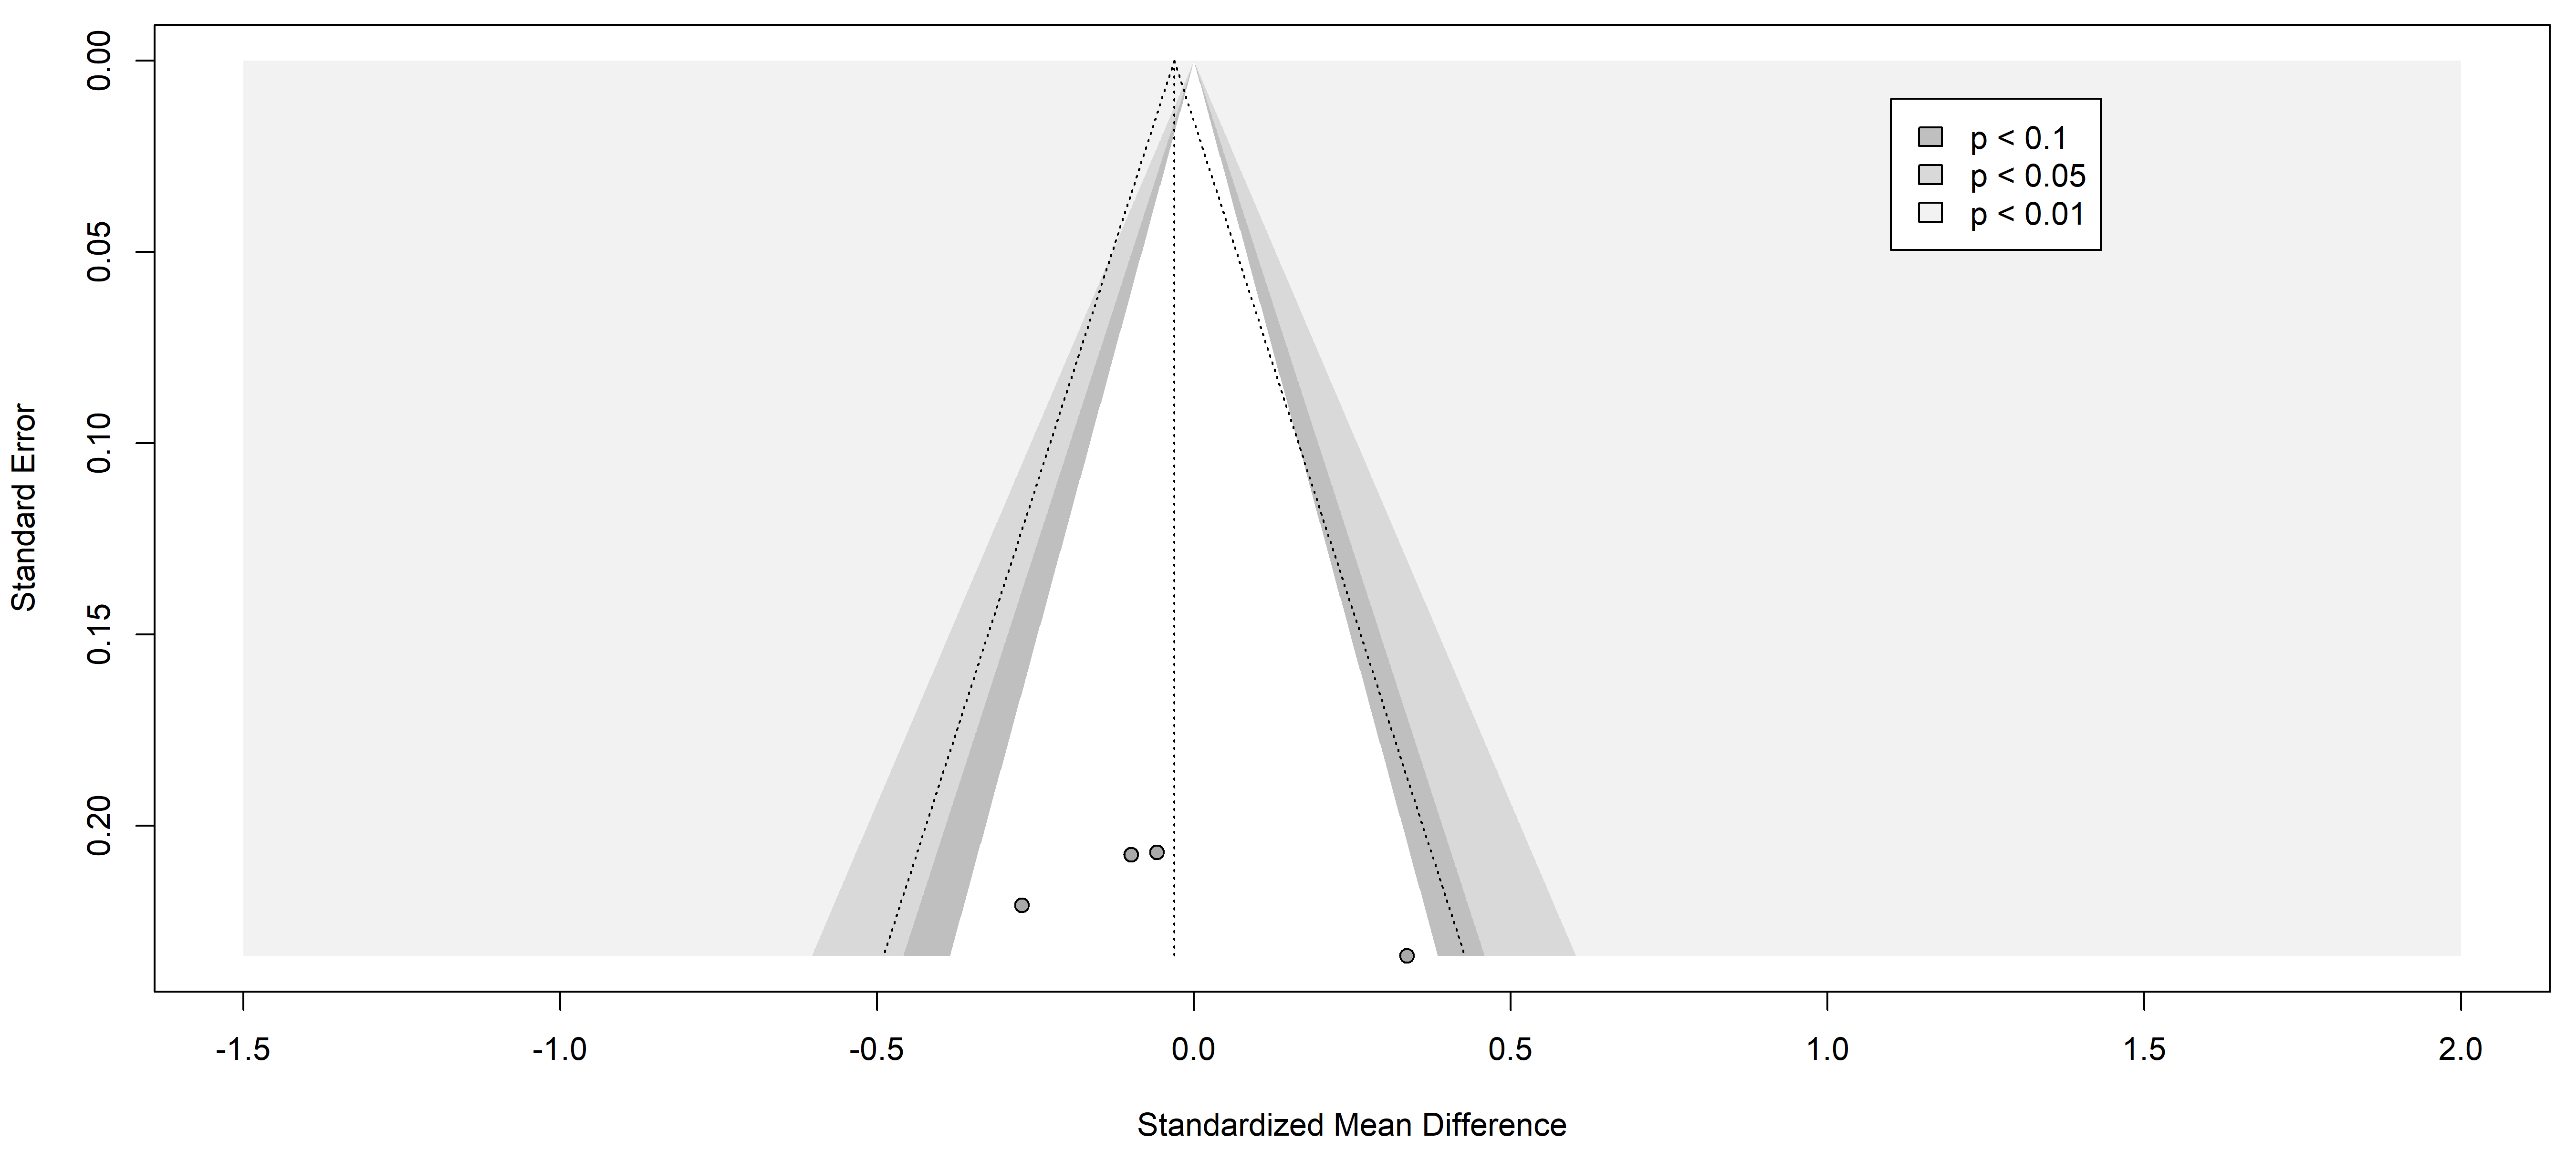 Fig. 3.
Funnel plot of the studies analyzed in the CRP statistics. The standardized mean difference is represented in contrast with the standard error showing the symmetry and the publication risk of bias. Results from included studies are depicted as dots in the graph.
3.2.2.2 Interleukin-6 (IL-6)
Studies comparing IL-6 levels involved 364 individuals with painful neuropathies
against 204 with painless conditions, covering a range of disorders including
diabetes mellitus type 2 [26, 29], Parkinson’s disease [37], and neuromyelitis
optica spectrum disorder [36]. Diverse diagnostic methods were used: the Toronto
Clinical Scoring system (TCSS) [26, 32], painDETECT questionnaire [34, 36], Unified
Parkinson’s Disease Rating Scale (UPDRS III) [37], Hoehn and Yahr (H-Y) scale
stage [37], visual analogue scale (VAS) [30], NSS
[27, 28, 29], and NDS [25, 27, 28]. No significant
differences in IL-6 levels were found between the groups (SMD 0.63 [95% CI
[–0.51, 1.76]], p = 0.9440; heterogeneity [Q = 19.25, p
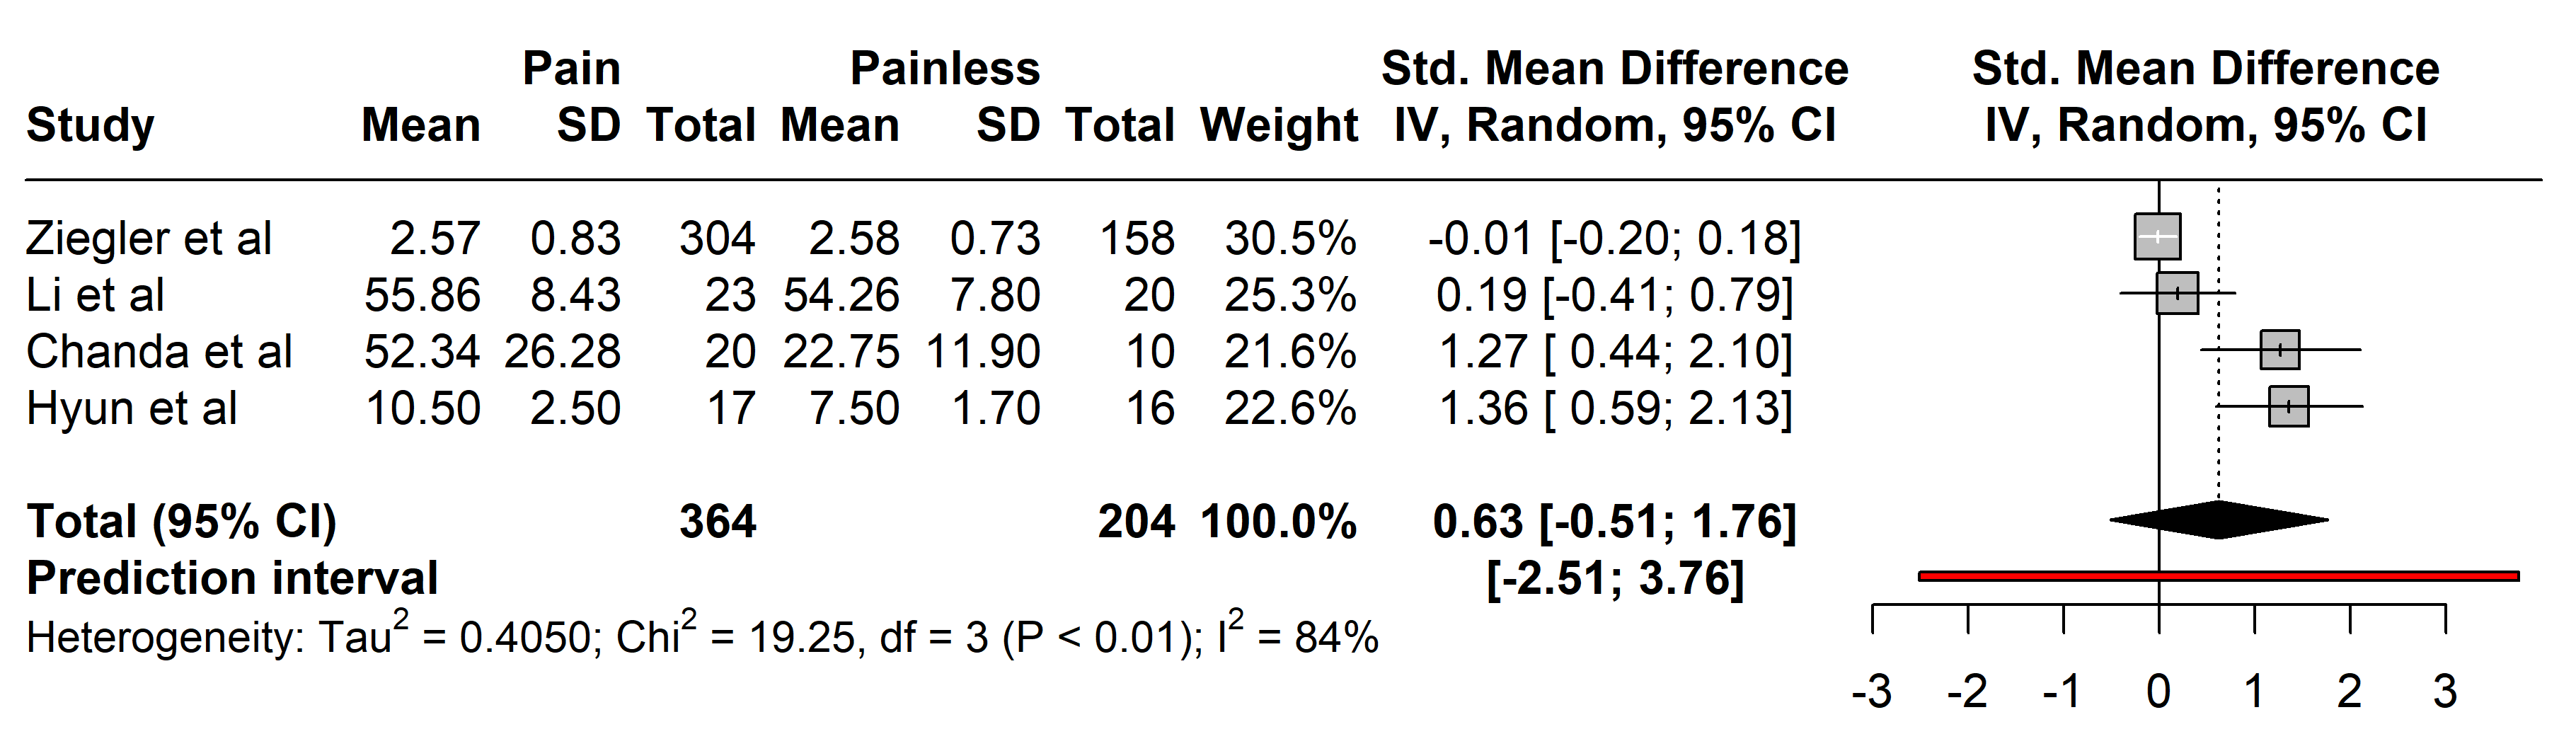 Fig. 4.
Meta-analysis of articles that showed IL-6 protein levels. Positive values = In favor of significant difference and potential biomarker role/Negative values = In favor of not consider it as a pain biomarker. SD, standard deviation; std., standard; IV, inverse variance 495; CI, confidence interval; IL, Interleukin.
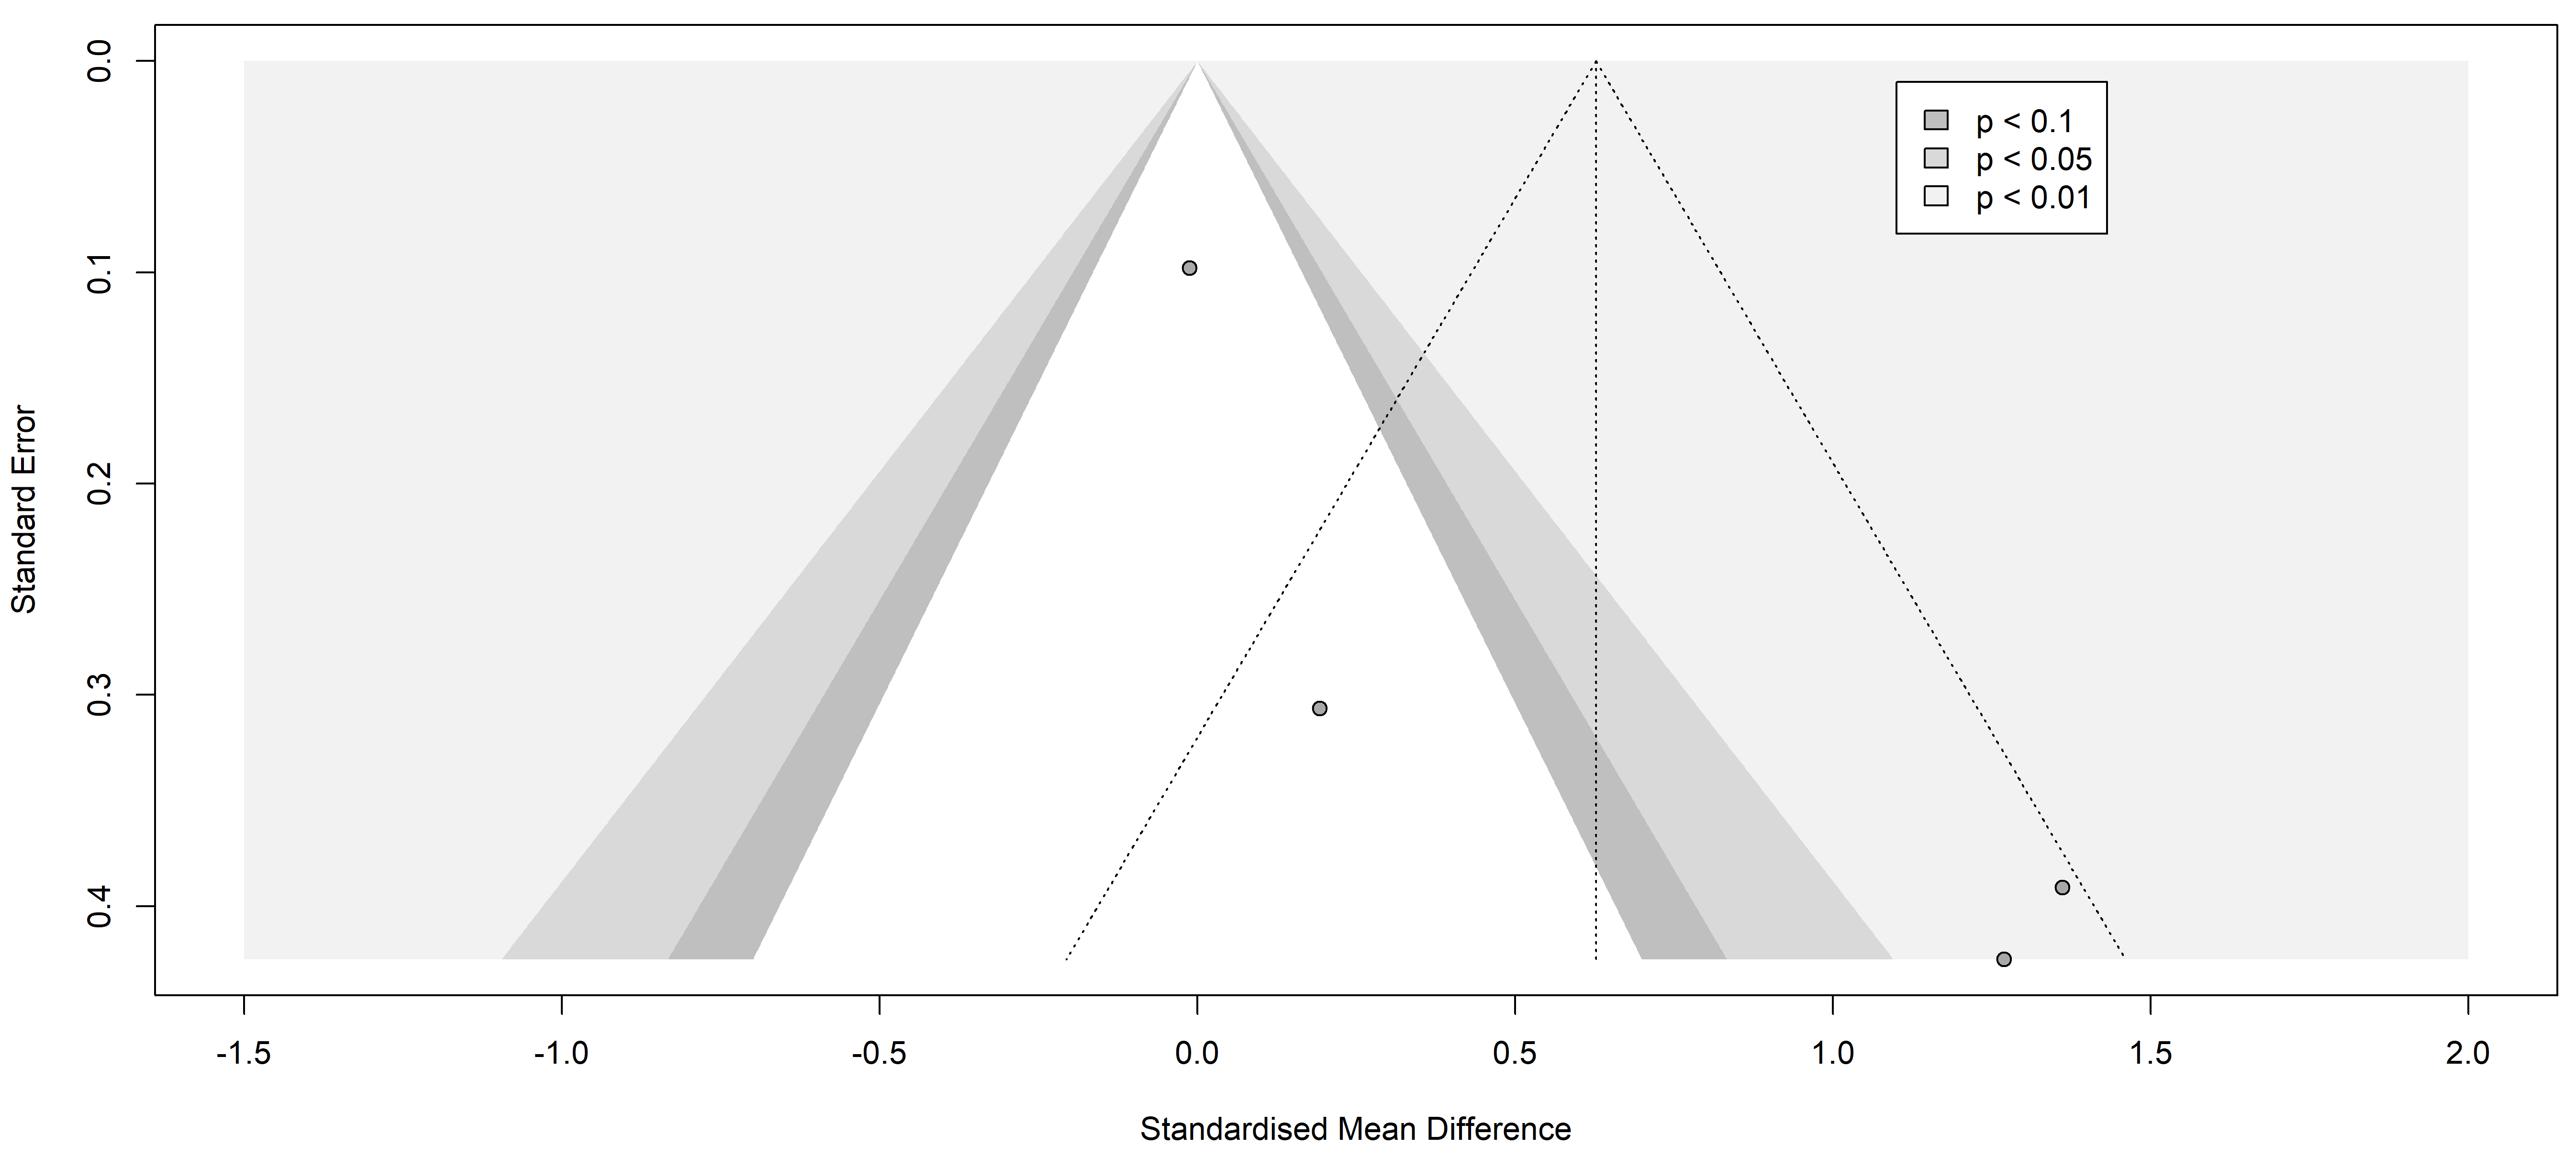 Fig. 5.
Funnel plot of the studies analyzed in the IL-6 statistics. The standardized mean difference is represented in contrast with the standard error showing the possible symmetry and low publication risk of bias. Results from included studies are depicted as dots in the graph.
3.2.2.3 Tumor Necrosis Factor-alpha (TNF-alpha)
Analyses of TNF-alpha included 86 patients with painful neuropathies compared
with 64 without pain, encompassing conditions like Parkinson’s disease [37],
diabetes mellitus type 2 [27], and neuromyelitis optica spectrum disorder [36].
Various pain assessment tools were used: UPDRS III, H-Y, VAS, NSS, NDS, and
painDETECT. No significant differences in TNF-alpha levels were found (SMD 0.76
[95% CI [–2.69, 4.21]], p = 0.4419; heterogeneity [Q = 23.01,
p
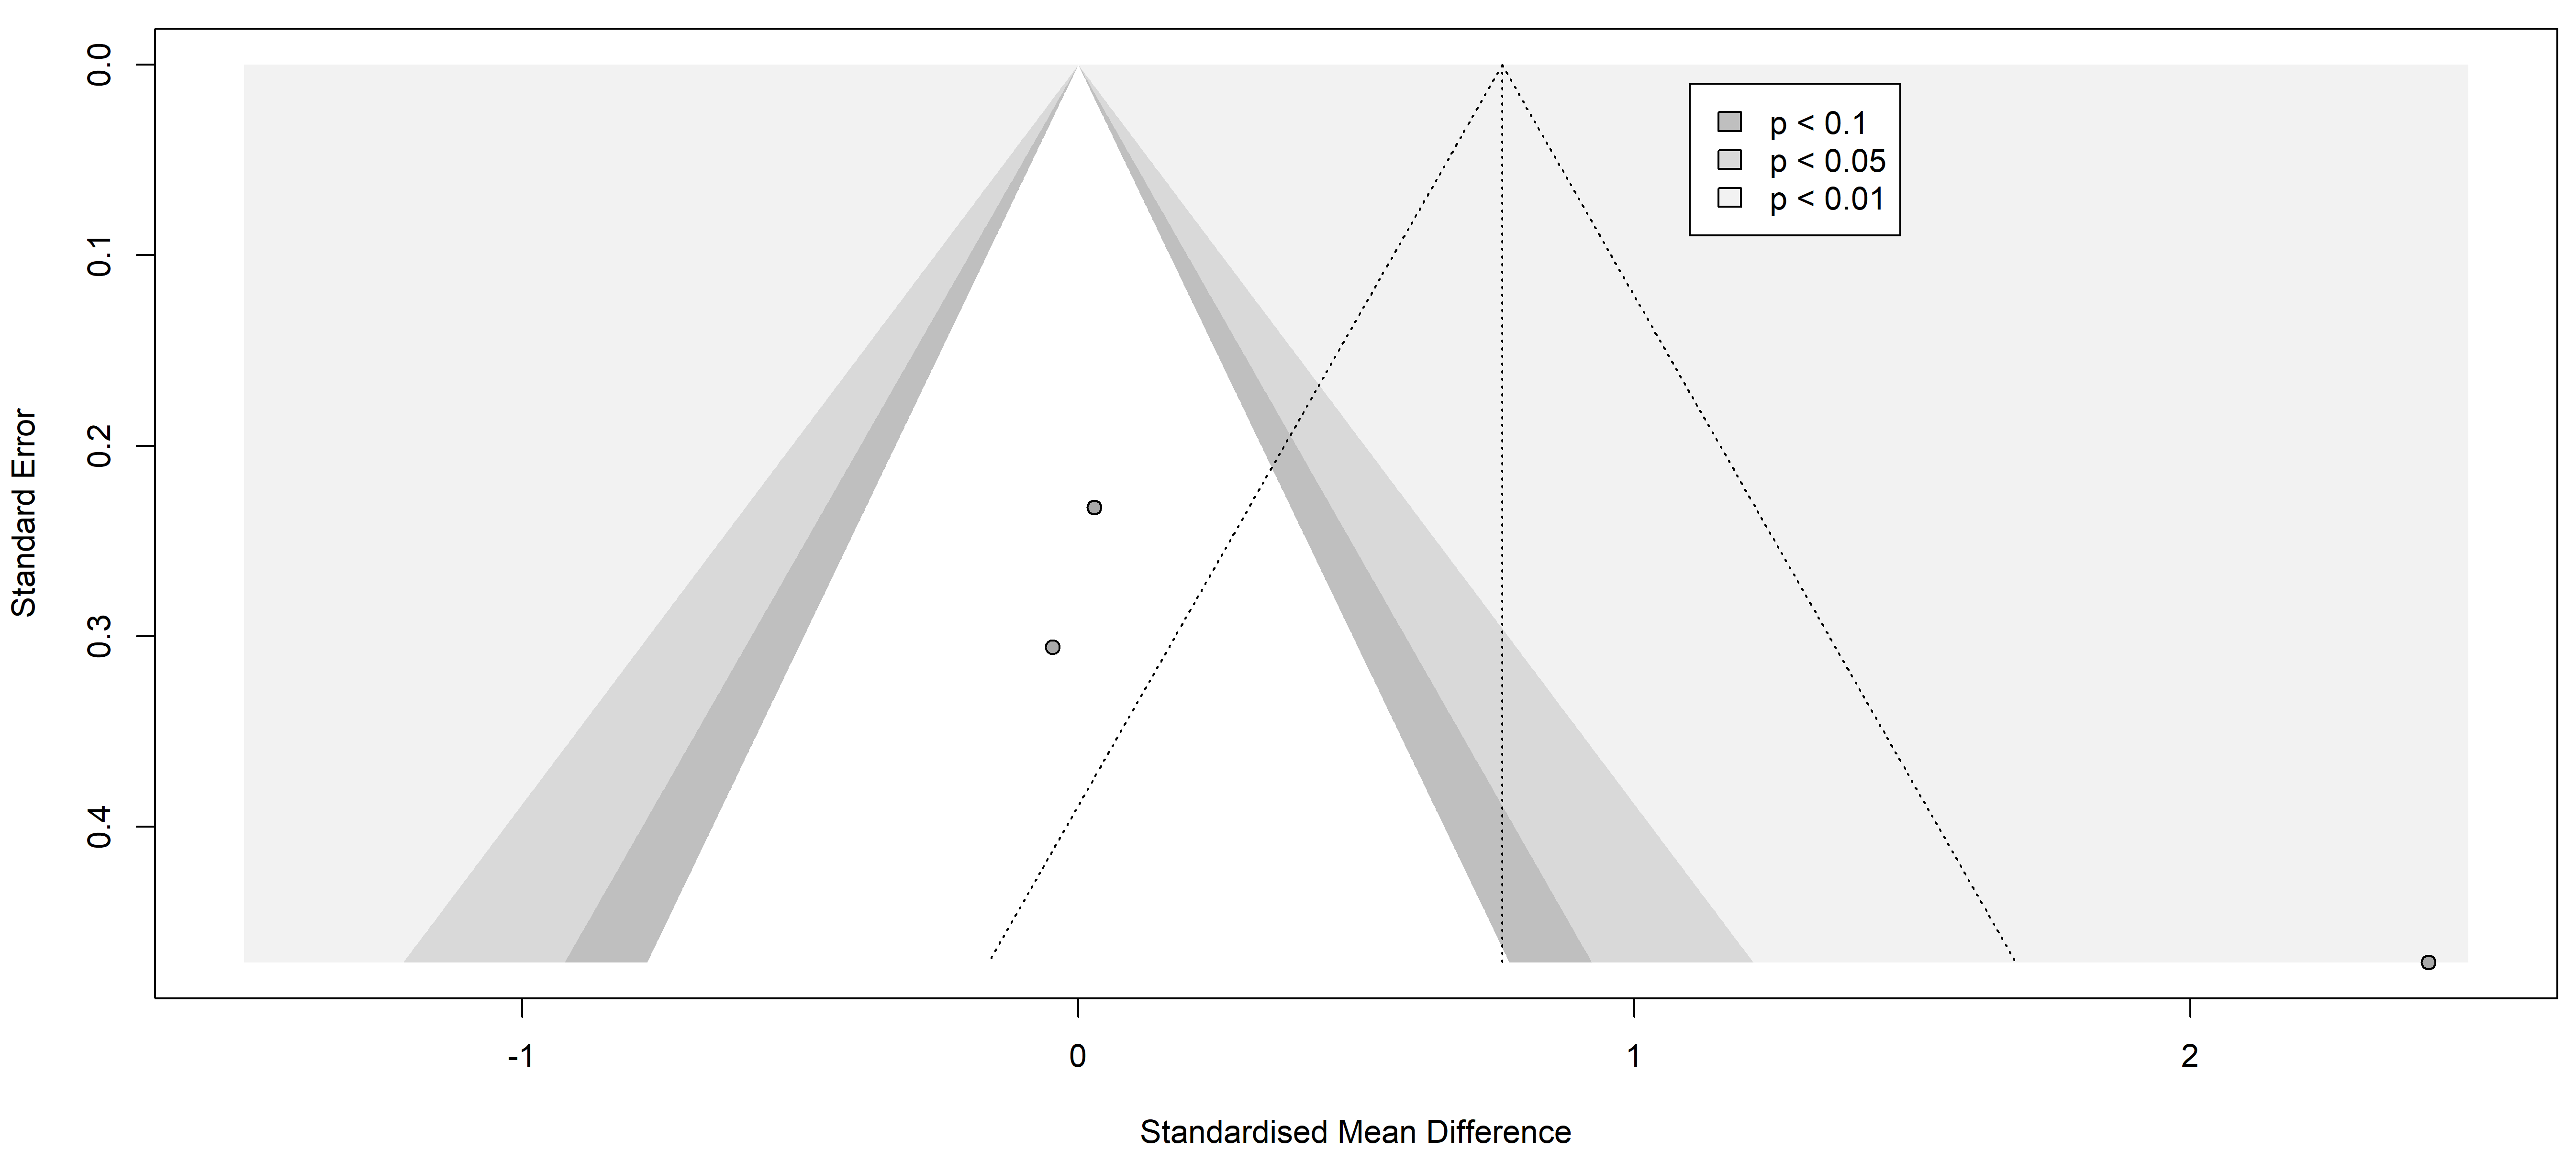
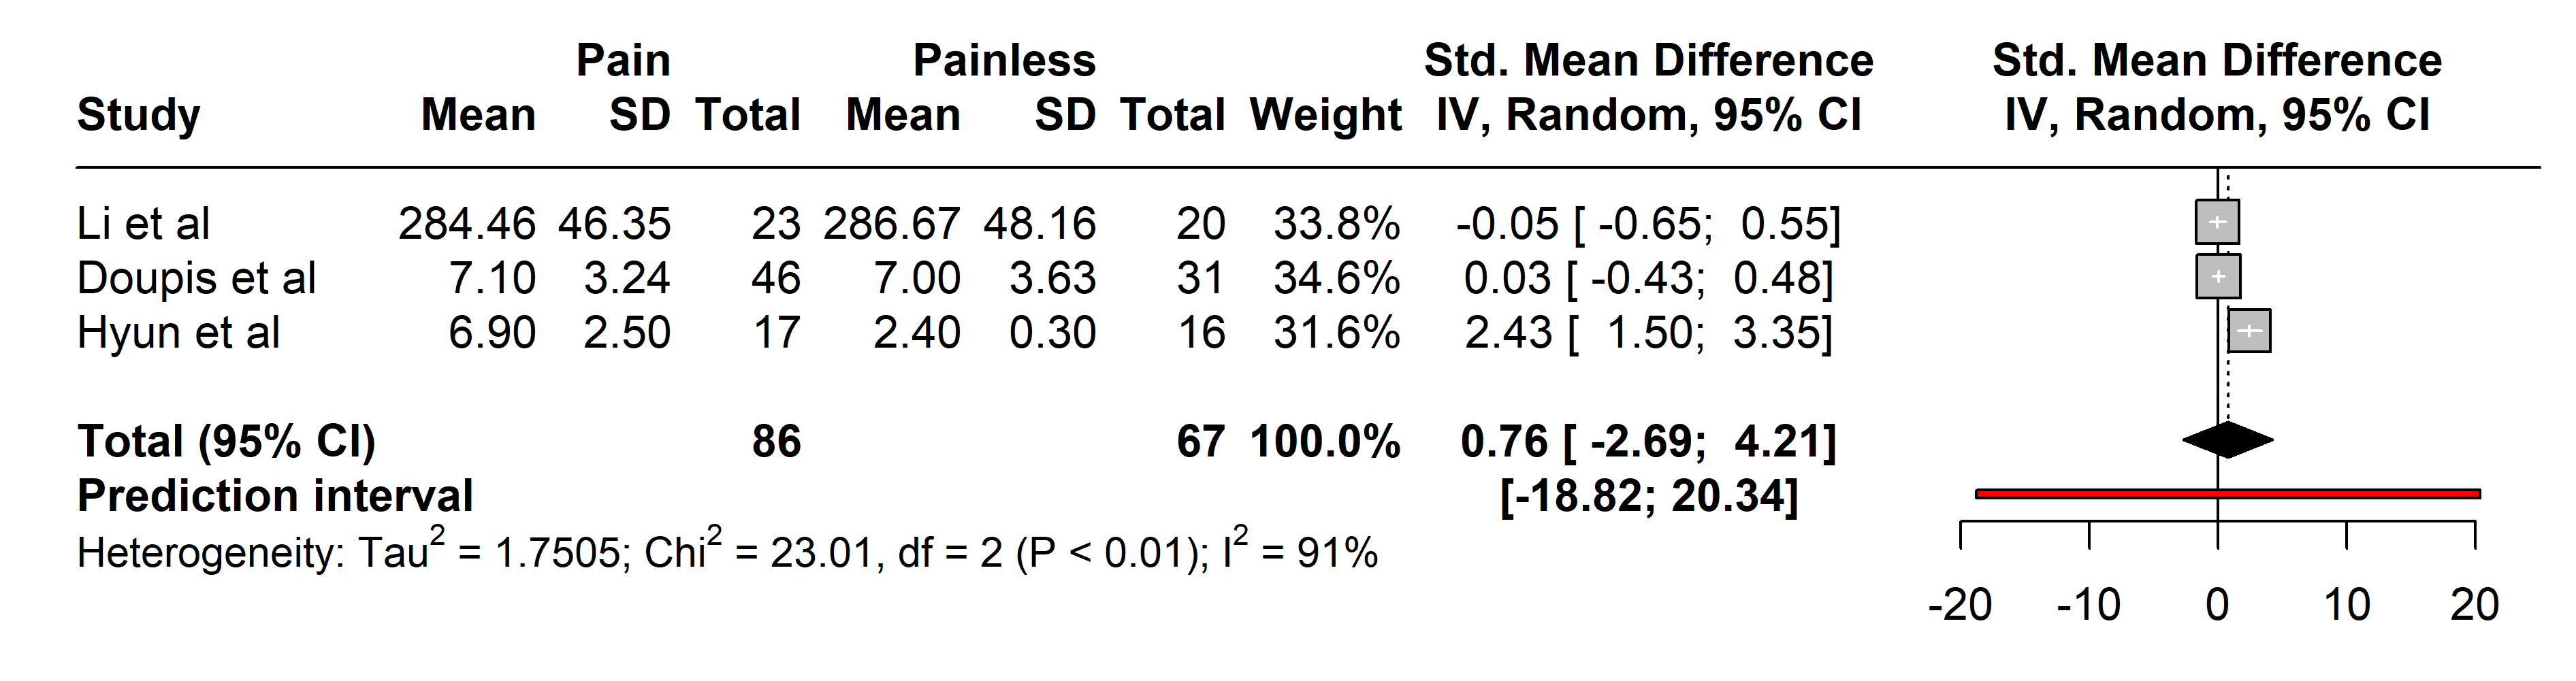 Fig. 6.
Meta-analysis of articles that showed TNF-alpha protein levels. Positive values = In favor of significant difference and potential biomarker role/Negative values = In favor of not consider it as a pain biomarker. SD, standard deviation; std., standard; IV, inverse variance 495; CI, confidence interval; TNF, Tumor Necrosis Factor.
 Fig. 7.
Funnel plot of the studies analyzed in the TNF-alpha statistics. The standardized mean difference is represented in contrast with the standard error showing a possible asymmetry and high publication risk of bias. Results from included studies are depicted as dots in the graph.
There is compelling evidence linking glial activation, immune response, and the development of chronic pain in animal models, yet translating these findings to human conditions remains an intricate task [41]. The search for a convincing pain biomarker continues to be a formidable challenge for the scientific community, yet the need to offer potential breakthroughs in understanding and treating patient conditions continues.
The immune system’s role in neuropathies, particularly within inflammatory and autoimmune contexts, is significant [42]. Hence, improper or excessive activation can lead to the infiltration of immune cells, such as lymphocytes and macrophages, into peripheral nerves, causing damage and dysfunction. Microglial shift from a surveillance state to a reactive state [43] leads to a secretion of inflammatory molecules, such as cytokines and chemokines, that trigger an inflammatory response and also contribute to nerve damage. Moreover, these molecules contribute to the recruitment and activation of more immune cells at the site of injury, amplifying the inflammatory response and perpetuating the damage [44]. Additionally, another key factor in the pathogenesis and progression of these conditions may be the peripheral leukocyte infiltration and cytotoxic enzyme secretion that also take place.
Although neuropathic pain is a complex and multifactorial condition, several immune mechanisms, some of which have already been mentioned, may contribute to the generation and maintenance of pain. One of them is the sensitization of the lesion site causing pain thresholds to decline significantly. Conversely, chronification of an injury may lead to a reactive state of microglia responding against nerve endings, leading to neuropathic pain [42, 43, 44, 45] and increased permeability of inflammatory molecules at the blood-brain barrier [46]. In the case of neuropathies that can be painful or non-painful, the pathogenesis is multifactorial and complex, hence the discovery of accurate biomarkers is required to achieve individualized treatments for each condition and each patient.
Of the 68 biomarkers identified in our systematic review, 12 could be used for
comparisons as they were the only ones common across several articles, and only
three of these were related to inflammation. This outcome revealed an absence of
significant results in the comparison of painful and painless neuropathies, which
could stem from the challenges of standardizing analysis conditions across
studies, even when measuring the same protein. This highlights one of the
significant limitations of our work, further compounded by our selection of
studies reporting data solely as mean
Among the 12 studies reviewed, none included data regarding cerebrospinal fluid samples. This scarcity of results does not reflect a lack of importance of biomarkers in cerebrospinal fluid (CSF), as they may be of great interest amid the invasiveness of sample collection, but is probably a result of the rigid inclusion criteria and the huge heterogeneity of the studies. Significantly, studies measuring proteins in blood and those measuring CSF biomarkers were not mixed and analyzed in the same comparison and, considering the limited number of the latter, only a standardized pool from blood was available for analyses. This highlights a critical limitation of our meta-analysis, which stems from the inherent heterogeneity among the included studies and underscores the potential benefits of well-conducted individual studies that might provide more definitive guidance. Despite this, meta-analysis remains a valuable tool in our field, offering a comprehensive overview that individual studies cannot provide alone. Among the studies determining biomarkers in blood, most of the articles highlighted the role of TNF-alpha, IL-6, C-reactive protein, and IL-1beta in inflammatory diseases, provoking our further interest in them. Nevertheless, the sample size was small throughout the whole study, and probably contributed to the absence of significant results. Nevertheless, the role of these molecules in the aforementioned pathologies must be taken into consideration, opening the way for future research. An increase in IL-6 and TNF-alpha levels has been shown to occur in inflammatory-like diseases [41, 45, 46, 47]. Briefly, both mediators have been found to be up-regulated after nerve injury, inflammatory processes, chronic exposure to various drugs, and other conditions leading to inflammatory reactions; hence, this increased secretome possibly plays an important role in the development and maintenance of pain.
IL-6 is a multifunctional cytokine that is a key player in inflammatory regulation. After a traumatic event in the nervous system, the levels of this interleukin rise, leading to an upregulation of astrocytic activity as a part of the activation process, shifting to a reactive state. In addition, it has been proposed that IL-6 may have a modulatory effect on neuronal excitability in the central and peripheral nervous systems. This could influence the perception of symptoms in neuropathies. Besides, IL-6 can increase the excitability of sensory neurons and modulate the transmission of nerve signals [45], which can translate into an increase in pain severity, as suggested by a large number of studies [26, 29, 36, 37, 48].
Moreover, IL-6 and TNF-alpha level increases were correlated with the intensity of allodynia in a study comparing painful and painless polyneuropathy [49]. Given the difficulty of finding studies comparing these two sample groups, samples of patients with chronic pain vs healthy controls have also been examined, showing increases in these cytokines in subjects suffering painful conditions [48].
TNF-alpha is an inflammatory cytokine that plays an important role in various functions of the immune system and is involved in several physiological and pathological processes. In the context of neuropathies, TNF-alpha has been the subject of research due to its possible contribution to both painful and non-painful neuropathies. It has been shown to stimulate astrocytes in the release of chemoattractant factors leading to a chronification of the inflammatory process [50]. In animal models, supplementation with this mediator has been proven to be correlated with the development of neuropathies and subsequent nociceptive processes [51]. Further, several authors have described a significant increase in both TNF-alpha and its microRNA in rodent neuropathic pain models [27, 36, 37, 40, 49]. As a result of this, the search for microRNA-type biomarkers is becoming increasingly widespread. An article comparing serum levels of markers such as TNF-alpha and other interleukins with their respective microRNA levels was included in the present metanalysis, although no significant differences were found [40].
MicroRNAs are short RNA sequences that do not code for proteins but are instead responsible for regulating gene expression following gene transcription. They often modulate the expression or repression of messenger RNA (mRNA), thus raising the possibility that they are biomarkers of evolution or the pathogenesis of a disease [52]. As such, several studies suggest a positive up-regulation of specific microRNAs in patients with painful neuropathies compared with non-painful diabetic conditions [53, 54]. Specifically, in the field of neuropathic pain, Tramullas et al. [55] detected a microRNA in an animal model that could help predict the development of neuropathy in patients by its determination in plasma and cerebrospinal fluid samples.
Finally, the scarcity of data to be analyzed led us to consider not including neuropathies that were not subtyped by specific pathology. If that were the case, the present work would have been missing a second analysis by subgroup, which would have shed light on whether each pathology should be examined with respect to a specific and different pain biomarker. This premise is held by some authors regarding CRP [27, 28]. This protein is produced by the liver in response to inflammation and activation of the immune system. In the context of both painful and painless neuropathies, the role of CRP has been investigated as a marker of inflammation and as a possible indicator of disease severity or prognosis [56, 57, 58]. However, the direct involvement of CRP in neuropathies and its relationship with neuropathic pain is not yet fully understood and remains under investigation.
Furthermore, in some painful neuropathies such as diabetic neuropathy, several authors have described an elevation of CRP levels, suggesting the presence of an inflammatory component. Inflammation may play a role in the generation and maintenance of neuropathic pain in these conditions. Despite our results not confirming any correlations with CRP, some authors found elevated CRP in type 1 [59] and type 2 [60] diabetes mellitus. It is important to note that the pathogenesis of type 2 diabetes mellitus is considerably heterogeneous and both glycation stress and inflammation-related processes could be cooperatively driving the development of late complications [28].
Finally, the information yielded by the funnel plots is essential to fully understand publication bias. Funnel plots are graphs used in meta-analyses and systematic reviews to visualize publication bias or any other type of bias. These graphs allow the assessment of potential asymmetry in the data, which would indicate the presence of such bias. In the context of a systematic review of pain markers in patients with painful neuropathies, a symmetric funnel plot indicates that the studies included in the review are not affected by publication bias or other types of bias.
Our comprehensive review highlights the ongoing gaps in the understanding of neuropathic pain and the need for identifying effective biomarkers for diagnosis and treatment. Despite thorough searches across six databases and analysis of 1403 subjects, our findings show no significant differences in the levels of CRP, IL-6, and TNF-alpha between patients with and without neuropathic pain. This result underscores the complexity of neuropathic pain and the challenges in using these inflammatory biomarkers for diagnosis or treatment. The high inter-rater reliability and adequate bias assessment strengthen the validity of our study, but the observed publication bias and study heterogeneity necessitate caution in interpreting our findings. Consequently, our review emphasizes the urgent need for more targeted research to unravel the underlying mechanisms of neuropathic pain and to identify more definitive biomarkers in blood and cerebrospinal fluid. This could ultimately lead to improved patient outcomes through better diagnostic tools and personalized treatment approaches.
Conceptualization, MM-A, MS-G and CG; methodology, MM-A, MS-G, DP, and CR-R; validation, MM-A, MS-G and CR-R; investigation, MM-A and MS-G; resources, CG, MM-A and MS-G; data curation, MM-A, MS-G and CR-R; writing—original draft preparation, MS-G; writing—review and editing, MM-A, MS-G, DP and CR-R; supervision, MM-A, CG, DP and CR-R; project administration, MS-G. All authors contributed to editorial changes in the manuscript. All authors read and approved the final manuscript. All authors have participated sufficiently in the work and agreed to be accountable for all aspects of the work.
Not applicable.
Not applicable.
This research received no external funding.
The authors declare no conflict of interest.
References
Publisher’s Note: IMR Press stays neutral with regard to jurisdictional claims in published maps and institutional affiliations.