
Academic Editors: Zhonghua Sun and Yung-Liang Wan
Background: The identification of high-risk coronary artery disease
(HRCAD) is important in diabetes mellitus (DM) patients. However, the reliability
of current models to predict HRCAD has not been fully investigated. Thus, we
aimed to validate and compare CONFIRM and PROMISE high-risk model (CHM and PHM)
in DM patients. Methods: 5936 symptomatic DM patients who underwent
coronary computed tomographic angiography (CCTA) were identified. Probability of
HRCAD for each patient was estimated based on CHM and PHM, respectively. We used
Area under the receiver operating characteristic curve (AUC), integrated
discrimination improvement (IDI), net reclassification improvement (NRI) and
Hosmer-Lemeshow (H-L) test to evaluate model’s predictive accuracy.
Results: Overall, 470 (8%) patients had HRCAD on CCTA. There was no
difference between the AUC for CHM and PHM (0.744 v.s. 0.721, p =
0.0873). Compared to CHM, PHM demonstrated a positive IDI (3.08%, p
Coronary artery disease (CAD) is global epidemic in patients with diabetes mellitus (DM), accounts for one-half of all deaths in this population and commonly generates challenges of clinical management [1, 2]. Compared to the general population, these patients usually have more high-risk CAD (HRCAD), e.g., obstructive CAD in left main artery (LMD), 3-vessel CAD (3VD), and 2-vessel CAD (2VD) involving the proximal left anterior descending artery (pLAD), as well as unremitting and rapidly progressive atherosclerosis progression [3]. Revascularization has been the cornerstone for these DM patients with HRCAD [4, 5], but parallel efforts are gradually shifting toward optimal medical treatment based on the results of ISCHEMIA trial [6]. Thus, there is an emerging need for a prediction tool that can effectively identify those DM patients with HRCAD.
Recently, a clinical model to predict HRCAD were developed using multicenter data from population referred to coronary computed tomographic angiography (CCTA), e.g., CONFIRM high-risk model (CHM) [7]. Similarly, the PROMISE high-risk model (PHM) was derived in a more contemporary CCTA-based cohort [8]. Both models included variables that can be easily obtained from daily clinical practice and were demonstrated to be robust to identify patients with HRCAD in internal validation study. However, neither CHM nor PHM has been systematically investigated in DM patients, for whom the accurate identification of HRCAD is critical but difficult [3, 4, 5]. Thus, the objective of this study was to validate and compare the two proposed models to predict the presence of HRCAD among symptomatic and DM patients who underwent CCTA.
In brief, the CCTA Improves Clinical Management of Stable Chest Pain (CICM-SCP)
registry (NCT04691037) is an ongoing cohort conducted in regional cardiovascular
centers recognized as tertiary A level. Since the last decade, CCTA has gradually
become the preferred first-line imaging test for patients with stable chest pain
(SCP) in our centers and the local physicians usually don’t select other testing,
i.e., functional testing as the initial diagnostic testing due to multifactorial
reason [9]. Thus, from January 2016, patients who were referred to CCTA for the
assessment of SCP were screened. After excluded patients with previous CAD,
insufficient image quality, missing baseline data, non-sinus rhythm, structural
heart disease, heart failure or
Patients were diagnosed with DM if one of the following was met: treatment by hypoglycemic medications or insulin, no less than 7.0 mmol/L for fasting blood glucose or no less than 11.1 mmol/L for 2 h plasma glucose level on their oral glucose tolerance test or no less than 6.5% for glycated hemoglobin value. This retrospective analysis of a prospective and observational cohort was approved by the local Ethics Committee.
Baseline clinical data including age, sex, systolic blood pressure (SBP), hypertension, hyperlipidemia, DM, sedentary lifestyle, glomerular filtration rate (GFR), family history of premature CAD, smoking, history of peripheral vascular disease (PVD) and symptom were prospectively collected and defined as described previously [7, 8, 10, 11, 12, 13]. According to the current European Society of Cardiology and European Association for the Society of Diabetes (ESC/EASD) risk stratification, patients were classified as very high, high, moderate and other risk [15].
The CHM included 9 independent risk factors: age, sex, DM, hypertension,
hyperlipidemia, family history of premature CAD, smoking, history of PVD and
symptom [7]. For the uniformity of study endpoint, we selected the PHM to predict
HRCAD based on
Procedure and analysis details of CCTA have been previously described [10, 11, 12, 13, 14].
According to the Coronary Artery Disease – Reporting and Data System [16], each
coronary segment with a
All statistical analyses were conducted by MedCalc (version 15.2.2; MedCalc
Software, Mariakerke, Belgium) and R (version 3.2.4; R Foundation for Statistical
Computing, Vienna, Austria). Two-tailed p
The mean age of the 5936 DM patients was 64.17 years, 3324 were males and 4096 were classified as very high risk based on the ESC/EASD risk stratification. As shown in Table 1, 470 (8%) patients were found to have HRCAD on CCTA. Except sedentary lifestyle, differences of the other baseline characteristics were statistically significant between patients with and without HRCAD. As shown in Fig. 1, of the 470 patients with HRCAD, 162 (34%) had LMD, 196 (42%) had 3VD, 212 (45%) had 2VD with pLAD, 42 (9%) had both LMD and 3VD, and 48 (12%) had both LMD and 2VD with pLAD.
| Characteristic | Total | HRCAD | p | ||
| N = 5936 | Yes (N = 470) | No (N = 5466) | |||
| Age |
64.17 |
69.23 |
63.73 |
||
| Male | 3324 (56) | 358 (76) | 2966 (54) | ||
| SBP |
137.22 |
141.87 |
136.18 |
||
| Hypertension | 4096 (69) | 352 (75) | 3744 (68) | 0.00020 | |
| Hyperlipidemia | 2908 (49) | 272 (58) | 2636 (48) | ||
| Sedentary lifestyle | 3620 (61) | 300 (64) | 3320 (61) | 0.2181 | |
| GFR |
74.28 |
65.36 |
75.05 |
||
| Family history of premature CAD | 2196 (37) | 202 (43) | 194 (36) | 0.0029 | |
| Current smoking | 3680 (62) | 348 (74) | 3332 (61) | ||
| History of PVD | 356 (6) | 70 (15) | 286 (5) | ||
| Symptom | |||||
| Nonanginal chest pain | 2732 (46) | 156 (33) | 2576 (47) | ||
| Atypical anginal | 2314 (39) | 188 (40) | 2126 (39) | ||
| Typical anginal | 890 (15) | 126 (27) | 764 (14) | ||
| ESC/EASD risk stratification | |||||
| Very high risk | 4096 (69) | 381 (81) | 3715 (68) | ||
| High risk | 653 (11) | 61 (13) | 592 (11) | ||
| Moderate risk | 356 (6) | 9 (2) | 347 (6) | ||
| Other risk | 831 (14) | 19 (4) | 812 (15) | ||
| HRCAD, high-risk coronary artery disease; CCTA, coronary computed tomographic
angiography. SBP, systolic blood pressure; PVD, peripheral vascular disease; GFR,
glomerular filtration rate. ESC/EASD, European Society of Cardiology and European
Association for the Society of Diabetes. Values are presented as n (%) unless stated otherwise. a: years, mean b: mmHg, mean c: mL/(min | |||||
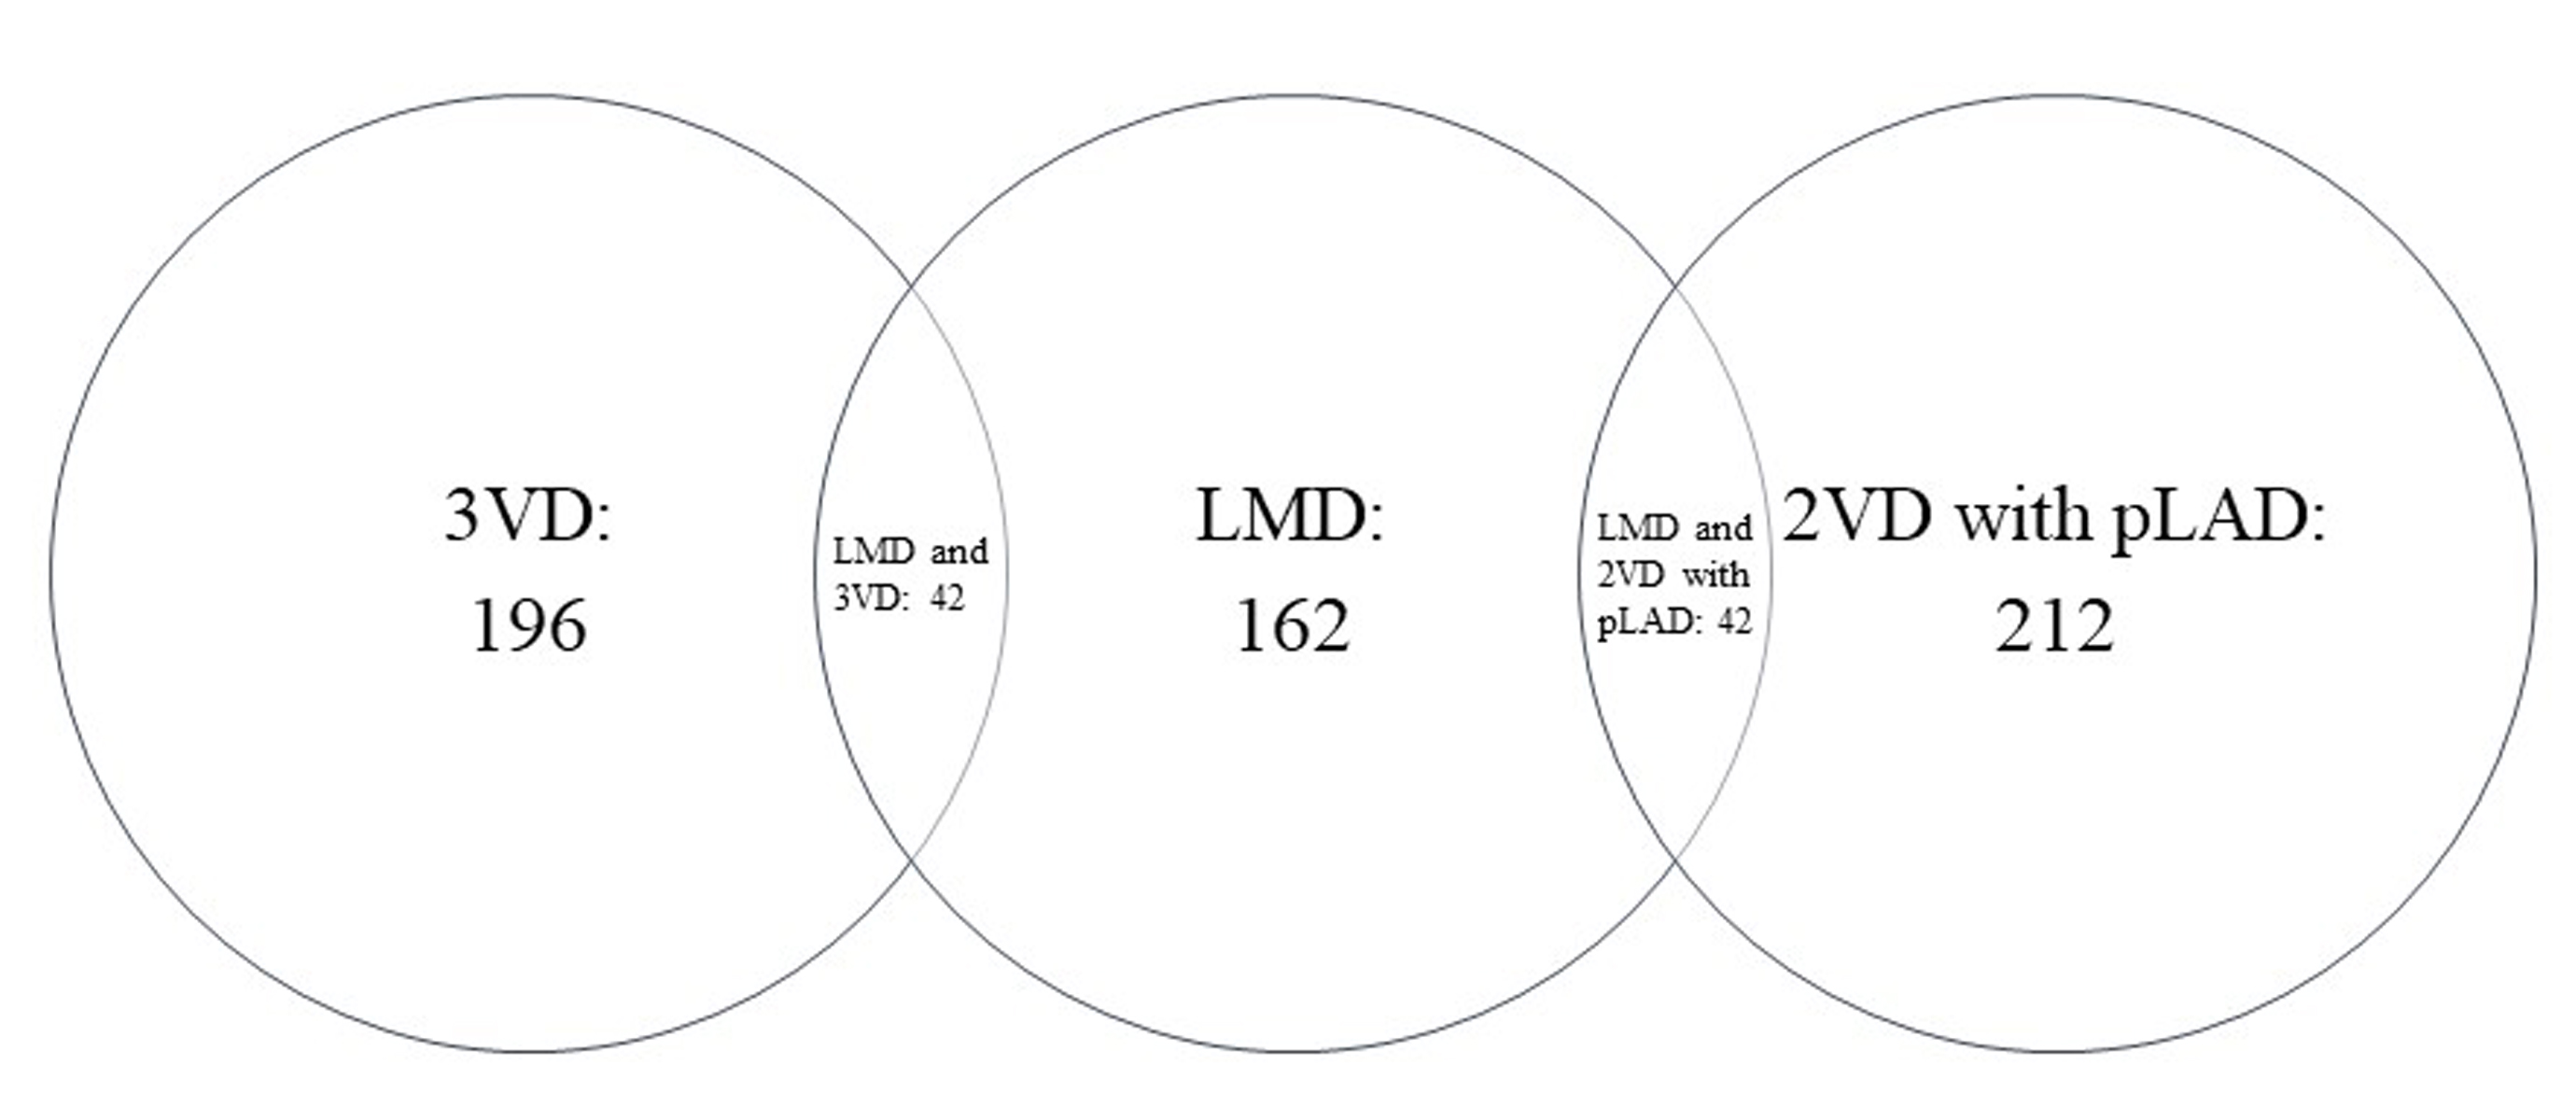 Fig. 1.
The distribution of HRCAD. HRCAD, high-risk coronary artery disease; LMD, left main coronary artery disease; 3VD, 3-vessel coronary artery disease; 2VD, 2-vessel coronary artery disease; pLAD, proximal left anterior descending coronary artery disease.
Comparisons of discrimination according to AUC and IDI are presented in Table 2.
The AUC for PHM was larger than that for CHM although this did not reach
statistical significance (0.744 v.s. 0.721, p = 0.0873). Compared to
CHM, PHM demonstrated a positive IDI (3.08%, p
| AUC | IDI | ||||||
| Statistic | 95% CI | p | PTP | Statistic |
p | ||
| HRCAD | Non-HRCAD | ||||||
| CHM | 0.721 | 0.699 to 0.740 | 0.0873 | 10.35% | 1.74% | 3.08% | |
| PHM | 0.744 | 0.726 to 0.769 | 12.61% | 0.92% | |||
| AUC, Area under the receiver operating characteristic curve; IDI, integrated
discrimination improvement; CI, confidence interval; CHM, CONFIRM high-risk
model; PHM, PROMISE high-risk model; other abbreviations as in Table 1. a: Compared to CHM, the IDI of PHM = [p(PHM | |||||||
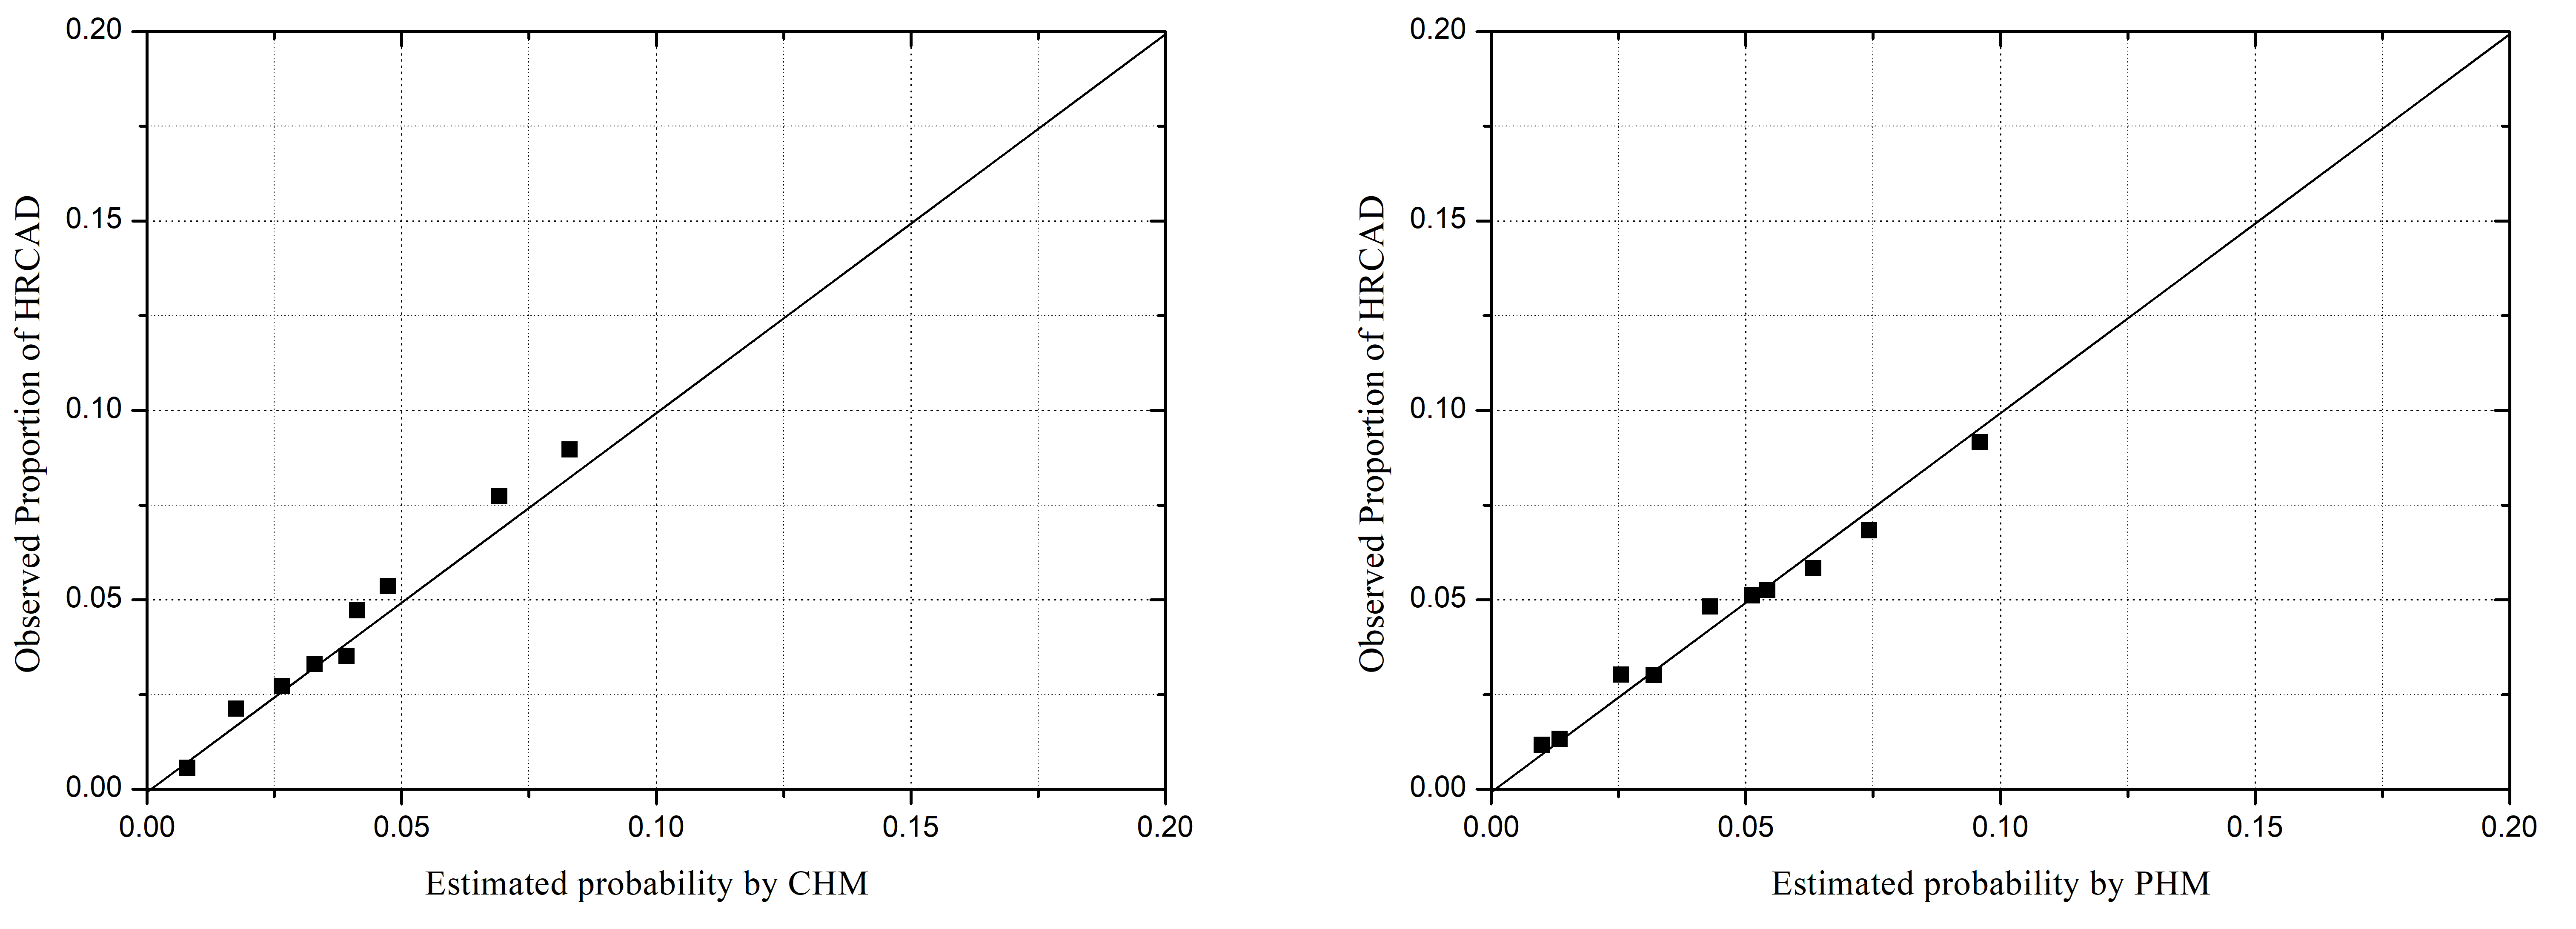 Fig. 2.
Model–specific predicted and observed probabilities of HRCAD,
by deciles of predicted probabilities. CHM, CONFIRM high-risk model; PHM,
PROMISE high-risk model; other abbreviations as in Fig. 1. Hosmer-Lemeshow
chi-square statistic: CHM: 35.81, p
Table 3 is the reclassification table comparing PHM to CHM. For 5466 patients
without HRCAD, PHM correctly reclassified 32 (12 + 16 + 4) from higher to lower
risk group, but 70 (62 + 2 + 6) from lower to higher compared to CHM. Of the 470
patients with HRCAD, 70 (16 + 8 + 46) were correctly reclassified to high risk
group but 8 (0 + 2 + 6) to low. Thus, compared to CHM, the NRI for PHM was
12.50% (p
| Risk groups by PHM | Reclassification |
NRI |
p | |||||||
| Low | Medium | High | Total | Up | Down | |||||
| Risk groups by CHM | ||||||||||
| Non-HRCAD | 1.28% | 0.59% | 12.50% | |||||||
| Low | 1430 | 62 | 6 | 1498 | ||||||
| Medium | 12 | 3856 | 2 | 3870 | ||||||
| High | 16 | 4 | 78 | 98 | ||||||
| Total | 1458 | 3922 | 86 | 5466 | ||||||
| HRCAD | 14.89% | 1.70% | ||||||||
| Low | 6 | 8 | 16 | 30 | ||||||
| Medium | 2 | 350 | 46 | 398 | ||||||
| High | 0 | 6 | 36 | 42 | ||||||
| Total | 8 | 364 | 98 | 470 | ||||||
| NRI, Net reclassification improvement; other abbreviations as in Table 2. a: The classification of patients by PHM was compared to that by CHM. b: NRI = [p(Up | ||||||||||
This subgroup analysis of the CCTA-based CICM-SCP registry completed in DM patients demonstrated that PHM was associated with a more accurate prediction of HRCAD. Compared to CHM, PHM revealed a similar AUC, less discrepancy between observed and predicted probabilities, a positive IDI and NRI, which might optimize downstream management strategy in these patients.
Once atherosclerosis is established in DM patients, it is associated with increased rates, extent, complexity and more rapid progression than non-DM patients. This results in more frequent HRCAD and poor clinical outcomes [1, 2, 3], which was supported by the higher rate of HRCAD in the present study than those in other general population-based studies [7, 8]. Thus, an accurate identification of HRCAD, rather than indiscriminately subjecting the entire gamut of DM patients to imaging or treatment procedures is particularly desirable, where appropriate allocation of limited health care resources to patients who are likely to derive the greatest benefit cannot be overemphasized in these high-risk patients [1, 2, 3, 4, 5, 19].
In conformity with PROMISE study, we found that two models had similar AUCs [8]. Although the difference between performances of the two models was moderate, CHM revealed a negative IDI and NRI, more discrepancy between observed and predicted probabilities when comparing to PHM. In fact, these analyses all implied that CHM underestimated the probabilities of HRCAD in DM patients. Although reasons for the suboptimal performance of CHM were multifactorial, the symptom evaluation should emerge as a particularly strong candidate. For the higher threshold of pain perceptual resulting from autonomic neuropathy, the association between HRCAD and symptom has been diminished, leading to an atypical presentation in DM patients [20]. Meanwhile, in the CONFIRM registry, a self-administered patient questionnaires were used to capture the symptom presentation, one-fourth of patients were asymptomatic and relatively low value was assigned to the symptom evaluation of chest pain [7]. Taking all these into consideration, underperformance of CHM in DM patients might be partly attributed to the suboptimal symptom evaluation, which was improved by PHM. Another potential reason for the better performance of PHM might be the inclusion of GFR, which has been demonstrated to have an important role in development of CAD [21]. As GFR declines, the prevalence and extent of CAD increases [22]. Moreover, the addition of GFR significantly improved the prediction of cardiovascular outcomes beyond traditional risk factors and the improvement was especially evident in patients with DM [23]. However, the impact of symptom evaluation and renal function on performance of the risk model to predict HRCAD need to be further validated.
It is crucial to clarify the models’ additive value to influence medical decision-making processes before advocating widespread application in regular practice [24]. In the present study, because of the underestimation for the probability of HRCAD, CHM classified 30 DM patients with HRCAD into low risk group. At this juncture, it is worth redirecting attention to the possible missed identification of HRCAD when promoting the translational implications of CHM. On the contrary, for 470 patients with HRCAD, PHM only classified 8 into low risk group, which might optimize downstream management strategy in these patients.
To further improve the prediction of HRCAD in DM patients, future studies may benefit from the followings. First, development of specific models in DM patients is likely to contribute more toward fully investigating the association between HRCAD and symptom [25]. Second, with the inclusion of some DM-specific risk factors, such as triglyceride-glucose index [26], the predictive ability of models might be improved significantly. Third, other novel markers, especially coronary artery calcium score, which are immediate manifestations of subclinical atherosclerosis, have shown the potential to improve the identification of CAD [10, 11, 12].
The present study has limitations that warrant acknowledgement. First, this was a subgroup analysis of an observational cohort. Although we conducted the CICM-SCP registry in two regional cardiovascular centers recognized as tertiary A level, those DM patients initially referred to other tests for assessment of SCP were not included, resulting in a selection bias. Second, CCTA usually overestimates the severity of CAD because of the excellent negative predictive value and the moderate positive predictive value compared with invasive coronary angiogram [27]. However, this made it presumable that CCTA offered robust reassurance for two model to exclude HRCAD. Third, the actual impact of applying two models in decision-making of clinical practice was complicated and the conclusions need to be confirmed in comparative cost-effectiveness analyses with long-term clinical outcome data.
In conclusion, PHM was associated with a more accurate prediction of HRCAD in symptomatic patients with DM, due to the better capability of classification and moderate improvement in discrimination and calibration. The application of PHM instead of CHM might optimize downstream management strategy in these patients.
HJ and JZ designed the study. HJ and JF wrote the manuscript. CF, YJ, PR and KR collected data. JZ revised the manuscript and provided help and advice on the statistical analysis. HJ, CF, YJ, JF, PR and KR analyzed the data. All authors read and approved the final manuscript.
All subjects gave their informed consent for inclusion before they participated in the study. The study was conducted in accordance with the Declaration of Helsinki, and the protocol was approved by the Ethics Committee of Tianjin Chest Hospital (approval number: 2017-KY-004).
We would like to express our gratitude to all those who helped us during the writing of this manuscript. Thanks to all the peer reviewers for their opinions and suggestions.
This study was supported by grants from Tianjin Medical Discipline Construction Project and Research Program of Tianjin Chest Hospital (2018XKC10).
The authors declare no conflict of interest.