
- Academic Editor
†These authors contributed equally.
Background: Hypertensive patients with obstructive sleep apnea (OSA)
are at a high risk of cardiovascular disease (CVD), but assessments of CVD risk
in this population are frequently constrained by the presence of comorbid medical
conditions. The noninvasive and convenient hepatic steatosis index (HSI) can not
only predict the degree of fatty liver degeneration but also correlates well with
the severity of numerous diseases. However, the relationship between the HSI and
CVD in hypertensive patients with OSA remains unclear. Methods: This
retrospective cohort study included patients aged
The number of people with hypertension worldwide in 2021 was estimated to be 1.4 billion [1], and the prevalence of obstructive sleep apnea (OSA) among hypertensive patients is 40% [2]. Hypertensive patients with OSA usually show a high risk of cardiovascular disease (CVD). In comparison with patients showing hypertension or OSA alone, those with both conditions are more susceptible to CVD and frequently experience more severe adverse cardiovascular events [3]. In addition, because OSA often occurs during nighttime sleep and is not easily noticed by patients, its prevalence is heavily underestimated [4]. Therefore, in addition to paying more attention to the population with hypertension and OSA, assessments of CVD prognosis in this population also need to be strengthened.
The pathophysiological mechanisms underlying OSA-induced increments in blood pressure can be summarized as follows: First, intermittent hypoxia caused by OSA leads to systemic oxidative stress, resulting in increased endothelin-1 production and decreased nitric oxide production in endothelial cells and causing increased peripheral arterial resistance [5, 6]. Second, recurrent episodes of hypoxemia and fragmented sleep induce sympathetic excitation, resulting in increased cardiac output and peripheral vasoconstriction [7]. Third, intermittent hypoxia can increase renin production through renal sympathetic excitation and thereby increase the levels of plasma angiotensin-II, which shows vasoconstrictor activity, and aldosterone, which shows sodium- and water-retention effects [8]. Fourth, intermittent hypoxia can result in vascular endothelial dysfunction and aberrant lipid metabolism, both of which are linked to atherosclerosis [9, 10]. All of these factors can contribute to hypertension, and the increased blood pressure can exacerbate these pathophysiological processes [9, 10, 11]. The pathophysiological mechanisms underlying OSA and hypertension overlap and reinforce one another, and the resulting cardiovascular damage is significantly greater than that caused by hypertension or OSA alone. Therefore, patients with both conditions constitute a high-risk CVD group that requires attention.
The assessment of groups showing high cardiovascular risk is currently based on the domestic and international clinical recommendations for CVD. However, in addition to necessitating comprehensive evaluations by professional physicians with extensive clinical experience, this approach also requires a number of tests and assessments of multiple inspection indicators as the basis for evaluation, limiting these evaluations to patients hospitalized in high-level hospitals. In China, however, a majority of the substantial population of patients with hypertension and OSA reside in rural areas with poor medical conditions, so they cannot be tested professionally. In addition, the evaluation group targeted by the clinical recommendations for CVD in China and overseas does not include patients with hypertension and OSA, and evaluations of this population lack specificity. These aspects indicate the urgent need for a practical, inexpensive, noninvasive, measurable, and more relevant methods for predicting and assessing the risk of CVD in hypertensive individuals with OSA.
The hepatic steatosis index (HSI), which is calculated using the formula HSI = 8 (alanine aminotransferase [ALT]/aspartate aminotransferase [AST] ratio) + body mass index (BMI) (+2, if female; +2, if diabetes) was originally used to evaluate hepatic steatosis [12]. While the HSI can effectively evaluate hepatic steatosis (its sensitivity and specificity for diagnosing nonalcoholic fatty liver disease are both above 90%), it has been also shown to be related to the severity of diseases such as type 2 diabetes, CVD, and organ injuries unrelated to hypertension [13, 14, 15, 16]. The aforementioned findings indicate an association between the HSI and other diseases, and suggest that this association is related to a high metabolic risk in the population. Although patients with OSA and hypertension are more likely to develop metabolic disorders [17, 18, 19, 20, 21], to our knowledge, no previous study has evaluated the relevance of the HSI in hypertensive patients with OSA. Thus, the purpose of this study was to use the HSI to assess the risk of major adverse cardiovascular and cerebrovascular events (MACCE) in hypertensive individuals with OSA.
The data for this investigation were obtained from the Urumqi Research on Sleep
Apnea and Hypertension (UROSAH) study, a retrospective cohort study of 3605
hypertensive patients at the Hypertension Center of People’s Hospital of Xinjiang
Uygur Autonomous Region. The inclusion and exclusion criteria and design details
of this cohort have been reported previously [22, 23]. A total of 3329
participants aged
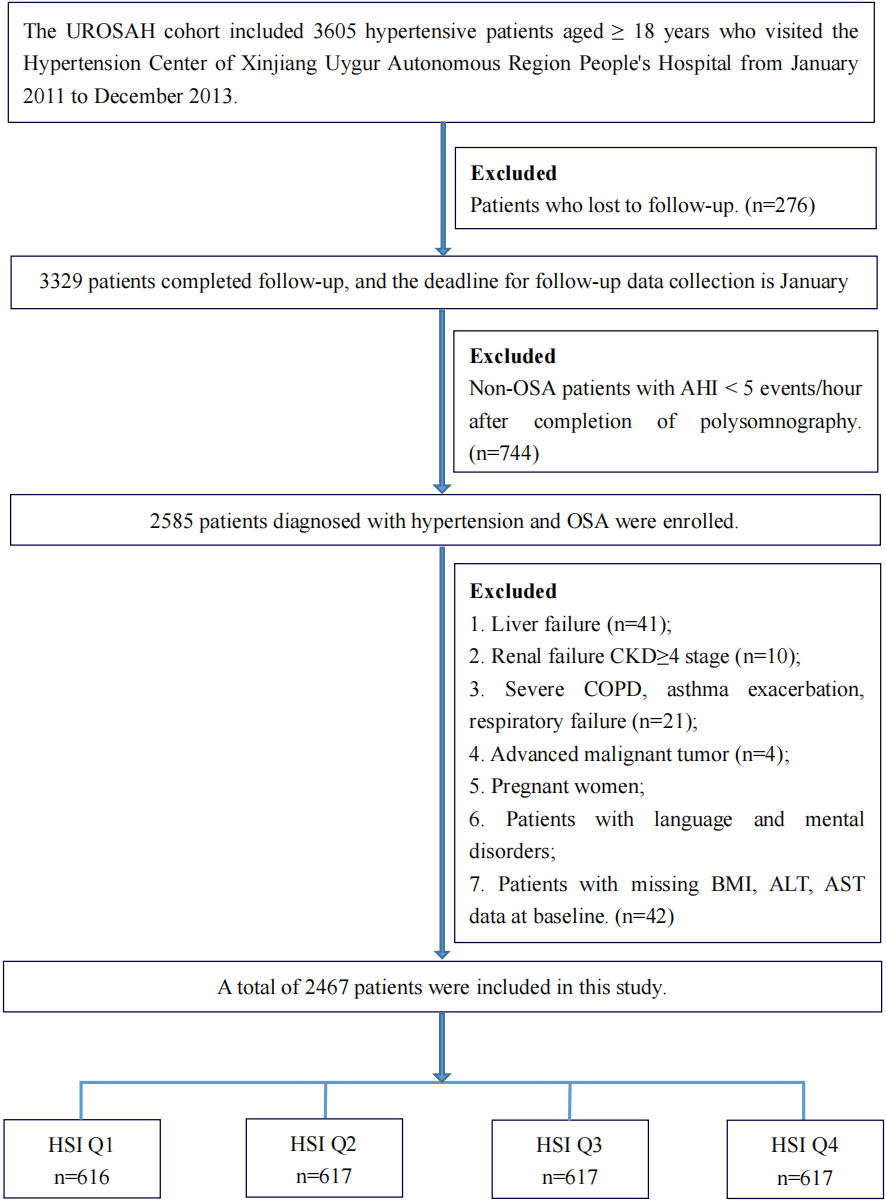 Fig. 1.
Flowchart of the study participants. Abbreviations: HSI, hepatic steatosis index; UROSAH, Urumqi Research on Sleep Apnea and Hypertension cohort; OSA, obstructive sleep apnea; AHI, apnea–hypopnea index; CKD, chronic kidney disease; COPD, chronic obstructive pulmonary disease; BMI, body mass index; AST, aspartate transaminase; ALT, alanine transaminase.
The baseline data collected included demographic information, previous medical
history, medication history, and laboratory test findings. The baseline
anthropometric measurements and laboratory testing procedures have been described
previously [22]. OSA was defined by a sleep AHI
Follow-up assessments were conducted by telephone, and the outpatient and inpatient medical records of all patients were collected. Patients were followed up until the occurrence of any of the endpoints of the study or until the end of the follow-up period in January 2021, whichever occurred first. The collected data included the latest blood pressure level, all clinical examination results, and the appearance of new or recurrent MACCE. MACCE were evaluated by collecting the inpatient medical records of the participants and were judged by more than two blinded high-level clinical experts. For deaths, the cause of death was determined from relatives of the deceased and verified by hospital death certificates, hospitalization data, or the local public security system. Illnesses (including death) and surgical procedures were classified using the 10th revision International Classification of Diseases codes (ICD-10) and clinical modification codes for procedures and procedures of the 9th revision of the International Classification of Diseases (ICD-9-CM-3). In this study, MACCE included nonfatal myocardial infarction (ICD-10 codes: I21.0–I21.4, I21.9, I22), coronary and cerebrovascular revascularization (ICD-9-CM-3 codes: 36.03, 36.04, 36.06, 36.07, 36.09, 36.11-36.14, 36.2, 36.3, 38.11, 38.12, 38.31, 38.32, 38.41, 38.42, 39.74, and 39.76), unstable angina (I20) or rehospitalization for heart failure (I11.0, I13.0, I13.2, I50.0, I50.1, I50.9), cardiac death, nonfatal stroke (I61, I62.0, I62.9, I63, I64, excluding I63.801), and brain-derived death. Cardiac events were defined as nonfatal myocardial infarction, revascularization, rehospitalization for unstable angina or heart failure, or cardiac death. Cerebrovascular events were defined as nonfatal stroke or brain-derived death. All endpoints were defined in accordance with the suggested definitions for standardized data-collection schemes in cardiovascular trials [27].
At discharge, patients were provided an individualized treatment plan and instructed to take their medications on time, consume a healthy diet, control their weight, increase their physical activity level appropriately, and self-measure their blood pressure daily at home. Patients with moderate-to-severe OSA at baseline were advised to use a continuous positive airway pressure (CPAP) ventilator, and those who consented to CPAP therapy received an individualized formulation for CPAP therapy. During outpatient, inpatient, or telephone follow-up visits, we evaluated the patients’ current conditions and recommended lifestyle, medication, blood pressure monitoring, and weight modifications. However, we did not obtain follow-up data on the CPAP therapy administered to the patients.
Continuous variables were reported using mean and standard deviation (SD) or
median and interquartile range (IQR), and analysis of variance and
Kruskal–Wallis H tests were used to compare groups. Categorical variables were
expressed as numbers and percentages, and chi-square tests were used for
comparisons between groups. Kaplan–Meier survival curves were used to estimate
survival probability for the primary outcome, and the log-rank test was performed
to analyze differences in survival between HSI groups. Potential connections
between the HSI and endpoint events were identified using generalized additive
models, while independent predictors of endpoint events were identified using
univariate and multivariate Cox proportional-hazard models. On the basis of the
initial model, we created two more models to account for various confounding
factors. Model 1 was adjusted for age and sex. Model 2 was further adjusted for
systolic blood pressure, diastolic blood pressure, heart rate, smoking and
alcohol consumption status, homocysteine (Hcy) level, OSA grade, and diabetes
history (with or without). The C-statistic, integrated discrimination improvement
(IDI), and net reclassification index (NRI) were obtained to assess the
prediction ability of HSI increments for endpoint events. Data were analyzed
using R (version 4.1.1, R Foundation for Statistical Computing, Vienna, Austria)
statistical software; all analyses were two-tailed, and p
Participants were divided into four groups (Q1–Q4) according to HSI quartiles,
and the average HSI value in groups Q1, Q2, Q3, and Q4 was 32.74
| Variable | Quartile 1 | Quartile 2 | Quartile 3 | Quartile 4 | p-value | |
| (23.42–35.49) | (35.5–39.27) | (39.28–43.42) | (43.43–68.25) | |||
| n = 616 | n = 617 | n = 617 | n = 617 | |||
| Age, years | 53.35 |
50.78 |
48.25 |
46.15 |
||
| Sex n (%) | 0.019 | |||||
| Female | 221 (35.88%) | 200 (32.41%) | 184 (29.82%) | 173 (28.04%) | ||
| Male | 395 (64.12%) | 417 (67.59%) | 433 (70.18%) | 444 (71.96%) | ||
| BMI, kg/m |
24.73 |
27.32 |
29.23 |
32.38 |
||
| NC, cm | 37.95 |
39.70 |
41.01 |
42.61 |
||
| WC, cm | 92.47 |
98.33 |
102.86 |
109.95 |
||
| Baseline SBP, mmHg | 133.84 |
133.51 |
134.45 |
133.80 |
0.762 | |
| Baseline DBP, mmHg | 85.00 |
84.80 |
85.86 |
85.64 |
0.276 | |
| Baseline heart rate, bpm | 76.36 |
75.86 |
76.26 |
75.99 |
0.759 | |
| ALT, U/L | 18.31 |
23.59 |
29.25 |
43.57 |
||
| AST, U/L | 21.66 |
20.91 |
21.70 |
25.26 |
||
| Cr, µmol/L | 75.54 |
76.74 |
77.27 |
79.28 |
0.010 | |
| BUN, mmol/L | 5.28 |
5.39 |
5.31 |
5.37 |
0.534 | |
| TC, mmol/L | 4.56 |
4.49 |
4.56 |
4.59 |
0.510 | |
| TG, mmol/L | 2.16 |
2.18 |
2.21 |
2.17 |
0.963 | |
| HDL-C, mmol/L | 1.11 |
1.10 |
1.12 |
1.09 |
0.204 | |
| LDL-C, mmol/L | 2.64 |
2.62 |
2.62 |
2.67 |
0.616 | |
| Hcy, mmol/L | 18.41 |
17.63 |
17.89 |
18.45 |
0.466 | |
| AHI, events/hour | 24.45 |
24.80 |
24.24 |
26.27 |
0.262 | |
| Mean SaO |
91.67 |
91.77 |
91.80 |
91.87 |
0.771 | |
| Lowest SaO |
77.56 |
77.41 |
77.93 |
77.52 |
0.758 | |
| Smoking status, n (%) | 0.010 | |||||
| Never | 371 (60.23%) | 361 (58.51%) | 341 (55.27%) | 340 (55.11%) | ||
| Past | 76 (12.34%) | 66 (10.70%) | 56 (9.08%) | 54 (8.75%) | ||
| Current | 169 (27.44%) | 190 (30.79%) | 220 (35.66%) | 223 (36.14%) | ||
| Drinking status,n (%) | 0.031 | |||||
| Never | 401 (65.10%) | 377 (61.10%) | 345 (55.92%) | 369 (59.81%) | ||
| Past | 38 (6.17%) | 41 (6.65%) | 48 (7.78%) | 55 (8.91%) | ||
| Current | 177 (28.73%) | 199 (32.25%) | 224 (36.30%) | 193 (31.28%) | ||
| OSA grade, n (%) | 0.608 | |||||
| Mild | 247 (40.10%) | 243 (39.38%) | 243 (39.38%) | 229 (37.12%) | ||
| Moderate | 181 (29.38%) | 170 (27.55%) | 192 (31.12%) | 180 (29.17%) | ||
| Severe | 188 (30.52%) | 204 (33.06%) | 182 (29.50%) | 208 (33.71%) | ||
| Duration of hypertension, years | 6.23 |
6.26 |
5.85 |
6.18 |
0.709 | |
| History of CVD, n (%) | 76 (12.34%) | 66 (10.70%) | 77 (12.48%) | 81 (13.13%) | 0.603 | |
| History of diabetes, n (%) | 42 (6.82%) | 85 (13.78%) | 131 (21.23%) | 190 (30.79%) | ||
| History of stroke, n (%) | 250 (40.58%) | 216 (35.01%) | 193 (31.28%) | 175 (28.36%) | ||
| Medication use, n (%) | ||||||
| ACEI/ARB | 263 (42.69%) | 287 (46.52%) | 292 (47.33%) | 302 (48.95%) | 0.156 | |
| 128 (20.78%) | 109 (17.67%) | 127 (20.58%) | 121 (19.61%) | 0.498 | ||
| CCB | 365 (59.25%) | 384 (62.24%) | 375 (60.78%) | 366 (59.32%) | 0.671 | |
| Diuretic | 47 (7.63%) | 71 (11.51%) | 69 (11.18%) | 61 (9.89%) | 0.096 | |
| Hypoglycemic drugs | 136 (22.08%) | 118 (19.12%) | 136 (22.04%) | 133 (21.56%) | 0.535 | |
| Antiplatelet drugs | 199 (32.31%) | 217 (35.17%) | 223 (36.14%) | 216 (35.01%) | 0.530 | |
| Lipid-lowering drugs | 204 (33.12%) | 225 (36.47%) | 218 (35.33%) | 227 (36.79%) | 0.526 | |
Notes: Values are presented as mean
Abbreviations: HSI, hepatic steatosis index; SBP, systolic blood pressure; DBP,
diastolic blood pressure; BMI, body mass index; NC, neck circumference; WC, waist
circumference; AST, aspartate transaminase; ALT, alanine transaminase; Cr,
creatinine; BUN, blood urea nitrogen; TG, triglyceride; TC, total cholesterol;
LDL-C, low-density lipoprotein cholesterol; HDL-C, high-density lipoprotein
cholesterol; Hcy, homocysteine; AHI, apnea–hypopnea index; mean SaO
The Kaplan–Meier curve showed that the risks of MACCE, cardiac events, and
cerebrovascular events in group Q4 were significantly higher than those in the
other groups (log-rank test, p
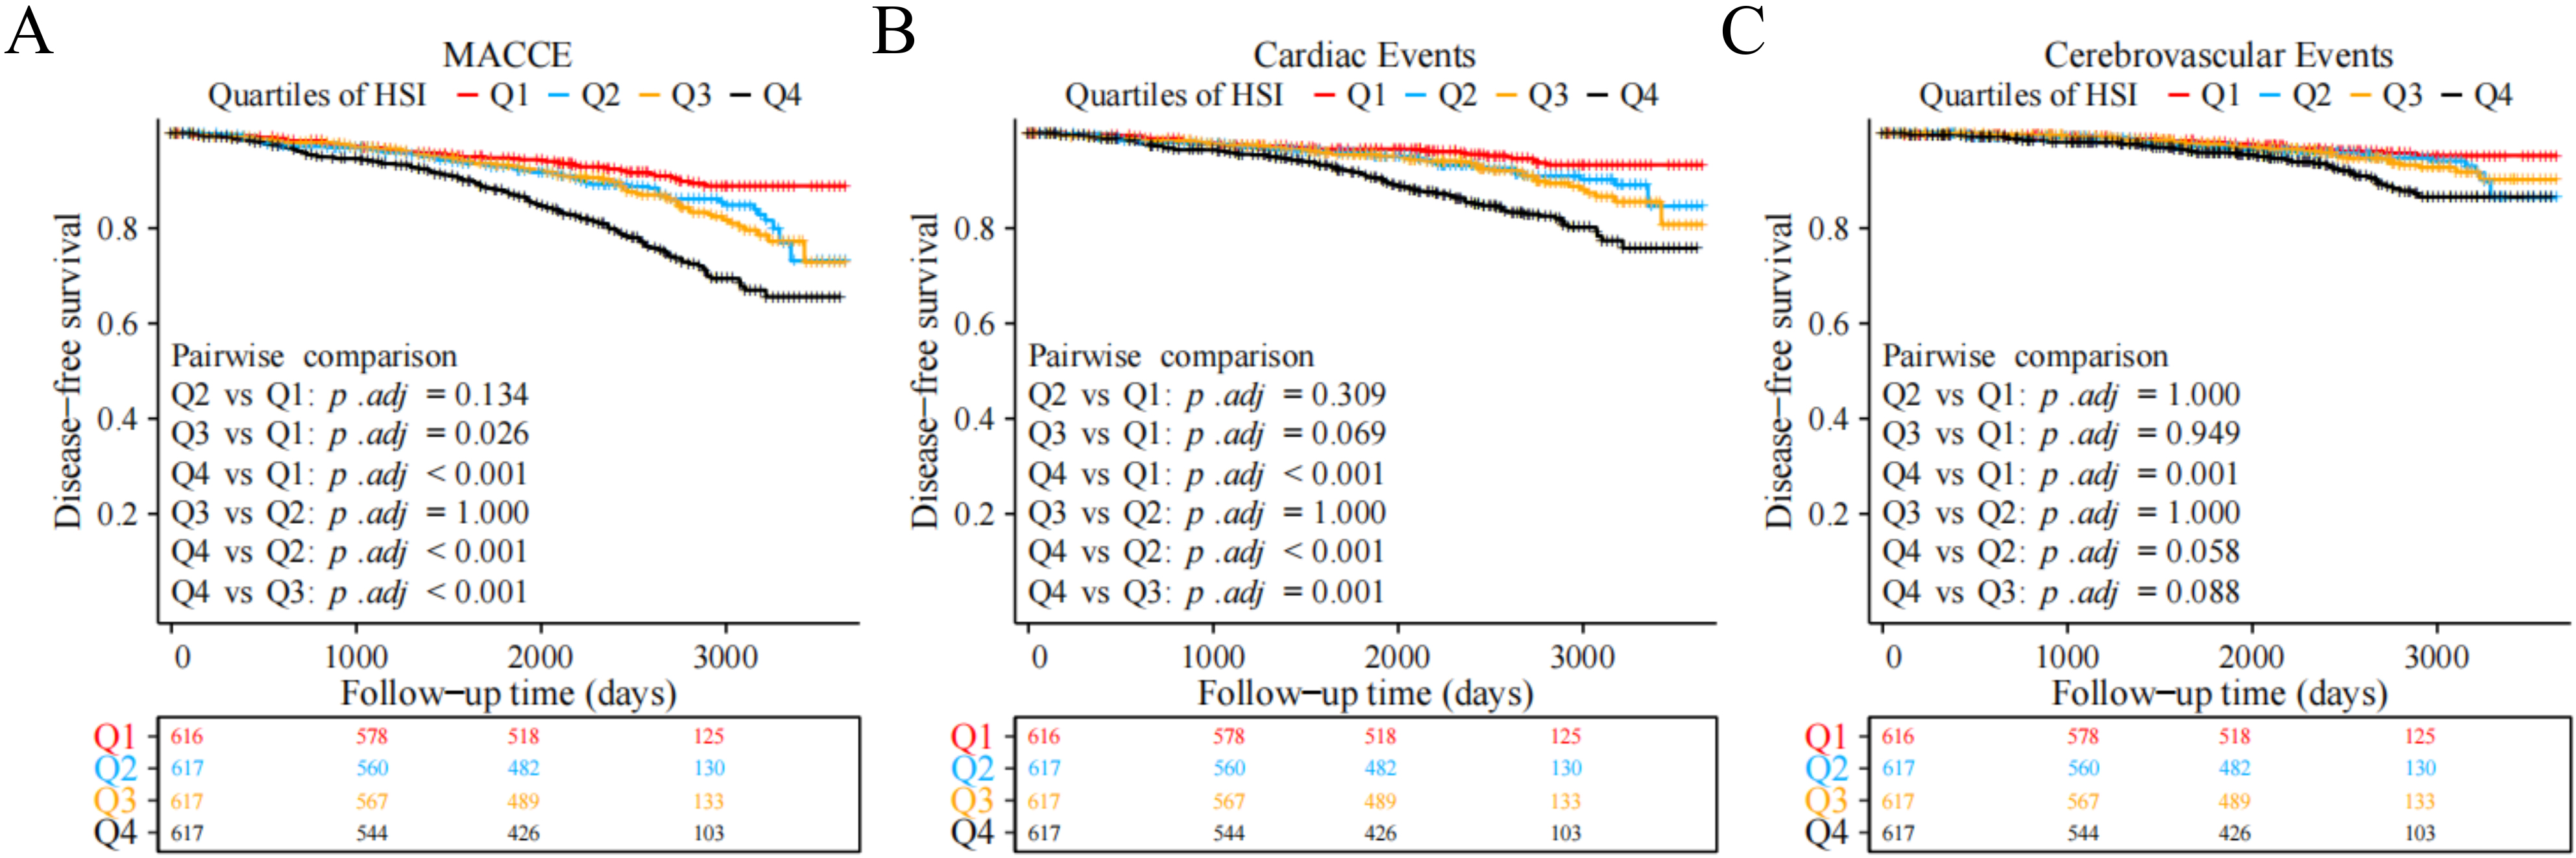 Fig. 2.
Kaplan–Meier survival curves of different endpoints across HSI quartile groups. (A) MACCE. (B) Cardiac events. (C) Cerebrovascular events. Abbreviations: HSI, hepatic steatosis index; MACCE, major adverse cardiovascular and cerebrovascular events.
We used the continuous variable value of the HSI as the risk score, divided the
population into low-risk and high-risk groups on the basis of the median, and
drew risk-factor maps for MACCE, cardiac events, and cerebrovascular events. The
results showed that during the median follow-up period of 81.96 months, 130
MACCE, 78 cardiac events, and 52 cerebrovascular events occurred in the low-risk
group and 226 MACCE, 145 cardiac events, and 81 cerebrovascular events occurred
in the high-risk group. As the HSI value increased, the frequencies of MACCE
(5.3% vs. 9.2%, p
 Fig. 3.
Risk-factor plot using continuous HSI values and different endpoints. (A) MACCE. (B) Cardiac events. (C) Cerebrovascular events. Abbreviations: HSI, hepatic steatosis index; MACCE, major adverse cardiovascular and cerebrovascular events. Non-MACCE, patients with no MACCE; CAR, patients with cardiac events; Non-CAR, patients with no cardiac events; CV, patients with cerebrovascular events; Non-CV, patients with no cerebrovascular events.
Before developing the Cox model, we assessed the collinearity of the covariates
using the variance inflation factor (VIF). A VIF
| Variable | Non-adjusted | Adjusted model I | Adjusted model II | ||||
| HR (95% CI) | p-value | HR (95% CI) | p-value | HR (95% CI) | p-value | ||
| HSI (Per 1 SD increase) | 1.49 (1.35, 1.64) | 1.57 (1.42, 1.74) | 1.43 (1.26, 1.62) | ||||
| Quartiles of HSI | |||||||
| Q1 | 1.0 | 1.0 | 1.0 | ||||
| Q2 | 1.50 (1.06, 2.13) | 0.023 | 1.60 (1.12, 2.28) | 1.63 (1.09, 2.44) | 0.017 | ||
| Q3 | 1.64 (1.17, 2.31) | 0.005 | 1.82 (1.28, 2.58) | 1.71 (1.14, 2.55) | 0.009 | ||
| Q4 | 2.99 (2.18, 4.11) | 3.44 (2.48, 4.78) | 2.95 (1.99, 4.39) | ||||
Abbreviations: SBP, systolic blood pressure; DBP, diastolic blood pressure; Hcy, homocysteine; OSA, obstructive sleep apnea; HSI, hepatic steatosis index; MACCE, major adverse cardiovascular and cerebrovascular events; HR, hazard ratio; 95% CI, 95% confidence interval.
The non-adjusted model did not include adjustments for any factor.
Adjusted model I was adjusted for age and sex.
Adjusted model II was adjusted for age, sex, history of diabetes, smoking status, alcohol consumption status, baseline SBP, baseline DBP, baseline heart rate, Hcy level, and OSA grade.
To clarify the potential relationship between continuous increments in HSI values and endpoint events, we further established a generalized additive model with adjustments for age, sex, baseline systolic blood pressure, diastolic blood pressure, heart rate, BMI, Hcy level, smoking and alcohol consumption status, OSA classification, and history of diabetes, and the results showed that the HSI was linearly associated with the occurrence of endpoint events, especially for cerebrovascular events (Fig. 4).
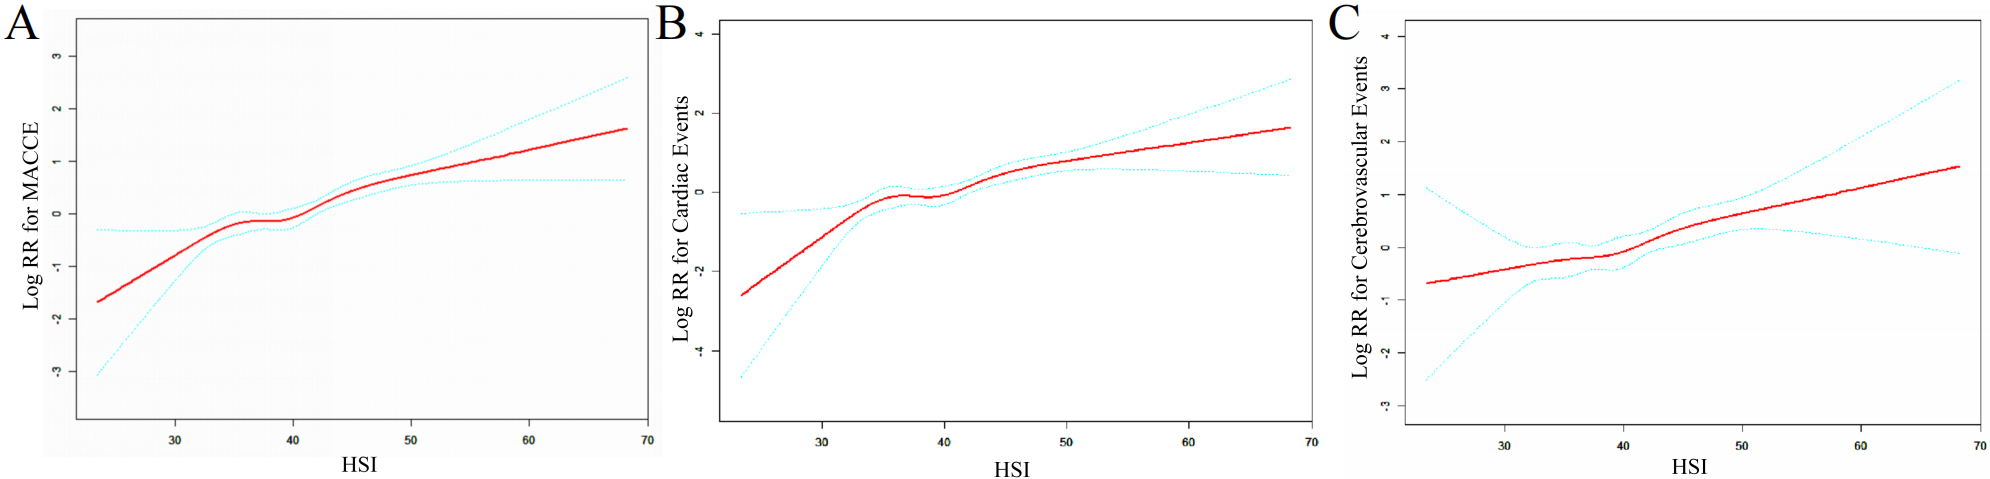 Fig. 4.
Dose–response relationship between the HSI and the risk of different endpoint events. (A) MACCE; (B) cardiac events; (C) cerebrovascular events. Abbreviations: RR, relative risk; HSI, hepatic steatosis index; MACCE, major adverse cardiovascular and cerebrovascular events.
Table 3 shows that in comparison with the traditional model (adjusted for age,
sex, smoking status, alcohol consumption status, history of diabetes, SBP, DBP,
heart rate, Hcy level, OSA grade at the baseline), the discriminant and
classification performances of the model with the HSI were higher for endpoint
events. After adding the HSI, for MACCE events, the C-statistic increased from
0.609 (95% CI: 0.578–0.640) to 0.649 (95% CI: 0.618–0.680; p
| C-Statistic (95% CI) | p-value | IDI | p-value | Continuous-NRI | p-value | ||
| MACCE | |||||||
| Conventional model | 0.609 (0.578, 0.640) | — | Ref | — | Ref | — | |
| Conventional model + HSI | 0.649 (0.618, 0.680) | <0.001 | 0.030 (0.016, 0.048) | <0.001 | 0.153 (0.087, 0.228) | ||
| Cardiac events | |||||||
| Conventional model | 0.643 (0.606, 0.680) | — | Ref | — | Ref | — | |
| Conventional model + HSI | 0.672 (0.632, 0.711) | 0.024 (0.011, 0.044) | <0.001 | 0.136 (0.062, 0.237) | |||
| Cerebrovascular event | |||||||
| Conventional model | 0.608 (0.555, 0.661) | — | Ref | — | Ref | — | |
| Conventional model + HSI | 0.641 (0.590, 0.692) | 0.015 (0.004, 0.038) | 0.170 (0.087, 0.282) | 0.002 | |||
Notes: The conventional model was adjusted for age, sex, smoking status, alcohol consumption status, history of diabetes, systolic blood pressure, diastolic blood pressure, heart rate, homocysteine level, and obstructive sleep apnea grade at baseline.
Abbreviations: IDI, integrated discrimination improvement; NRI, net reclassification index; HSI, hepatic steatosis index; MACCE, major adverse cardiovascular and cerebrovascular events.
China has a large population of hypertensive patients with OSA, and this population often shows multiple risk factors that promote each other and further increase the risk of CVD and serious cardiovascular adverse events [28, 29]. However, the current clinical guidelines do not include assessments of serious cardiovascular adverse events in hypertensive patients with OSA. Therefore, this study used a retrospective cohort to characterize the relationship between the HSI and MACCE in a hypertensive population with OSA. Our results showed that an increase in the HSI value was independently associated with an increased risk of MACCE. The risk of MACCE in the highest HSI quartile was 2.95 times that in the lowest quartile. We observed similar results and trends when the study endpoints were subdivided into cardiac and cerebrovascular events and observed a linear relationship between the HSI and the risk of MACCE. More importantly, in comparison with the traditional model composed of risk factors, addition of the HSI was shown to increase the predictive power for MACCE.
Our results showed that patients with higher HSI values had a greater likelihood
of MACCE. This outcome remained unchanged irrespective of whether the HSI was
considered a categorical or continuous variable. In a cross-sectional study of
healthy individuals, Kweon et al. [14] reported that participants with
HSI
The HSI was originally a noninvasive index used to assess nonalcoholic fatty liver disease, and higher HSI values indicated more pronounced hepatic steatosis [12]. In addition to being directly associated with a nonalcoholic fatty liver, the HSI is also intimately associated with the development and occurrence of other disorders. Cai et al. [13] discovered that a 1-SD increase in the HSI in a healthy group was related to a 62% greater chance of developing diabetes. In addition, Han et al. [47] found that dynamic monitoring of the HSI can more accurately predict the onset of diabetes. The HSI is also independently linked to decreased bone mineral density, dementia, asthma, and sarcopenia [48, 49, 50, 51]. These studies have shown that the HSI can not only be used as a predictor of adverse diseases, but its ability to predict adverse events is not disease-specific. Therefore, we utilized the HSI reliably to assess CVD risk. In addition, we assessed the discriminative performance of the model after incorporating the HSI by evaluating the C-statistic, NRI, and IDI, and using other approaches, and the assessments yielded ideal outcomes.
This study had the following strengths. First, it was a retrospective cohort study with a large sample size of a special population with hypertension and OSA, and the results were relatively stable and reliable after statistical adjustments for confounding variables. Second, after adjusting for multiple confounding variables, HSI was independently associated with MACCE in the hypertensive OSA population. Third, using the C-statistic, IDI, and NRI, our findings validated the superior discriminatory ability of the model including the HSI in comparison with the conventional model, lending credence to the notion that the HSI is a better predictor for patients with hypertension and OSA. However, this study also had the following limitations: First, this was a retrospective single-center cohort study that was subject to the limitations of nonrandomized trials; therefore, the results should be interpreted with caution. However, every effort was made to ensure the reliability of the findings by adjusting for confounding factors using statistical methods. Second, we only investigated the association between the HSI and MACCE at baseline; however, factors such as medication, lifestyle, weight changes, and the presence or absence of CPAP treatment during patient follow-up could contribute to reverse causality. Consequently, our next line of inquiry will focus on time-dependent HSI variations and the associated influencing factors. Third, the study population consisted of patients with hypertension and OSA from western China, and the prevalence of hypertension, OSA, and CVD can be affected by local diet, lifestyle, and ethnicity, which can strengthen or weaken the association between the HSI and MACCE. Therefore, the findings of this study are not applicable to other populations, but they indicate the need for long-term clinical evaluation of specific patient populations, such as those with hypertension with OSA. Fourth, the paucity of liver-related imaging data in this study precluded further imaging-based evaluation of the severity of hepatic steatosis in patients. Fifth, genetic background can also influence hypertension, OSA, metabolic diseases, and CVD; however, our study did not evaluate genetic factors; therefore, the use of methods such as Mendelian randomization may provide new genetic-level insights into the observed results.
Among patients showing a combination of hypertension and OSA, those with high HSI were at an increased risk of CVD, and HSI showed a linear relationship with the risk of MACCE. Therefore, patients showing hypertension combined with OSA should undergo HSI evaluations as early as possible, and early intervention on the basis of the HSI levels should be provided to prevent adverse cardiovascular events.
The data of this study are available from the corresponding author upon reasonable request.
Conceptualization (NL, WW and XC). Methodology (XC and QZ). Initials formal analysis and investigation (WW). Writing—original draft preparation (WW). Writing—review and editing (WW and XC). Funding acquisition (JHu). Resources (JHong). Supervision (NL and XZ). All authors contributed to the study conception and design, revised the draft critically for important in intellectual content, and approved the final manuscript. All authors have participated sufficiently the work and agreed to be accountable for all aspects of the work.
The study obtained the consent of all participants and was approved by the Medical Ethics Committee of the People’s Hospital of Xinjiang Uygur Autonomous Region (ethical approval number: 2019030662). The study strictly adhered to the ethical standards of the Declaration of Helsinki.
We appreciate all those who contributed and assisted with the UROSAH. We thank Dr. Kainan Zhang for statistical assistance with the preliminary data for this article.
This research was funded by the Natural Science Foundation of Xinjiang Uygur Autonomous Region, grant number 2021D01C173.
The authors declare no conflict of interest.
Publisher’s Note: IMR Press stays neutral with regard to jurisdictional claims in published maps and institutional affiliations.