
- Academic Editor
†These authors contributed equally.
Background: Exercise capacity reflects the cardiovascular risk after
myocardial infarction (MI). The study aims to evaluate the impact of
sleep-disordered breathing (SDB) on exercise capacity after MI. Methods:
Consecutive patients referring to outpatient cardiac rehabilitation up to 28 days
after MI and participating in the Polish Managed Care after Acute Myocardial
Infarction (MC-AMI) program were included. On admission, we assessed the presence
and the severity of SDB using the home sleep apnea test (HSAT), patients’ maximum
exercise capacity on a treadmill exercise stress test (EST), and a 6-minute walk
test (6MWT), as well as the effect of SDB on the results obtained. In the
multivariate analysis, we verified the strength of the observed associations
concerning age, anthropometric parameters, and left ventricular ejection fraction
(LVEF). Results: A total of 254 patients aged 60.00 (interquartile range
51.00–67.00), including 39 (15.4%) women, with technically adequate HSAT,
constituted the study group. Mild SDB was found in 82 (32.3%), moderate in 54
(21.3%), and severe in 51 (20.1%) patients. Among those diagnosed with SDB,
obstructive sleep apnea (OSA) was dominant in 167 (89.8%). With the worsening of
SDB, the distance in 6MWT and the maximum physical exertion achieved in EST,
expressed in metabolic equivalents (METs) and maximal heart rate (MHR),
decreased. The linear regression analysis confirmed the following: (1) inversely
proportional relationship between the respiratory event index and METs, MHR, and
6MWT distance (p = 0.005, p = 0.008, and p = 0.004),
and the maximum apnea duration and MET and 6MWT distance (p = 0.042 and
p = 0.002); and (2) directly proportional relationship between mean
arterial oxygen saturation (SpO
Exercise capacity reflects general fitness and body health and depends on the functions of the cardiovascular (CV), respiratory, and musculoskeletal systems [1]. Low physical activity and cardiorespiratory fitness (CRF) are strong and independent predictors of CV diseases, coronary artery events, and all-cause or CV mortality in the general population [1, 2, 3, 4]. Importantly, in patients with CV diseases, including coronary artery disease (CAD), the maximum exercise capacity achieved by cardiopulmonary exercise testing (CPET) typifies the risk of all-cause mortality [1, 5]. Exercise capacity is affected by age, sex, body mass index (BMI), and some comorbidities [6, 7, 8]. One of them is sleep-disordered breathing (SDB), predominantly obstructive sleep apnea (OSA) [9, 10, 11]. Poorer exercise capacity measured in metabolic equivalents (METs) is also a predictor of increased all-cause mortality in patients with SDB, particularly in the presence of CAD [12].
SDB is common in patients with CAD [13, 14, 15, 16], including cardiac rehabilitation (CR) participants [17, 18, 19]. SDB, a chronic disorder, consists of repeated apnea and hypopnea during sleep, with subsequent desaturation and cardiovascular autonomic imbalance [20, 21]. The disorder is accompanied by oxidative stress, chronic inflammation, insulin resistance, endothelial dysfunction, platelet aggregation abnormalities, arterial stiffness, resistant hypertension (HA), and increased atherosclerotic CV risk [15, 20, 21]. SDB was recognized as a risk factor for increased mortality in CAD patients [22, 23]. The presence of advanced OSA after myocardial infarction (MI) promotes left ventricular (LV) remodeling with LV dilatation and the development of heart failure (HF) with reduced LV ejection fraction (HFrEF) [24]. In turn, resistant HA causes LV hypertrophy with subsequent HF with preserved LV ejection fraction and atrial fibrillation (AF) episodes [25, 26]. Both factors limit the exercise capacity of post-MI patients. Moreover, some studies suggest an abnormal CV exercise response in SDB patients, including chronotropic incompetence [9, 27, 28] and inadequate increase in blood pressure (BP) [27, 28, 29, 30]. Another cardiac impairment factor may be nocturnal hypoxia [31]. Furthermore, skeletal muscle structure and function may likely be altered in SDB patients with chronic severe hypoxia and harm performance and exercise tolerance [32]. SDB is more common in older people with multimorbidity who are overweight or obese, which can further impair CRF [33, 34]. Sleep fragmentation also leads to excessive daytime sleepiness, concentration and memory deterioration, fatigue, tiredness, and lack of energy, possibly worsening compliance with CV pharmacotherapy, lifestyle changes, and physical activity after MI [35, 36]. However, whether SDB has a significant effect on exercise capacity in patients after MI remains unclear.
The study aims to evaluate the impact of SDB on the initial exercise capacity of patients referred for cardiac rehabilitation after MI.
We evaluated consecutive patients referred for CR and hospitalized in the Day Treatment Cardiac Rehabilitation Department of the Upper-Silesian Medical Center (Katowice, Poland). The inclusion criteria for the study were a history of MI (up to 28 days before admission) and participation in the Polish Cardiac Society, the National Health Fund, and the Ministry of Health’s comprehensive Managed Care after Acute Myocardial Infarction (MC-AMI, KOS-ZAWAL) program [37]. The MC-AMI program provides early CR and one-year extensive cardiac care to patients diagnosed with MI, regardless of its type (ST-elevation MI or non-ST-elevation MI) and the treatment method in the acute period (procedural or conservative). According to the program’s rules, outpatient CR does not include patients with HF with significantly reduced LV ejection fraction (LVEF), especially below 35%, or in Functional Class IV in New York Heart Association (NYHA) and patients needing overnight care. In addition, patients with incomplete coronary revascularization and low coronary flow reserve by treadmill exercise stress test (EST) or with signs and symptoms of circulatory decompensation (i.e., pulmonary congestion or severe peripheral edema) were excluded from CR. They were referred for retreatment in the cardiology department. Moreover, the exclusion criteria for the study included the current treatment of SDB with positive airway pressure (PAP) or intraoral devices.
We used anthropometric and echocardiographic measurements and data concerning comorbidities from medical records collected upon admission to the rehabilitation department.
Then we assessed the presence and severity of SDB in a studied cohort with a
portable polysomnography system (Alice NightOne, Philips Respironics) used as a
Home Sleep Apnea Test (HSAT) [38]. The HSAT recordings were analyzed manually
following the recommendations of the American Academy of Sleep Medicine [38]. We
defined sleep apnea as a 90%–100% reduction in airflow through the airway for
at least 10 s. Episodes of apnea with preserved breathing movements were
classified as obstructive, while those without breathing movements were
classified as central. We noted hypopnea when there was a decrease in the airflow
by 30% that lasted
Next, we estimated the patients’ maximum exercise capacity on a treadmill EST with electrocardiography and BP monitoring (according to the modified Bruce protocol) [39] and a six-minute walk test (6MWT) [40]. We presented exercise capacity as an estimated amount of oxygen consumed in METs, maximum heart rate (MHR), and its percentage adjusted to age (MHR%) obtained in EST and as a distance in meters (m) in a 6MWT. Then we assessed the effect of SDB on the results obtained. In the multivariate analysis, we verified the strength of the observed associations concerning age, anthropometric parameters, and LVEF.
The results were analyzed using MedCalc Version 22.006 (MedCalc Software Ltd.,
Ostend, Belgium). The quantitative parameters were presented as the median and
interquartile range (IQR). Qualitative data were expressed as numbers and
percentages. The normality of the distribution of the variables was assessed with
the Kolmogorov-Smirnov test. Differences in the frequency and size of
anthropometric and HSAT parameters, maximum exercise capacity parameters, LVEF,
and coexisting diseases by SDB severity were calculated using the chi-square test
with the Cochran–Armitage test for trend or the Kruskal–Wallis test with the
Conover post-hoc analysis and the Jonckheere–Terpstra test for trend.
Independent risk factors for impaired exercise capacity were determined using
univariable and multivariable regression analysis, with candidate variables of
age, male sex, body weight, BMI, LVEF, REI, average and maximal apnea episode
duration, average and minimal SpO
Initially, 264 Caucasians aged
SDB was found in 187 (73.6%) patients in the study group: mild in 82 (32.3%), moderate in 54 (21.3%), and severe in 51 (20.1%). Moderate and severe SDB were more common in men than women, p = 0.031. Among the SDB patients, OSA was dominant in 167 (89.8%), and central sleep apnea (CSA) in 19 (10.2%).
SDB severity tended to increase with age, BMI, and neck circumference, with a
significant difference in BMI and neck circumference between the subgroup without
SDB and those with severe SDB in a head-to-head comparison (Table 1). However,
patients with severe SDB did not differ in comorbidities except for incidences of
diabetes (trend) (Table 2). CSA was more common in patients with HFrEF (8
[36.4%]) than others (12 [7.2%]), p
| Predictor | All participants | SDB severity | p-value for trend | |||
| None | Mild | Moderate | Severe | |||
| (I) | (II) | (III) | (IV) | |||
| no (%) | 254 | 67 (26.4) | 82 (32.3) | 54 (21.3) | 51 (20.1) | |
| Age (years), M (IQR) | 60.00 (51.00–67.00) | 58.00 (47.00–65.75) | 59.50 (52.00–66.00) | 59.50 (53.00–67.00) | 62.00 (53.00–69.00) | 0.017 |
| Sex (male), no (%) | 215 (84.6) | 51 (76.1) | 69 (84.1) | 50 (92.6) | 45 (88.2) | 0.027 |
| Body mass (kg), M (IQR) | 87.60 (78.00–98.00) | 84.20 (73.35–96.60) | 88.15 (78.00–98.70) | 88.75 (78.50–98.00) | 91.00 (79.95–102.33) | 0.016 |
| BMI (kg/m |
28.91 (26.31–32.10) | 28.20 (25.42–30.30) | 28.65 (26.10–33.00) | 29.35 (26.70–31.95) | 30.00 (26.93–34.94) | 0.004 |
| I ≠ IV | ||||||
| Neck (cm), M (IQR) | 42.00 (40.00–44.00) | 41.00 (38.25–43.00) | 42.00 (40.00–44.00) | 43.00 (40.50–45.00) | 43.00 (41.00–44.38) | |
| I ≠ II, I ≠ III, I ≠ IV | ||||||
The results are given for all cases and for each of the subgroups. BMI, body
mass index; M, median; Neck, neck circumference; no, number; IQR,
interquartile range; SDB, sleep-disordered breathing;
| Predictor | All participants | SDB severity | p-value for trend | |||
| None | Mild | Moderate | Severe | |||
| No (%) | 254 | 67 (26.4) | 82 (32.3) | 54 (21.3) | 51 (20.1) | |
| MI, no (%) | 254 (100.0) | 67 (100.0) | 82 (100.0) | 54 (100.0) | 51 (100.0) | |
| Hypertension, no (%) | 208 (81.9) | 50 (74.6) | 69 (84.1) | 43 (79.6) | 46 (90.2) | 0.066 |
| HFmrEF, no (%) | 48 (18.9) | 9 (13.4) | 20 (24.4) | 11 (20.4) | 8 (15.7) | 0.058 |
| HFrEF, no (%) | 24 (9.4) | 3 (4.5) | 8 (9.8) | 5 (9.3) | 8 (15.7) | 0.392 |
| AF, no (%) | 16 (6.3) | 4 (6.0) | 4 (4.9) | 3 (5.6) | 5 (9.8) | 0.415 |
| Stroke, no (%) | 7 (2.8) | 1 (1.5) | 1 (1.2) | 3 (5.6) | 2 (3.9) | 0.206 |
| Diabetes, no (%) | 56 (22.0) | 10 (14.9) | 17 (20.7) | 14 (25.9) | 15 (29.4) | 0.043 |
| CKD, no (%) | 16 (6.9) | 7 (10.9) | 2 (2.6) | 3 (6.2) | 4 (9.1) | 0.819 |
| Hypercholesterolemia |
161 (69.1) | 47 (73.4) | 50 (64.9) | 30 (62.5) | 34 (77.3) | 0.868 |
| COPD, no (%) | 12 (4.7) | 3 (4.5) | 4 (4.9) | 5 (9.3) | 0 (0.0) | 0.544 |
| Osteoarthritis, no (%) | 17 (7.3) | 3 (4.7) | 10 (13.0) | 0 (0.0) | 4 (9.1) | 0.952 |
| Smoking status |
83 (32.7) | 29 (43.3) | 24 (29.3) | 17 (31.5) | 13 (25.5) | 0.061 |
The results are given for all cases and for each of the subgroups.
Table 3 reflects changes in HSAT parameters per SDB severity. The differences between subgroups, especially without or mild SDB, and those with severe SDB were significant for most parameters. The evaluation of trends confirmed the worsening of respiratory parameters with increasing SDB severity based on REI. Table 4 presents the characteristics of the maximum exercise capacity parameters and LVEF per SDB severity. As SDB worsened, the 6MWT distance and the maximum physical exertion achieved in EST, expressed in METs and MHR, tended to decrease. The 6MWT, METs, and MHR median values differed between the subgroup of patients with severe SDB and the others. However, there were no differences in the MHR% achieved. In addition, as the SDB severity increased, so did the degree of fatigue/dyspnea assessed on Borg’s scale.
| Predictor | All participants | SDB severity | p-value for trend | |||
| None | Mild | Moderate | Severe | |||
| (I) | (II) | (III) | (IV) | |||
| No (%) | 254 | 67 (26.4) | 82 (32.3) | 54 (21.3) | 51 (20.1) | |
| REI (events/hour), M (IQR) | 11.25 (4.90–25.40) | 2.30 (1.53–3.78) | 9.10 (6.90–11.40) | 20.25 (17.90–25.30) | 41.90 (33.93–50.35) | |
| I ≠ II, I ≠ III, I ≠ IV | ||||||
| Participants with OSA/CSA, no (%) | 168 (66.1)/19 (7.5) | – | 76 (92.7)/6 (7.3) | 48 (88.9)/6 (11.1) | 44 (86.3)/7 (13.7) | 0.225 |
| Average episode duration (s), M (IQR) | 21.90 (18.20–25.70) | 18.80 (15.10–25.48) | 22.90 (19.50–26.60) | 21.30 (19.30–24.50) | 22.70 (19.38–25.38) | 0.009 |
| I ≠ II, I ≠ IV | ||||||
| Max episode duration (s), M (IQR) | 54.50 (42.00–74.00) | 36.50 (22.75–55.75) | 57.50 (43.38–73.63) | 54.75 (46.00–76.50) | 65.00 (56.00–88.38) | |
| I ≠ II, I ≠ III, I ≠ IV, II ≠ IV, III ≠ IV | ||||||
| Average SpO |
93.00 (92.00–94.00) | 93.00 (92.00–95.00) | 93.00 (92.00–94.00) | 93.00 (92.00–94.00) | 92.50 (91.00–94.00) | 0.003 |
| I ≠ IV, II ≠ IV, III ≠ IV | ||||||
| Minimal SpO |
85.00 (82.00–88.00) | 88.00 (84.00–90.00) | 85.00 (83.00–88.00) | 84.00 (82.00–87.00) | 82.00 (78.00–85.00) | |
| I ≠ II, I ≠ III, I ≠ IV, II ≠ IV | ||||||
| TST90 (%), M (IQR) | 1.57 (0.10–7.19) | 0.30 (0.00–2.83) | 1.00 (0.07–3.20) | 2.80 (0.47–9.09) | 7.19 (1.73–25.74) | |
| I ≠ III, I ≠ IV, II ≠ III, II ≠ IV, III ≠ IV | ||||||
| Sleepiness on ESS (pts), M (IQR) | 5.0 (3.0–8.0) | 4.0 (2.3–7.0) | 5.0 (3.0–9.0) | 5.0 (4.0–9.0) | 4.0 (3.0–8.0) | 0.177 |
The results are given for all cases and for each of the subgroups. CSA,
central sleep apnea; ESS, Epworth Sleepiness Scale; M, median; no,
number; OSA, obstructive sleep apnea; IQR, interquartile range; REI,
respiratory event index; SDB, sleep-disordered breathing; SpO
| Predictor | All participants | SDB severity | p-value for trend | |||
| None | Mild | Moderate | Severe | |||
| (I) | (II) | (III) | (IV) | |||
| No (%) | 254 | 67 (26.4) | 82 (32.3) | 54 (21.3) | 51 (20.1) | |
| LVEF (%), M (IQR) | 55.00 (48.00–55.00) | 55.00 (50.00–55.00) | 52.00 (48.00–55.00) | 55.00 (48.00–55.00) | 55.00 (48.00–55.00) | 0.579 |
| NYHA class, M (IQR) | 2.0 (1.0–2.0) | 2.0 (1.0–2.0) | 2.0 (1.0–2.0) | 1.5 (1.0–2.0) | 2.0 (1.0–2.0) | 0.165 |
| 6MWT (m), M (IQR) | 645.00 (518.00–814.00) | 666.50 (525.50–867.50) | 657.00 (564.00–806.00) | 668.50 (496.50–860.00) | 552.00 (457.00–686.50) | 0.021 |
| I ≠ IV, II ≠ IV, III ≠ IV | ||||||
| Metabolic equivalents, M (IQR) | 7.15 (6.10–9.50) | 7.20 (6.33–9.50) | 7.50 (6.90–9.50) | 7.60 (5.23–9.50) | 6.80 (5.60–7.90) | 0.015 |
| I ≠ IV, II ≠ IV, III ≠ IV | ||||||
| MHR (bpm), M (IQR) | 119.50 (108.00–132.50) | 127.00 (112.25–137.00) | 120.00 (110.25–133.00) | 117.00 (104.50–129.00) | 116.50 (103.00–128.00) | 0.003 |
| I ≠ III, I ≠ IV | ||||||
| MHR% (%), M (IQR) | 77.00 (69.00–82.00) | 79.00 (70.00–82.75) | 76.00 (71.00–82.00) | 73.50 (67.00–81.50) | 77.00 (69.00–83.00) | 0.41 |
| Fatigue level (pts), M (IQR) | 13.0 (14.0–16.0) | 12.0 (9.0–14.0) | 13.0 (10.0–14.0) | 13.0 (10.0–14.0) | 14.0 (10.0–14.0) | 0.035 |
The results are given for all cases and for each of the subgroups. bpm,
heart beats per minute; LVEF, left ventricular ejection fraction; M, median; no.,
number; NYHA, New York Heart Association; MHR, maximal heart rate; MHR%,
proportion of the age-based predictions of the maximal heart rate; IQR,
interquartile range; 6MWT, six-minute walk test; no., number; SDB,
sleep-disordered breathing;
The linear regression analysis confirmed the inversely proportional relationship
between the REI and the maximum exercise capacity expressed only in METs, MHR,
and 6MWT distance, not MHR% (Fig. 1A–D). Moreover, there was a proportional
relationship between mean SpO
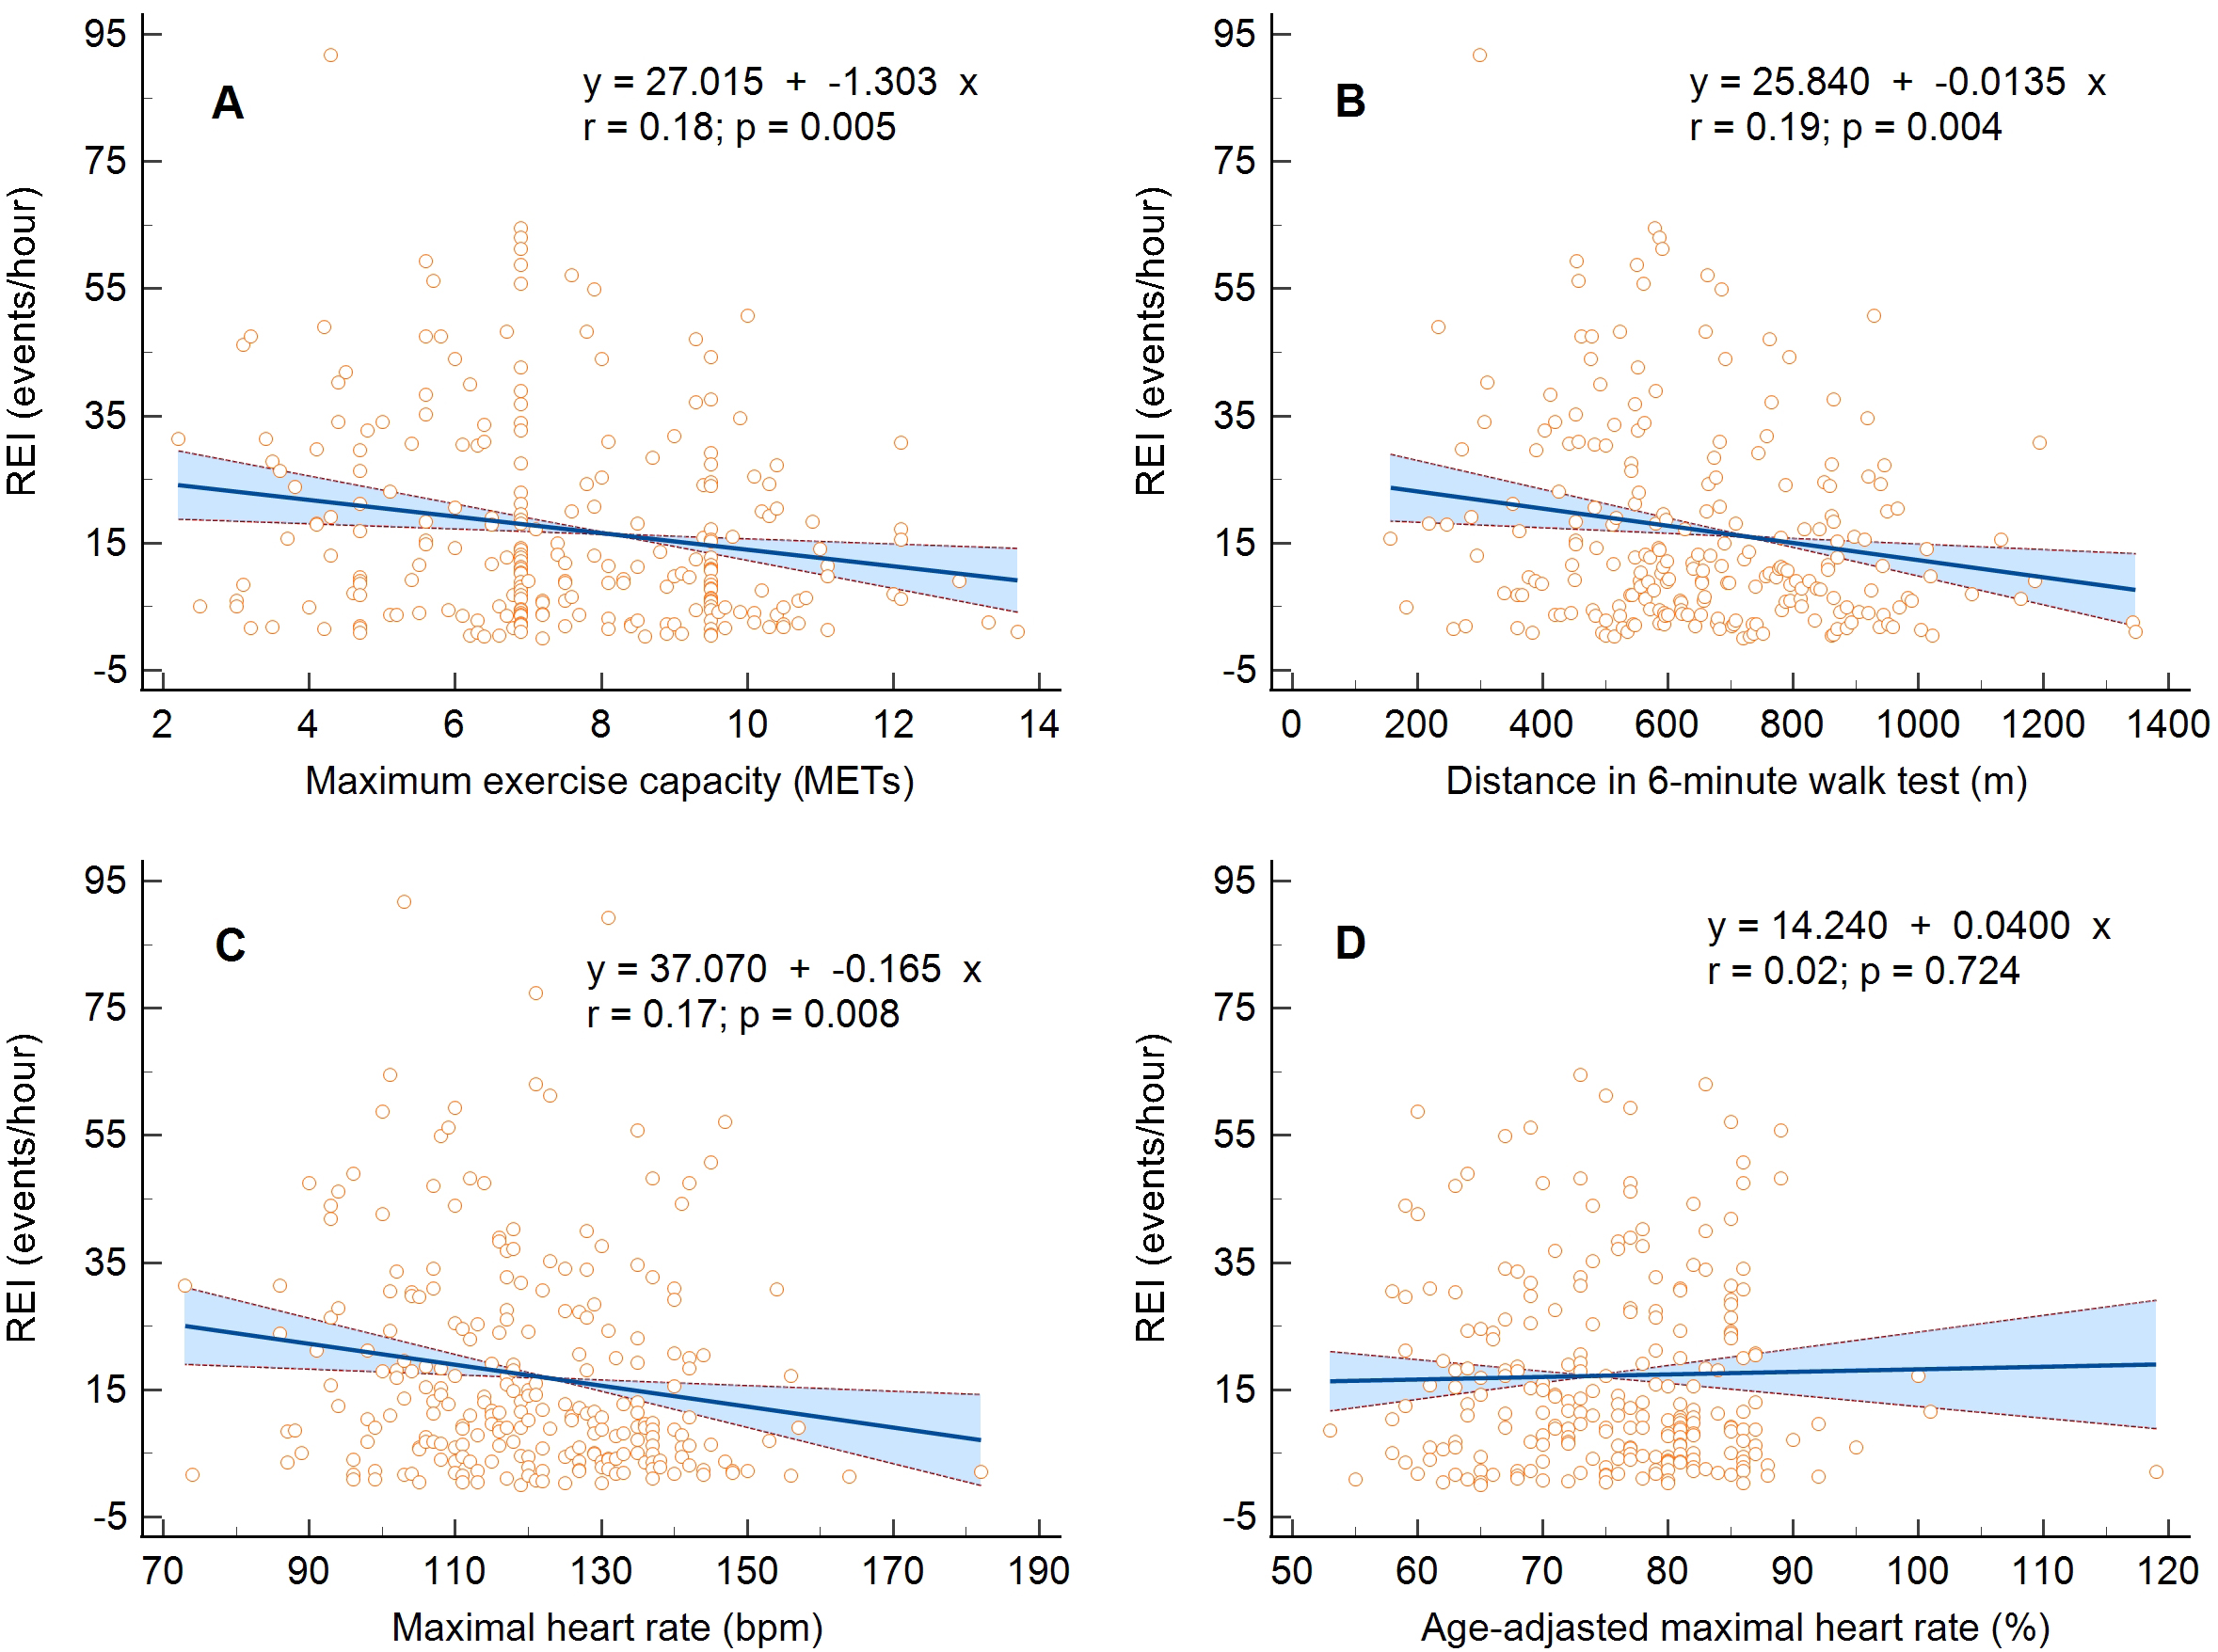 Fig. 1.
Linear regression and 95% confidence interval for the relationship between maximum exercise capacity and the respiratory event index. (A) Metabolic equivalents, (B) maximal heart rate, (C) distance in six-minute walk test, and (D) percentage of age-adjusted maximal heart rate. MET, metabolic equivalents; REI, respiratory event index.
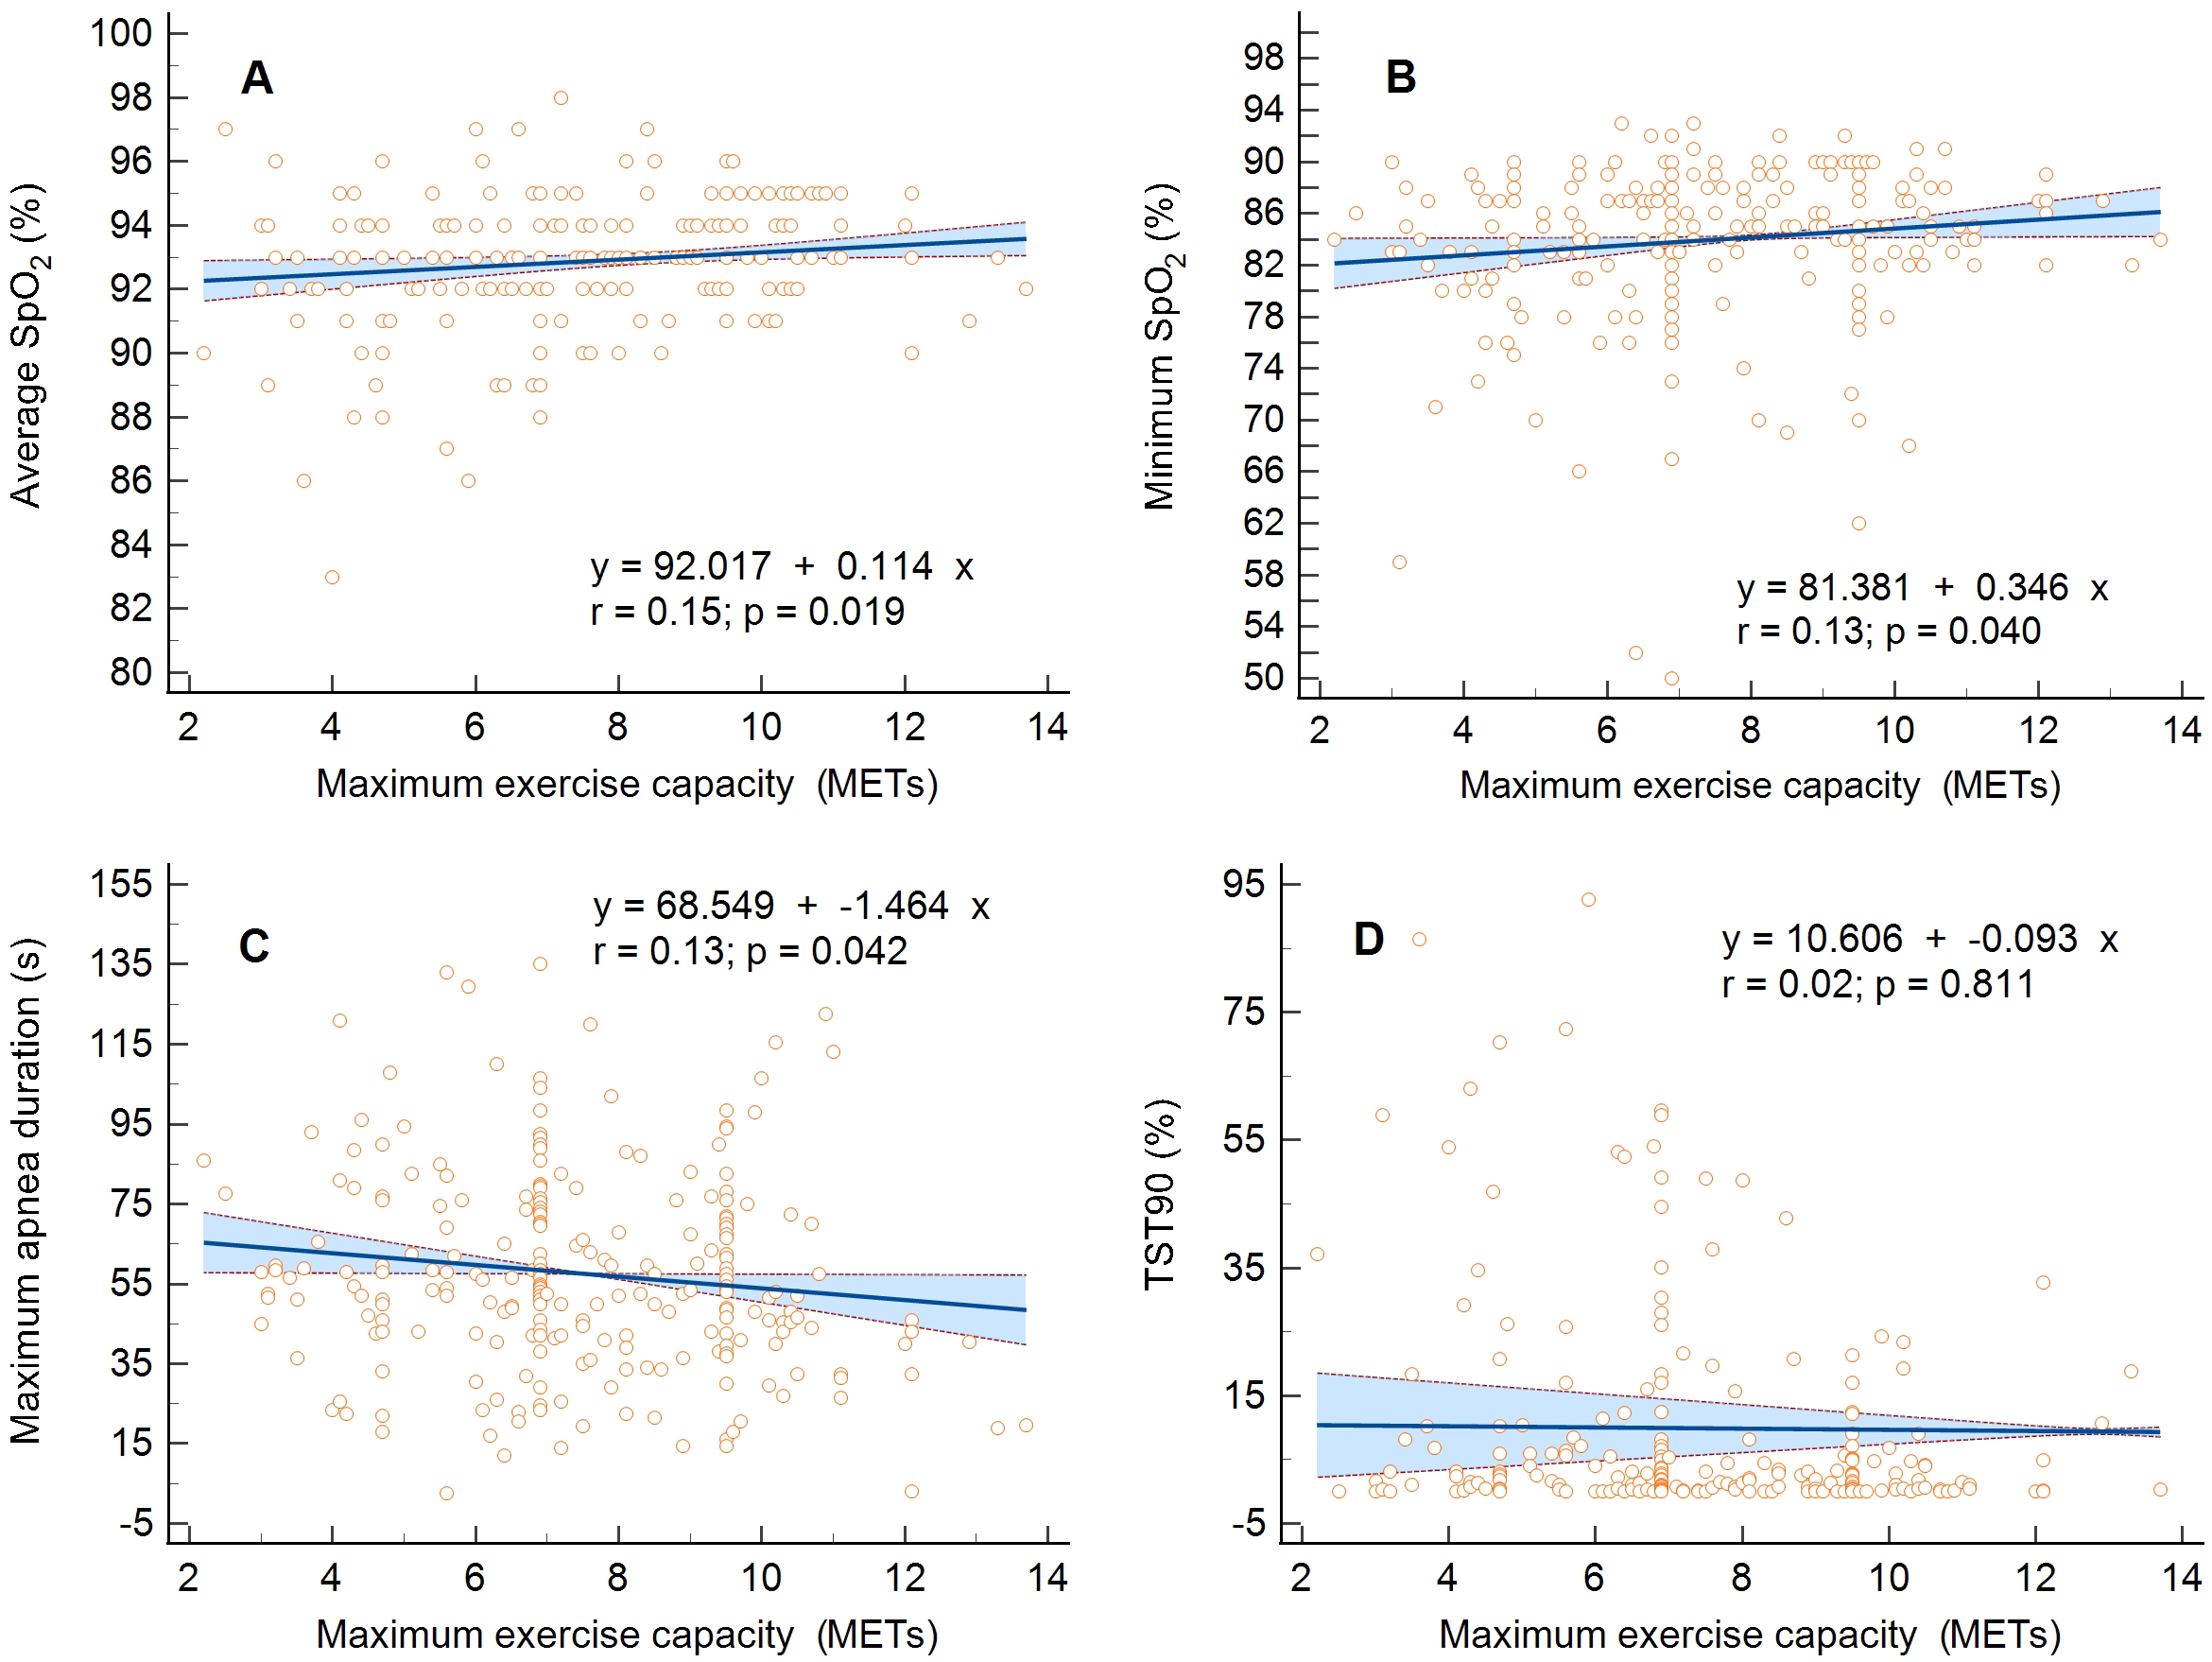 Fig. 2.
Linear regression and 95% confidence interval for the
relationship between maximum exercise capacity expressed in metabolic equivalents
(METs) and the respiratory parameters. (A) Average oxygen saturation of
hemoglobin (SpO
| Predictor | Maximum exercise capacity expressed in metabolic equivalents | |||||
| Full model | Stepwise regression | |||||
| Coefficient | Standard error | p-value | Coefficient | Standard error | p-value | |
| Age (years) | –2.106 | 0.267 | –0.087 | 0.011 | ||
| Sex (male) | - | - | - | 1.030 | 0.316 | 0.001 |
| Body weight (kg) | –0.792 | 0.425 | 0.064 | not included in the model | ||
| BMI (kg/m |
–0.621 | 0.114 | –0.124 | 0.024 | ||
| LVEF (%) | 0.866 | 0.172 | 0.105 | 0.016 | ||
| REI (events/hour) | –1.303 | 0.457 | 0.005 | did not enter the model | ||
| Average episode duration (s) | –0.128 | 0.156 | 0.450 | not included in the model | ||
| Maximal episode duration (s) | –1.464 | 0.715 | 0.042 | did not enter the model | ||
| Average SpO |
0.114 | 0.048 | 0.019 | did not enter the model | ||
| Minimal SpO |
0.346 | 0.168 | 0.040 | did not enter the model | ||
| TST90 (%) | –0.093 | 0.386 | 0.811 | not included in the model | ||
| Predictor | Exercise capacity expressed as maximal heart rate | |||||
| Full model | Stepwise regression | |||||
| Coefficient | Standard error | p-value | Coefficient | Standard error | p-value | |
| Age (years) | –0.264 | 0.036 | –0.684 | 0.091 | ||
| Sex (male) | - | - | - | did not enter the model | ||
| Body weight (kg) | –0.053 | 0.058 | 0.357 | not included in the model | ||
| BMI (kg/m |
–0.048 | 0.017 | 0.006 | –0.732 | 0.205 | |
| LVEF (%) | 0.064 | 0.027 | 0.018 | 0.256 | 0.128 | 0.046 |
| REI (events/hour) | –0.165 | 0.061 | 0.008 | did not enter the model | ||
| Average episode duration (s) | –0.029 | 0.021 | 0.168 | not included in the model | ||
| Maximal episode duration (s) | –0.144 | 0.096 | 0.135 | not included in the model | ||
| Average SpO |
0.019 | 0.007 | 0.006 | did not enter the model | ||
| Minimal SpO |
0.062 | 0.017 | did not enter the model | |||
| TST90 (%) | –0.133 | 0.027 | did not enter the model | |||
| Predictor | Exercise capacity expressed as a distance in a six-minute walk test | |||||
| Full model | Stepwise regression | |||||
| Coefficient | Standard error | p-value | Coefficient | Standard error | p-value | |
| Age (years) | –0.022 | 0.003 | –9.281 | 1.099 | ||
| Sex (male) | - | - | - | 103.257 | 32.267 | 0.002 |
| Body weight (kg) | –0.008 | 0.004 | 0.049 | not included in the model | ||
| BMI (kg/m |
–0.005 | 0.001 | –12.468 | 2.396 | ||
| LVEF (%) | 0.006 | 0.002 | 0.001 | 7.505 | 1.917 | |
| REI (events/hour) | –0.013 | 0.005 | 0.004 | did not enter the model | ||
| Average episode duration (s) | –0.002 | 0.002 | 0.174 | did not enter the model | ||
| Maximal episode duration (s) | –0.024 | 0.008 | 0.002 | did not enter the model | ||
| Average SpO |
0.001 | 0.0005 | 0.013 | not included in the model | ||
| Minimal SpO |
0.003 | 0.002 | 0.050 | did not enter the model | ||
| TST90 (%) | 0.006 | 0.003 | 0.061 | not included in the model | ||
BMI, body mass index; LVEF, left ventricular ejection fraction; REI, respiratory
event index; SpO
In the study, we assessed the effect of SDB on the maximum exercise capacity of
patients from the high CV risk group, i.e., in the early period after MI,
referred for CR. Given the impact of CRF on long-term prognosis and mortality in
patients with CV diseases, we aimed to assess whether the effect of SDB on
exercise capacity in post-MI patients should be considered an independent
prognostic factor. We measured maximum exercise capacity as routinely obtained
during CR (i.e., estimated oxygen consumption in METs and MHR from treadmill EST
or a distance in 6MWT) and portable polysomnography parameters used as HSAT. We
evaluated a representative group of patients with mild to severe SDB, 89.8% of
whom had OSA. We found a linear relationship between SDB parameters, such as REI,
mean and minimum SpO
Impaired CRF is a risk factor for morbidity, CV complications, and death in
patients with CV diseases [1, 5]. On the other hand, among CAD patients, the risk
of death from any cause decreases for every MET increase in maximum exercise
capacity (hazard ratio 0.83, 95% confidence interval [CI] 0.76–0.91) [5].
Better physical performance is also independently associated with fewer risk
factors for CAD and a lower risk of adverse CV events [41, 42]. Therefore, all
agents influencing CRF, physical activity, and lifestyle changes in post-MI
patients may be relevant as potential targets for medical intervention [43]. The
intervention documented to improve CRF in this group is early CR [41, 42, 44, 45, 46]. Exercise improvement of
The assessment of exercise capacity is an integral part of a patient’s examination upon admission to CR [48]. The cut-off point for the minimum CRF level considered normal and associated with lower CV risk is, for men and women, approximately nine and seven METs for 40-year-olds, eight and six METs for 50-year-olds, and seven and five METs for 60-year-olds [2]. In our cohort of 60-year-old men, CV response to exercise was preserved within a range of values associated with lower CV risk (i.e., 7.15 [6.10–9.50] METs). However, in patients with severe SDB, this value was outside the normal range (i.e., 6.80 [5.60–7.90] METs), which may indicate a higher risk in this subgroup. It was documented that, with the coexistence of CAD, the CV risk associated with OSA further increases [22, 23], and impaired exercise capacity in patients with OSA and CAD has a more serious prognostic value and is associated with an increased risk of all-cause mortality [12].
Some studies indicate that SDB, predominantly OSA, affects CRF [9, 18, 28, 29, 33, 49, 50, 51]. We also found a significant relationship between SDB severity and maximum exercise capacity in our cohort of post-MI patients. However, CFR also depends on other factors than SDB itself [6, 7, 8], although often identical to SDB risk factors [19, 20], such as sex, age, overweight/obesity, altered body composition (with increased visceral and neck adiposity), diabetes, hypertension, and congestive HF. It is known that maximum exercise capacity is approximately 2 METs lower in women than in men [6] and decreases by 0.1 MET for every year of aging [7]. Generalized loss of muscle mass and obesity also reduce physical performance [8]. In our group, age, and BMI strongly correlated with the severity of the SDB. The prevalence of diabetes also correlated with an increase in the SDB severity. The NYHA class and LVEF did not differ in groups depending on the SDB severity, but the peak exercise performance in METs and the distance in 6MWT was directly proportional to LVEF. Thus, independent risk factors for exercise capacity impairment assessed by multivariate regression analysis were female sex, older age, higher BMI, and decreased LVEF, but not SDB severity. Similar conclusions were drawn by other researchers [10, 12, 52, 53], stating that among patients with OSA, the influence of sex, obesity/BMI, and comorbidities on physical performance may outweigh that of SDB.
It can be assumed that the potential and independent effect of SDB on CRF may be more pronounced in middle-aged patients with severe SDB but without significant comorbidities. Under such conditions, SDB may be the only exercise limiting factor. For other CV diseases, such as AF, ventricular arrhythmias, or HA, the adverse effect of SDB is the most significant in middle-aged cohorts under 60–65 years old [54, 55, 56]. In younger patients, due to the short duration of the disease, the lack of deep nocturnal desaturation, and higher daily physical activity, SDB may not yet cause complications or lead to symptomatic decreases in CRF [11, 57]. Conversely, for the elderly, multiple comorbidities, including HF, lung diseases, and diabetes, as well as the effects of age, obesity, and physical deconditioning, may outweigh the impact of SDB [10, 50].
Powell et al. [57] evaluated a group of military personnel whose
members were approximately 41 years old and had moderate to severe OSA (an
apnea-hypopnea index [AHI] of 32.7 events/h). In the group, the CRF and BP
responses were correct, although the MHR trended toward a blunted response. Arora
et al. [58] described male military personnel who were ten years older
and mature in their careers. These individuals had a mean AHI of 29.0 events/h.
Their oxygen consumption (VO
Some authors point to chronotropic insufficiency and lower post-exercise heart
rate recovery in OSA patients [27, 28, 51]. In addition, researchers describe
dysregulation of BP response to exercise with an excessive peak or postexercise
BP in SDB cohorts [27, 28, 30]. We refrained from analyzing the chronotropic
competence of the sinus node and the exercise BP response because of the
extensive use of pharmacotherapy in post-MI patients, including maximum tolerated
doses of beta-blockers and ACE-Is, ARBs, or MRAs, which affect MHR and BP
control. However, we observed the decrease in MHR proportional to SDB worsening,
expressed as REI, mean, or maximal SpO
Regardless of the impact of SDB on CRF, OSA diagnosis in patients referred to CR may be relevant due to the increased likelihood of exercise-related complications and adverse events, such as AF, exercise-related ventricular arrhythmias, and nocturnal atrioventricular blocks [15, 21, 55, 56, 59]. In the era of home-based hybrid cardiac telerehabilitation [46], without direct medical supervision during exercise, the diagnosis of OSA as a risk factor for CV complications may change the patient’s qualification to the CR type. In addition, starting treatment of severe OSA with PAP before CR may contribute to the increase in the patient’s spontaneous physical activity [60], or CRF [18, 61], and an improvement of compliance, quality of life [36], and long-term CV outcome [62].
Women are poorly represented in the study group due to the lower incidence of CAD and MI among women compared to men. Another limitation is using EST and 6MWT to assess maximum exercise capacity instead of the gold standard, i.e., CTEP [63]. However, EST and 6MWT are the standard tests for qualification for the CR model routinely used in practice, and estimated CRF derived from the peak work rate is accepted as an expression of fitness by scientific societies [1, 48]. We used HSAT to diagnose the SDB’s presence and severity rather than level 1 polysomnography [38], as it is easy to use and possible to perform on an outpatient basis; it is also recommended as screening in CR [64]. Moreover, we repeated or rejected all inconclusive or technically inappropriate HSAT results to ensure the credibility of the research. We also did not have the opportunity to analyze respiratory parameters during exercise. However, the available data show that SDB does not limit ventilatory response and gas exchange during peak exercise, even in patients with high AHI and deep desaturation during sleep [65].
In post-MI patients, SDB negatively impacts the maximum exercise capacity assessed in METs and the distance in 6MWT. However, the strength of this association may be less pronounced due to the strong interaction of risk factors common for SDB and impaired exercise capacity, such as sex, older age, higher BMI, and left ventricular systolic dysfunction.
AF, atrial fibrillation; AHI, apnea-hypopnea index; BMI, body mass index; BP,
blood pressure; CAD, coronary artery disease; CPET, cardiopulmonary exercise
testing; CR, cardiac rehabilitation; CRF, cardiorespiratory fitness; CV,
cardiovascular; CSA, central sleep apnea; EST, exercise stress test, HFmrEF,
heart failure with mildly reduced ejection fraction; HFrEF, heart failure with
reduced left ventricular ejection fraction; HSAT, home sleep apnea test; LVEF,
left ventricular ejection fraction; MC-AMI, Managed Care after Acute Myocardial
Infarction program; MHR, maximal heart rate; MHR%, proportion of the age-based
predictions of the maximal heart rate; MI, myocardial infarction; NYHA, New York
Heart Association; OSA, obstructive sleep apnea; REI, respiratory event index;
SDB, sleep-disordered breathing; SpO
The data presented in this study are available on request from the Department of Electrocardiology and Heart Failure, Medical University of Silesia in Katowice (Poland). The data are not publicly available due to privacy restrictions.
DL, MS, and JD designed the research study. MS and DL performed the research. DL, RG, and KSG analyzed the data. DL and MS wrote the manuscript. KSG, RG, and JD reviewed the manuscript. All authors contributed to editorial changes in the manuscript. All authors read and approved the final manuscript. All authors have participated sufficiently in the work and agreed to be accountable for all aspects of the work.
The study was conducted in accordance with the Declaration of Helsinki and approved by the Bioethical Committee of the Medical University of Silesia in Katowice, Poland (Resolution No. KNW/0022/KB1/77/18 of 25 September 2018 and PCN 0022/KB1/77/I/18/20 of 13 October 2020). Informed consent was obtained from all subjects involved in the study.
Not applicable.
This research was supported by the Medical University of Silesia in Katowice, Poland. The grant number: PCN-2-080/K/2/K.
The authors declare no conflict of interest.
Publisher’s Note: IMR Press stays neutral with regard to jurisdictional claims in published maps and institutional affiliations.