
- Academic Editor
Background: Malnutrition has a negative impact on patients with
arteriosclerotic cardiovascular disease (ASCVD); however, only a few studies have
confirmed the effect of malnutrition on atherosclerosis. We aimed to investigate
the association between malnutrition and vulnerable plaques via optical coherence
tomography (OCT). Methods: Overall, 142 acute coronary syndrome (ACS)
patients were included in this study. Malnutrition was assessed using the
Controlled Nutritional Status Score (CONUT), and plaque vulnerability was
measured using OCT. Finally, patients were divided into four groups according to
their CONUT scores and body mass index (BMI)
Acute coronary syndrome (ACS) is a common cardiovascular emergency; despite the recent advances in its diagnosis and treatment, cardiovascular disease remains the leading cause of death [1]. Poor dietary quality can adversely affect cardiovascular health [2, 3]. Sze et al. [4] and Goldfarb et al. [5] have confirmed the association of malnutrition with heart failure and valvular heart disease and have shown malnutrition to be a poor predictor of cardiovascular disease. Previous studies have reported the prevalence of malnutrition in patients with ACS, and patients with different levels of malnutrition showed different mortality rates and differences in the associated risk of future major adverse cardiovascular events (MACE) [6, 7]. Optical coherence tomography (OCT) is now widely used in the management of patients with ACS, and as the highest resolution intracavitary imaging technique available, it allows clear identification of coronary artery structures. Recent clinical studies have shown that OCT can identify high-risk plaque features, including plaque rupture, thin cap fibroatheroma (TCFA), lipid-rich plaques (LRP), and macrophages [8, 9], and that these vulnerable plaques have a significant negative impact on coronary arteries of patients and accelerate the progression of arteriosclerotic cardiovascular disease (ASCVD).
Previous studies have shown that different dietary intakes can influence the coronary plaque vulnerability [10, 11]. However, the intracoronary plaque characteristics in patients who are malnourished have not yet been confirmed by studies; therefore, we aimed to evaluate the plaque characteristics of patients with ACS with different degrees of malnutrition using OCT, to provide more intraluminal imaging evidence for studying the prognostic mechanisms of malnutrition in patients with ACS.
The data of 173 patients with ACS who underwent direct percutaneous coronary intervention (PCI) and OCT at the Department of Cardiology, Hebei General Hospital, between January 2019 and January 2022 were collected for inclusion in this study. Fourteen patients with previous coronary artery bypass grafting, cardiogenic shock, severe hepatic and renal insufficiency, and extremely tortuous coronary artery calcification were excluded. OCT images of 159 enrolled patients with ACS were analyzed, and 17 patients were excluded for the following reasons: poor quality OCT images (n = 4), in-stent restenosis (n = 6), and pre-dilatation before OCT imaging (n = 7). Final OCT images of 142 eligible patients with ACS were analyzed. ACSs, including ST-segment elevation myocardial infarction (STEMI), non-ST-segment elevation myocardial infarction (NSTEMI), and unstable angina, were diagnosed according to current guidelines [12] based on elevated cardiac biomarkers, electrocardiogram (ECG) abnormalities suggestive of myocardial ischemia, clinical signs of angina, or echocardiographic wall motion abnormalities. Patient demographics including sex, age, body mass index (BMI), smoking, laboratory results, and coronary risk factors (hypertension, diabetes mellitus, dyslipidemia, family history of cardiovascular disease (CVD)), were collected.
The nutritional status was assessed using the Controlled Nutritional Status Score (CONUT), which has been used since its inception to evaluate the nutritional status of patients with various diseases [13, 14, 15] and combines three indicators of serum albumin, lymphocytes, and cholesterol for systematic scoring, classifying patients as Normal (0–1) or Mild (2–4), Moderate (5–8), or Severe (9–12) malnutrition, with higher scores for a poorer nutritional status.
All participants underwent elective coronary angiography using the standard Judkin technique. Coronary angiography was graded and quantified separately by two independent interventionalists who were unaware of the clinical data.
Using the ILUMIEN OPTIS OCT system (Abbott Vascular, Santa Clara, CA, USA), infarct-related arteries were identified by at least two trained cardiologists based on angiographic findings, ECG performance, and appropriate treatment strategies (intracoronary thrombolysis, thrombus aspiration), and the OCT imaging catheter was slowly advanced to the distal end of the culprit lesion, and automatic withdrawal was performed while guiding the catheter for contrast injection. All OCT findings were evaluated by 2 interventionalists who were experienced in film review, and discrepancies in their evaluations were resolved by consultation and analyzed using image analysis software (Abbott, Santa Clara, CA, USA). Patients were graded for infarct-related arteries according to previous studies and consensus criteria [16]; including the plaque type for culprit lesions and plaque components for non-culprit lesions, TCFA, LRP, minimum fiber cap thickness (FCT), maximum lipid arc, reference luminal area (RLA), minimum luminal area (MLA), degree of luminal stenosis, thrombus, microvasculature, calcification, macrophage infiltration, and cholesterol crystals. A non-offending lesion site was defined as a plaque in the infarct-related artery at least 5 mm from the offending lesion. Specific definitions of plaque characteristics are provided in the Supplementary Material.
All data were analyzed using IBM SPSS Statistics 26.0 (IBM SPSS Statistics, IBM
Corporation, Armonk, NY, USA) statistical software. Categorical variables were
expressed as numbers (%) and continuous variables were tested for normality and
chi-squared test. Those conforming to normal distribution were expressed as mean
Of the 142 patients enrolled, 73 had STEMI (51.4%), 28 had NSTEMI (19.7%), and
41 (28.9%) had unstable angina. Nutritional status was assessed using the CONUT
in 69 (48.6%) nutritionally healthy, 61 (43.0%) mildly malnourished, 12 (8.5%)
moderately malnourished, and 0 (0%) severely malnourished patients. The total
CONUT score ranged from 0 to 8 with a median of 2 (interquartile range: 1–3).
Table 1 summarizes the clinical characteristics and imaging results of patients
with differing nutritional status. The patients in the Absent group were the
youngest (49.0 vs 57.0 vs 59.0, p = 0.006), had higher lymphocyte counts
(2.22 vs 1.31 vs 0.88, p
| Variables | Absent (n = 69) | Mild (n = 61) | Moderate (n = 12) | p value | |
| Male (n, %) | 58 (84.1) | 56 (91.8) | 11 (91.7) | 0.366 | |
| Age (years) | 49.0 (36.5, 58.0) | 57.0 (43.0, 66.0) | 59.0 (53.0, 64.3) | 0.006 | |
| BMI (kg/m |
25.4 (24.1, 27.4) | 25.4 (23.8, 27.4) | 22.3 (21.9, 25.6) | 0.080 | |
| Diagnosis (n, %) | 0.303 | ||||
| STEMI | 35 (50.7) | 29 (47.5) | 9 (75.0) | ||
| NSTEMI | 11 (15.9) | 15 (24.6) | 2 (16.7) | ||
| UA | 23 (33.3) | 17 (27.9) | 1 (8.3) | ||
| Hypertension (n, %) | 30 (43.5) | 34 (55.7) | 4 (33.3) | 0.216 | |
| Current smoking (n, %) | 20 (29.0) | 16 (26.2) | 2 (16.7) | 0.668 | |
| Dyslipidemia (n, %) | 18 (26.1) | 11 (18.0) | 1 (8.3) | 0.280 | |
| Family history of CVD (n, %) | 10 (14.5) | 11 (18.0) | 1 (8.3) | 0.663 | |
| Diabetes mellitus (n, %) | 24 (34.8) | 23 (37.7) | 4 (33.3) | 0.924 | |
| Initial TIMI flow 0–1 (n, %) | 0.014 | ||||
| 0–1 | 35 (50.7) | 28 (45.9) | 11 (91.7) | ||
| 2–3 | 34 (49.3) | 33 (54.1) | 1 (8.3) | ||
| No. of coronary artery narrowed (n, %) | 0.709 | ||||
| 1 | 36 (52.2) | 39 (63.9) | 7 (58.3) | ||
| 2 | 22 (31.9) | 14 (23.0) | 4 (33.3) | ||
| 3 | 11 (15.9) | 8 (13.1) | 1 (8.3) | ||
| Aspirin (n, %) | 69 (100) | 61 (100) | 12 (100) | - | |
| P2Y12 receptor antagonist (n, %) | 63 (91.3) | 54 (88.5) | 12 (100) | 0.444 | |
| Statins (n, %) | 63 (91.3) | 56 (91.8) | 11 (91.7) | 0.995 | |
| White blood cells (×10 |
8.71 (6.95, 10.71) | 7.2 (5.68, 10.61) | 9.44 (6.90, 12.96) | 0.108 | |
| Neutrophil (×10 |
5.32 (4.11, 7.75) | 5.08 (3.75, 8.79) | 7.47 (5.39, 11.94) | 0.161 | |
| Lymphocyte (×10 |
2.22 (1.75, 2.76) | 1.31 (1.08, 1.68) | 0.88 (0.69, 1.09) | p | |
| TC (mmol/L) | 4.7 (4.2, 5.5) | 3.5 (3.0, 4.6) | 3.1 (2.4, 4.0) | p | |
| TG (mmol/L) | 1.7 (1.2, 2.9) | 1.2 (0.8, 1.9) | 1.1 (0.8, 1.2) | p | |
| HDL-C (mmol/L) | 0.97 (0.86, 1.15) | 1.01 (0.89, 1.18) | 1.01 (0.89, 1.18) | 0.237 | |
| LDL-C (mmol/L) | 3.1 (2.8, 3.7) | 2.2 (1.7, 3.0) | 1.9 (1.4, 2.6) | p | |
| Lipoprotein a (mg/L) | 171.1 (107.2, 295.2) | 193.7 (101.3, 349.3) | 183.8 (65.6, 328.3) | 0.553 | |
| LVEF (n, %) | 60.0 (53.0, 63.0) | 61.0 (56.0, 66.0) | 57.5 (52.0, 61.5) | 0.065 | |
| Albumin (g/dL) | 40.7 (38.9, 42.9) | 40.3 (38.0, 43.4) | 34.8 (34.2, 39.8) | 0.001 | |
| Albuminuria (n, %) | 12 (17.4) | 14 (23.0) | 3 (25.0) | 0.675 | |
Continuous data are presented as mean
Table 2 shows the comparison of OCT results and indicates that there were significant differences in plaque rupture, TCFA, minimal FCT, thrombus, and macrophage infiltration between the three groups (plaque rupture: 34.8% vs 52.5% vs 66.7%, p = 0.038; TCFA: 10.1% vs 24.6% vs 33.3%, p = 0.039; minimal FCT: 125.0% vs 110.4% vs 96.9%, p = 0.022; thrombus: 50.7% vs 70.5% vs 83.3%, p = 0.019). The multiple-group comparison shows that the Absent and Mild groups were statistically significant except for in minimal FCT (p1 vs 2 = 0.177), in which no significant difference was observed, and the Mild and Moderate groups had similar plaque characteristics. Figs. 1,2 show the comparison of plaque characteristics, which were statistically different in patients with different malnutrition grades.
| Variables | Absent (n = 69) | Mild (n = 61) | Moderate (n = 12) | p value | p1 vs 2 | p2 vs 3 | p1 vs 3 |
| Plaque rupture (n, %) | 24 (34.8) | 32 (52.5) | 8 (66.7) | 0.038 | 0.042 | 0.366 | 0.037 |
| LRP (n, %) | 39 (56.5) | 29 (47.5) | 6 (50.0) | 0.586 | NA | NA | NA |
| TCFA (n, %) | 7 (10.1) | 15 (24.6) | 4 (33.3) | 0.039 | 0.028 | 0.528 | 0.030 |
| Minimal FCT (µm) | 125.0 (104.5, 141.1) | 110.4 (62.0, 141.7) | 96.9 (63.2, 118.4) | 0.022 | 0.177 | 0.506 | 0.043 |
| Maximum lipid arc, ° | 108.1 (68.2, 192.7) | 96.0 (76.3, 173.7) | 106.7 (79.7, 205.0) | 0.931 | NA | NA | NA |
| MLA (mm |
2.0 (1.5, 2.7) | 1.9 (1.4, 2.5) | 2.0 (1.2, 2.4) | 0.907 | NA | NA | NA |
| RLA (mm |
8.1 (7.2, 9.9) | 8.4 (7.2, 9.3) | 8.3 (7.8, 9.5) | 0.917 | NA | NA | NA |
| Stenosis (%) | 76.8 |
77.0 |
78.8 |
0.478 | NA | NA | NA |
| Cholesterol crystals (n, %) | 16 (23.2) | 11 (18.0) | 3 (25.0) | 0.728 | NA | NA | NA |
| Thrombus (n, %) | 35 (50.7) | 43 (70.5) | 10 (83.3) | 0.019 | 0.022 | 0.362 | 0.036 |
| Microvascular (n, %) | 26 (37.7) | 24 (39.3) | 4 (33.3) | 0.923 | NA | NA | NA |
| Macrophage (n, %) | 15 (21.7) | 25 (41.0) | 6 (50.0) | 0.026 | 0.018 | 0.564 | 0.039 |
| Calcified plaque (n, %) | 28 (40.6) | 33 (54.1) | 6 (50.0) | 0.299 | NA | NA | NA |
Continuous data are presented as mean
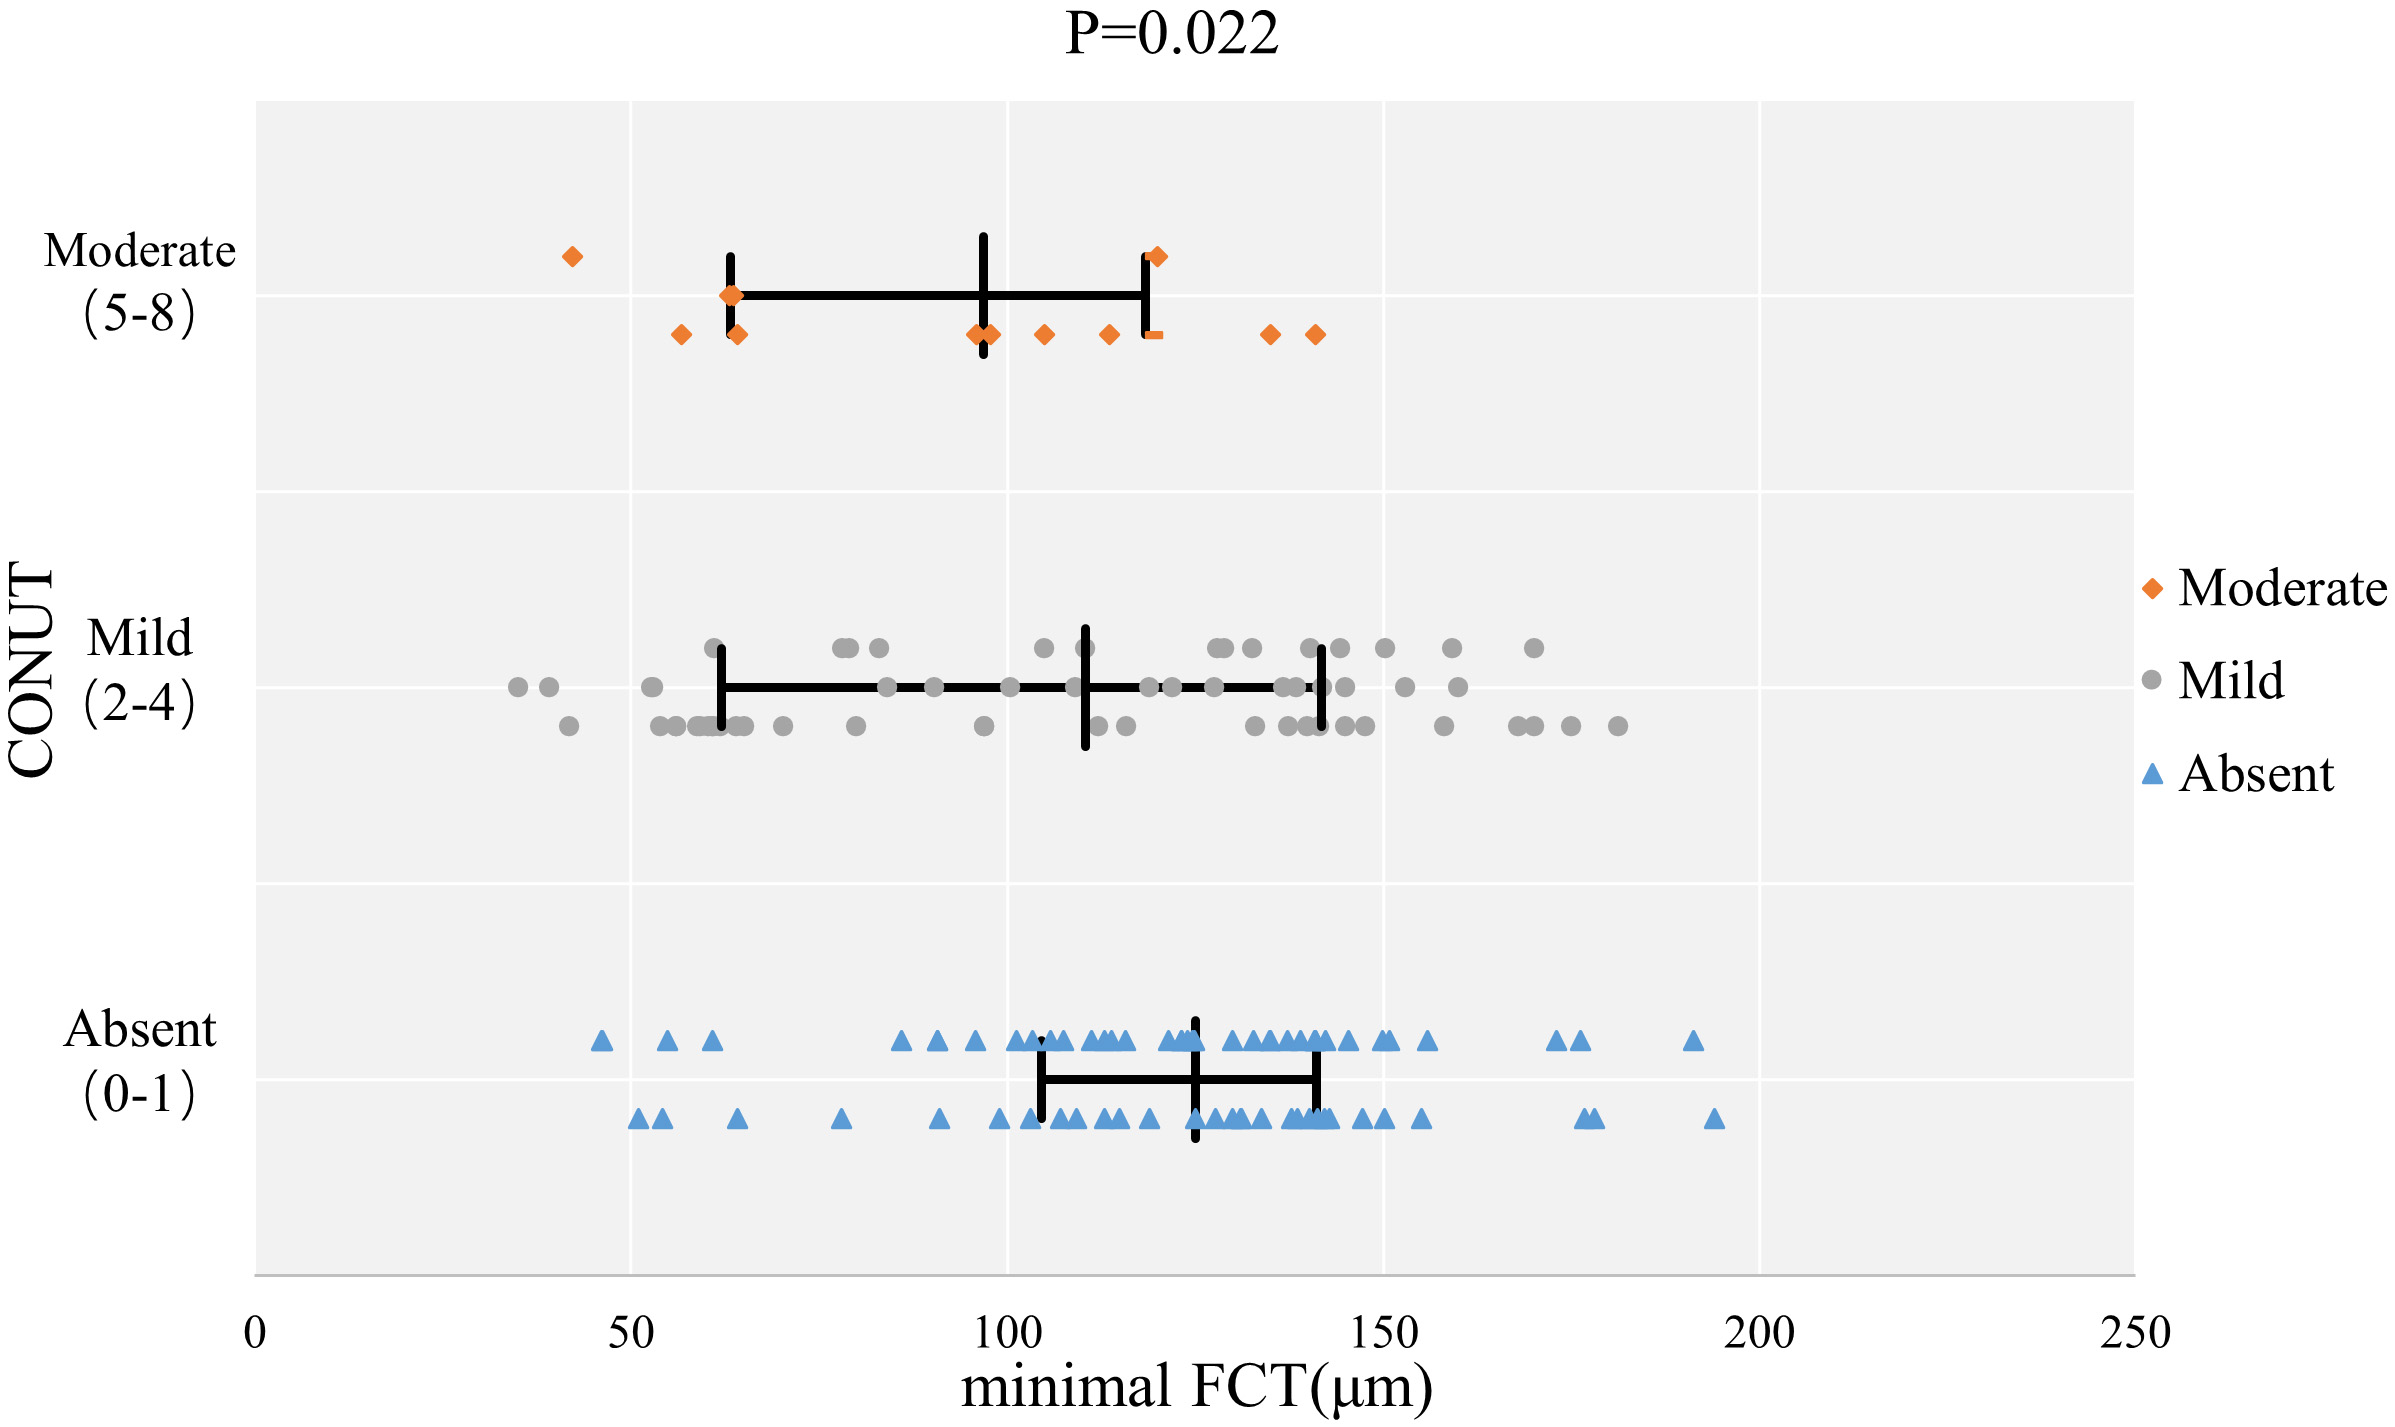 Fig. 1.
The comparison of minimal FCT with different malnutrition grades. Abbreviations: CONUT, Controlled Nutritional Status Score; FCT, fibrous cap thickness.
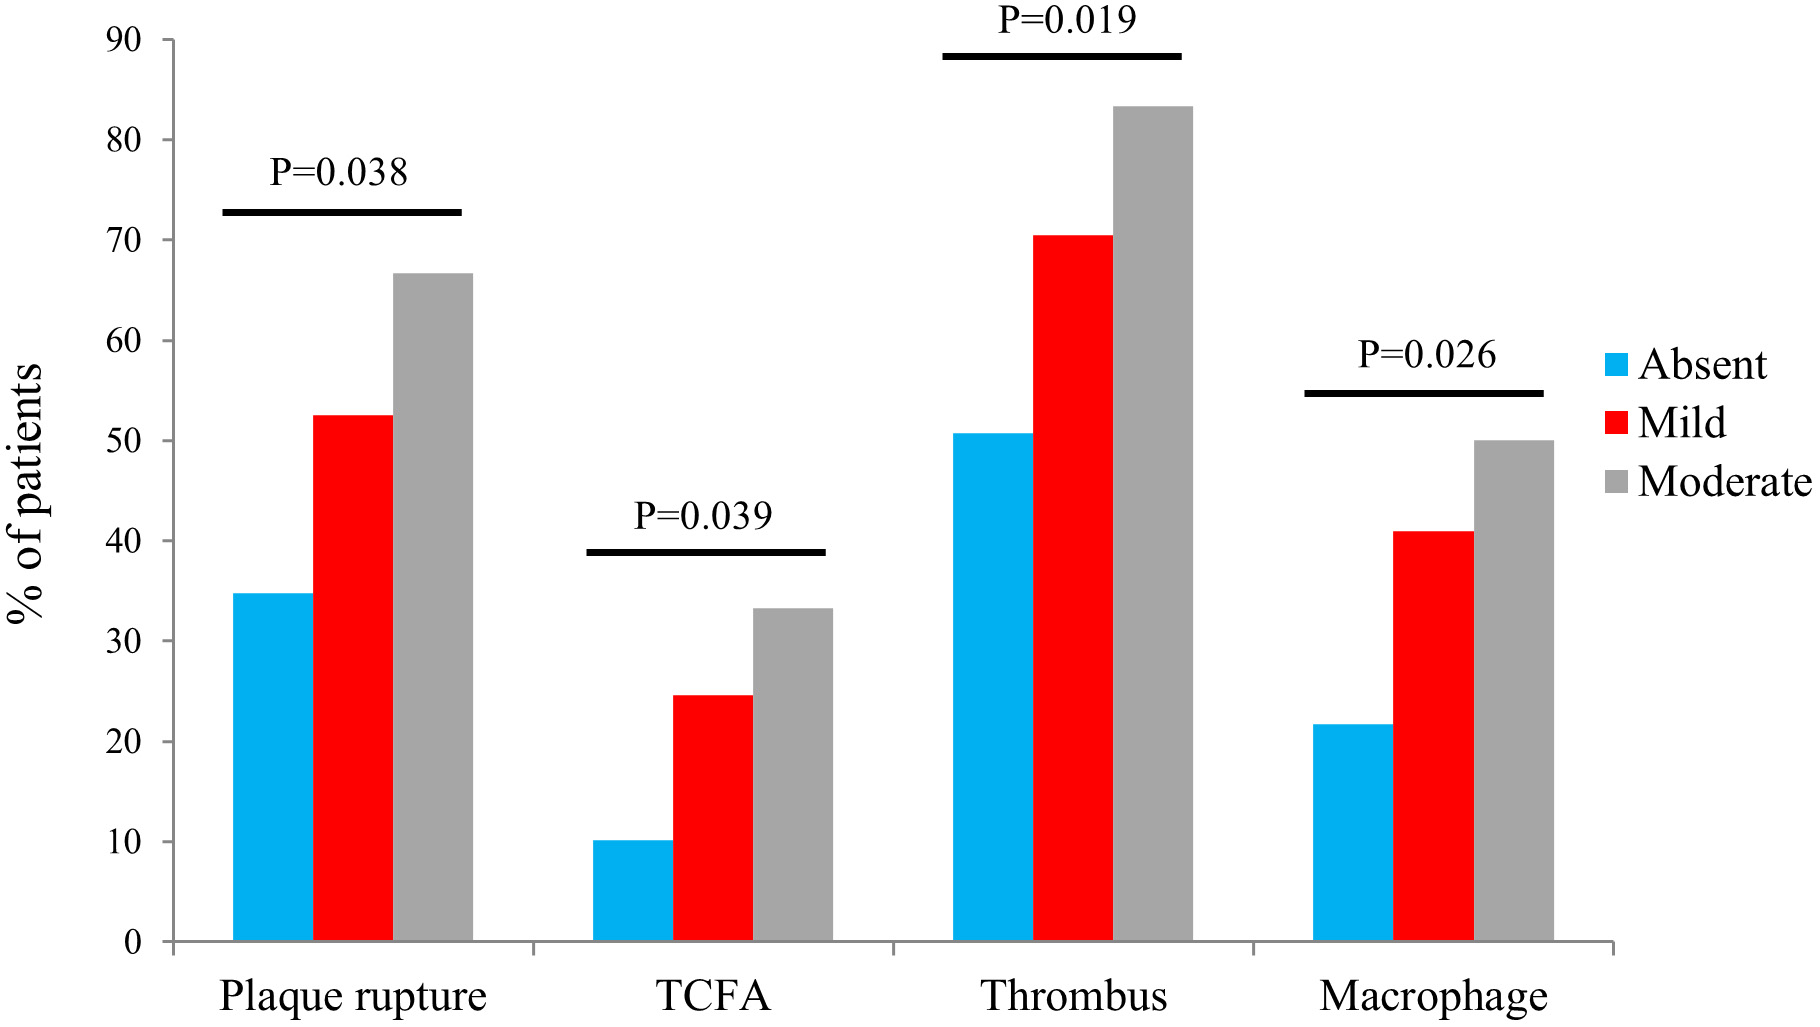 Fig. 2.
The comparison of vulnerable plaques with different malnutrition grades. Abbreviations: TCFA, thin-cap fibroatheroma.
We examined the effect of malnutrition on plaque characteristics that were statistically different using a multivariate logistic regression model. The cardiovascular risk factors and medications [17] (age, sex, BMI, hypertension, diabetes mellitus, dyslipidemia, current smoking status, and family history of CVD, statins), CONUT score, and malnutrition grade were included in the multivariable logistic regression analysis when the CONUT score and malnutrition grade were considered as covariate taking separate tests (Table 3). The results showed that malnutrition was a significant predictor of plaque rupture, TCFA, and macrophage infiltration. Plaque rupture: CONUT score (odds ratio [OR]: 1.448, 95% confidence interval [CI]: 1.136–1.845, p = 0.003), Mild malnutrition (OR: 1.981, 95% CI: 0.932–4.210, p = 0.075), and Moderate malnutrition (OR: 4.375, 95% CI: 1.048–18.255, p = 0.043); TCFA: CONUT score (OR: 1.334, 95% CI: 1.029–1.730, p = 0.030), Mild malnutrition (OR: 3.518, 95% CI: 1.251–9.897, p = 0.017), and Moderate malnutrition (OR: 4.863, 95% CI: 1.019–23.208, p = 0.047); and macrophage: CONUT score (OR: 1.343, 95% CI: 1.060–1.700, p = 0.015), Mild malnutrition (OR: 3.016, 95% CI: 1.305–6.974, p = 0.010), and Moderate malnutrition (OR: 4.637, 95% CI: 1.159–18.552, p = 0.030).
| Variables | Plaque rupture | TCFA | Macrophage | Thrombus |
| CONUT (as cont.) | 1.448 (1.136–1.845) | 1.334 (1.029–1.730) | 1.343 (1.060–1.700) | 1.103 (0.882–1.380) |
| p value | 0.003 | 0.030 | 0.015 | 0.390 |
| Malnutrition grade | ||||
| Absent | 1 [reference] | 1 [reference] | 1 [reference] | 1 [reference] |
| Mild | 1.981 (0.932–4.210) | 3.518 (1.251–9.897) | 3.016 (1.305–6.974) | 1.466 (0.681–3.156) |
| Mild p value | 0.075 | 0.017 | 0.010 | 0.329 |
| Moderate | 4.375 (1.048–18.255) | 4.863 (1.019–23.208) | 4.637 (1.159–18.552) | 1.380 (0.346–5.507) |
| Moderate p value | 0.043 | 0.047 | 0.030 | 0.649 |
Age, sex, BMI, hypertension, diabetes mellitus, dyslipidemia, current smoking, family history of CVD, statins, CONUT score, and malnutrition grade were included in the multivariable logistic regression analysis. BMI, body mass index; CVD, cardiovascular disease; CONUT, Controlled Nutritional Status Score; TCFA, thin-cap fibroatheroma; N, total sample size.
We divided the patients into four groups according to the presence of
malnutrition (CONUT
| Variables | NN (n = 25) | NO (n = 44) | p value | MN (n = 35) | MO (n = 38) | p value |
| Male (n, %) | 19 (76.0) | 39 (88.6) | 0.300 | 30 (85.7) | 37 (97.4) | 0.166 |
| Age (years) | 50.6 |
48.1 |
0.555 | 57.6 |
53.3 |
0.157 |
| Hypertension (n, %) | 14 (56.0) | 16 (36.4) | 0.114 | 16 (45.7) | 22 (57.9) | 0.298 |
| Diabetes mellitus (n, %) | 9 (36.0) | 15 (34.1) | 0.873 | 8 (22.9) | 19 (50.0) | 0.016 |
| Dyslipidemia (n, %) | 3 (12.0) | 15 (34.1) | 0.045 | 2 (5.7) | 10 (26.3) | 0.018 |
| Current smoking (n, %) | 6 (24.0) | 14 (31.8) | 0.491 | 9 (25.7) | 9 (23.7) | 0.841 |
| Family history of CVD (n, %) | 3 (12.0) | 7 (15.9) | 0.930 | 3 (8.6) | 9 (23.7) | 0.082 |
| Plaque rupture (n, %) | 7 (28.0) | 17 (38.6) | 0.373 | 18 (51.4) | 22 (57.9) | 0.579 |
| MLA (mm |
2.0 |
2.0 |
0.857 | 1.9 |
2.1 |
0.505 |
| RLA (mm |
8.3 |
8.2 |
0.789 | 8.2 |
8.5 |
0.611 |
| Stenosis (%) | 76.4 |
77.0 |
0.688 | 78.2 |
76.5 |
0.226 |
| LRP (n, %) | 14 (56.0) | 25 (56.8) | 0.947 | 17 (48.6) | 18 (47.4) | 0.918 |
| TCFA (n, %) | 3 (12.0) | 4 (9.1) | 1.000 | 9 (25.7) | 10 (26.3) | 0.953 |
| Minimal FCT (µm) | 113.6 |
127.0 |
0.108 | 104.7 |
103.7 |
0.920 |
| Maximum lipid arc, ° | 116.8 (72.5, 184.2) | 107.8 (65.9, 205.0) | 0.965 | 109.0 (78.4, 177.5) | 96.1 (75.1, 183.0) | 0.581 |
| Cholesterol crystals (n, %) | 5 (20.0) | 11 (25.0) | 0.636 | 7 (20.0) | 7 (18.4) | 0.864 |
| Thrombus (n, %) | 15 (60.0) | 20 (45.5) | 0.245 | 26 (74.3) | 27 (71.1) | 0.757 |
| Microvascular (n, %) | 12 (48.0) | 14 (31.8) | 0.182 | 13 (37.1) | 15 (39.5) | 0.838 |
| Macrophage (n, %) | 6 (24.0) | 9 (20.5) | 0.731 | 10 (28.6) | 21 (55.3) | 0.021 |
| Calcified plaque (n, %) | 10 (32.0) | 18 (29.5) | 0.941 | 17 (48.6) | 22 (57.9) | 0.425 |
Continuous data are presented as mean
| Variables | Univariate | Multivariate | ||
| OR (95% CI) | p value | OR (95% CI) | p value | |
| Age | 0.993 (0.969–1.017) | 0.562 | ||
| Male | 0.608 (0.187–1.980) | 0.409 | ||
| Hypertension | 0.675 (0.332–1.373) | 0.278 | ||
| Diabetes mellitus | 1.848 (0.897–3.808) | 0.096 | 1.524 (0.669–3.472) | 0.316 |
| Dyslipidemia | 1.274 (0.548–2.960) | 0.574 | ||
| Current smoking | 0.675 (0.295–1.543) | 0.351 | ||
| Family history of CVD | 0.969 (0.366–2.570) | 0.950 | ||
| Statins | 0.444 (0.135–1.463) | 0.182 | ||
| NN | 1 [reference] | - | 1 [reference] | - |
| NO | 0.814 (0.252–2.635) | 0.732 | 0.666 (0.191–2.328) | 0.525 |
| MN | 1.267 (0.391–4.101) | 0.693 | 1.322 (0.382–4.576) | 0.660 |
| MO | 3.912 (1.278–11.973) | 0.017 | 4.010 (1.188–13.537) | 0.025 |
All variables listed were included in the multivariable logistic regression analysis. CI, confidence interval; CVD, cardiovascular disease; OR, odds ratio; MN, malnourished and normal weight; MO, malnourished and overweight; NN, nutritionally healthy and normal weight; NO, nutritionally healthy and overweight.
In this study, for the first time, we observed the morphologic characteristics of lesion types and plaques at non-lesion sites in patients with ACS and different nutritional statuses using OCT. The main findings were as follows: Firstly, malnutrition was present in more than half of the patients with ACS (51.4%) and was associated with incidence of STEMI. Secondly, patients who were malnourished had more vulnerable plaque characteristics than nutritionally healthy patients, and malnutrition, as assessed using CONUT, was a predictor of poor plaque characteristics. Thirdly, both malnutrition and being overweight were not associated with the plaque lipid burden; however, their presence was an independent predictor of macrophages.
Malnutrition is associated with poor prognosis in chronic diseases, such as heart failure, cancer, and kidney disease [4, 18, 19]. The CONUT score, a simple and rapid nutritional assessment tool, has recently been shown to predict adverse events in patients with coronary artery disease (CAD) after PCI based on traditional factors [15, 20, 21]. Malnutrition should be considered in the treatment and perioperative management of patients with cardiovascular disease. Our study showed that more than half of the patients with ACS had malnutrition, and these patients tended to be older in age and have worse perfusion. This could be attributed to the incidence of STEMI. Yokoyama et al. [22] demonstrated similar effects of malnutrition on the blood flow of patients with peripheral arterial atherosclerosis, a multivessel disease; the systemic inflammation caused by malnutrition affecting energy expenditure and protein hydrolysis is involved in this process and can lead to cardiac cachexia [4, 17]. However, no patient had severe malnutrition in our study, which we believe is due to the small sample size, strict exclusion criteria, and the very low prevalence of malnutrition, as reported in similar studies [6, 15].
Atherosclerosis is the most critical factor in the development of cardiovascular disease, which usually involves both lipid accumulation and inflammation. Additionally, the instability of the lesioned plaque under certain causative factors may contribute to local thrombosis and consequent vessel occlusion [23]. In our study, patients with a poorer nutritional status were more likely to have plaque rupture and more vulnerable plaques. This finding could explain the potential mechanism by which malnutrition promotes atherosclerosis progression and might also rationalize the occurrence of cardiovascular events regarding intraluminal imaging. Moreover, the impact of TCFA cannot be ignored, as TCFA itself is a prodromal stage of plaque rupture and may be a predictor of the rapid progression of diseased plaques. A prospective, double-blind, international study confirmed that the presence of TCFA in patients with diabetes with normal flow reserve fraction, significantly increased the risk of MACE; and its sub-study showed that the MACE rate was much higher in TCFA than in thick-cap fibrous atheromatous and non-atherosclerotic plaques [24, 25]. Nakagomi et al. [26] evaluated the carotid intima-media thickness in patients with chronic heart failure using the CONUT score and confirmed that a poor nutritional status was significantly associated with atherosclerosis and inflammation. Subsequently, Mineoka et al. [27] also found that malnutrition contributed to the progression of subclinical atherosclerosis in patients with type 2 diabetes. The pathophysiological mechanisms of malnutrition-induced atherosclerosis are currently recognized as malnutrition-inflammation-atherosclerosis (MIA) syndrome, and the combined involvement of different mechanisms, such as malnutrition-induced inflammatory response and oxidative stress and genetic factors, increases the risk of atherosclerosis [28, 29]. Serum albumin has anti-inflammatory, antioxidant, and antiplatelet effects, and several studies have confirmed that low serum albumin is significantly associated with the development of coronary heart disease and promotes the progression of atherosclerosis, and that this mechanism may be related to the inflammatory response [30, 31, 32]. Cholesterol is a traditional risk factor for atherosclerosis; however, numerous studies have reported the existence of a “cholesterol paradox”, in which low lipid levels may be a marker of advanced disease and systemic inflammatory activation, and contribute to a high vascular inflammatory state [33]. Lymphocytes are essential markers of adaptive immunity, and lower lymphocyte counts are associated with the development of vulnerable plaques [34]. The pro-inflammatory role of malnutrition in the coronary arteries can be further supported by the fact that we observed more macrophage infiltration in the vessels of patients who were malnourished. A study confirmed that the macrophage density on the fibrous cap was negatively correlated with plaque fibrous cap thickness and promoted TCFA formation [35]. LDL particles on the intima require oxidative modification to be taken up by macrophages, which phagocytose these lipoproteins to form foam cells. This further promotes plaque vulnerability as macrophages apoptose and inhibit cytosolic activity, leading to plaque core necrosis as well as poor plaque structural remodeling [23, 36].
BMI also represents the degree of nutritional health of the body and is a risk factor for cardiovascular disease [37]. We combined the CONUT score and BMI and found that malnutrition combined with obesity was an independent predictor of macrophage infiltration, a hyperinflammatory state that appears to indicate an underlying metabolic disease risk. Macrophages may play a vital role in obesity-induced metabolic inflammation, which consequently triggers insulin resistance and metabolic disease [38, 39, 40]. A prospective study showed that metabolically healthy obesity (MHO) is not a steady state and may cause the progression of atherosclerosis with the development of metabolic diseases later in life [41]. Therefore, we believe that early clinical treatment and management of patients who are malnourished and overweight should be conducted to reduce the occurrence of metabolic diseases and thus improve the prognosis. Recent studies have shown that obesity alone is not associated with adverse coronary computed tomography angiography findings and does not increase the risk of MACE in metabolically healthy or unhealthy individuals [42]. Similar results were obtained in our study using OCT analysis of luminal characteristics, with no significant differences in the degree of luminal stenosis and plaque burden in patients with the same nutritional status but differing BMI. The current interpretation is that pericardial and visceral fat volume rather than BMI is associated with atherosclerosis, and two studies by Rodriguez-Granillo et al. [43] and Nafakhi et al. [44] confirmed that pericardial and visceral fat could assess coronary atherosclerotic burden [45]. Previous studies reported an association between MIA and epicardial adipose tissue (EAT); MIA was associated with an increase in EAT, which explains the involvement of malnutrition in the progression of atherosclerosis, and deserves further investigation [46].
This study has some limitations. First of all, it was a single-center, small study, and the combined OCT examination made the included sample size relatively small. Secondly, before OCT imaging, we had performed some procedure methods (intracoronary thrombolysis, thrombus aspiration) to accurately assess plaque characteristics, which caused underestimation of intracoronary thrombosis. Finally, patients were not followed up to further clarify whether plaque progression and improvement of nutritional status could reduce plaque burden, and there is a lack of imaging evidence for prognostic judgments. Therefore, additional collaborative studies with larger sample sizes and multiple centers are needed to further clarify the impact of malnutrition in atherosclerosis.
This paper suggests that malnutrition is associated with atherosclerosis and inflammation and is a predictor of vulnerable plaques, explaining the potential mechanisms by which malnutrition affects cardiovascular outcomes. This study provides new insights for the subsequent comprehensive management of patients with CAD.
ACS, acute coronary syndrome; BMI, body mass index; CI, confidence interval; CONUT, Controlled Nutritional Status Score; HDL-C, high-density lipoprotein cholesterol; LDL-C, low-density lipoprotein cholesterol; MACE, major adverse cardiovascular events; OCT, optical coherence tomography; OR, odds ratio; PCI, percutaneous coronary intervention; TC, total cholesterol; TCFA, thin cap fibroatheroma; TG, triglycerides.
The datasets used or analyzed during the current study are available from the corresponding author on reasonable request.
HHY drafted the manuscript and was the major contributor in the collection, analysis, and interpretation of data. ZYW, CCL, YHL, KXS, and TXL were major contributors in the acquisition and interpretation of data and contributed to the revision of the manuscript. YD, WJY, QY, and FFZ designed the study, provided constructive suggestions for revision of the manuscript and finally approved the manuscript submitted. All authors read and approved the final manuscript. All authors have participated sufficiently in the work and agreed to be accountable for all aspects of the work.
This study was conducted in accordance with the Standards of the Declaration of Helsinki, since this study was based on a retrospective cohort study and all indicators were obtained from the medical record system, the informed consent exemption was applied for, also approved by the Ethics Committee of the Heibei General Hospital (NO. 2023107)
This work was supported by the Hebei Province Medical Applicable Technology Tracking Project [grant number GZ2022001].
This research received no external funding.
The authors declare no conflict of interest.
Publisher’s Note: IMR Press stays neutral with regard to jurisdictional claims in published maps and institutional affiliations.