1. Introduction
Dilated cardiomyopathy (DCM) is a cardiac disorder characterised by ventricular
dilation and systolic dysfunction that may lead to adverse cardiac events
including heart failure (HF) and arrhythmias [1]. The current risk stratification
for DCM is primarily based on the severity of left ventricular systolic
dysfunction (LVSD), with a left ventricular ejection fraction (LVEF) of 30% or
35% as the threshold, which is also used to determine eligibility for device
treatment such as cardiac resynchronisation therapy (CRT) or implantable
cardioverter-defibrillator (ICD) [2]. Nevertheless, relatively few patients with
LVEF of 30–50% have been randomised into trials to receive device therapy.
Consequently, these patients lack valuable markers for predicting outcomes and
determining whether they require device treatment.
An earlier study found that patients with mild-to-moderate cardiomyopathy
(ischaemic or non-ischaemic, LVEF 36–50%) who had complicated diabetes mellitus
(DM) were at greater risk of poor prognosis than severe cardiomyopathy patients
without DM (LVEF 35%) [3]. However, in patients with non-ischaemic DCM
and an LVEF of 30–50%, relevant risk factors determining the best beneficiaries
of therapy remain undefined. Several studies have shown the prognostic role of
prolonged QRS duration (QRSd) in heart
failure with reduced ejection fraction (HFrEF) and heart failure with preserved
ejection fraction (HFpEF), supporting its use as a risk stratification tool
[4, 5, 6]. A previous study demonstrated that
characteristics including age, male gender, history of DCM and reduced LVEF were
independently associated with QRSd 120 ms [4]. However, evidence
regarding the prognostic role of prolonged QRSd remains limited in patients with
non-ischaemic DCM stratified by LVEF, especially in those with an LVEF 30–50%.
Based on this, our research aims to (1) explore the prognostic effects of QRSd
120 ms in patients with DCM and a LVEF 30–50% or LVEF 30% and (2)
examine the outcomes in patients with DCM and QRSd 120 ms and LVEF
30–50% versus those with QRSd 120 ms and LVEF 30% to improve the risk
stratification for DCM and identify the appropriate patient population for device
implantation.
2. Materials and Methods
2.1 Patients
We prospectively included patients admitted to the Fuwai Hospital between 2006
and 2017 with a diagnosis of DCM and an LVEF 50%. We excluded patients
(1) with coronary heart disease (CAD) or other types of cardiomyopathies; (2)
with LVEF 50%; (3) with a pacemaker, ICD, or CRT; (4) with missing
electrocardiogram (ECG), echocardiography, or follow-up data; and (5) with an
inconsistent diagnosis of left bundle branch block (LBBB) or QRS widths (LBBB
present and QRSd 120 ms).
2.2 Data Collection and Outcomes
Patients with DCM were further stratified into groups with LVEF 30–50% or LVEF
30%. Demographic, diagnostic, laboratory test, medical therapy, ECG, and
echocardiography data were obtained from an electronic medical system.
A 2-dimensional echocardiogram was performed by an imaging
expert, and LVEF was calculated using the Simpson method with apical 2- and
4-chamber views. The QRSd was obtained from automatic ECG readings and confirmed
by a cardiologist.
The primary outcome was a composite of death, heart
transplantation, and first-time readmission owing to worsening HF. Follow-up was
conducted through clinic visits or telephone calls after discharge. All
participants signed an informed consent form, and the study was conducted in
accordance with the Declaration of Helsinki with the approval of the ethics
committee.
2.3 Statistical Analysis
We performed statistical analyses to compare the characteristics of patients
with QRSd 120 ms and QRSd 120 ms. Categorical variables were assessed
using the test, whereas continuous variables were evaluated using
the Mann-Whitney U test. Additionally, multivariate logistic regression was
employed to determine the characteristics that were independently correlated with
QRSd 120 ms.
We used the Kaplan-Meier curves and log-rank tests to compare the outcomes in
the LVEF 30–50% group vs. LVEF 30% group, the QRSd 120 ms group vs. QRSd
120 ms group, and among the four-level groups (LVEF 30–50% vs. LVEF
30%, and QRSd 120 ms vs. QRSd 120 ms). Cox regression analyses
were performed to investigate the independent prognostic role of QRS prolongation
in the overall LVEF 30–50%, and LVEF 30% cohorts. Variables routinely
available in clinics and known to be associated with prognosis were selected
prospectively, including age, sex, history of hypertension, history of atrial
fibrillation (AF), history of diabetes, New York Heart Association (NYHA) class, haemoglobin levels,
log-transformed creatine levels, therapy with angiotensin converting enzyme inhibitor/angiotensin receptor blocker (ACEI/ARB), and -blockers,
to establish two baseline models (including log-transformed N-terminal pro brain natriuretic peptide (NT-ProBNP) or
untransformed). Restricted cubic splines (using 4 knots) were used to investigate
the potential non-linear relationship between QRSd and outcomes. After that, a
1:1 propensity-score-matched cohort for age, sex, history of hypertension and
left ventricular end-diastolic diameter between patients with QRSd 120 ms
and LVEF 30–50%, and those with QRSd 120 ms and LVEF 30% was
constructed, and the outcome of these two groups were compared. Schoenfeld
residual plots were used to test the proportional hazard assumption.
For the sensitivity analysis, we also performed the above analysis in patients
without LBBB. Moreover, we evaluated the discriminative ability of the best
prediction model by adding QRS prolongation to predict the composite outcome
using Harrell’s C-statistic. The variables in the best model were based on
stepwise selection and important factors (age and sex) with a significance level
of 0.1 for entry and retention. Finally, net reclassification improvement (NRI)
and integrated discrimination improvement (IDI) were assessed over five years.
Statistical significance was defined as a p-value 0.05. Statistical
analyses were conducted using R software version 4.1.3 (R Foundation for
Statistical Computing, Vienna, Austria).
3. Results
3.1 Baseline Characteristics and Predictors of QRSd 120 ms
We included 633 patients with DCM in this
study, of which 47.7% of the patients had a LVEF 30–50% and 35.7% of the
patients had QRSd 120 ms (Supplementary Fig. 1). The
distribution of QRSd in the groups with LVEF 30–50% and LVEF 30% is shown
in Fig. 1. A comparison of characteristics between patients with QRSd 120
ms and those with QRSd 120 ms is shown in Table 1. Supplementary Table 1 presents the characteristics stratified by LVSD severity,
whereas Supplementary Table 2 displays the characteristics categorised
into four groups. Patients with QRSd 120 ms had lower systolic blood
pressure (SBP), a reduced body mass index, higher NT-ProBNP level, and lower
LVEF than those with QRSd 120 ms, the usage of ACEI/ARBs and
-blockers were also lower among these patients. Characteristics
including age (odds ratio [OR] 1.03), heart rate (OR 0.99), LVEF (OR 0.97), and
history of diabetes (OR 0.56) were independently associated with QRSd 120
ms (p 0.05, Supplementary Table 3).
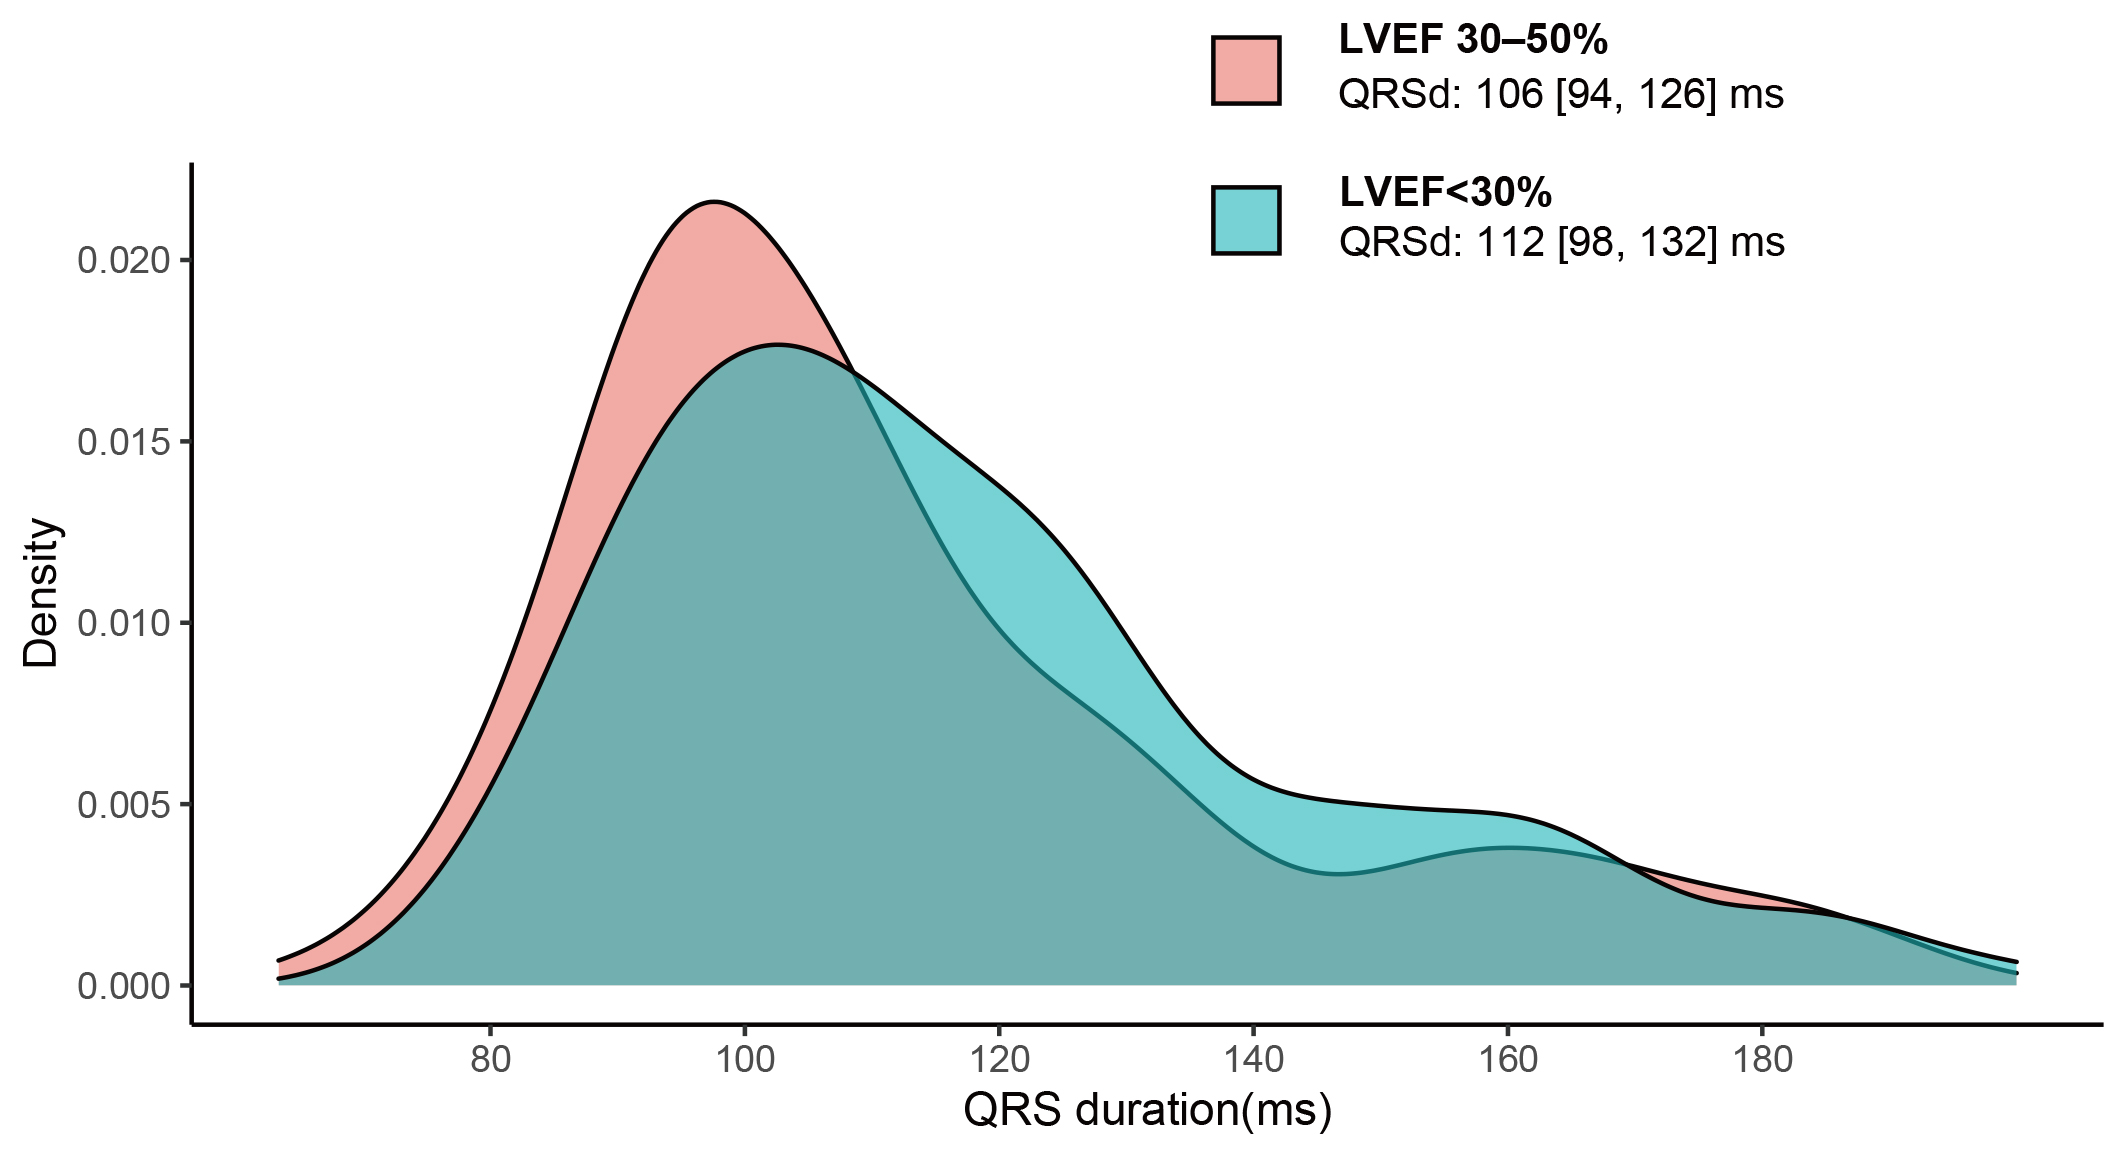 Fig. 1.
QRS duration distribution for DCM patients
with LVEF
30–50% and LVEF 30%. The median (IQR)
of QRSd was 106 (94, 126) ms in patients with LVEF 30–50% and 112 (98, 132) in
patients with LVEF 30%, p = 0.003. DCM, dilated cardiomyopathy; LVEF,
left ventricular ejection fraction; QRSd, QRS duration.
Table 1.Baseline characteristics for patients with DCM and QRS duration
120 ms vs. 120 ms.
| N |
Overall |
QRSd 120 ms |
QRSd 120 ms |
p-value |
| 633 |
407 |
226 |
| Clinical characteristics |
|
|
|
|
|
Age (years) |
48 [36, 59] |
46 [32, 57] |
52 [43, 62] |
0.001 |
|
Female (%) |
151 (23.9) |
94 (23.1) |
57 (25.2) |
0.614 |
|
Heart rate (b.p.m) |
83 [72, 96] |
86 [75, 98] |
79 [70.25, 92] |
0.001 |
|
SBP (mmHg) |
112 [100, 124] |
113 [101.50, 125] |
110 [98, 120] |
0.003 |
|
DBP (mmHg) |
71 [63, 80] |
73 [65, 82] |
70 [60, 75.75] |
0.001 |
|
BMI (kg/m) |
24.28 [21.48, 27.48] |
24.71 [21.92, 27.81] |
23.33 [20.41, 26.55] |
0.001 |
|
Diabetes (%) |
109 (17.2) |
78 (19.2) |
31 (13.7) |
0.103 |
|
Hypertension (%) |
186 (29.4) |
121 (29.7) |
65 (28.8) |
0.869 |
|
NYHA Class III/IV (%) |
505 (79.8) |
315 (77.4) |
190 (84.1) |
0.057 |
|
Smoking (%) |
200 (50.1) |
129 (49.2) |
71 (51.8) |
0.700 |
|
Length of stay (days) |
10 [8, 14] |
10 [8, 13] |
11 [8, 14] |
0.002 |
| Electrocardiography |
|
|
|
|
|
QRS duration (ms) |
108 [96, 128] |
100 [92, 108] |
144 [128, 164] |
0.001 |
|
PR interval (ms) |
176 [160, 196] |
174 [156.50, 189.92] |
186 [164.35, 208] |
0.001 |
|
QT interval (ms) |
392 [362, 434] |
380 [355, 412] |
426.50 [390, 454.75] |
0.001 |
|
QTc interval (ms) |
457 [430, 486] |
447 [423.76, 470.50] |
481.50 [453, 505] |
0.001 |
|
AF (%) |
142 (22.4) |
94 (23.1) |
48 (21.2) |
0.662 |
|
NSVT (%) |
172 (27.2) |
102 (25.1) |
70 (31.0) |
0.131 |
| Laboratory Test |
|
|
|
|
|
Haemoglobin (g/L) |
147 [134, 160] |
148 [136, 161] |
145 [131, 157] |
0.039 |
|
WBC (10/L) |
7.22 [6.11, 8.64] |
7.36 [6.16, 8.66] |
6.97 [5.96, 8.55] |
0.360 |
|
K (mmol/L) |
3.95 [3.67, 4.26] |
3.91 [3.65, 4.23] |
4.00 [3.74, 4.28] |
0.047 |
|
Na (mmol/L) |
137.96 [135, 140] |
138 [135.30, 140] |
137.04 [134.49, 139.99] |
0.083 |
|
FBG (mmol/L) |
5.06 [4.60, 5.76] |
5.08 [4.61, 5.86] |
4.99 [4.59, 5.61] |
0.278 |
|
Scr (umol/L) |
90.05 [75.88, 107.05] |
91.04 [75.33, 106.82] |
88.90 [77.22, 107.78] |
0.856 |
|
NT-ProBNP (pg/mL) |
2142 [953.50, 4886.65] |
1984 [934, 4260] |
2557 [1058, 5544] |
0.050 |
| Echocardiography |
|
|
|
|
|
LAD (mm) |
45 [41, 50] |
45 [41, 50] |
46 [41, 52] |
0.028 |
|
LVEDD (mm) |
69 [63, 75] |
68 [63, 73] |
71 [64, 79.75] |
0.001 |
|
LVEF (%) |
29 [24, 34] |
30 [24, 35] |
28 [23, 33] |
0.009 |
|
RVD (mm) |
25 [22, 29] |
25 [22, 29] |
25 [22, 28] |
0.317 |
| Therapy |
|
|
|
|
|
Digoxin (%) |
512 (80.9) |
333 (81.8) |
179 (79.2) |
0.486 |
|
ACEI/ARB (%) |
453 (71.6) |
304 (74.7) |
149 (65.9) |
0.024 |
|
-blocker (%) |
580 (91.6) |
380 (93.4) |
200 (88.5) |
0.049 |
|
MRA (%) |
584 (92.3) |
380 (93.4) |
204 (90.3) |
0.214 |
|
Diuretics (%) |
515 (81.4) |
329 (80.8) |
186 (82.3) |
0.729 |
The values are presented as the median [interquartile range] or as frequencies
with corresponding percentages.
SBP, systolic blood pressure; DBP, diastolic blood pressure; BMI, body mass
index; AF, atrial fibrillation; NSVT, non-sustained ventricular tachycardia; LAD, left atrial diameter; LVEDD, left
ventricular end-diastolic diameter; LVEF, left
ventricular ejection fraction; RVD, right ventricular diameter; WBC, white blood
cell; Scr, serum creatine; NT-ProBNP,
N-terminal pro brain natriuretic peptide;
ACEI, angiotensin converting enzyme
inhibitor; ARB, angiotensin receptor blocker; MRA, mineralocorticoid receptor
antagonists; DCM, dilated cardiomyopathy; QRSd, QRS duration; NYHA, New York Heart Association; FBG, fasting blood glucose.
3.2 A Comparison of Primary Outcome for DCM Patients with LVEF
30–50% vs. LVEF 30%
During a median follow-up of 33 (12–53) months, one of the primary outcomes
occurred in 331 patients, of whom 192 died (30.3%), 26 underwent heart
transplantation (4.1%), and 113 were readmitted for worsening HF
(17.9%). The event rates separated by LVSD and QRS groups are shown in
Supplementary Table 4. Patients with DCM and a LVEF 30% had worse
outcomes than those with LVEF 30–50% (crude HR 1.81, 95% CI 1.45–2.25,
p 0.001). Kaplan-Meier curves are presented in Fig. 2A. Patients
with LVEF 30% still had a higher risk of adverse events after adjusting for
confounders (adjusted HR 1.38, 95% CI 1.09–1.76, p = 0.009).
 Fig. 2.
Comparison of the primary outcome between patients
with LVEF 30–50% and LVEF 30% (A), and
between patients with QRSd 120 ms vs. QRSd
120 ms (B). LVEF, left ventricular ejection fraction;
QRSd, QRS duration.
3.3 Prognostic Value of QRSd
in Overall DCM Patients and When Stratified by LVEF
In the overall cohort, patients with QRSd 120 ms exhibited a higher
likelihood of reaching one of the primary endpoints than the QRSd 120 ms group
(crude HR 1.86, 95% CI 1.49–2.31, p 0.001, Fig. 2B). As a
continuous variable, increasing QRSd was also associated with outcomes (crude HR
1.07, 95% CI 1.04–1.09, p 0.001, per 10 ms increase). After
controlling for potential confounding factors with NT-ProBNP, this association
was observed both when considering it as a categorical variable (adjusted HR
1.65, 95% CI 1.29–2.11, p 0.001) and as a continuous variable
(adjusted HR 1.06, 95% CI 1.03–1.09, p 0.001 per 10 ms increase).
A QRSd 120 ms was also an independent predictor for the composite
outcome when patients were stratified by LVEF (Table 2). QRSd 120 ms
showed prognostic value in patients with DCM and a LVEF 30–50%, the unadjusted
HR was 1.95 (95% CI 1.37–2.78, p 0.001) and the adjusted HR was
2.8 (95% CI 1.82–4.30, p 0.001). The result was consistent in
patients with DCM who had a LVEF 30%, with the crude HR 1.63 (95% CI
1.23–2.16, p 0.001) and the adjusted HR 1.41 (95% CI 1.02–1.94,
p = 0.036). However, the prognostic role of increasing QRS as a
continuous variable (per 10 ms) was significant in patients with LVEF 30–50%
(adjusted HR 1.06, 95% CI 1.03–1.10, p 0.001) but not in the LVEF
30% group (adjusted HR 1.04, 95% CI 0.99–1.10, p = 0.116) in a
multivariate model including NT-ProBNP. There was no statistically significant
interaction between LVEF and QRSd as a binary (p = 0.067) or continuous
(p = 0.975) variable. Restricted cubic splines of the association
between QRSd and the outcomes are shown in Supplementary Fig. 2. We also
used a 4-level variable (LVEF 30–50% vs. LVEF 30%, and QRSd 120 ms
vs. 120 ms) to compare the outcome among four groups (Fig. 3). Patients with a
QRSd 120 ms and a LVEF 30–50% had similar event-free survival to those
who had a LVEF 30% and QRSd 120 ms (HR 0.94, 95% CI 0.68–1.32, p
= 0.73). In addition, propensity-score matching was conducted between patients
with a LVEF 30–50% and QRSd 120 ms and those with a LVEF 30% with
QRSd 120 ms for age, sex, history of hypertension, and left ventricular
end-diastolic diameter. The results of the overall cohort were consistent with
those in the matching cohort (HR 0.91, 95% CI 0.61–1.36, p = 0.645;
Supplementary Fig. 3).
Table 2.Prognostic value of QRS duration in overall DCM cohort,
patients with LVEF 30–50% and LVEF 30%.
| Populations |
Model |
HR (95% CI) |
p-value |
HR (95% CI) |
p-value |
| QRSd 120 vs. 120 ms |
QRSd per 10 ms increase |
| Overall cohort with DCM |
Unadjusted |
1.86 (1.49, 2.31) |
0.001 |
1.07 (1.04, 1.09) |
0.001 |
| Clinical Model |
1.68 (1.33, 2.13) |
0.001 |
1.06 (1.03, 1.09) |
0.001 |
| Clincal Model+NT-ProBNP |
1.65 (1.29, 2.11) |
0.001 |
1.06 (1.03, 1.09) |
0.001 |
| LVEF 30–50% |
Unadjusted |
1.95 (1.37, 2.78) |
0.001 |
1.07 (1.03, 1.11) |
0.001 |
| Clinical Model |
2.41 (1.61, 3.62) |
0.001 |
1.06 (1.02, 1.10) |
0.002 |
| Clincal Model+NT-ProBNP |
2.80 (1.82, 4.30) |
0.001 |
1.06 (1.03, 1.10) |
0.001 |
| LVEF 30% |
Unadjusted |
1.63 (1.23, 2.16) |
0.001 |
1.07 (1.02, 1.12) |
0.005 |
| Clinical Model |
1.52 (1.12, 2.07) |
0.008 |
1.05 (1.003, 1.11) |
0.039 |
| Clincal Model+NT-ProBNP |
1.41 (1.02, 1.94) |
0.036 |
1.04 (0.99, 1.10) |
0.116 |
The adjusted HR was calculated in multivariable COX regression model including
age, gender, history of hypertension, history of atrial fibrillation, history of
diabetes, NYHA class, hemoglobin, log-transformed creatine, therapy with ACEI/ARB
and -blockers, with and without log-transformed NT-ProBNP. DCM, dilated
cardiomyopathy; LVEF, left ventricular ejection fraction; NT-ProBNP, N-terminal
pro brain natriuretic peptide; ACEI, angiotensin converting enzyme inhibitor;
ARB, angiotensin receptor blocker; HR, hazard ratio; QRSd, QRS duration; NYHA, New York Heart Association.
 Fig. 3.
Kaplan-Meier survival curves of patients with DCM stratified by
LVEF and by QRS duration. DCM, dilated cardiomyopathy;
LVEF, left ventricular ejection fraction; QRSd, QRS duration.
3.4 Sensitivity Analysis for
Patients without LBBB
Sensitivity analyses were performed in 565 patients without LBBB. The prognostic
value of QRS prolongation was consistent with that in the overall cohort and in
patients without LBBB, when stratified by LVEF (Fig. 4). The multivariate HR for
QRSd 120 ms was 1.69 (95% CI 1.29–2.21) in DCM patients without LBBB.
 Fig. 4.
Forest plots for the
hazard ratios of QRS 120 ms stratified by LVEF in overall cohort and in
patients without LBBB. The adjusted HR was calculated in multivariable COX
regression model including age, gender, history of hypertension, history of
atrial fibrillation, history of diabetes, NYHA class, hemoglobin, log-transformed
creatine, log-transformed NT-ProBNP, therapy with ACEI/ARB and
-blocker. LBBB, left bundle branch
block; LVEF, left ventricular ejection fraction;
NT-ProBNP, N-terminal pro brain natriuretic peptide; ACEI, angiotensin
converting enzyme inhibitor; ARB, angiotensin receptor blocker; HR, hazard ratio; NYHA, New
York Heart Association; HR, hazard ratio.
3.5 Discrimination and
Reclassification of the Prediction Model Including QRS Prolongation
The best predictive model was determined using stepwise Cox regression
(including age, sex, history of hypertension, history of AF, NYHA class,
haemoglobin levels, sodium concentration, log-transformed NT-ProBNP, and therapy
with ACEI/ARB and -blockers) which yielded a c-index of 0.726 for the
overall cohort of patients with DCM. QRSd 120 ms improved the
c-statistics, IDI, and NRI for the overall population with DCM as well as for
patients with a LVEF
30–50%, however, it
did not achieve statistical significance for patients with LVEF 30% (Table 3).
Table 3.Continuous net
reclassification index (cNRI) and integrated discrimination improvement
(IDI) index of the additional value of QRS prolongation of the prediction model.
|
C-index |
p-value |
IDI |
p-value |
cNRI |
p-value |
| Overall Cohort |
0.006 |
0.001 |
0.026 (0.007, 0.055) |
0.002 |
0.219 (0.071, 0.326) |
0.014 |
| LVEF 30–50% |
0.017 |
0.001 |
0.071 (0.020, 0.127) |
0.002 |
0.233 (0.041, 0.425) |
0.020 |
| LVEF 30% |
0.003 |
0.052 |
0.016 (–0.003, 0.045) |
0.138 |
0.226 (–0.109, 0.38) |
0.154 |
The baseline model constructed based on
stepwise regression [including age, gender, history of hypertension, history of
atrial fibrillation, NYHA class, hemoglobin, Na, log-transformed NT-ProBNP,
therapy with ACEI/ARB and -blockers]. cNRI and IDI were calculated at 5
years follow-up. cNRI, continuous net reclassification index; IDI, integrated
discrimination improvement; LVEF, left ventricular ejection fraction;
NT-ProBNP, N-terminal pro brain natriuretic peptide; ACEI, angiotensin
converting enzyme inhibitor; ARB, angiotensin receptor blocker; NYHA, New York Heart Association.
4. Discussion
4.1 Main Findings
In this study, 47.7% of the patients with DCM had a LVEF of 30–50%. Our
results indicated that QRSd 120 ms was an independent predictor for
outcome in the overall DCM patients, the patients with LVEF of 30–50%, and
those with LVEF 30%. However, its independent prognostic role as a continuous
variable (per 10 ms increase) was insignificant in patients with LVEF 30%.
Moreover, DCM patients with QRSd 120 ms and LVEF of 30–50% experienced
a similar prognosis to those with LVEF 30% and QRSd 120 ms.
4.2 LVSD in Patients with DCM
LVSD, determined by LVEF, remains the most critical parameter for diagnosis,
phenotyping, and treatment decision-making in HF [7]. Patients with
mild-to-moderately reduced LVEF (30% or 35%–50%), especially those with
nonischaemic dilated cardiomyopathy, present with significant gaps in risk
stratification and optimal treatment [8]. In this cohort of patients with DCM,
nearly half had a LVEF of 30–50%. Despite having a better outcome than that in
patients with an LVEF 30%, 20% of the patients died during follow-up.
Although a previous DCM registry also confirmed that the risk is higher in
patients with severely impaired LVEF, patients with mildly or moderately reduced
LVEF are more common, and their risk remains significant [9]. Additionally,
studies on patients with out-of-hospital cardiac arrest have shown that 70–80%
have a LVEF 35%, suggesting that the majority of sudden cardiac death occur
in patients with less severe LVSD [10, 11]. To further guide patients with an
LVEF of 30–50%, it is important to identify the subset of this group of
high-risk patients.
4.3 Prognostic Value of QRSd in DCM Patients across the Range of
LVEFs
ECG has traditionally been considered nonspecific in DCM, but studies evaluating
genotype-phenotype correlations have provided new insights into identifying
specific abnormalities or subtypes of DCM [12]. Earlier studies found that QRS is
an independent risk factor for all-cause death in patients with HF, regardless of
age, sex, NYHA class, and LVEF (30%, 30–39%, 40–49%, and 50%) [4, 13, 14, 15]. Furthermore, the presence of severe conduction disorders such as LBBB or
prolonged QRSd not only increases the patient’s susceptibility to tachyarrhythmia
but also elevates the risk of bradyarrhythmia with atrioventricular block,
consequently reducing overall survival.
Severely reduced LVEF results in a longer
QRSd than mildly reduced LVEF owing to more severe remodelling and fibrosis [4].
In addition, Asians have a steeper increase in QRSd with a reduction in LVEF than
whites [5]. We found similar findings in our study of a cohort of patients with
nonischaemic DCM in China.
Moreover, DCM is more likely associated with prolonged QRS than ischaemic heart
disease, suggesting that prolonged conduction is not the result of focal
ischaemia [6, 16]. Based on the different relationships between the aetiologies
and QRSd, we limited the study population to patients with DCM and LVEF
50%. Although there was no statistically significant interaction between
QRSd 120 ms and LVEF in our study (p = 0.067), the association
between QRSd 120 ms and composite events appeared to be more pronounced
in patients with LVEF of 30–50% than in those with LVEF 30% (Fig. 4). The
cause of the difference between the subgroups remains unclear, partly due to
patients with low LVEF already being identified as a high-risk group. However,
this suggests that patients with DCM and a QRSd 120 ms are at high risk
of adverse events despite the absence of severe LVSD and need further risk
stratification. The present data also show that the addition of QRS prolongation
can improve model discrimination and reclassification, thus helping resolve the
problems of risk stratification based only on LVEF and the poor specificity of
LVEF-based guidelines [9].
4.4 Device Implantation in Patients with QRS Prolongation and LVEF
30–50%
A recent cardiac magnetic resonance (CMR) study showed that additional
prognostic stratification could be obtained by combining late gadolinium
enhancement (LGE) and QRSd, which could improve the appropriate placement of ICDs
in DCM patients [17]. However, this study did not analyse a subgroup of patients
with mild-to-moderate LVSD. Another study showed that mid-wall LGE identifies a
group of DCM patients with a LVEF 40% were at increased risk of sudden
death, suggesting these patients might benefit from ICD implantation [18].
Further research is required to investigate the prognostic significance of the
combination of LGE and QRSd in patients with DCM and mild-to-moderate LVSD, as
well as the benefits of LGE and wide QRS for CRT with a defibrillator (CRT-D).
Other risk factors that prove to be predictors for this group of patients, such
as older age, history of DM, HF, or haemoglobin levels [3], can also be included
to build a predictive model using CMR and ECG parameters.
CRT or CRT-D has been
class I recommended in patients with HF in sinus rhythm with a QRSd 150
ms, LBBB, and LVEF 35% despite the optimal medical therapy [2]. However,
its effects have not yet been established in patients with less severe LVSD. Only
some post-hoc analyses have suggested that CRT might be effective in patients
with more mildly decreased LV function (LVEF 30% or 35%) [8, 19, 20]. Our
study demonstrated that DCM patients with QRSd 120 ms and LVEF 30–50%
did not experience a significantly better outcomes than those with LVEF 30%
and QRSd 120 ms. This finding suggested that patients with QRSd 120 ms
might benefit from a comprehensive assessment for device implantation, even in
the absence of severely reduced LVEF. Such an evaluation should encompass factors
such as a family history of arrhythmic risks, the presence of CMR-LGE, and
dynamic changes in cardiac structure and function subsequent to guideline
directed medical therapy (GDMT). Furthermore, patients with LVEF of 30–50% may
also necessitate intensive pharmacological interventions, such as
sacubitril-valsartan or sodium-glucose cotransporter 2 (SGLT2) inhibitors, both
of which may reverse remodelling [21, 22]. Subsequently, a close follow-up should
be implemented and the eligibility for CRT should be re-evaluated based on the
responsiveness to drug treatment.
4.5 Limitations
This study had several limitations. First, the left ventricular (LV) function of patients with DCM
may undergo a dynamic change during follow-up; however, relatively few patients
had available follow-up echocardiograms; therefore, it was not analysed in the
present study. Second, the limited sample size, notably when patients were
stratified by LVSD severity, is another limitation of the current study.
Therefore, instead of using LVEF 35% recommended by the current guidelines
to classify severe LVSD, we used an LVEF cut-off of 30% to ensure a sufficient
sample size in each subgroup. Third, because this was an observational study,
meaning some potential confounding factors could not be adjusted for using
multivariate analyses.
5. Conclusions
A QRSd 120 ms was independently associated with outcomes in overall
patients with DCM, as well as in those with LVEF of 30–50% or LVEF 30%.
QRSd 120 ms more strongly predicts outcomes in patients with LVEF of
30–50% than in those with LVEF 30%. DCM patients with QRSd 120 ms
and LVEF of 30–50% did not experience a significantly better outcome to those
with LVEF 30% and QRSd 120 ms. These data imply that QRS prolongation
could help in risk stratification of patients with DCM regardless of LVEF.
Further prospective studies are needed to verify the benefits of CRT or CRT-D
implantation in DCM patients with an LVEF of 30–50% and prolonged QRSd.
Availability of Data and Materials
The datasets used and/or analyzed during the current study are available from
the corresponding author on reasonable request.
Author Contributions
JF and JZ designed the research study. JF performed the research, analyzed and
wrote the manuscript. XZ, BH, LH, YW, JW, JG, XL and YZ help and advice on data
collection and revising the manuscript. All authors contributed to editorial
changes in the manuscript. All authors read and approved the final manuscript.
All authors have participated sufficiently in the work and agreed to be accountable
for all aspects of the work.
Ethics Approval and Consent to Participate
All participants have signed the informed consent form with the approval of the
Ethics Committee of Fuwai Hospital (Approval numbers 2014-501).
Acknowledgment
Not applicable.
Funding
This work was supported by the National Nature Science Foundation of China
[grant number 81873472]; Chinese Academy of Medical Sciences (CAMS) Innovation Fund for Medical Science [grant number
2020-I2M-1-002].
Conflict of Interest
The authors declare no conflict of interest.
