
- Academic Editor
Background: The ratio of fibrinogen to
In the 1940s, cardiovascular disease was the leading cause of death in the United States, accounting for half of all deaths. Approximately every 40 seconds, someone in the United States has an acute heart attack. Throughout Europe, coronary heart disease is responsible for approximately 1.8 million deaths per year [1]. According to the 2017 Global Burden of Disease study, ischemic heart disease is one of the most disabling diseases. Circulatory diseases caused 1779 million deaths worldwide in 2017 (an increase of 44.9% compared to 1990) [2]. Joseph P et al. [3] showed that while age-standardized mortality from cardiovascular disease has declined, the absolute number of deaths continues to increase, with most deaths now occurring in low- and middle-income countries. According to the China Cardiovascular Health and Disease Report 2020, cardiovascular disease is the leading cause of death in urban and rural areas in China, accounting for 46.66% in rural areas and 43.81% in urban areas. The economic burden of cardiovascular disease on residents and society is increasing [4]. With the continuous development of society, the diagnosis and treatment of coronary heart disease are also continually improving. For example, the development of body surface imaging (cardiac magnetic resonance imaging (MRI), myocardial metabolic imaging and Single-Photon Emission Computed Tomography (SPECT)) and endovascular imaging (optical coherence tomography (OCT), intravascular ultrasound (IVUS) and fractional flow reserve (FFR)); the gold standard of coronary angiography in the diagnosis of coronary heart disease (CHD), the establishment and use of stem cells and degradable stents in the treatment of CHD; and large sample clinical and genetic databases have all resulted in improved outcomes for patients with CHD. However, the numbers of CHD patients and deaths in low- and middle-income countries are still on the rise, and the burden of disease on society and CHD patients is still significant.
Clinical studies have confirmed that traditional risk factors for CHD are
associated with poor prognosis of CHD, such as age, sex, smoking, drinking,
history of diabetes mellitus, history of hypertension, and risk factors such as
lipid levels. With the advent of cardiac markers, N-terminal pro brain
natriuretic peptide (NT-proBNP) and troponin were also associated with poor
prognoses of CHD. Additionally, Fibrinogen and γ-glutamine transferase (GGT) are also associated with poor
prognosis but the predictive value of their ratio
(fibrinogen/
A total of 6050 patients who were hospitalized for CHD at the Heart Center of the First Affiliated Hospital of Xinjiang Medical University from Jan 1, 2008 to Dec 31, 2016 were enrolled in the study. The following inclusion criteria were used: patients who were diagnosed with coronary heart disease after completing coronary angiography after admission, including stable angina, unstable angina, acute ST-segment elevation myocardial infarction and nonacute ST-segment elevation myocardial infarction. The following exclusion criteria were used: (1) patients with incomplete clinical blood data for fibrinogen and gamma-glutamic-aminotransferase; (2) patients with previous coagulation dysfunction; (3) pregnant women and lactating women; (4) patients with mental illness; and (5) patients who refused follow-up. After passing the inclusion as well as exclusion criteria, 5638 patients with CHD were finally enrolled in the study (specific process is described in Fig. 1).
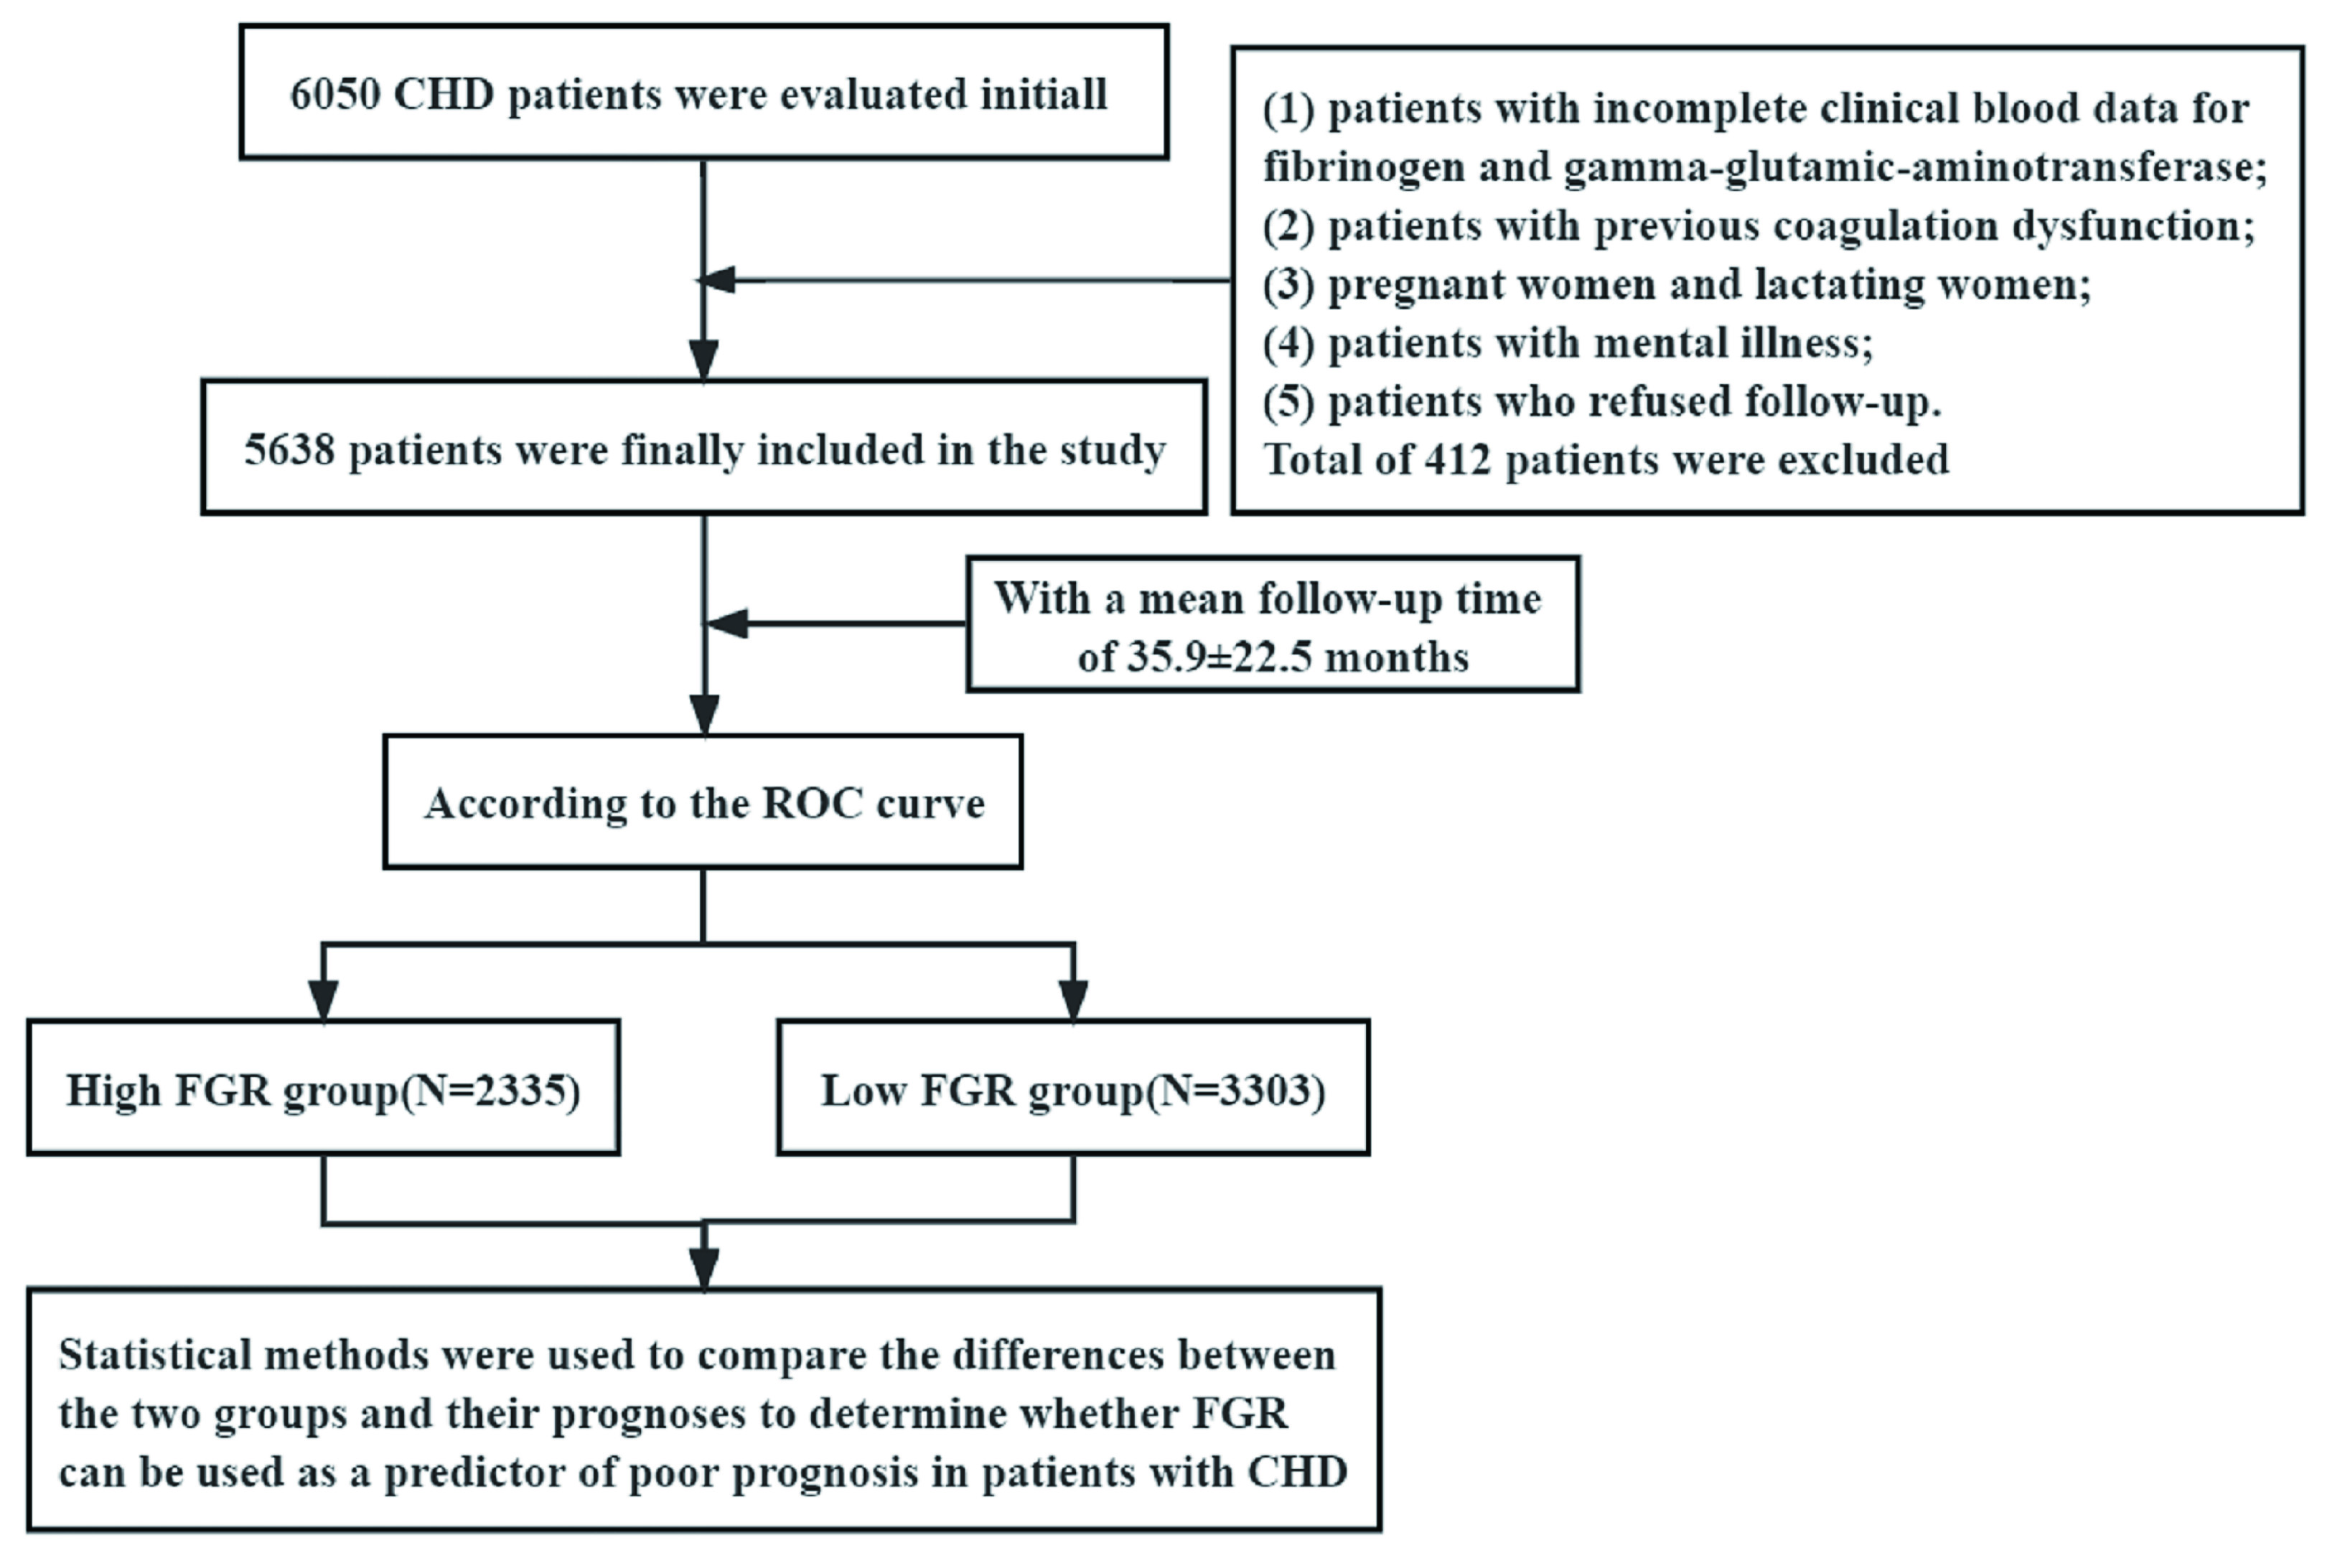 Fig. 1.
Inclusion of research objects and flow chart. CHD, coronary heart disease; ROC, receiver operating characteristic; FGR, fibrinogen/γ-glutamine transerase.
General and clinical data of patients were collected from the electronic medical
record system of the hospital. General information included age, sex, previous
smoking and alcohol use, past history of hypertension and
diabetes mellitus (DM). Clinical data
included fibrinogen, blood urea nitrogen (BUN),
The mean follow-up was (35.9
SPSS 21.0 statistical analysis software (IBM Corp., Armonk, NY, USA) was used
for data analysis and processing. The number of cases (as percentages) was used
in counting the data. First, the measured data were tested for a normal
distribution. The measured data that matched or nearly matched the normal
distribution were used
From the receiver operating curve, the optimal cut-off value (FGR = 1.22, p = 0.002) was determined, and the patients were classified into high and low FGR groups according to the optimal cut-off value. Differences were found between the two groups in age, sex, history of hypertension, triglyceride levels, total cholesterol levels, high-density lipoprotein levels, low-density lipoprotein levels, left ventricular ejection fraction, number of vessels with coronary artery disease, poststent dilation, poststent dilation pressure and the amount of multivessel coronary disease. The high FGR group was older than the low FGR group; additionally, the high FGR group had more females, had more hypertension, lower triglyceride levels, lower total cholesterol levels, higher HDL-C levels, lower LDL-C levels, higher left ventricular ejection fraction, more coronary lesions, less need for post-dilation, less need for post-stenting, lower coronary dilatation pressure and a higher number of multivessel coronary lesions, according to Tables 1,2.
| Low FGR group | High FGR group | p | T | 95% CI | ||
| (N = 3303) | (N = 2335) | Lower | Upper | |||
| Age (years) | 59.127 |
59.981 |
0.003 | –2.924 | –1.426 | –0.281 |
| BUN (mmol/L) | 5.543 |
5.492 |
0.262 | 1.123 | –0.038 | 0.141 |
| Scr (mmol/L) | 76.043 |
75.779 |
0.634 | 0.477 | –0.823 | 1.351 |
| UA (mmol/L) | 324.252 |
322.598 |
0.496 | 0.680 | –3.112 | 6.420 |
| TG (mmol/L) | 2.062 |
1.673 |
11.875 | 0.325 | 0.454 | |
| TC (mmol/L) | 3.991 |
3.924 |
0.028 | 2.204 | 0.007 | 0.127 |
| HDL-C (mmol/L) | 1.005 |
1.045 |
0.003 | –2.949 | –0.066 | –0.013 |
| LDL-C (mmol/L) | 2.490 |
2.425 |
0.009 | 2.611 | 0.016 | 0.114 |
| LVEF (%) | 60.897 |
61.390 |
0.013 | –2.485 | –0.882 | –0.104 |
| Number of lesion vessels (n) | 1.980 |
2.050 |
0.002 | –3.034 | –0.114 | –0.025 |
| Pre-dilation pressure (atm) | 11.818 |
11.841 |
0.820 | –0.228 | –0.216 | 0.171 |
| Post-dilation pressure (atm) | 13.980 |
13.712 |
0.018 | 2.377 | 0.047 | 0.490 |
| Stent length (mm) | 27.953 |
27.974 |
0.910 | –0.113 | –0.391 | 0.349 |
| Stent diameter (mm) | 2.846 |
2.852 |
0.547 | –0.602 | –0.026 | 0.014 |
| Number of stents (n) | 1.038 |
1.049 |
0.076 | –1.775 | –0.023 | 0.001 |
p
| FGR | p-value | |||||
| Low group (N = 3303) | High group (N = 2335) | |||||
| Sex [n (%)] | men | 2512 (76.1%) | 1681 (72%) | 11.834 | 0.001 | |
| women | 791 (23.9%) | 654 (28%) | ||||
| DM [n (%)] | 0 | 2487 (75.3%) | 1780 (76.2%) | 0.651 | 0.420 | |
| 1 | 816 (24.7%) | 555 (23.8%) | ||||
| Hypertension [n (%)] | 0 | 1946 (58.9%) | 1298 (55.6%) | 6.199 | 0.013 | |
| 1 | 1357 (41.1%) | 1037 (44.4%) | ||||
| Use of drugs | ||||||
| Calcium antagonist [n (%)] | 0 | 2910 (88.6%) | 2055 (88.6%) | 0.001 | 0.981 | |
| 1 | 376 (11.4%) | 265 (11.4%) | ||||
| 0 | 1949 (59.3%) | 1396 (60.1%) | 0.379 | 0.538 | ||
| 1 | 1339 (40.7%) | 927 (39.9%) | ||||
| Angiotensin II receptor blockers [n (%)] | 0 | 2518 (76.7%) | 1810 (78%) | 1.278 | 0.258 | |
| 1 | 765 (23.3%) | 511 (22%) | ||||
| Statins [n (%)] | 0 | 1463 (44.7%) | 1081 (46.7%) | 2.298 | 0.130 | |
| 1 | 1811 (55.3%) | 1232 (53.3%) | ||||
| Coronary artery and stent status | ||||||
| Pre-dilation [n (%)] | 0 | 436 (13.2%) | 329 (14.1%) | 0.936 | 0.333 | |
| 1 | 2867 (86.8%) | 2005 (85.9%) | ||||
| Post-dilation [n (%)] | 0 | 1201 (36.4%) | 921 (39.5%) | 5.596 | 0.018 | |
| 1 | 2102 (63.6%) | 1413 (60.5%) | ||||
| A novel coronary stent [n (%)] | 0 | 199 (6%) | 127 (5.4%) | 0.855 | 0.355 | |
| 1 | 2104 (94%) | 2207 (94.6%) | ||||
| CTO [n (%)] | 0 | 2559 (77.5%) | 1763 (75.5%) | 2.876 | 0.090 | |
| 1 | 744 (22.5%) | 571 (24.5%) | ||||
| Multivessel coronary disease [n (%)] | 0 | 1218 (36.9%) | 776 (33.2%) | 7.874 | 0.005 | |
| 1 | 2085 (63.1%) | 1558 (66.8%) | ||||
p
Following a mean follow-up time of 35.9
| FGR | p-value | ||||
| Low group (N = 3303) | High group (N = 2335) | ||||
| MACCEs | 0 | 2872 (87%) | 1967 (84.2%) | 8.268 | 0.004 |
| 1 | 431 (13%) | 368 (15.8%) | |||
| MACEs | 0 | 2916 (88.3%) | 1993 (85.4%) | 10.432 | 0.001 |
| 1 | 387 (11.7%) | 342 (14.6%) | |||
| ACM | 0 | 3160 (95.7%) | 2187 (93.7%) | 11.278 | 0.001 |
| 1 | 143 (4.3%) | 148 (6.3%) | |||
| CM | 0 | 3192 (96.6%) | 2212 (94.7%) | 12.506 | |
| 1 | 111 (3.4%) | 123 (5.3%) | |||
p
We demonstrated the correlation between the two groups of FGR and MACCE, MACE,
ACM and CM via the COX multifactorial regression model after correcting for age,
sex, history of smoking, history of alcohol consumption, previous diabetes and
hypertension, triglycerides, total cholesterol, high- and low-density
lipoproteins and low-density lipoproteins. High FGR, previous history of
hypertension and a history of diabetes were independently associated with the
occurrence of MACCE, with high FGR being 1.34 times more likely than low FGR to
experience MACCE (hazard ratio (HR) = 1.336 [1.157–1.542], p
| MACCEs | MACEs | |||||||||
| B | SE | p-value | HR (95% CI) | B | SE | p-value | HR (95% CI) | |||
| Age | –0.001 | 0.004 | 0.024 | 0.877 | 0.999 (0.993–1.006) | –0.003 | 0.004 | 0.799 | 0.371 | 0.997 (0.990–1.004) |
| Sex | –0.192 | 0.093 | 4.270 | 0.039 | 0.825 (0.688–0.990) | –0.169 | 0.098 | 2.952 | 0.086 | 0.845 (0.697–1.024) |
| Smoking | –0.189 | 0.092 | 4.257 | 0.039 | 0.828 (0.692–0.991) | –0.121 | 0.095 | 1.600 | 0.206 | 0.886 (0.735–1.068) |
| Drinking | –0.066 | 0.097 | 0.464 | 0.496 | 0.936 (0.775–1.132) | –0.079 | 0.100 | 0.627 | 0.428 | 0.924 (0.759–1.124) |
| DM | 0.188 | 0.083 | 5.160 | 0.023 | 1.206 (1.026–1.418) | 0.188 | 0.086 | 4.736 | 0.030 | 1.207 (1.019–1.430) |
| Hypertension | 0.311 | 0.074 | 17.503 | 1.365 (1.180–1.578) | 0.308 | 0.078 | 15.691 | 1.360 (1.168–1.584) | ||
| TG | 0.028 | 0.031 | 0.861 | 0.353 | 1.029 (0.969–1.092) | 0.012 | 0.033 | 0.136 | 0.712 | 1.012 (0.949–1.079) |
| TC | 0.014 | 0.060 | 0.058 | 0.809 | 1.015 (0.902–1.141) | 0.031 | 0.063 | 0.239 | 0.625 | 1.031 (0.912–1.167) |
| HDL-C | –0.086 | 0.085 | 1.032 | 0.310 | 0.917 (0.777–1.083) | –0.117 | 0.094 | 1.557 | 0.212 | 0.889 (0.740–1.069) |
| LDL-C | –0.102 | 0.070 | 2.127 | 0.145 | 0.903 (0.787–1.036) | –0.101 | 0.073 | 1.883 | 0.170 | 0.904 (0.783–1.044) |
| FGR high vs. low | 0.289 | 0.073 | 15.674 | 1.336 (1.157–1.542) | 0.317 | 0.076 | 17.217 | 1.373 (1.182–1.595) | ||
p
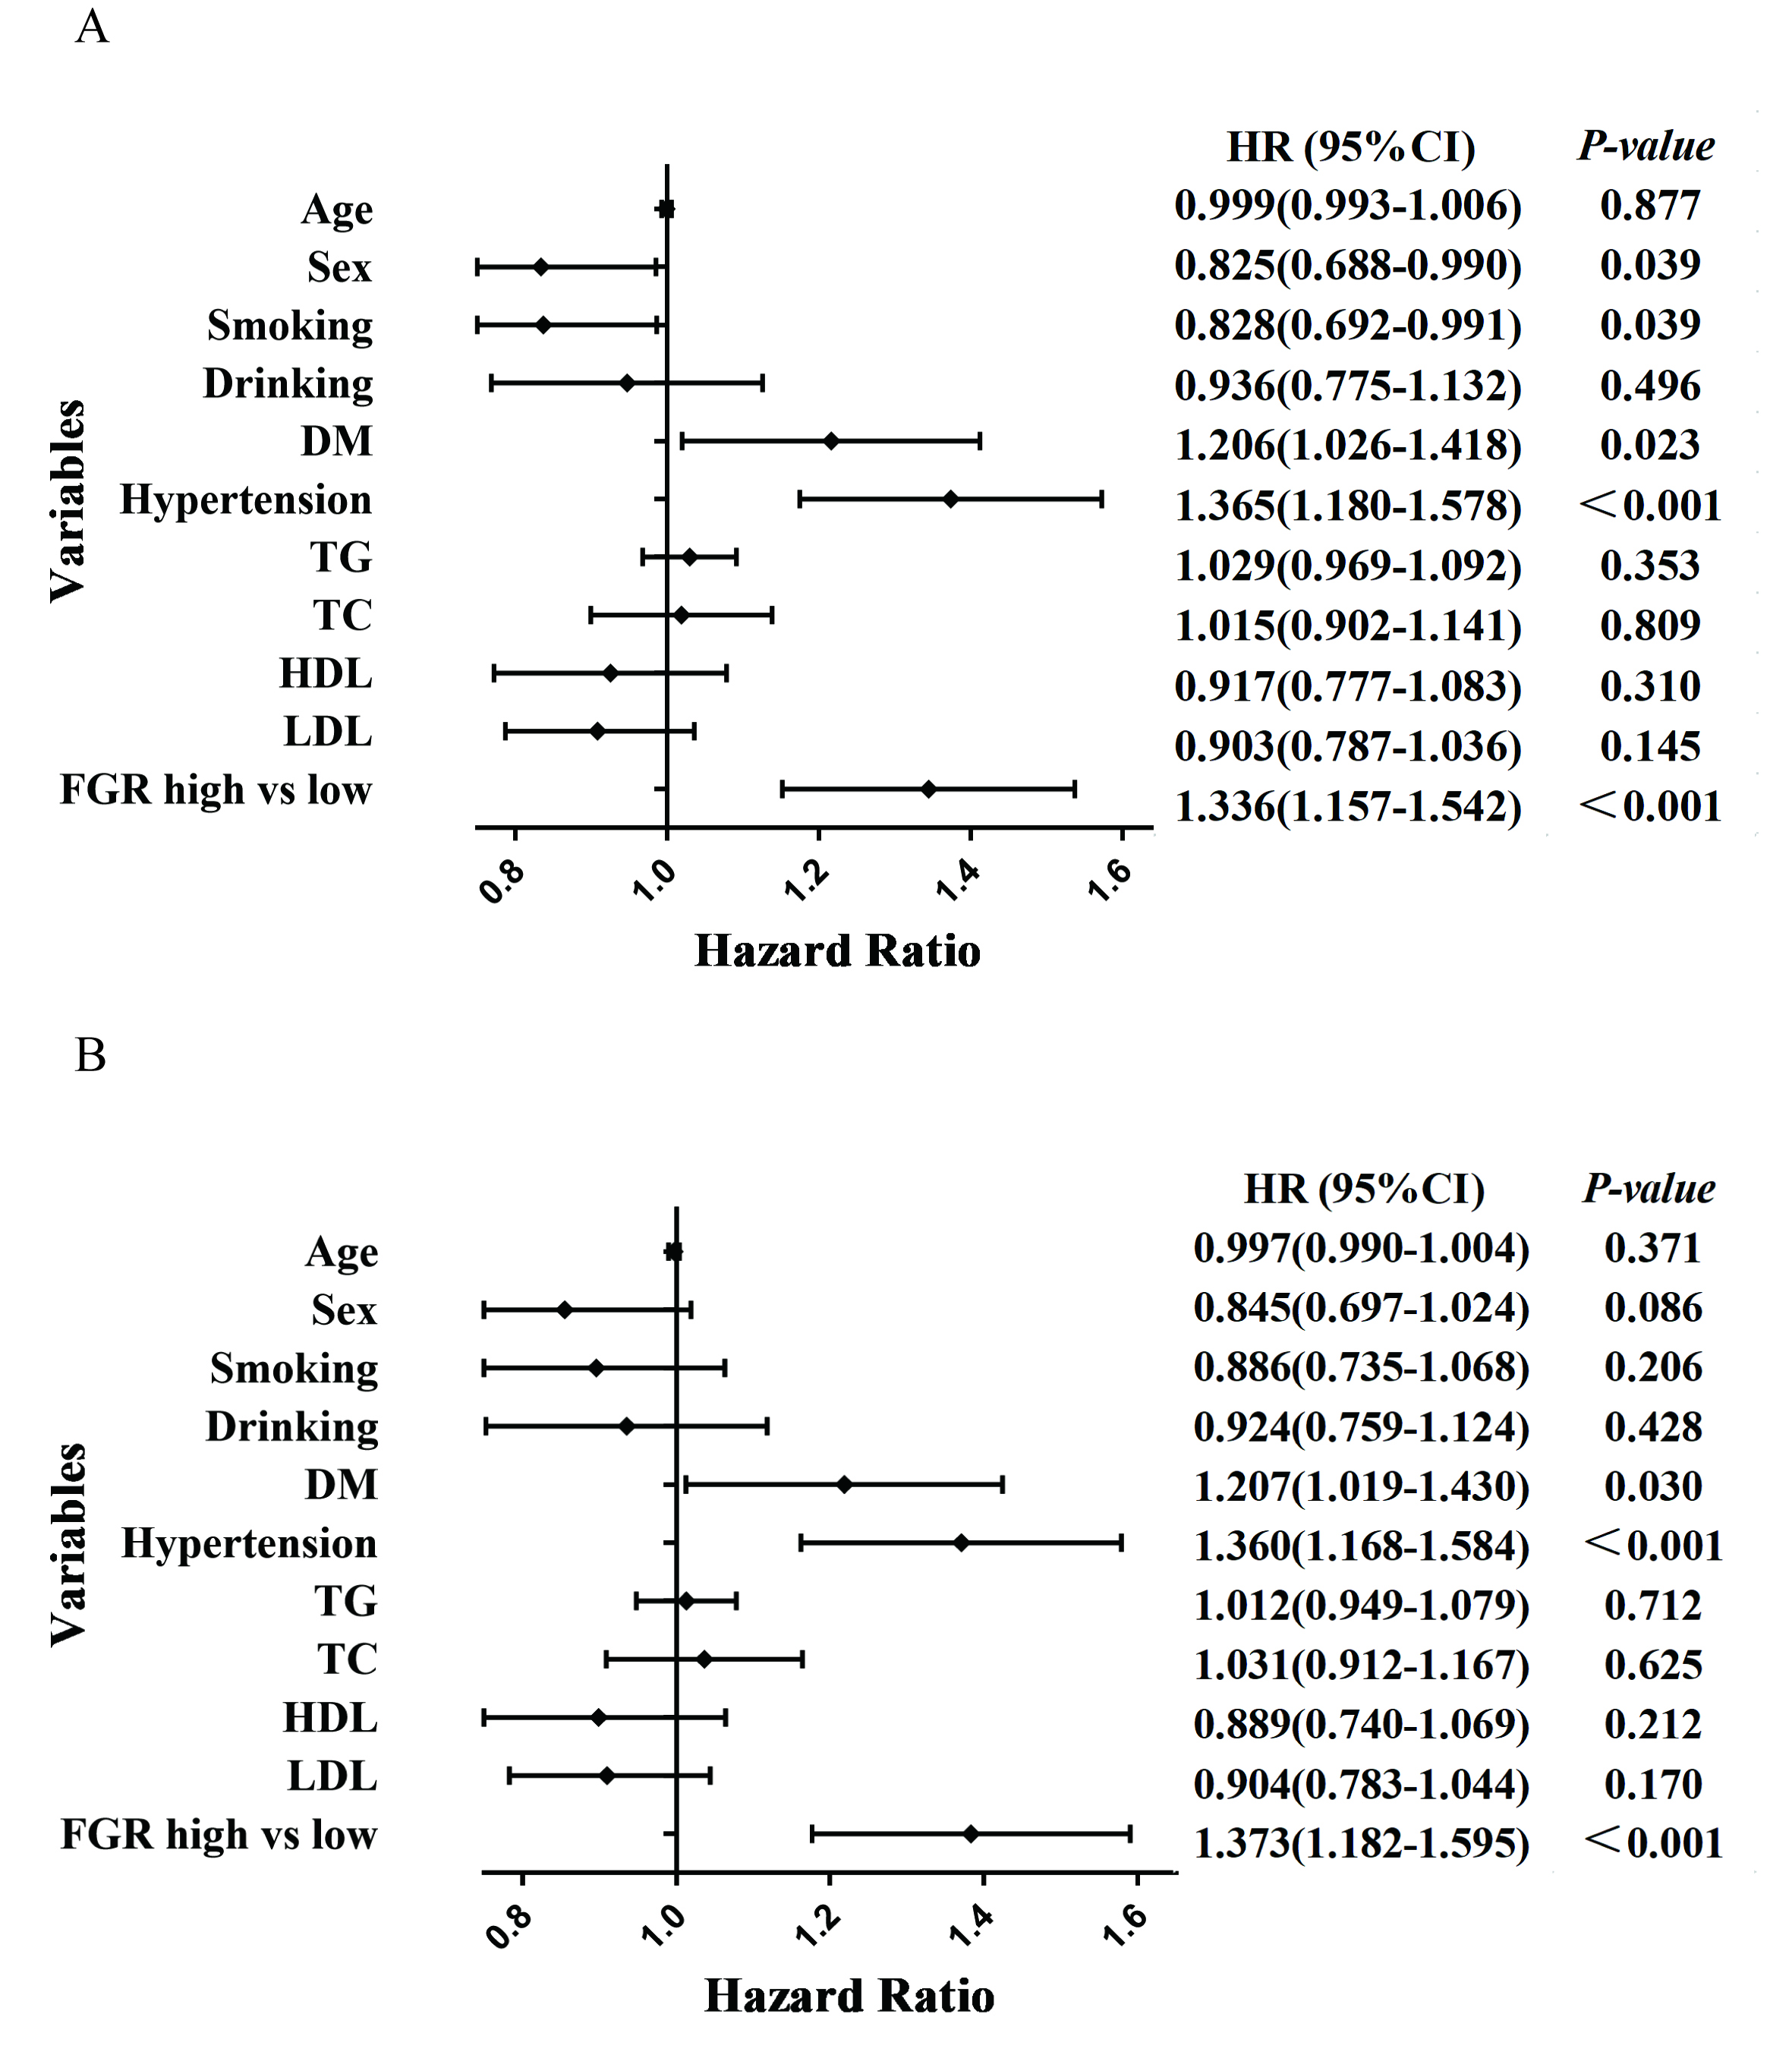 Fig. 2.
Forest plots of MACCE and MACE patients based on COX regression model results. (A) Forest plots of MACCE patients based on COX regression model results. (B) Forest plots of MACE patients based on COX regression model results. MACCE, major cardiac and cerebrovascular adverse events; MACE, major adverse cardiovascular events; DM, diabetes mellitus; TG, triglycerides; TC, total cholesterol; HDL, high-density lipoprotein; LDL, low-density lipoprotein; FGR, fibrinogen/γ-glutamine transferase; HR, hazard ratio.
| ACM | CM | |||||||||
| B | SE | p-value | HR (95% CI) | B | SE | p-value | HR (95% CI) | |||
| Age | 0.028 | 0.006 | 22.156 | 1.028 (1.016–1.040) | 0.020 | 0.007 | 9.526 | 0.002 | 1.021 (1.007–1.034) | |
| Sex | –0.074 | 0.149 | 0.250 | 0.617 | 0.928 (0.694–1.243) | –0.094 | 0.167 | 0.315 | 0.575 | 0.911 (0.657–1.263) |
| Smoking | 0.006 | 0.153 | 0.002 | 0.967 | 1.006 (0.745–1.359) | –0.102 | 0.172 | 0.349 | 0.554 | 0.903 (0.645–1.266) |
| Drinking | –0.065 | 0.162 | 0.160 | 0.689 | 0.937 (0.681–1.288) | 0.002 | 0.181 | 0.000 | 0.993 | 1.002 (0.703–1.427) |
| DM | 0.066 | 0.141 | 0.219 | 0.640 | 1.068 (0.811–1.407) | 0.158 | 0.155 | 1.039 | 0.308 | 1.171 (1.865–1.585) |
| Hypertension | 0.166 | 0.123 | 1.819 | 0.177 | 1.181 (0.927–1.504) | 0.111 | 0.138 | 0.647 | 0.421 | 1.118 (1.852–1.466) |
| TG | 0.052 | 0.047 | 1.226 | 0.268 | 1.053 (0.961–1.154) | 0.007 | 0.056 | 0.014 | 0.905 | 1.007 (0.902–1.123) |
| TC | 0.067 | 0.095 | 0.486 | 0.486 | 1.069 (0.886–1.289) | 0.150 | 0.104 | 2.097 | 0.148 | 1.162 (1.948–1.424) |
| HDL-C | 0.018 | 0.114 | 0.024 | 0.876 | 1.018 (0.814–1.273) | –0.013 | 0.138 | 0.009 | 0.924 | 0.987 (0.752–1.294) |
| LDL-C | –0.151 | 0.112 | 1.822 | 0.177 | 0.859 (0.690–1.071) | –0.211 | 0.123 | 2.975 | 0.085 | 0.809 (0.637–1.029) |
| FGR high vs. low | 0.448 | 0.121 | 13.846 | 1.566 (1.236–1.983) | 0.513 | 0.135 | 14.482 | 1.670 (1.282–2.174) | ||
p
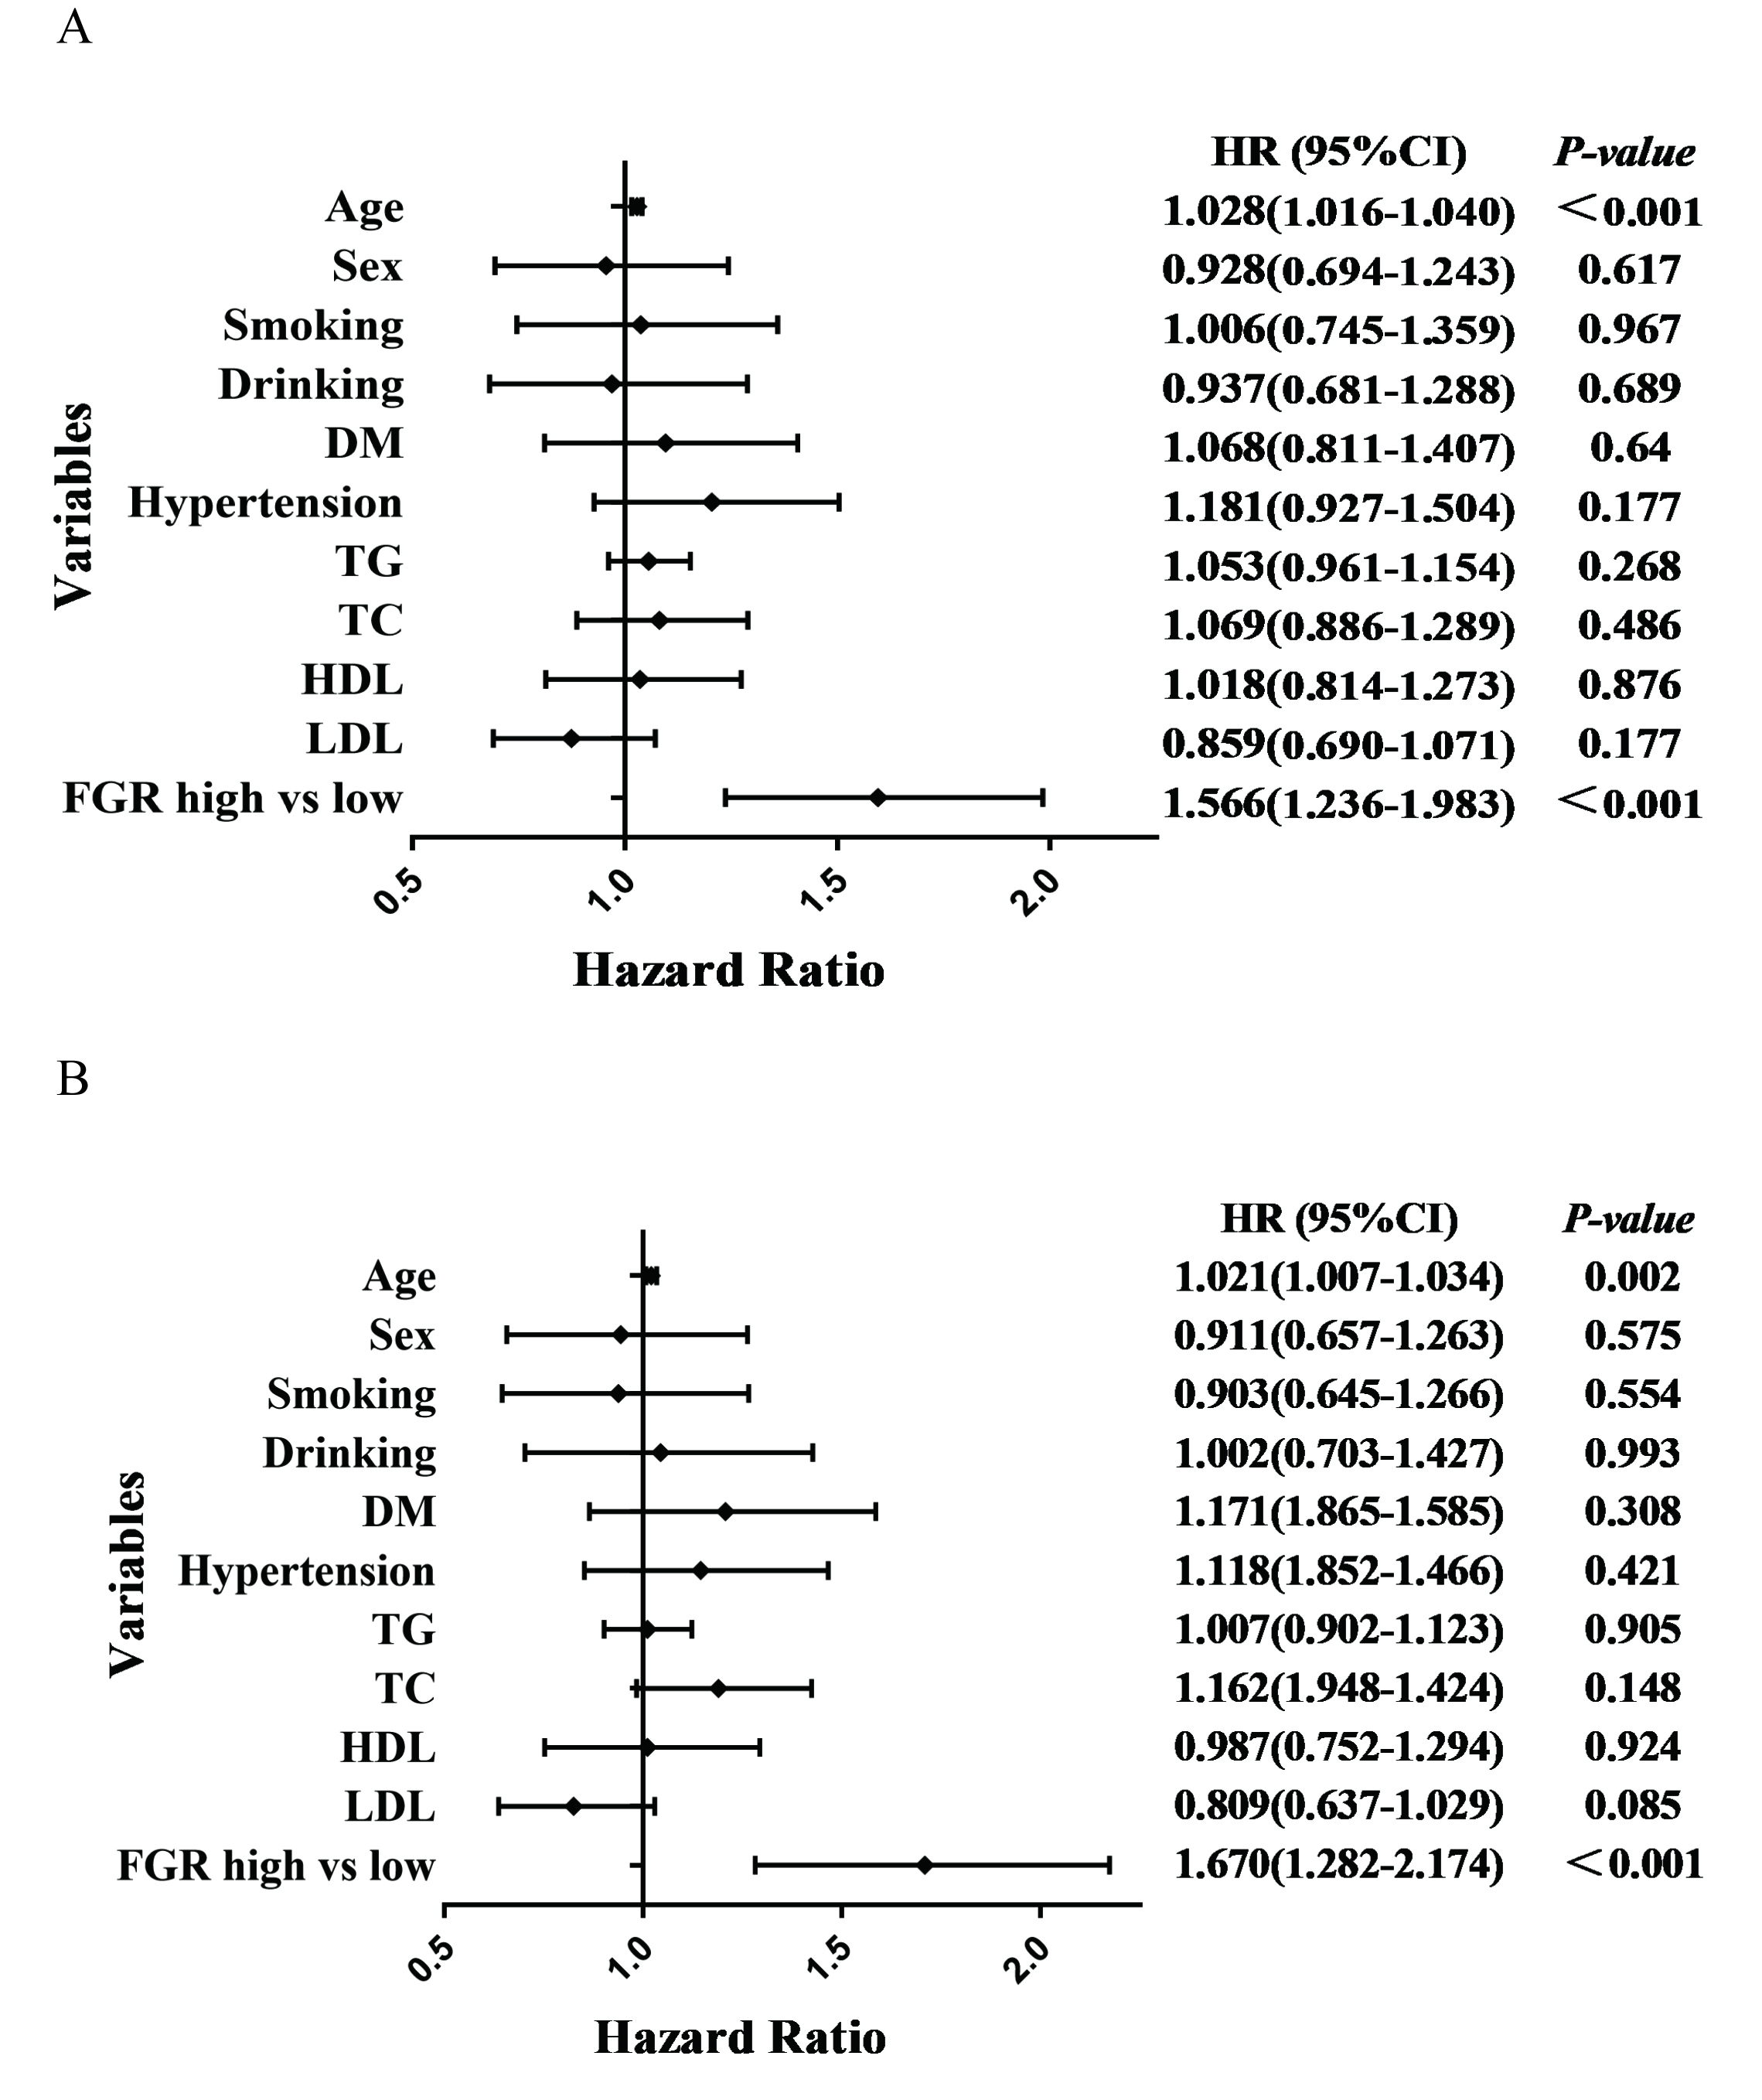 Fig. 3.
Forest plots of ACM and CM patients based on COX regression model results. (A) Forest plots of ACM patients based on COX regression model results. (B) Forest plots of CM patients based on COX regression model results. ACM, all-cause mortality; CM, cardiogenic mortality; DM, diabetes mellitus; TG, triglycerides; TC, total cholesterol; HDL, high-density lipoprotein; LDL, low-density lipoprotein; FGR, fibrinogen/γ-glutamine transferase; HR, hazard ratio.
In the Kaplan–Meier curves shown in Fig. 4, the risk of events was significantly increased in the high FGR group. As the FGR ratio increased, the risk of adverse cardiac and cerebrovascular events increased, and the risk of all-cause and cardiac death was higher.
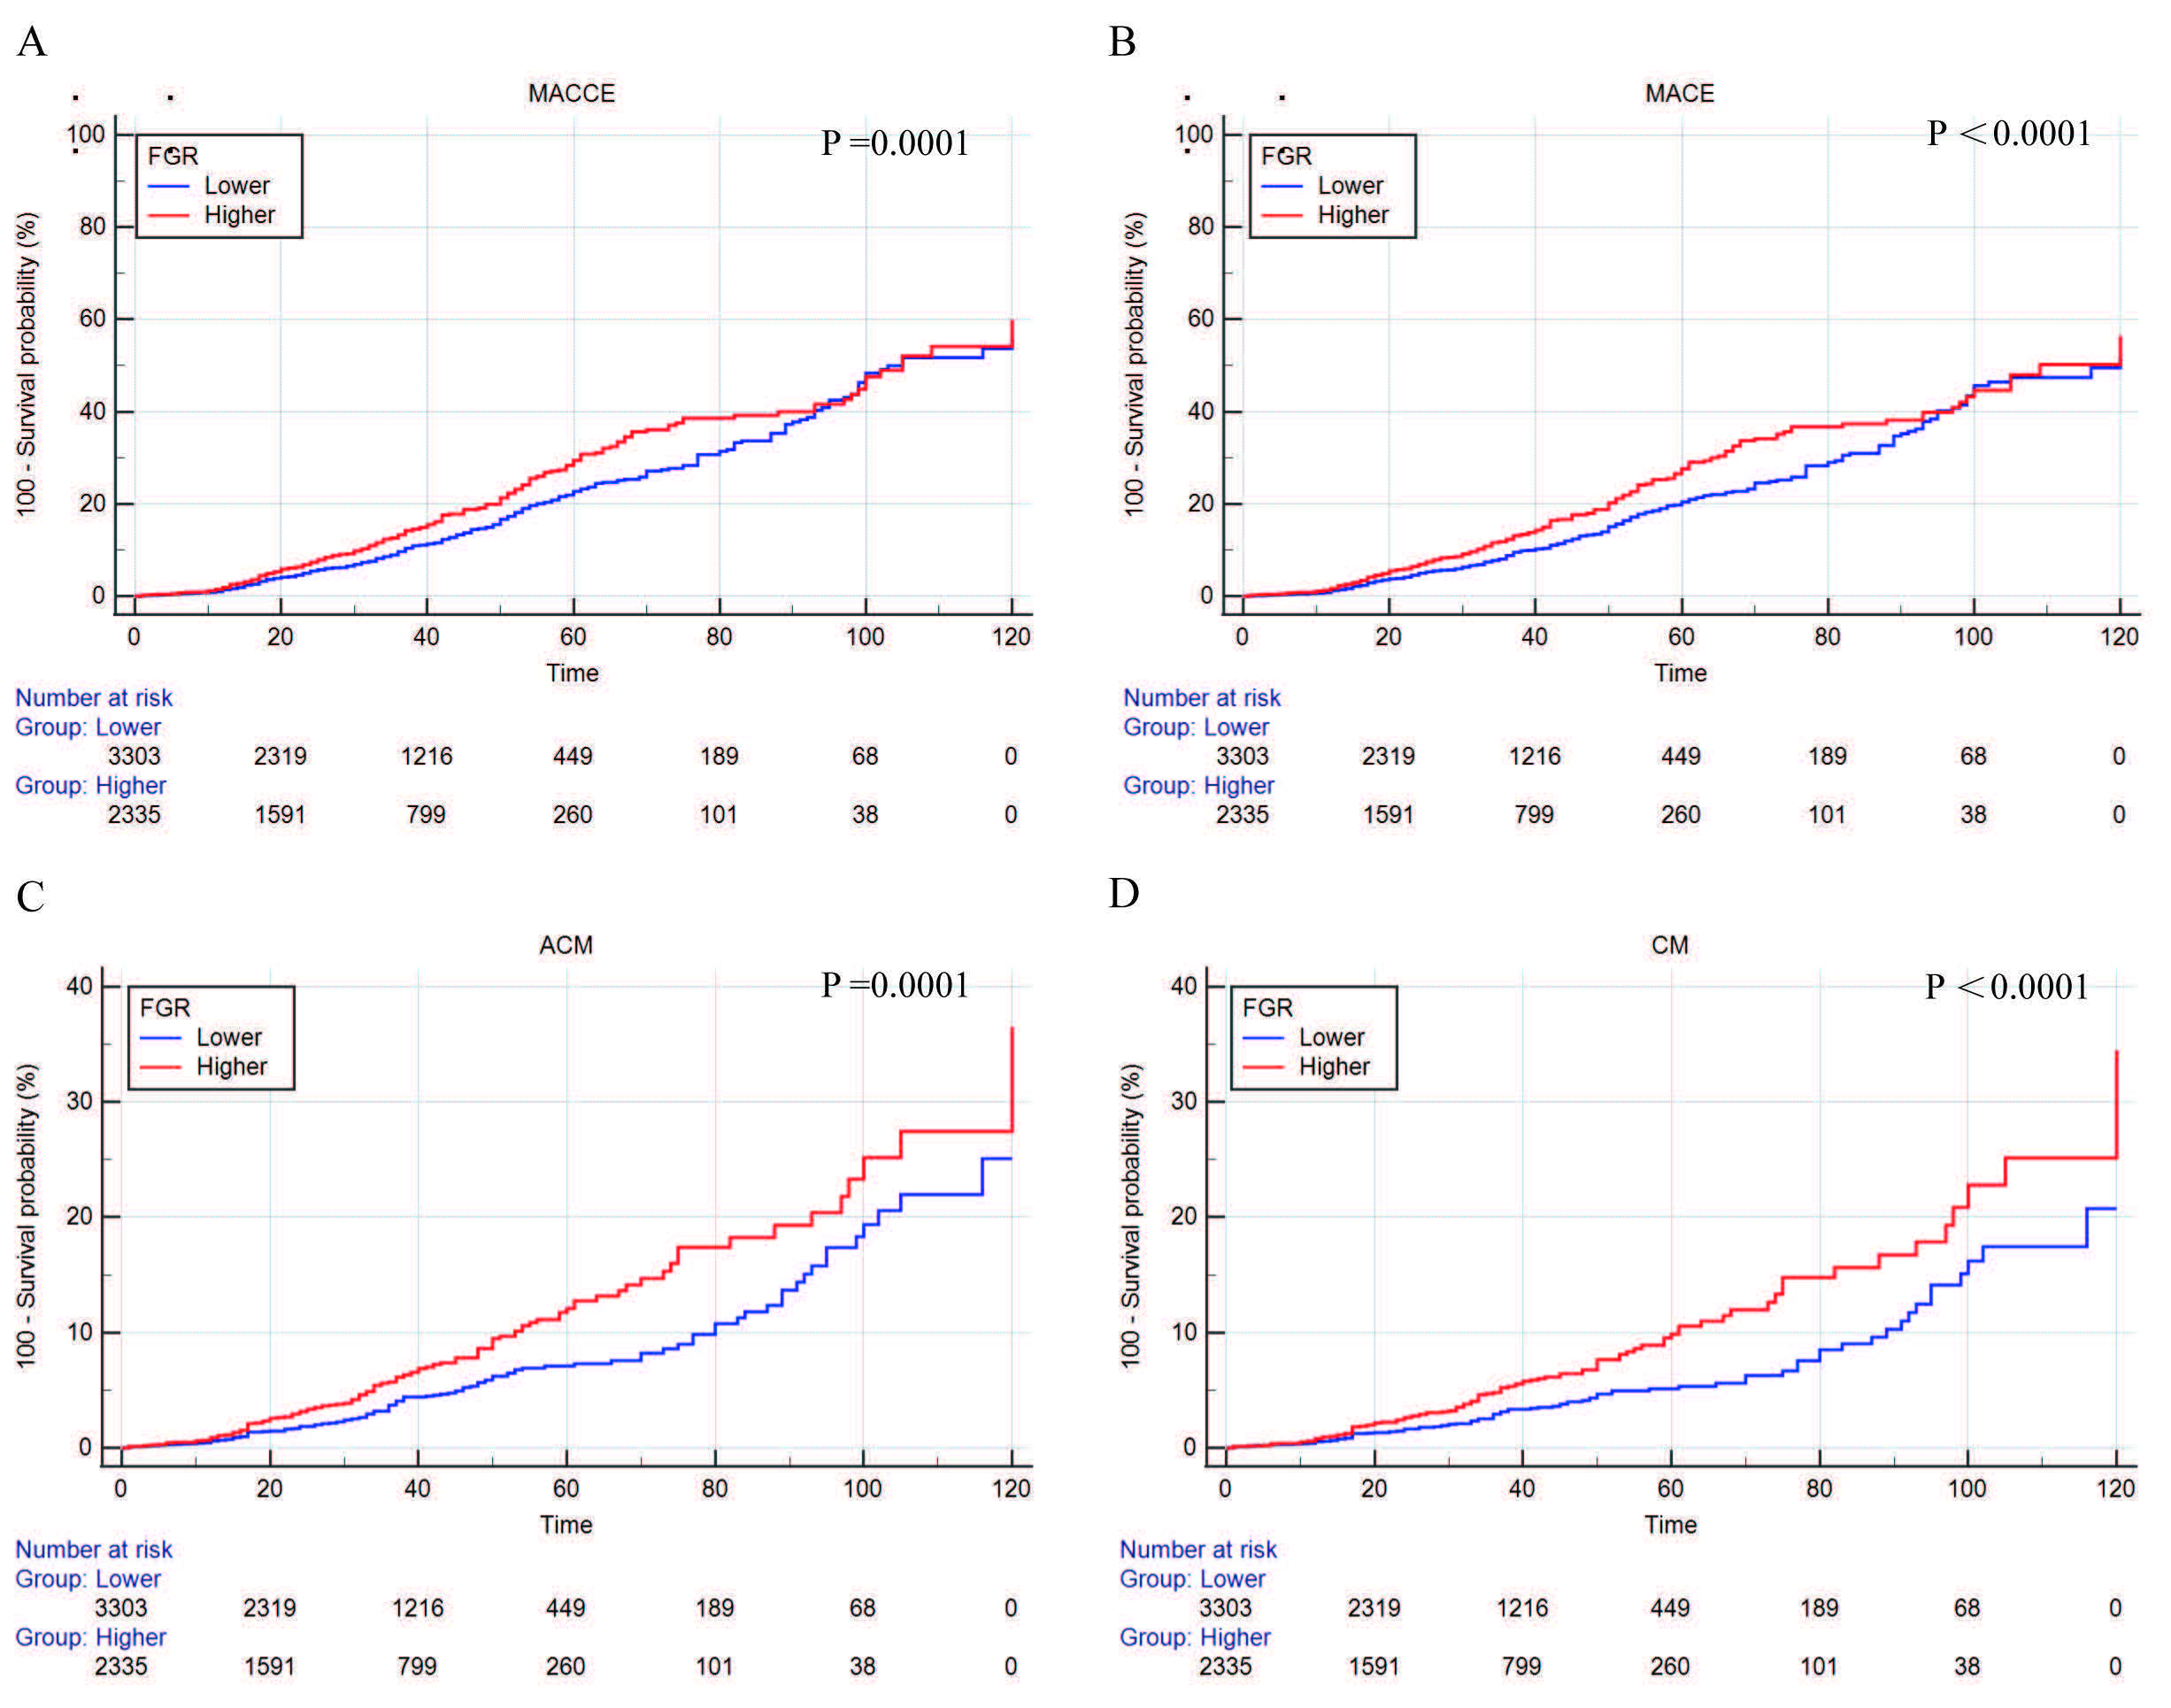 Fig. 4.
Kaplan–Meier curves were plotted according to the follow-up endpoints. (A) MACCEs. (B) MACEs. (C) ACM. (D) CM. MACCEs, major cardiac and cerebrovascular adverse events; MACEs, major adverse cardiovascular events; ACM, all-cause mortality; CM, cardiogenic mortality; FGR, fibrinogen/γ-glutamine transferase.
Traditional risk factors (age, sex, smoking, drinking, history of diabetes,
history of hypertension, total cholesterol, triglycerides, HDL-C LDL-C)
(Supplementary Table 1A) and fibrinogen (Supplementary Table
1C), GGT (Supplementary Table 1D), NT-proBNP (Supplementary
Table 1E), and FGR indicators (Supplementary Table 1B) were included in
the logistic regression model to observe the correlation between the above
indicators and ACM events. The predictive performance of the occurrence of ACM
events between FGR and traditional risk factors, fibrinogen, GGT, and NT-proBNP
was compared by ROC curves. It was found that FGR was statistically different
from the traditional risk factor model (p = 0.002), Fibrinogen
(p = 0.008), GGT (p = 0.004), and NT-ProBNP (p =
0.024) in terms of risk of developing ACM; the comparison between other different
models was not statistically significant (p
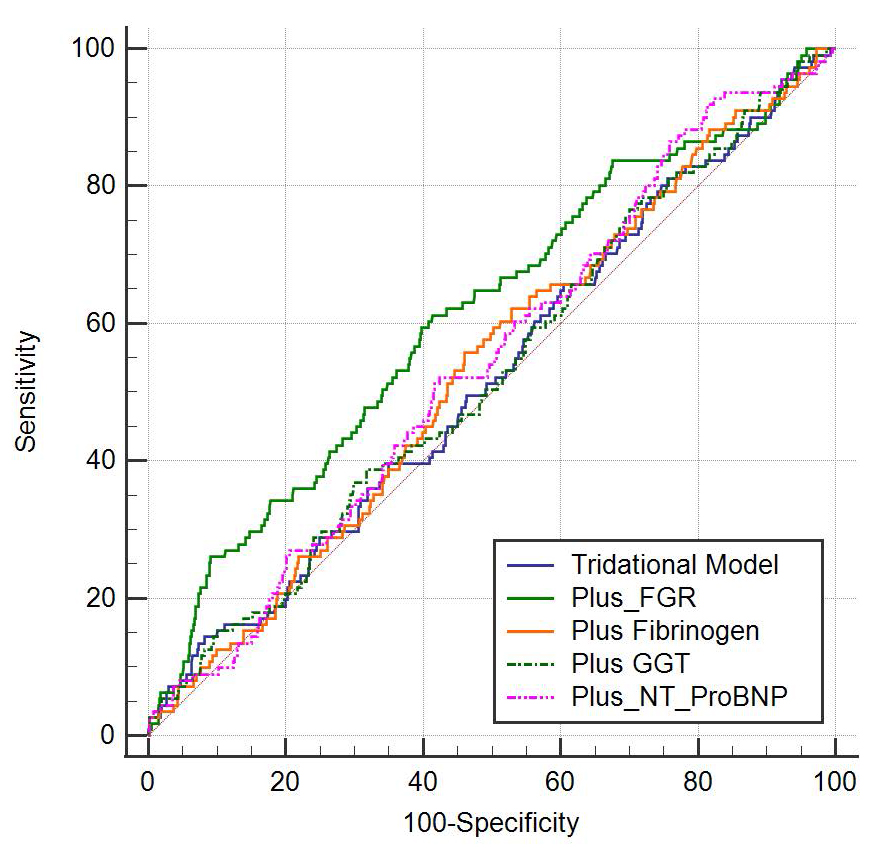 Fig. 5.
Comparison of the risk of ACM in FGR and traditional
risk factor models, Fibrinogen, GGT, and NT-proBNP. The risk of ACM was
statistically different between FGR and traditional risk factor models
(p = 0.002), fibrinogen (p = 0.008), GGT (p = 0.004),
and NT-proBNP (p = 0.024), the comparison between other different models
was not statistically significant (p
In this study, we found that high FGR was related to risk of long-term MACCE, long-term death and cardiogenic death in patients with CHD, with the use of a large sample database at 10 years of long-term follow-up. Thus, FGR can be used as a new predictor of long-term prognosis in patients with coronary heart disease. The prediction of the long-term prognosis of patients with coronary heart disease by simple indicators will benefit patients with CHD.
In a previous Framingham study of 1315 individuals with no prior cardiovascular disease who were followed for 12 years; 165 males and 147 females developed cardiovascular disease, and both the risk of cardiovascular disease and the risk of CHD were positively correlated with fibrinogen levels [7]. In Europe, according to a previous study of 3043 patients with angina pectoris coronary angiography examinations, after 2 years of follow-up and during the follow-up, 837 patients underwent coronary artery bypass grafting (CABG), 223 patients underwent coronary artery angioplasty, 49 individuals simultaneously received 2 types of treatment and there was a total of 106 cases of MACE. Furthermore, it was observed that there were more patients with myocardial infarction or sudden death with an increased fibrinogen concentration; this result was also more significant in patients with high cholesterol [8]. Ma J and other researchers investigated fibrinogen and future prospective risks of acute myocardial infarction [9]. They included 14,916 male patients aged 40–84 years-old; after 5 years of follow-up, 199 cases of acute myocardial infarction occurred, and they observed that a high baseline fibrinogen level was associated with a greater risk of acute myocardial infarction. Additionally, the high fibrinogen group had a two-fold added risk of acute myocardial infarction compared with the control group [9].
Other clinical studies have also found that fibrinogen levels are associated
with coronary artery severity and stenosis in patients with CHD [10, 11, 12].
Fibrinogen can be used as an independent risk factor for coronary artery severity
and poor prognosis in patients with CHD and can also be used as a novel
biomarker. The increase or decrease in fibrinogen is a reflection of coagulation
function and may lead to thrombosis and bleeding events. The mechanism of poor
prognoses in patients with coronary heart disease caused by fibrinogen may be due
to the following reasons: (1) It may promote the formation of thrombosis.
Fibrinogen is decomposed into fibrin under the action of thrombin to participate
in the coagulation process; additionally, it activates platelets to trigger the
coagulation positive feedback process [13]. Fibrinogen can bind to the
plasminogen receptor, thus rendering plasminogen-induced thrombolysis ineffective
and leading to a decrease in clot solubility [14, 15]. Moreover, fibrinogen
induces platelet aggregation and increases blood viscosity [16]. Thus, the
combination of the above factors leads to thrombosis. (2) Fibrinogen promotes
inflammatory factors. Fibrinogen promotes inflammatory responses by inducing
pro-inflammatory factors (Tumor Necrosis Factor-
The fibrinogen level can reflect the hypercoagulable state of blood and participate in the formation of thrombi. Furthermore, the fibrinogen level is also the main factor determining blood viscosity and red blood cell aberration and reflects the degree of atherosclerotic vascular injury [23, 24]. Fibrinogen may be involved in atherosclerotic diseases by affecting platelet aggregation [25] or by increasing blood viscosity, thus promoting thrombosis and leading to acute vascular thrombotic events, which promotes the development of atherosclerotic lesions [26, 27].
GGT was initially observed to be an indicator of hepatobiliary dysfunction and
alcohol abuse. With subsequent epidemiological and pathological studies, GGT was
also found to play a specific role in the pathogenesis and clinical prognosis of
cardiovascular diseases caused by atherosclerosis. An Austrian epidemiological
study of 163,944 Austrian adults who were followed for 17 years found that high
GGT was significantly associated with an increase in overall mortality from
cardiovascular disease [28]. Moreover, a systematic review of GGT and all-cause
and cardiogenic death from CHD by Yang P et al. [29] showed that
elevated serum GGT levels were an independent predictor of cardiogenic and
all-cause mortality in CHD patients. Additionally, Long Y et al. [30]
conducted a study of GGT and examined all-cause death and cardiovascular disease
death. The study included 35 studies, and 571,511 patients were analyzed. The
results showed that a total of 72,196 patients died and that GGT was associated
with increased all-cause mortality and cardiovascular mortality. Moreover, there
was a relationship between patients with coronary heart disease and type 2
diabetes, and all-cause mortality and cardiovascular mortality were associated
with GGT. Furthermore, a study by Ndrepepa G et al. [31] on GGT
activity and prognoses in patients with coronary heart disease showed that
increased GGT activity was associated with an increased risk of 3-year all-cause,
cardiac and non-cardiac death in 5501 patients with coronary heart disease after
3 years of follow-up. A study by Zheng YY et al. [32] on GGT and heart
failure in patients with coronary heart disease after percutaneous coronary
intervention (PCI) showed that serum GGT concentration was independently
associated with heart failure after PCI; additionally, baseline GGT levels lower
than 19.6 or
GGT may be associated with poor prognoses in CHD patients by the following mechanisms: (1) GGT was found in carotid atherosclerotic plaques after carotid endarterectomy [33], and a histochemical analysis showed that GGT was active and expressed in CD68+ macrophage-derived foam cells in human atherosclerotic plaques [34]. Additionally, it was found to co-localize with immunoactivity oxidize low-density lipoprotein (LDL) [35], and catalytically active GGT has been shown to adhere to microthrombi on atherosclerotic surfaces [36]. Moreover, GGT activity associated with lipoprotein (LDL, intermediate density lipoprotein (IDL) and very low-density lipoprotein (VLDL)) increases with total serum GGT activity, and increased serum GGT levels may be associated with the increased entry of GGT-carrying lipoproteins into plaques [37, 38]. (2) Oxidative stress is linked with GGT. During GGT activity, mercaptan metabolites produced on the cell surface can induce and promote oxidation reactions, thus leading to the generation of free radical oxidant species [39]. The production of cysteine-glycine in GSH catabolism mediated by GGT may promote the reduction of trivalent Fe to divalent Fe to form Fe pools and predispose to LDL oxidation [36]. (3) Inflammation is linked to GGT. GGT may produce leukotriene inflammatory factors through the 5-lipoxygenase pathway of arachidonic acid metabolism [40], or can be strongly correlated with serum C-reactive protein (CRP) concentrations [41].
Studies have shown that GGT may play a role in the cellular processes of LDL oxidation and atherosclerosis formation. Whitfield JB et al. [42] found that GGT may promote the formation and rupture of atherosclerotic plaques by catalyzing the oxidation of LDL. GGT plays an important role in atherosclerotic plaque formation and fibrous cap formation, the apoptosis of pathological cell components, plaque erosion and rupture, enhancement of platelet aggregation and thrombosis [43].
In this study, we combined two indicators, fibrinogen and GGT, and predicted the
poor prognosis of CHD by their ratio. This study is a single-center,
large-sample, retrospective cohort study. We retrospectively analyzed and
followed up 5638 patients with CHD for a mean follow-up period of 35.9
High FGR can increase the risk of MACCE, as well as long-term ACM and CM, in patients with CHD; additionally, it can be used as a new biomarker for long-term prognosis in patients with CHD.
The limitation of this study is that the design type is a single-center retrospective cohort study. In the future, we will carry out a multi-center prospective study jointly with hospitals at other prefecture-level or other provinces and cities. Related cardiac markers, such as troponin, myoglobin, and cardiac enzymes, were not included in the study. Finally, we have only collected the results of hematological examinations during the hospitalization of the included subjects. If possible, we will contact the patients to redraw serum indicators to compare the changes of serological indicators before and after, so as to better identify the related risk factors.
The datasets used and/or analyzed during the current study available from the corresponding author on reasonable request.
YTM and XX supervised the project and designed the study. JY was responsible for analyzing and interpreting the data and wrote the manuscript. CJD, XM, YN, MYW, SFW, MA and YYZ were responsible for data collecting, follow-up, collating and statistical data. All authors contributed to editorial changes in the manuscript. All authors read and approved the final manuscript. All authors have participated sufficiently in the work to take public responsibility for appropriate portions of the content and agreed to be accountable for all aspects of the work in ensuring that questions related to its accuracy or integrity.
This study was conducted in accordance with the Standards of the Declaration of Helsinki, since this study was based on a retrospective cohort study and all indicators were obtained from the medical record system, the informed consent exemption was applied for, also approved by the Ethics Committee of the First Affiliated Hospital of Xinjiang Medical University (Ethics Review Number K202206-18).
The abstract of this paper was presented at the 33rd Great Wall International Congress of Cardiology Asian Heart Society Congress 2022 as a poster presentation with interim findings.
This research was funded by the central guide on local science and technology development Fund of XINJIANG Province (ZYYD2022A01), the National Natural Science Foundation of China (91957208, 81960046), and Prevention and control of major chronic Noncommunicable disease Project (2018YFC1311505).
The authors declare no conflict of interest. Ying-Ying Zheng and Xiang Xie are serving as Guest Editor of this journal. We declare that Ying-Ying Zheng and Xiang Xie had no involvement in the peer review of this article and have no access to information regarding its peer review. Full responsibility for the editorial process for this article was delegated to Davide Bolignano.
Publisher’s Note: IMR Press stays neutral with regard to jurisdictional claims in published maps and institutional affiliations.