
- Academic Editor
Background: The main objective of this study was to determine whether
myocardial strain and myocardial work are altered in hypertension and whether
the strain is independent of hypertension-induced left ventricular hypertrophy.
Methods: Two systematic literature searches were conducted using Medline
and EMBASE through to June 30, 2022. In the first, search terms left
ventricular strain or speckle tracking AND hypertension and left
ventricular hypertrophy were used in conjunction with Boolean operators to
identify articles reporting left ventricular strain in patients with
hypertension. In the second, the terms Global cardiac or myocardial work AND
hypertension were used to identify articles. Publication bias was assessed by
examination of funnel plots and calculation of the Failsafe N and Duval and
Tweedie’s Trim and fill. The results were presented as Forrest plots.
Results: Global longitudinal strain (GLS) was significantly lower in
patients with hypertension compared to those without hypertension with a mean
difference of 2.0
The impact of hypertension on the heart includes thickening of the left ventricular wall that later leads to insufficient myocardial perfusion—myocardial ischemia, and to heart failure with both reductions in systolic and diastolic function [1, 2, 3, 4, 5]. Early recognition of the consequences of hypertension on the heart may be an indication for more vigorous antihypertensive drug treatment to avert or minimize the development of the full blown consequences of hypertension on the heart.
One approach that has attracted recent attention, to identify the early cardiac effects of hypertension is the assessment of myocardial strain, which has proved to be useful in recognizing the early adverse effects of cancer chemotherapeutic agents on the heart. Myocardial strain is a dimensionless index of length change between two given points, which reflects the degree of myocardial deformation [6]. It has been recognized for a long time that the contractile function of the heart is dependent on contraction of myocardial fibers that have different orientations at various levels of the heart [7, 8, 9]. The longitudinal arrangement of fibers on the oblique parts of the heart contrasts with the circumferential arrangement of those on other parts of the heart [8]. Contraction of myocardial fibers that have different orientations produces deformation in different directions so that strain can be assessed in the various directions in which the myocardium deforms. Cardiomyocyte deformation, stretching, shortening and thickening in the different myocardial layers translates into left ventricular stretching, shortening and thickening, that can be measured as percentage longitudinal, circumferential and radial strain [10]. Subendocardial and subepicardial layers are purported to be mainly responsible for longitudinal strain; mid-myocardial layers mainly account for circumferential strain and thickening of all fibers in all three layers is responsible for radial strain [10]. Longitudinal strain evaluates the apex-base deformation, circumferential strain evaluates circumferential deformation while radial strain represents radial thickening of the myocardium [10, 11]. However, the distribution and angulation of myofibers in all layers can contribute to each of these three kinds of strain [10].
Until recently it was not possible to readily assess changes in myocardial contractility in the different orientations in the heart. The introduction of speckle tracking echocardiography permitted a quantitative assessment of myocardial motion in discrete areas of the myocardium that correspond to different layers of the heart [12]. Speckle tracking echocardiography provides accurate and angle-independent measurements of left ventricle (LV) dimensions [13]. There is evidence that assessment of myocardial strain may be superior to the left ventricular ejection fraction as a predictor of major adverse cardiac events such as cardiac death and hospitalization due to heart failure [14, 15].
A relatively new method to evaluate myocardial systolic performance is the concept of assessing myocardial work performed during systole because it takes into account not only left ventricular deformation (strain) but also adjusts for after load which can influence LV strain [16]. The left ventricular pressure-strain relationship can be assessed noninvasively incorporating systemic arterial blood pressure coincident with measurement of left ventricular strain from which several different kinds of myocardial work can be calculated [16, 17]. Global myocardial work indices obtained from LV pressure–strain loop (LV PSL) strongly correlate with invasive measurements [18]. Global myocardial work index (GWI) represents the total work within the area of the LV PSL. Constructive myocardial work (GCW) represents work performed by LV ejection during systole. Global wasted work (GWW) is work performed by the LV that does not contribute to LV ejection. Global work efficiency (GWE) is the ratio of global constructive myocardial work (GCW) to global wasted work (GWW) and represents the efficiency of LV mechanical energy that is expended in systole.
Whether myocardial strain is altered in hypertension and whether it is independent of hypertension-induced left ventricular hypertrophy is an ongoing question. Some investigators concluded that there were no differences in some elements of left ventricular strain in hypertension while other investigators concluded the reverse [19, 20, 21, 22]. The assessment of left ventricular strain in different directions may compound the variability of the results. Whether myocardial work is altered in hypertension is also unresolved. The objectives of this review were several folds to focus on hypertension and determine (i) which type of myocardial strain, longitudinal, circumferential or radial, if any were abnormal in hypertension (ii) whether any abnormality in strain was related to or independent of left ventricular ejection fraction or left ventricular hypertrophy and (iii) whether hypertension alters myocardial work indices.
A systematic search was conducted of Medline and EMBASE. The search was conducted from the inception of each database through to June 30, 2022. Search terms left ventricular strain or speckle tracking AND hypertension and left ventricular hypertrophy were used in conjunction with Boolean operators to identify articles reporting left ventricular strain in patients with hypertension. A second search was conducted with the terms myocardial OR cardiac work AND hypertension. Because there was no primary patient or animal contact, there was no requirement for approval from our research ethics committee. The meta-analysis was not registered. The search was conducted according to the Preferred Reporting Items for Systematic Reviews and Meta-Analyses (PRISMA) [23] (Supplementary Fig. 1).
Titles and abstracts were screened to identify articles for full-text review. The inclusion criteria included echocardiographic measurement of left ventricular strain or myocardial work. The exclusion criteria were articles: (i) not published in English; (ii) involved non-human subjects; (iii) non-primary research articles (reviews, editorials or letters commenting on an article); (iv) pediatric age population (v) secondary hypertension (vi) unrelated to the investigated topic, e.g., only focused on ECG and ECG pattern of left ventricular hypertrophy (LVH) and strain; and (vii) did not provide a direct comparison of control and individuals with hypertension, i.e., focused only on an aspect of LV strain or work or (viii) relevant data could not be extracted from the paper.
The following items were extracted from each paper, authors, year of publication, age, sex, left ventricular mass, left ventricular ejection fraction, ventricular longitudinal strain, circumferential strain and radial strain as well as indices of myocardial work.
Results were quantified using forest plots depicting the standard difference of
means, 95% confidence interval, and p-value. The meta-analysis was
performed using Comprehensive Meta-Analysis (Biostat Inc., NJ, USA).
Study heterogeneity in the meta-analysis was tested using Cochran’s Q, I
The initial search for left ventricular strain produced 56 references after the elimination of duplicates. After filtering the titles and abstracts, 9 were eliminated because they were review articles, editorials or letters. The full text review eliminated 32 reports, and 4 articles were added by ‘hand searching’ and examination of bibliographies of existing papers, eventually, 19 articles could be included in the systematic review. 18 studies had a control group and one study compared patients with hypertension with and without left ventricular hypertrophy [19, 20, 21, 22, 24, 25, 26, 27, 28, 29, 30, 31, 32, 33, 34, 35, 36, 37, 38] (Supplementary Fig. 1). The initial search for myocardial work and hypertension produced 107 references after the elimination of duplicates. After filtering the titles and abstracts, 19 were eliminated because they were review articles, editorials or letters and 6 were eliminated because they were animal studies. Seventy-three were eliminated because they were not relevant, most of them because they were published before the current form of assessment and classification of non-invasive assessment of myocardial work. Nine studies were subjected to meta-analysis [39, 40, 41, 42, 43, 44, 45, 46, 47]. A similar summary for data evaluation considering global work indices was conducted (Supplementary Fig. 2).
For studies of left ventricular strain, the patient characteristics of the studies demonstrate a range of mean ages, from 29 to 70 years (Table 1, Ref. [19, 20, 21, 22, 24, 25, 26, 27, 28, 29, 30, 31, 32, 33, 34, 35, 36, 37, 38]). The majority of studies had a mean age in the 50 years age group. The sex distribution also varied between studies from 15% to 100% with most studies having a majority of men. Studies were separated into those that had a control group and those that compared patients who did or did not have left ventricular hypertrophy. The degree of left ventricular hypertrophy was included. For studies of myocardial work, the patient characteristics of the studies demonstrate a range of mean ages, from 38 to 72 years (Table 2, Ref. [39, 40, 41, 42, 43, 44, 45, 46, 47]). Assessment of the quality of studies is challenging for non-randomized case control studies especially the type of studies that comprise the data base for this meta-analysis [48]. The most frequently used assessment methodology—the Newcastle-Ottawa scale was applied and ranked all of the studies low. That scale gives a lower rank to studies with (i) hospital based groups compared to population-based studies; (ii) no intervention in the case groups that could be graded and (iii) lack of details to evaluate accurate matching procedures for all variables in the controls [48]. While the grading system ranked the studies low, it is a characteristic of the nature of all of the ranking systems but importantly the ratings were consistent between studies which justifies the inclusion of all studies in this analysis. Other assessment methods such as QUADAS rely on a grading of the reference standard and disease progression bias which are not relevant for the kinds of studies in this review [49].
| Author | Assessment | Control | HTN | ||||||||
| N | Age (yrs) | Sex (%M) | LV mass (g/m |
LVEF | N | Age (Yrs) | Sex (%M) | LV mass (g/m |
LVEF | ||
| Lembo et al. 2020 [22] | echocardiogram + | 115 | 42 | 60 | 31 | 62.6 | 180 | 44 | 63 | 33 | 62.5 |
| Esposito et al. 2019 [20] | echocardiogram | 82 | 54 | 59 | 88 | 60.4 | 18 | 56 | 50 | 101 | 58.7 |
| Xu et al. 2019 [36] | echocardiogram | 50 | 53 | 24 | 84 | 64.4 | 80 | 54 | 50 | 131 | 65.1 |
| Sun et al. 2019 [38] | echocardiogram | 80 | 51 | 79 | 92 | 65 | 80 | 51 | 79 | 116 | 64.3 |
| Mordi et al. 2018 [28] | echocardiogram | 28 | 68 | 50 | NA | 64.3 | 22 | 67 | 77 | NA | 65.6 |
| Minatoguchi et al. 2017 [29] | echocardiogram | 54 | 69 | 61 | 87 | 67 | 50 | 70 | 60 | 95 | 67.9 |
| Huang et al. 2016 [37] | echocardiogram | 42 | 50 | NA | NA | 65 | 63 | 55 | NA | NA | 64.6 |
| Szelenyi et al. 2015 [30] | ecocardiogram | 18 | 66 | 33 | 90 | 67.6 | 94 | 69 | 34 | 109 | 65.3 |
| Santoro et al. 2014 [19] | echocardiogram | 17 | 40 | 100 | 89 | 58.7 | 22 | 48 | 100 | 126 | 58.5 |
| Shin et al. 2014 [35] | echocardiogram | 40 | 29 | 78 | 79 | 62.1 | 40 | 30 | 84 | 84 | 62 |
| Tadic et al. 2014 [34] | echocardiogram | 49 | 49 | 78 | 39 | 60 | 50 | 48 | 80% | 48 | 56.6 |
| Celic et al. 2014 [27] | echocardiogram + | 50 | 46 | 76 | 39 | 65 | 152 | 48 | 77 | 45 | 63.3 |
| Ozkan et al. 2014 [26] | echocardiogram | 40 | 52 | 70 | 66 | 66.2 | 78 | 51 | 65 | 102 | 65.1 |
| Kouzu et al. 2011 [31] | echocardiogram | 55 | 59 | 15 | 83 | 66 | 74 | 62 | 23 | 114 | 66.4 |
| Imbalzano et al. 2011 [33] | echocardiogram | 51 | 52 | 65 | 64 | 63 | 51 | 51 | 65 | 103 | 59.5 |
| Galderisi et al 2010 [32] | echocardiogram + | 19 | 29 | 100 | 31 | 61.7 | 18 | 33 | 100 | 37 | 61.6 |
| Cappelli et al. 2009 [24] | echocardiogram | 24 | 45 | 54 | 93 | 62.7 | 22 | 52 | 77 | 140 | 64.1 |
| Narayanan et al. 2009 [21] | echocardiogram | 52 | 49 | 27 | 66 | 66 | 52 | 53 | 46 | 89 | 67.9 |
| HTN no LVH | HTN with LVH | ||||||||||
| N | Age | Sex m% | LV mass (g/m |
N | Age | sex m% | LV mass (g/m |
||||
| Esposito et al. 2019 [20] | echocardiogram | 18 | 56 | 56 | 81 | 10 | 58 | 0.9 | 137 | ||
| Xu et al. 2019 [36] | echocardiogram | 40 | 53 | 50 | 86 | 40 | 55 | 50 | 126 | ||
| Minatoguchi et al. 2017 [29] | echocardiogram | 50 | 70 | 70 | 60 | 40 | 69 | 58 | 132 | ||
| Huang et al. 2016 [37] | echocardiogram | 35 | 55 | NA | NA | 28 | 54 | NA | NA | ||
| Szelenyi et al. 2015 [30] | echocardiogram | 38 | 66 | 24 | 105 | 56 | 72 | 41 | 125 | ||
| Ozkan et al. 2014 [26] | echocardiogram | 38 | 49 | 63 | 81 | 40 | 53 | 68 | 123 | ||
| Goebel al 2011 [25] | echocardiogram + | 36 | 65 | 44 | 42 | 44 | 63 | 38 | 66 | ||
| Imbalzano et al. 2011 [33] | echocardiogram | 24 | 53 | 58 | 81 | 27 | 60 | 70 | 122 | ||
| Echocardiogram+ is g/m |
|||||||||||
HTN, hypertension; LV, left ventricle; LVEF, left ventricular ejection fraction; LVH, left ventricular hypertrophy; NA, not available.
+ is the symbol that refers to different units of LVH.
| Author | Control | HTN | ||||||||
| N | Age (yrs) | Sex (%M) | LV mass (g/m |
LVEF (%) | N | Age | Sex (%M) | LV mass (g/m |
LVEF (%) | |
| Tsai et al. 2022 [39] | 32 | 53 | 37.5 | 74 | 70 | 43 | 51 | 56 | 74 | 67 |
| de Andrade Hygidio et al. 2022 [40] | 16 | 61 | 35 | 83 | 66 | 55 | 61 | 25 | 91 | 66 |
| Ding et al. 2022 [41] | 40 | 49 | NA | 91 | 67 | 60 | 58 | NA | 93 | 66 |
| Huang et al. 2021 [42] | 53 | 47 | 53 | 94 | 65 | 95 | 49 | 62 | 107 | 64 |
| Tadic et al. 2021 [44] | 45 | 54 | 53 | 67 | 61 | 159 | 56 | 56 | 83 | 60 |
| Jaglan et al. 2021 [45] | 15 | 38 | 47 | 77 | 60 | 65 | 65 | 46 | 97 | 61 |
| Loncaric et al. 2020 [46] | 30 | 54 | 44 | 68 | 58 | 139 | 57 | 52 | 76 | 56 |
| Tadic et al. 2020 [43] | 55 | 51 | 52 | 70 | 63 | 110 | 55 | 52 | 87 | 62 |
| Chan et al. 2019 [47] | 8 | 54 | 38 | 77 | 61 | 37 | 72 | 65 | 186 | 62 |
HTN, hypertension; LV, left ventricle; LVEF, left ventricular ejection fraction.
Global longitudinal strain was significantly lower in patients with hypertension
compared to those without hypertension (Fig. 1). The majority, 13 of the 18
studies, showed a significant difference between hypertension and control group.
The mean difference between the hypertensive and non-hypertensive groups was 2.0
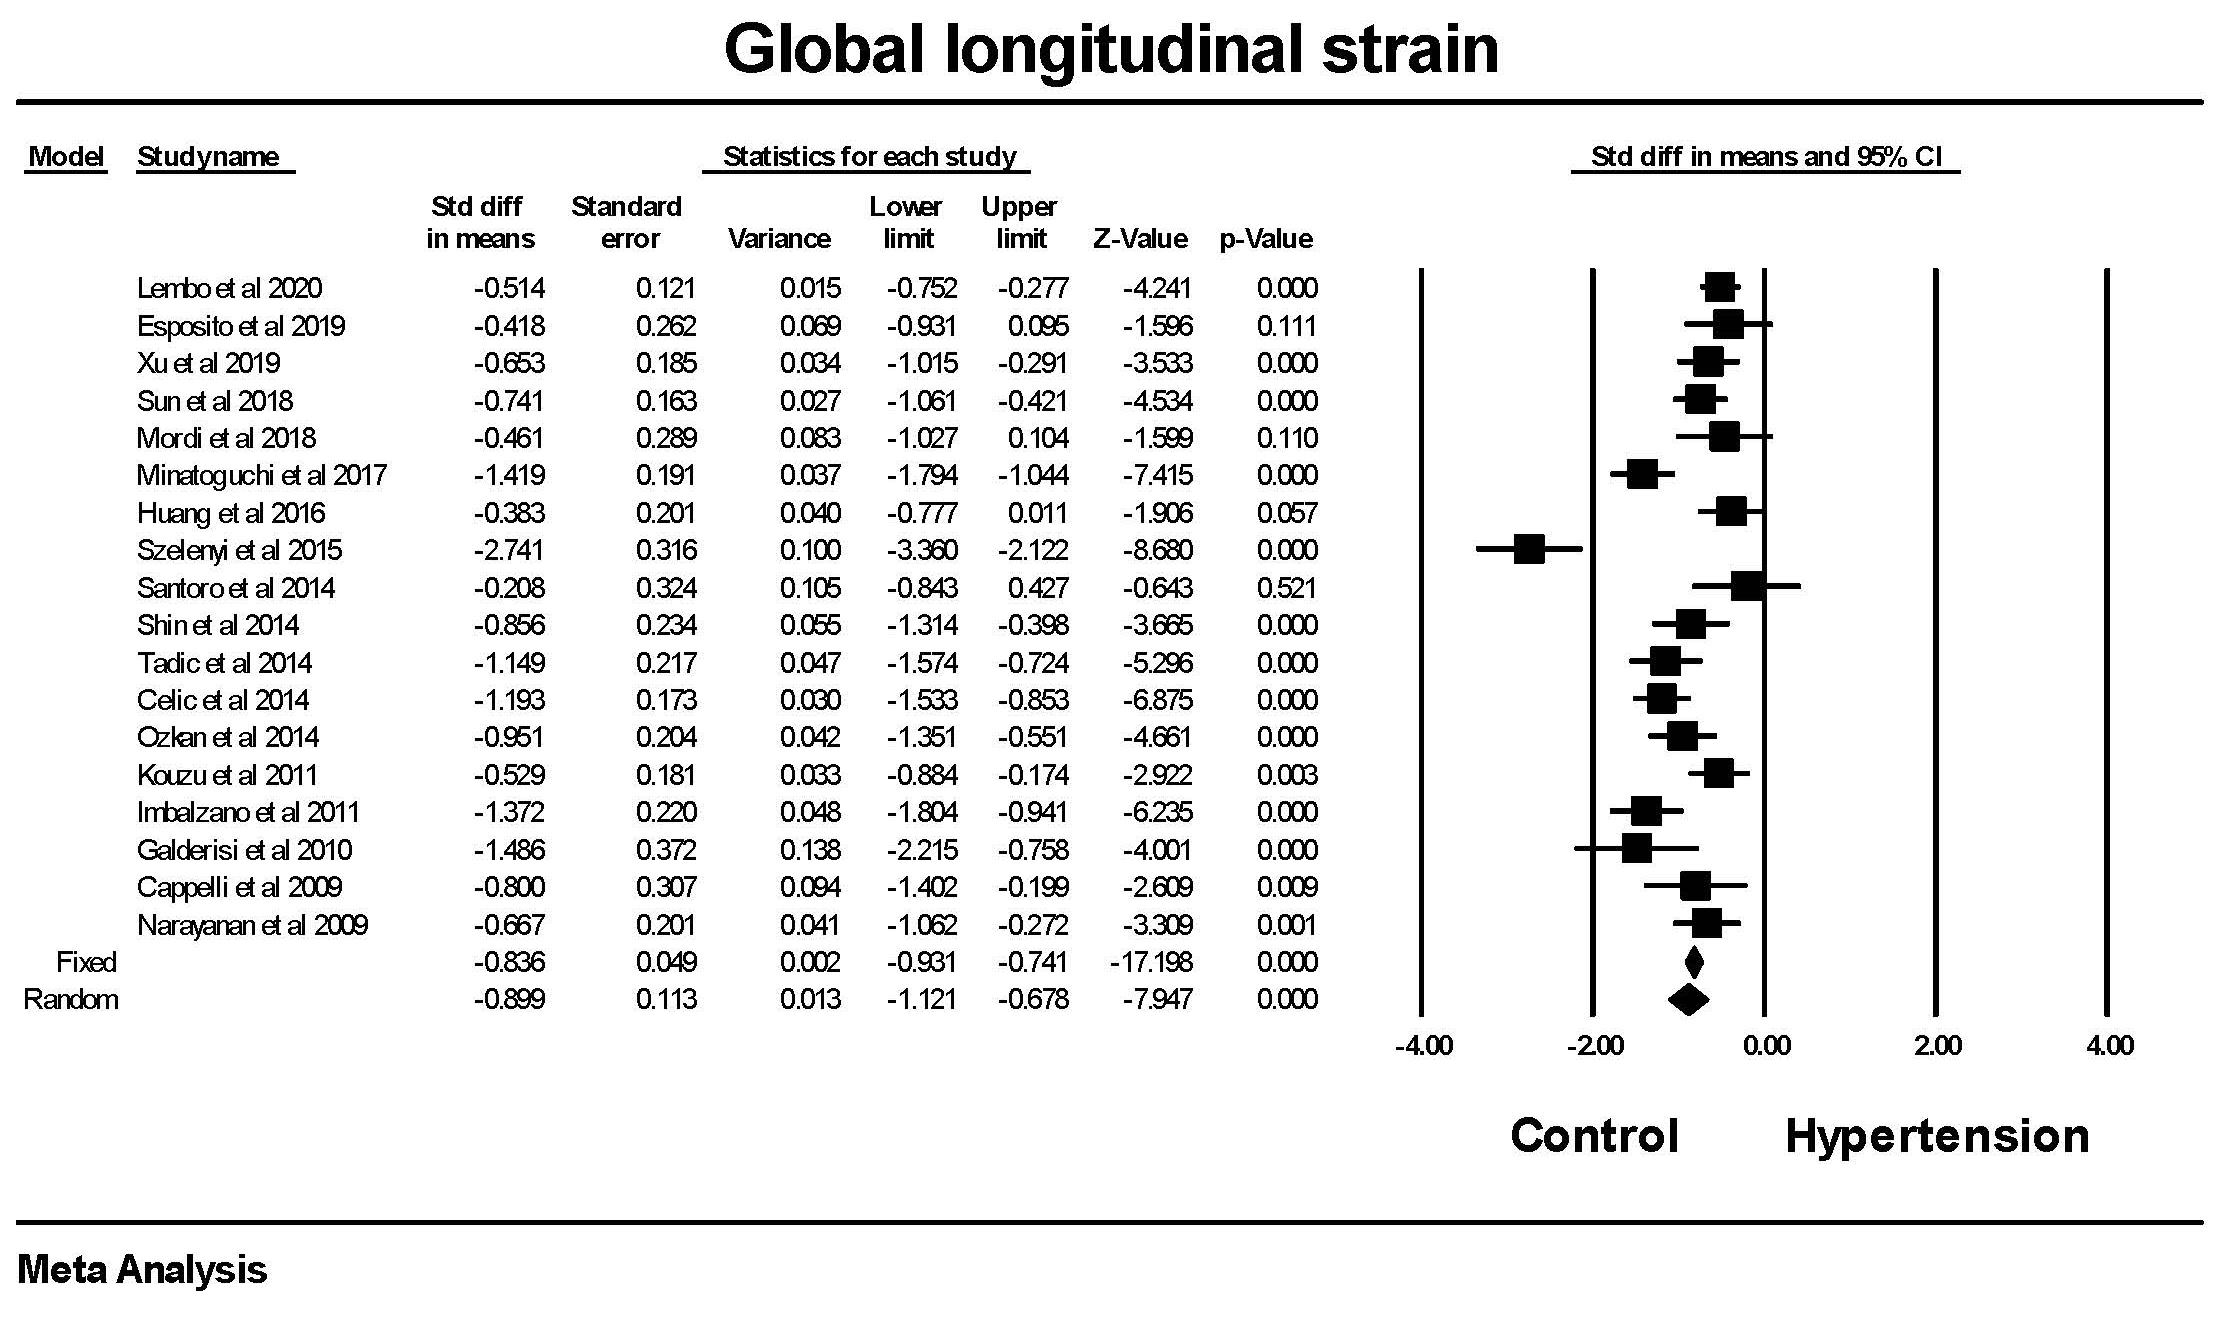 Fig. 1.
The forest plot for Global longitudinal strain (GLS) in
patients with hypertension compared to control groups without hypertension. The
overall standard difference of the means was significant for both the fixed and
random effects models. There was significant heterogeneity with Q = 99.8,
p
Global circumferential strain was significantly lower in patients with
hypertension compared to those without hypertension (Fig. 2). There was a
significant amount of heterogeneity between studies. The mean difference between
the hypertensive and non-hypertensive groups was 1.37
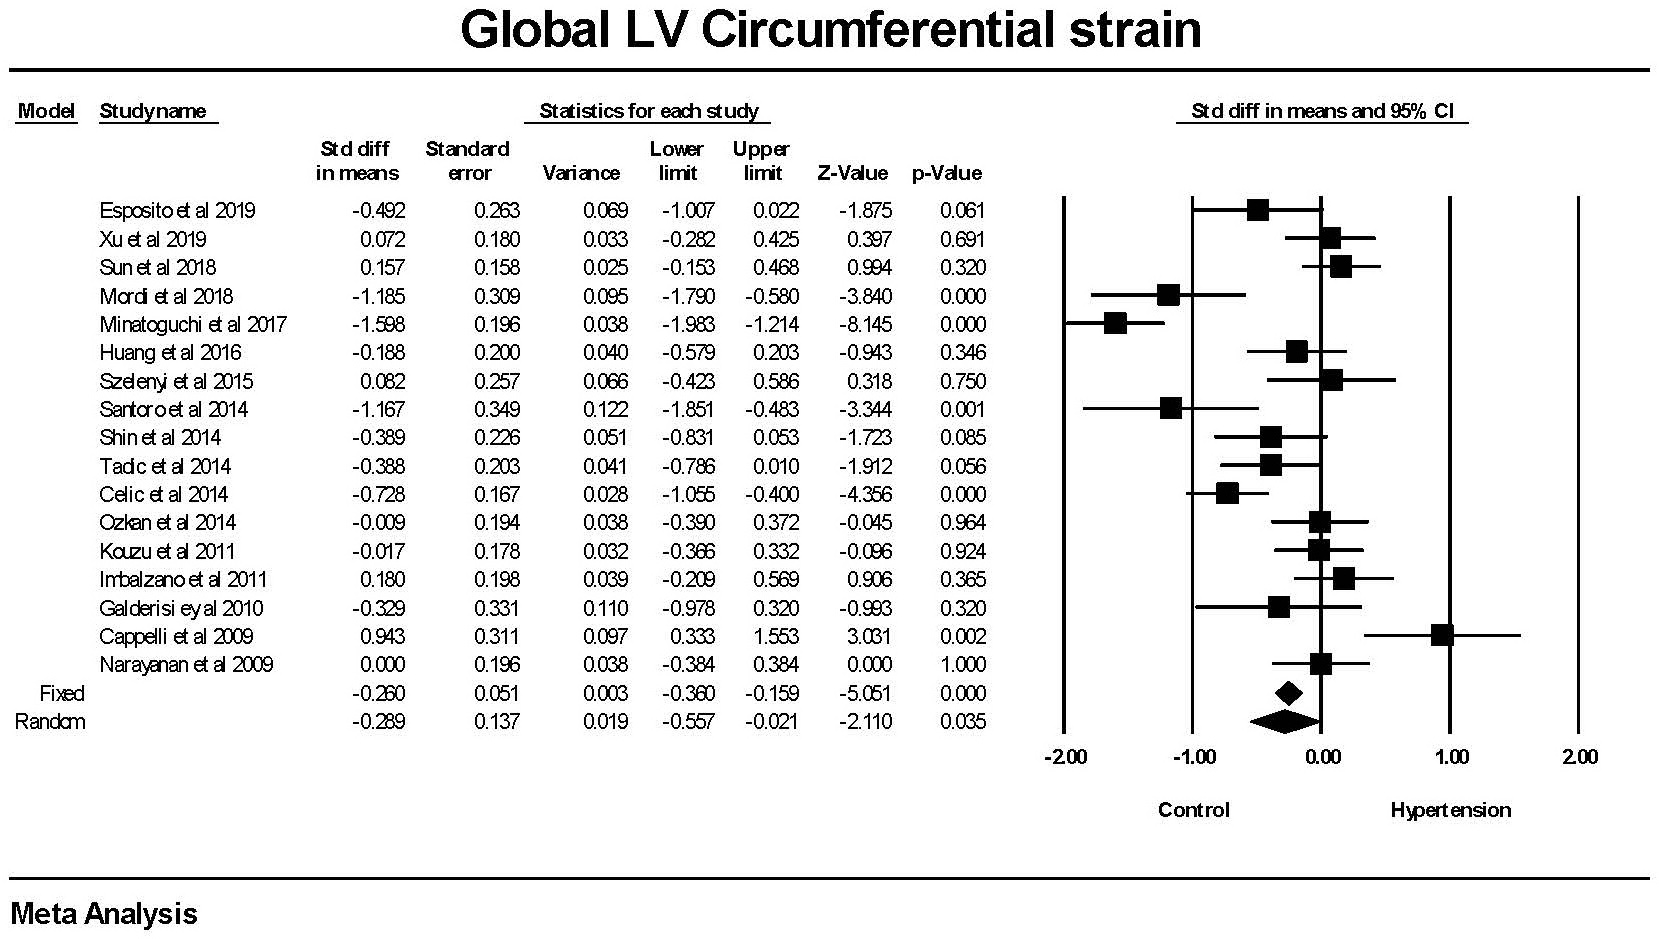 Fig. 2.
The forest plot for Global Circumferential strain (GCS) in
patients with hypertension compared to control groups without hypertension. The
overall standard difference of the means was significant for both the fixed and
random effects models. There was significant heterogeneity with Q = 109.015,
p
Global radial strain was significantly (p
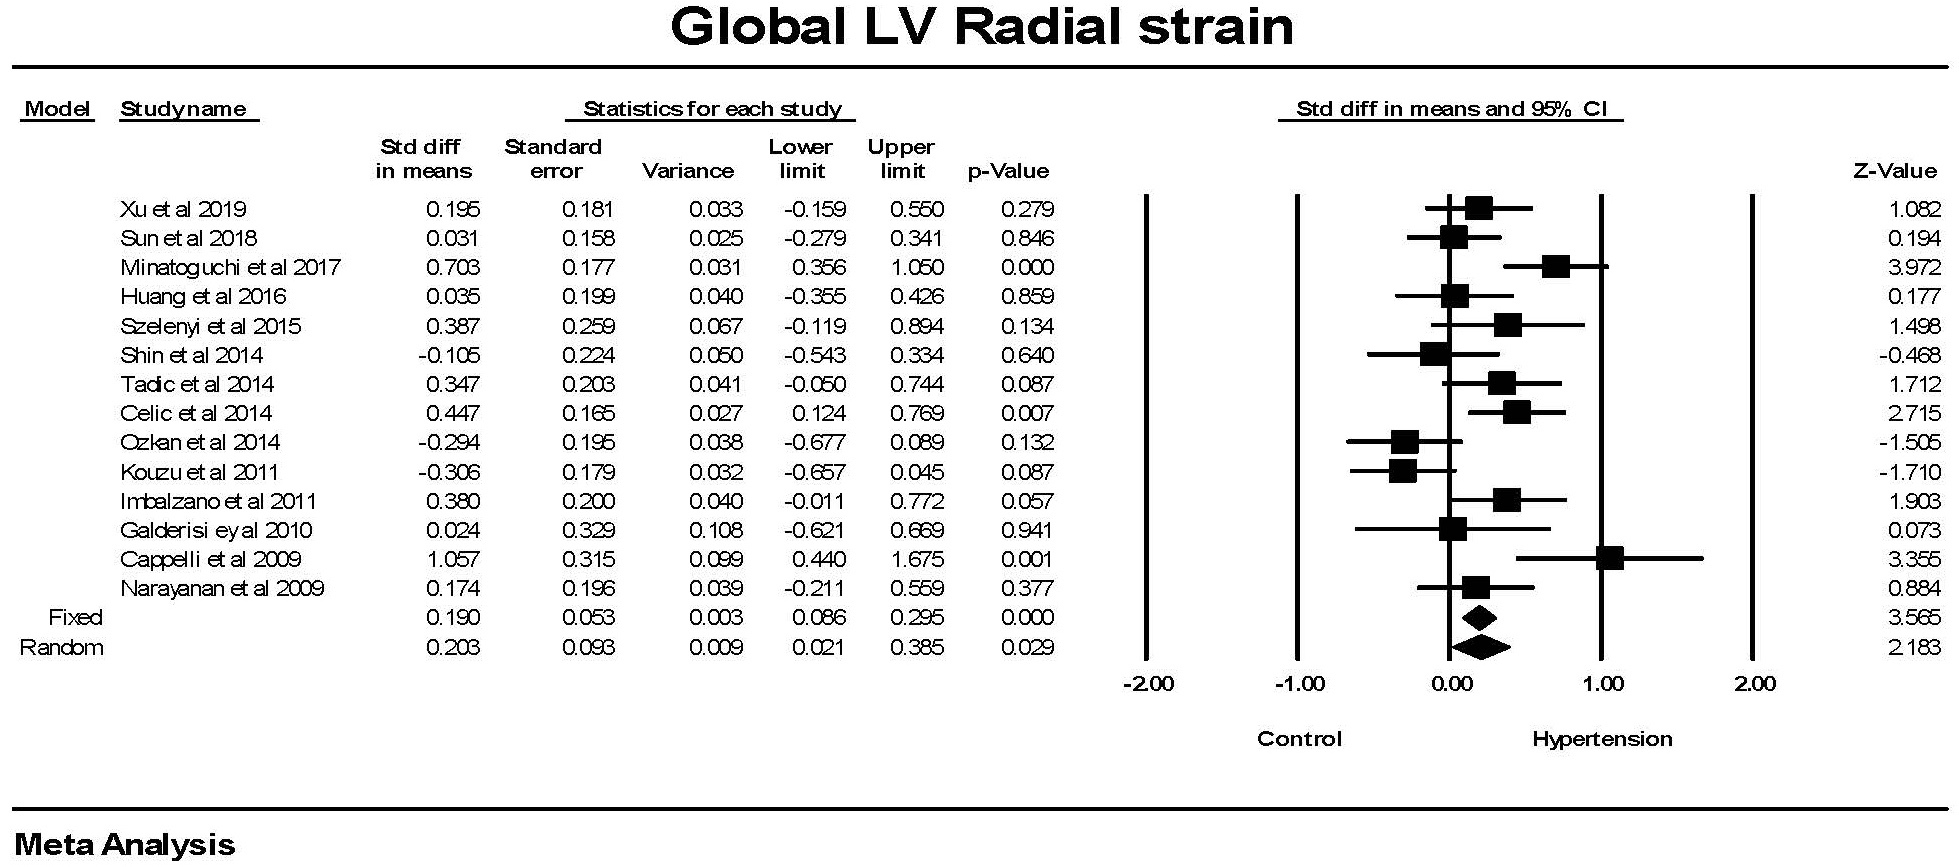 Fig. 3.
The forest plot for Global radial strain (GRS) in patients with
hypertension compared to control groups without hypertension. There was
significant heterogeneity with Q = 37.9, p
In the entire population, control and hypertensive group, there was a significant relationship between GLS and GCS as well as between GCS and GRS (Fig. 4). There was no significant relationship between GLS and GRS.
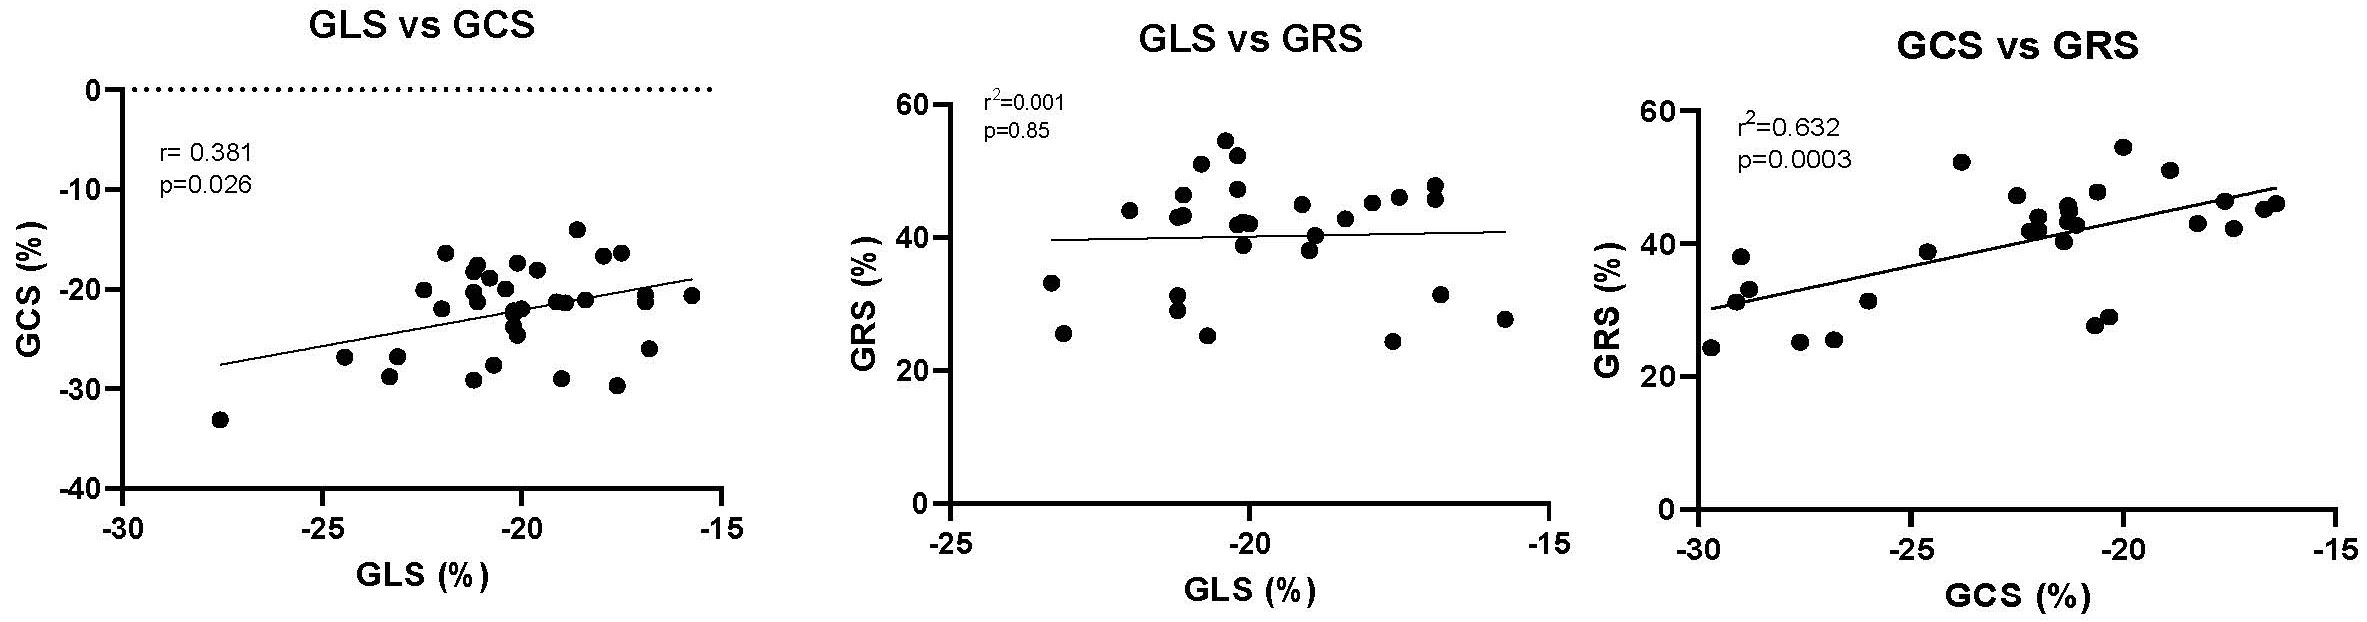 Fig. 4.
The relationship between GLS, GCS and GRS. Each point represents the mean value for both the control and the individuals with hypertension from each study. The Pearson’s r correlation and the p value are shown. GLS, Global longitudinal strain; GCS, Global circumferential strain; GRS, Global radial strain.
There was no significant difference in the left ventricular ejection fraction between the hypertension and non-hypertension groups (Fig. 5).
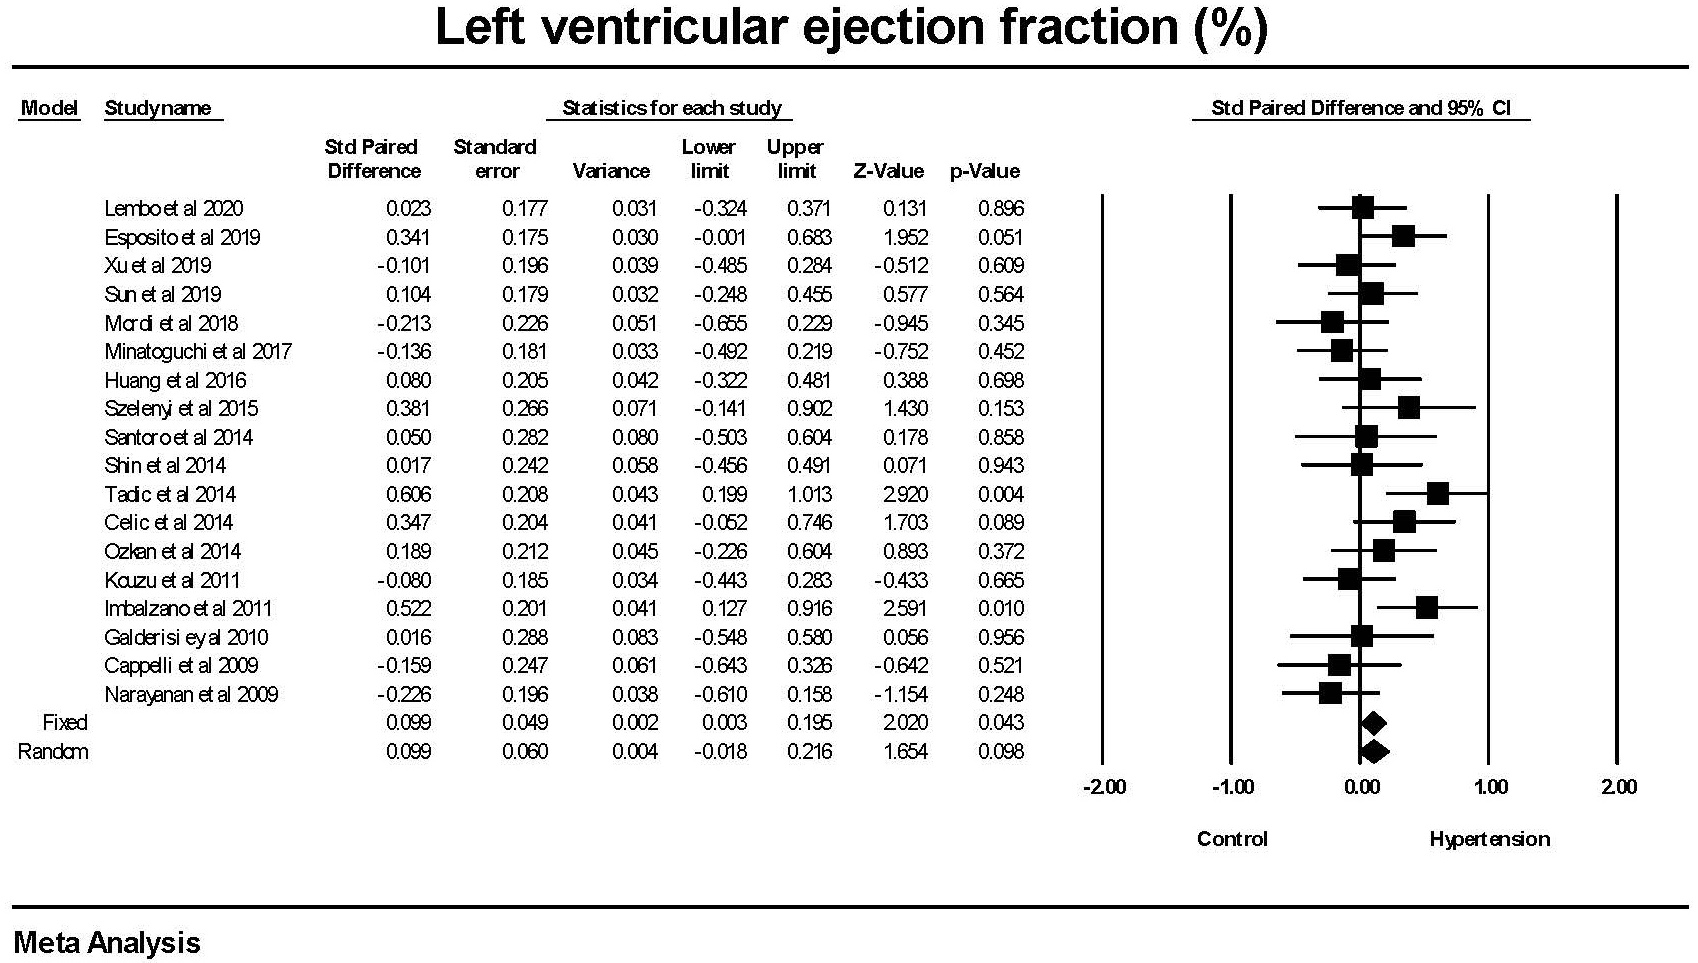 Fig. 5.
The forest plot for left ventricular ejection fraction (LVEF) in
patients with hypertension compared to control groups without hypertension. There
was a weak difference in LVEF in the fixed effect model (p = 0.043) but
none in the random effects model (p = 0.098). There was no significant
heterogeneity with Q = 24.9, p = 0.097, I
Examining the relationship between LVEF and global strain did not find any significant relationships between LVEF and either GLS or GCS but a significant negative correlation between LVEF and GRS (Fig. 6).
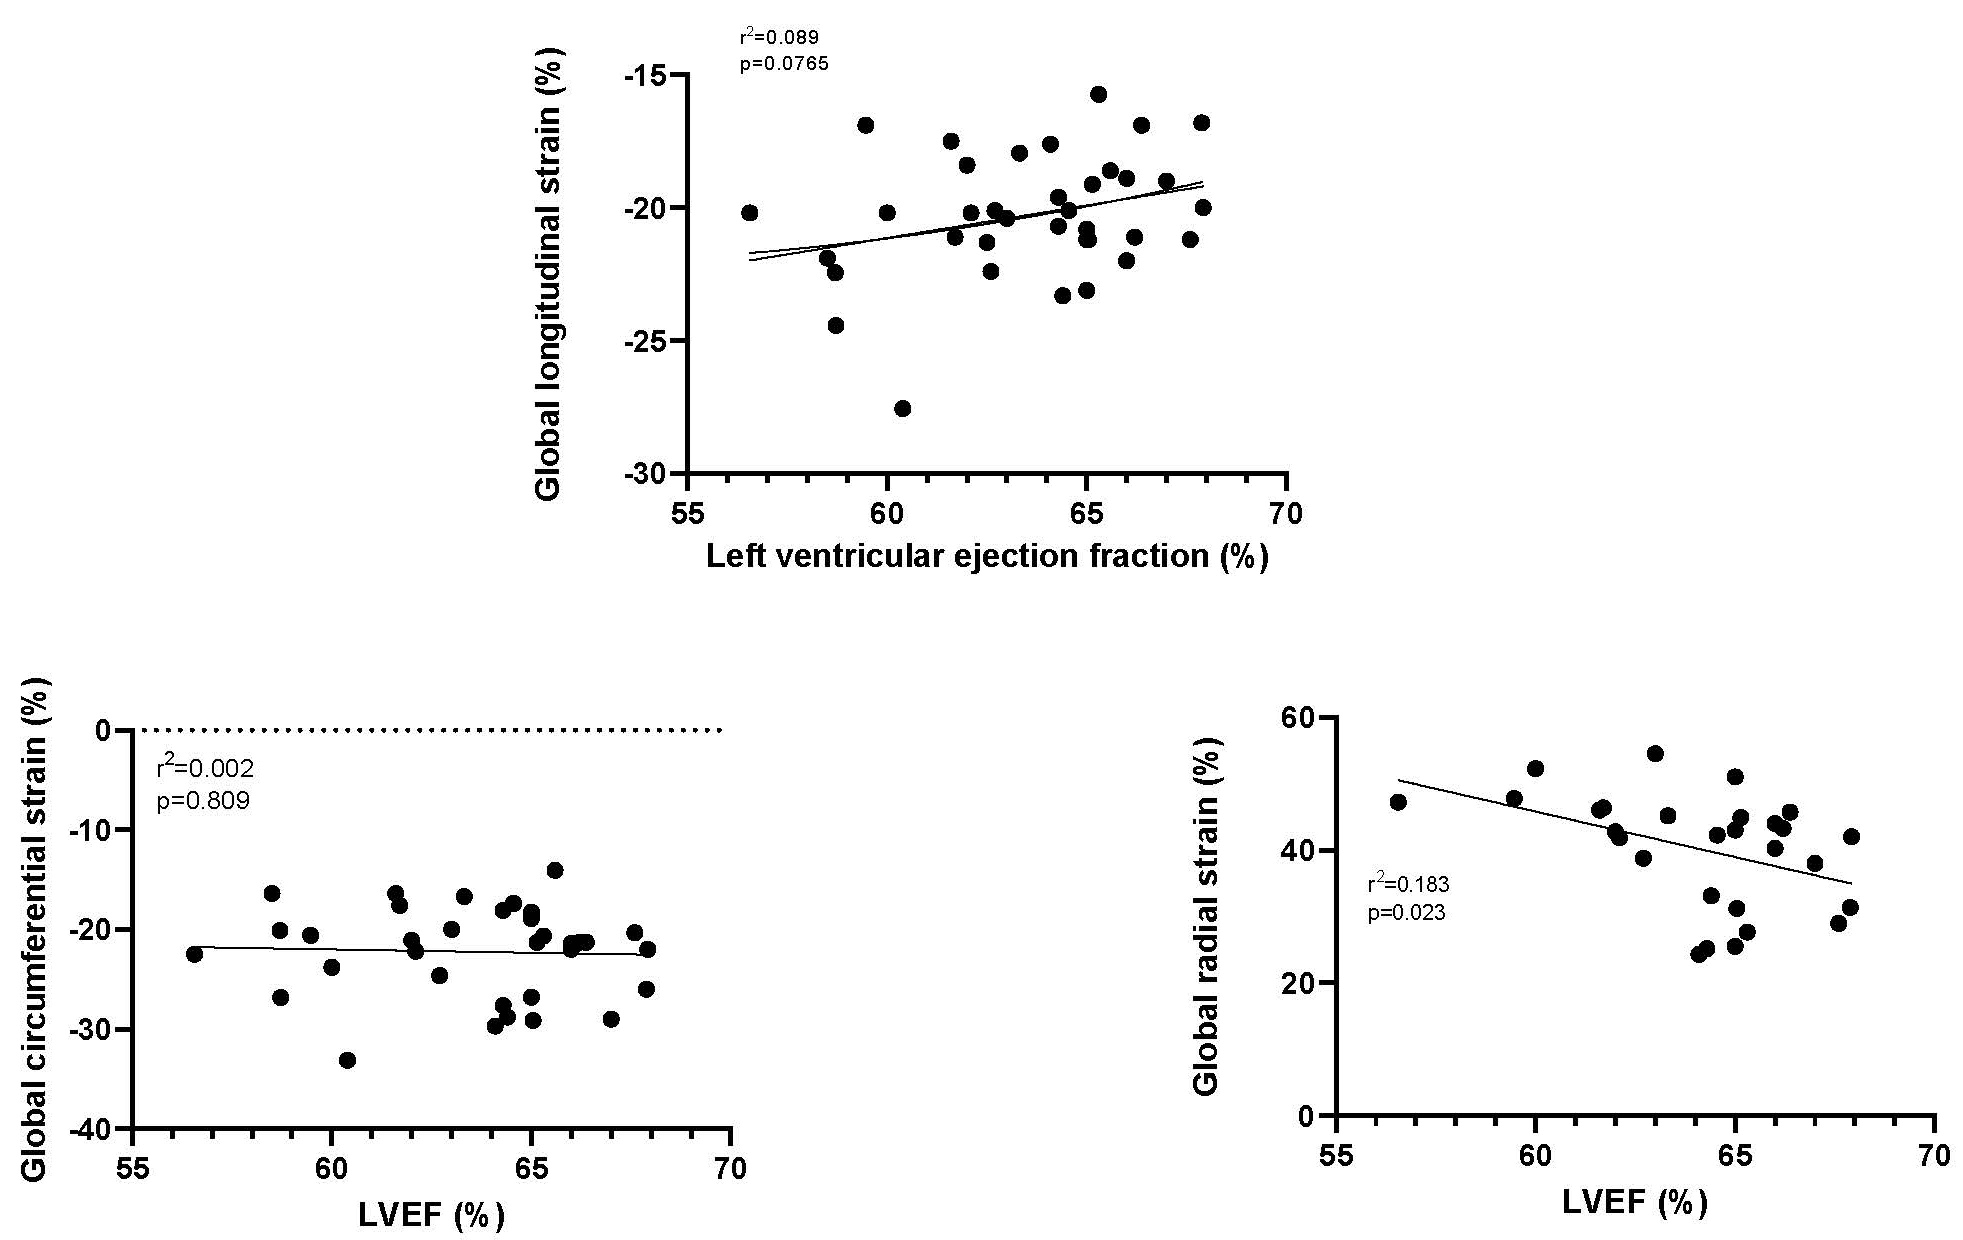 Fig. 6.
The relationship between left ventricular ejection fraction (LVEF) and GLS, GCS and GRS. GLS, Global longitudinal strain; GCS, Global circumferential strain; GRS, Global radial strain.
In order to explore whether left ventricular hypertrophy impacted the changes in left ventricular strain, an analysis was conducted on the subset of studies that evaluated LV strain in patients with hypertension with and without LVH (Table 3, Ref. [20, 25, 26, 29, 30, 33, 36, 37]). Most, but not all, studies, used the same definition of LVH.
| Author | Criterion | Definition left ventricular hypertrophy |
| Esposito et al. 2019 [20] | European Society of Cardiology guidelines. | Not defined |
| Xu et al. 2019 [36] | Devereux formula | |
| Minatoguchi et al. 2017 [29] | American Society of Echocardiography recommendations | |
| Huang et al. 2016 [37] | Not defined | |
| Szelenyi et al. 2015 [30] | Devereux formula | |
| Ozkan et al. 2014 [26] | Devereux formula | |
| Goebel al 2011 [25] | Devereux formula | Not defined |
| Imbalzano et al. 2011 [33] | American Society of Echocardiography recommendations |
There was a significant (p
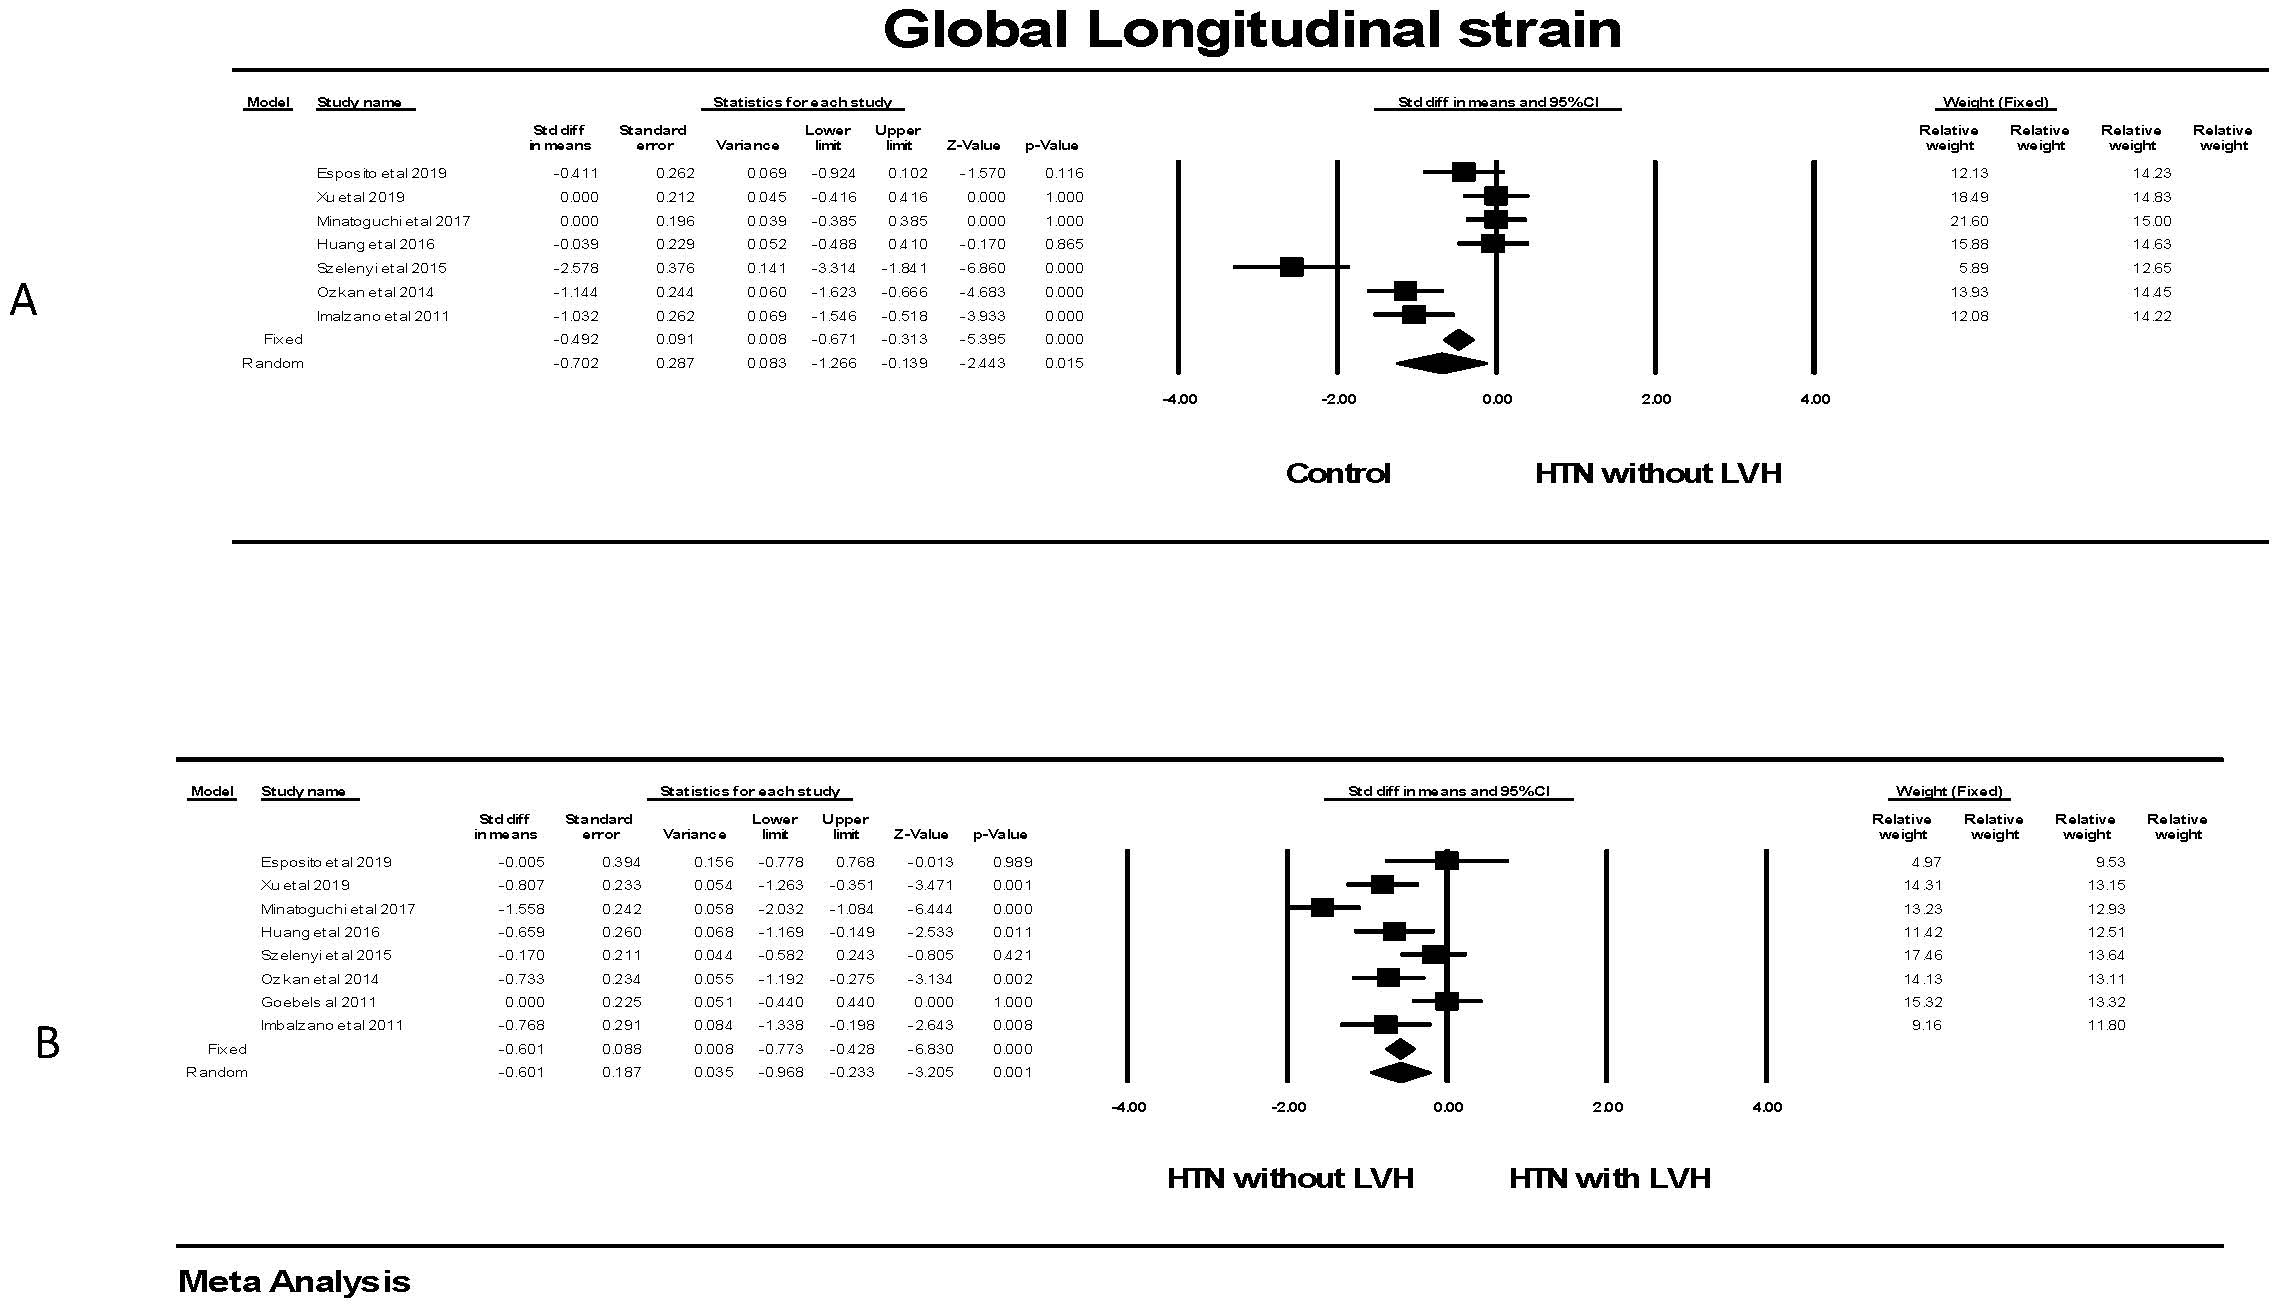 Fig. 7.
Global longitudinal strain in patients with hypertension. (A)
shows the forest plot for Global longitudinal strain (GLS) in patients with
hypertension but no left ventricular hypertrophy compared to control groups
without hypertension. There was significant heterogeneity with Q = 59.5,
p
Considering both groups, i.e., those with and without hypertension together, there was no correlation between LV mass and GLS (r = 0.117, p = 0.522).
Evaluating global circumferential strain, there was no significant difference in GCS for individuals with hypertension and no LVH compared to individuals without hypertension (Fig. 8). This was found in all studies. There was also no significant difference in the random effects model in persons with hypertension and LVH compared to those with hypertension and no LVH. There was significant heterogeneity in these studies with three showing a significantly lower and one with a significantly higher GCS.
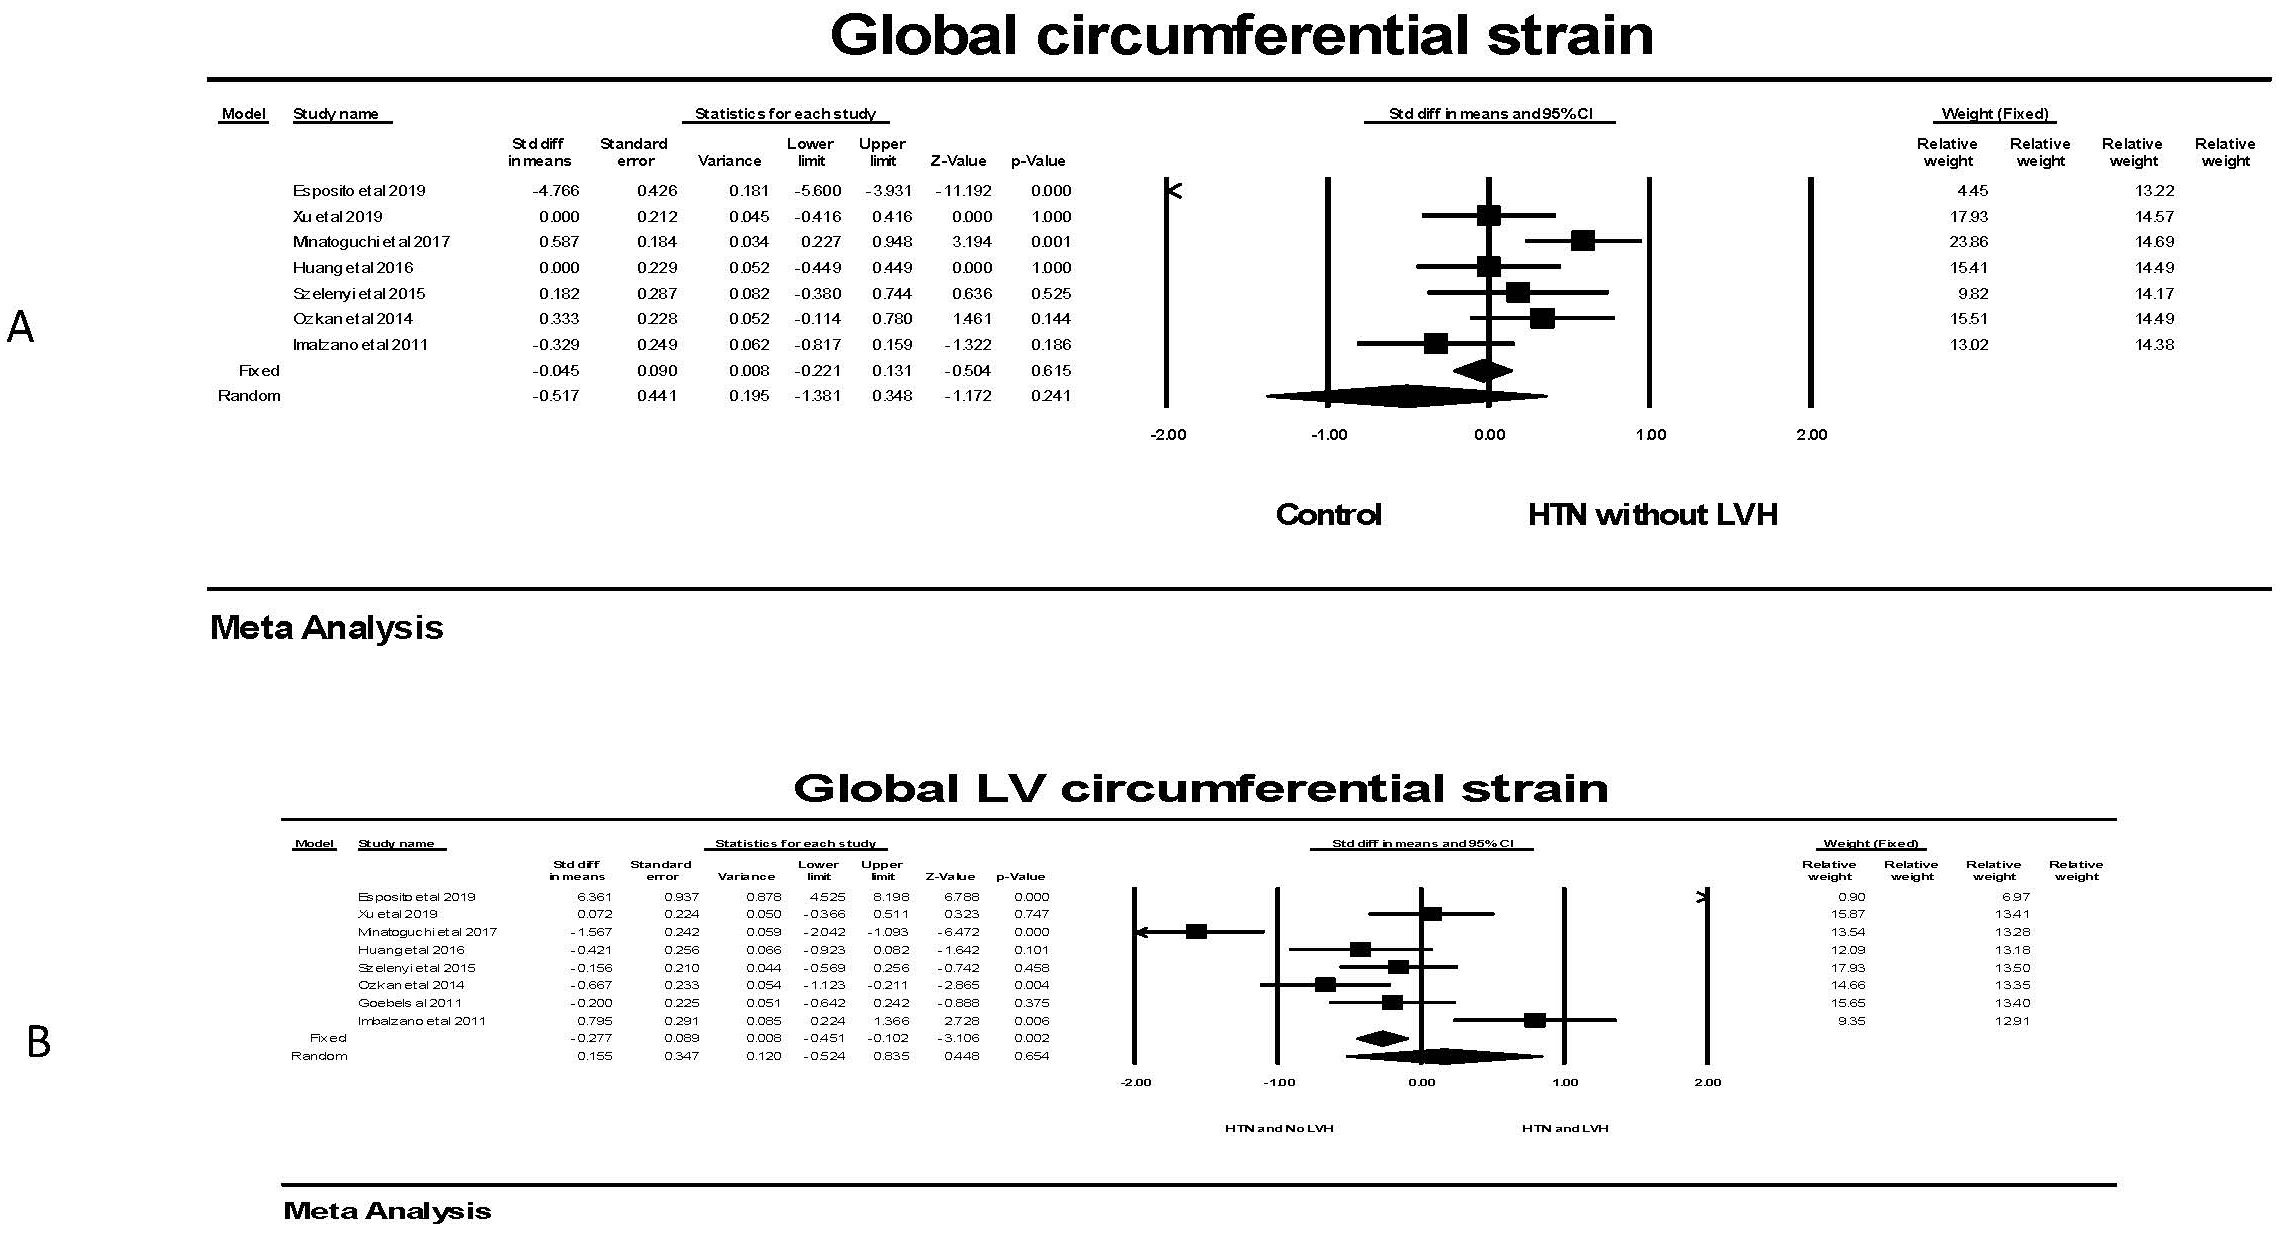 Fig. 8.
The forest plots for Global LV circumferential strain and LVH.
(A) shows the forest plot for global circumferential strain (GCS) in patients
with no hypertension (HTN) compared to the group with hypertension without left
ventricular hypertrophy (LVH). There was significant heterogeneity with Q =
139.5, p
For global radial strain, there was no significant difference in GRS between individuals without LVH compared to those with LVH in the random effects model (Fig. 9), although a significant difference was found in the fixed effect model; attributable to two studies. Comparing individuals with hypertension, the presence of LVH was not associated with a significant difference in the random effects model although a significant one was observed with the fixed effect model attributable to only one study.
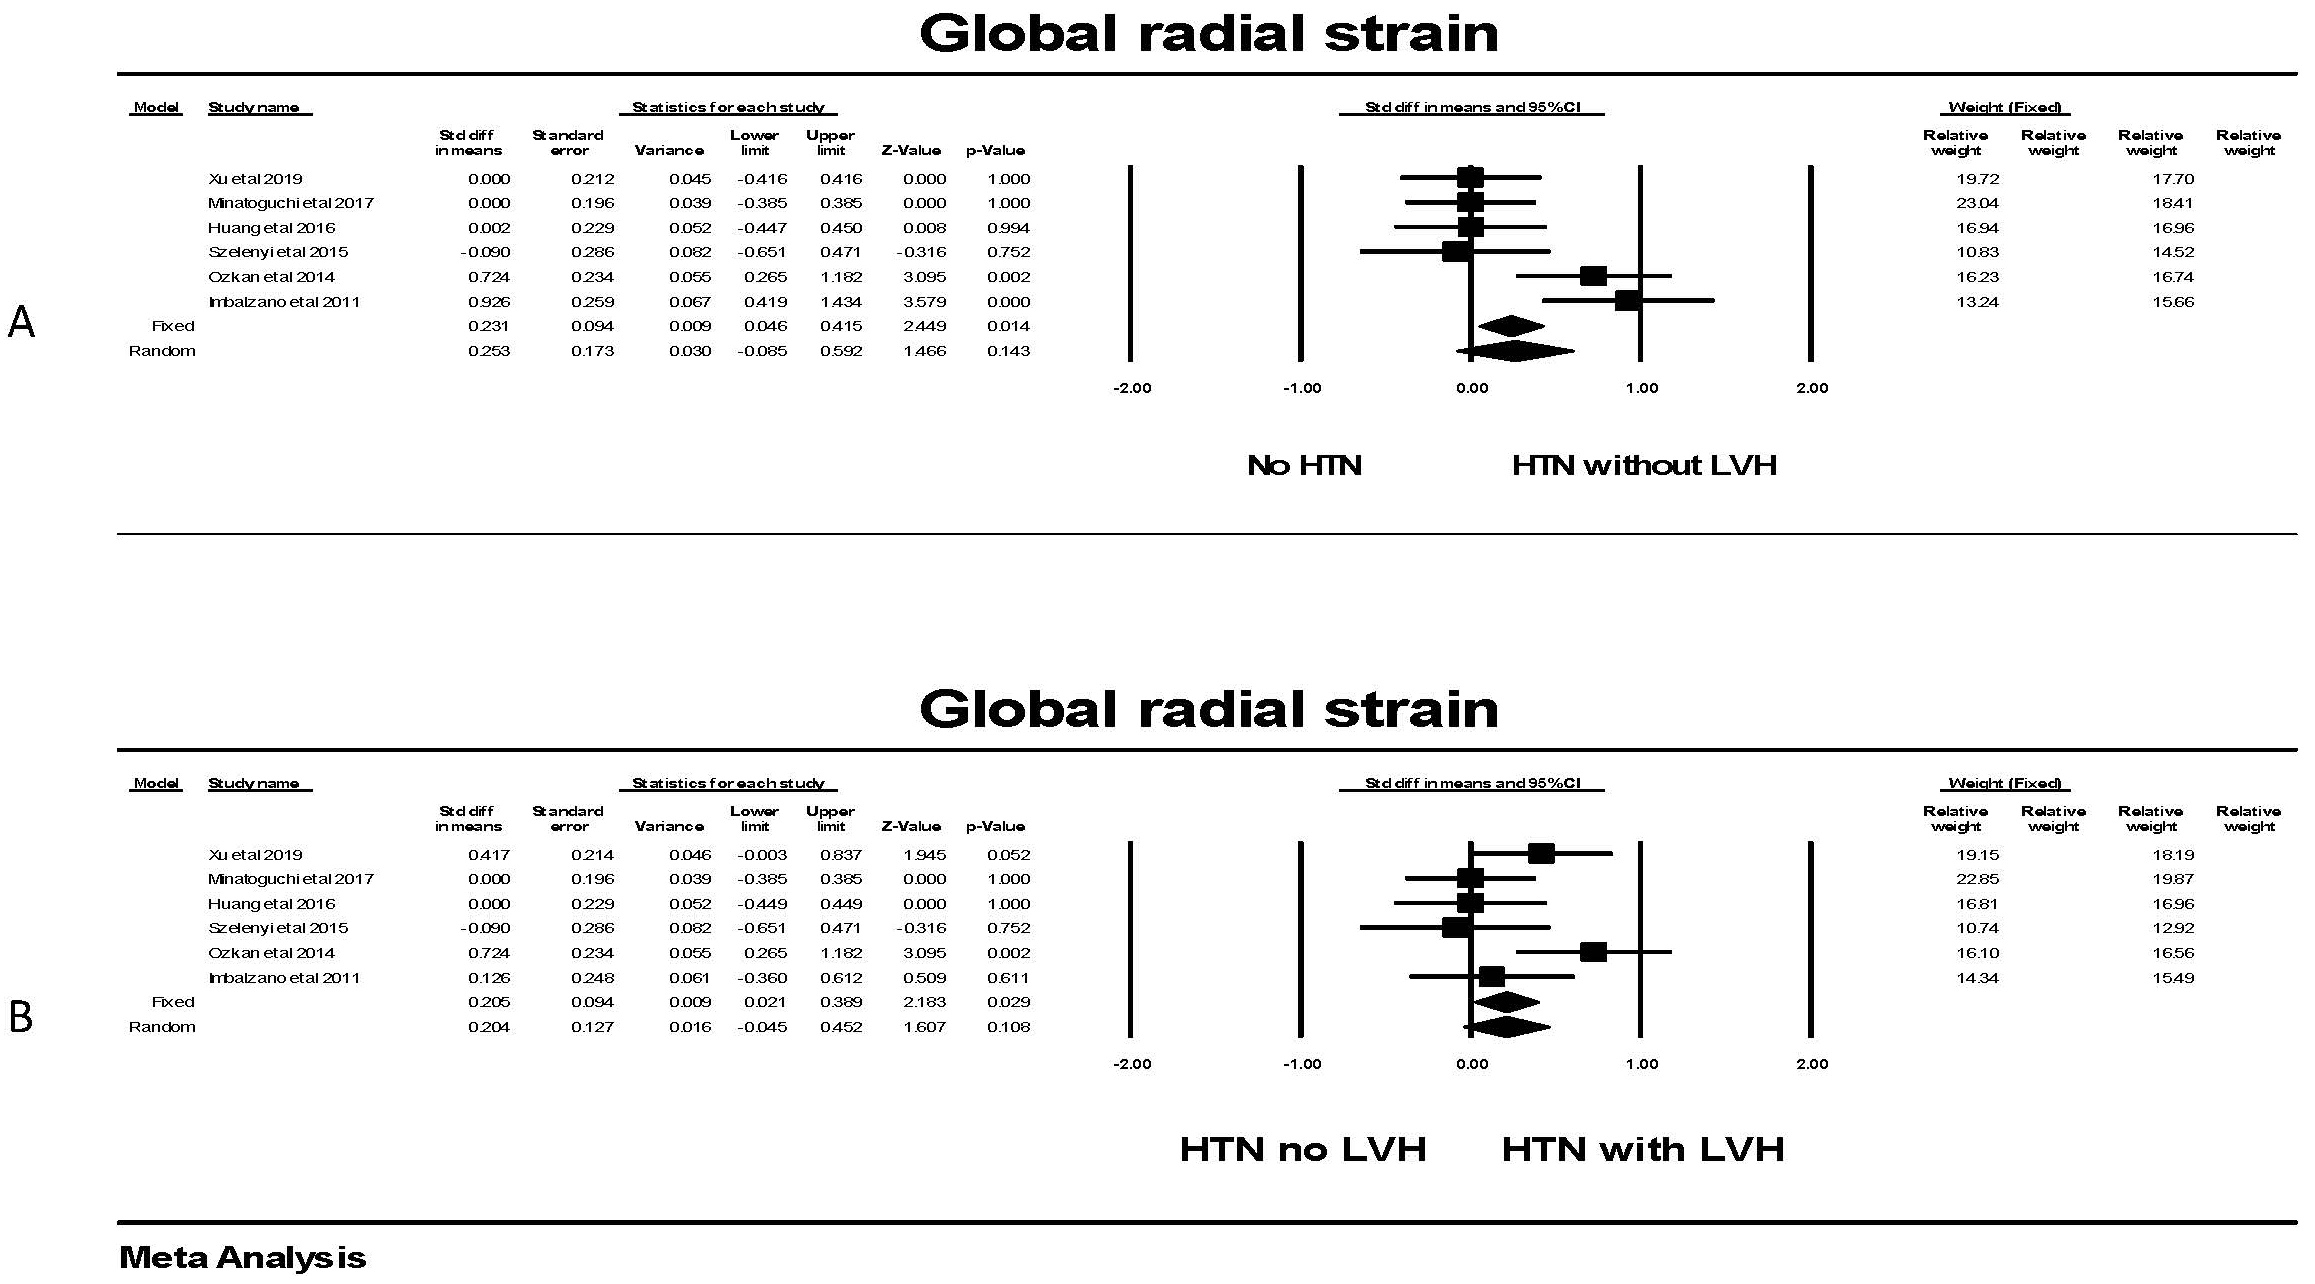 Fig. 9.
The forest plot for global radial strain (GRS) in patients with
hypertension. (A) shows the forest plot for global radial strain (GRS)
in patients with no hypertension (HTN) compared to the group with hypertension
without left ventricular hypertrophy (LVH). There was significant heterogeneity
with Q = 16.5, p = 0.005, I
The Global myocardial work index was significantly lower in individuals with
hypertension compared to controls (Fig. 10). While there was significant
heterogeneity between studies, each study found a significant difference between
the groups. Hedges’ g is a measure of effect size which indicates how
much the groups differ from one another. Comparing studies that had a concomitant
measurement of GLS, Hedges’ g was larger for GWI comparing hypertension
to control than for GLS comparing hypertension to control (1.060
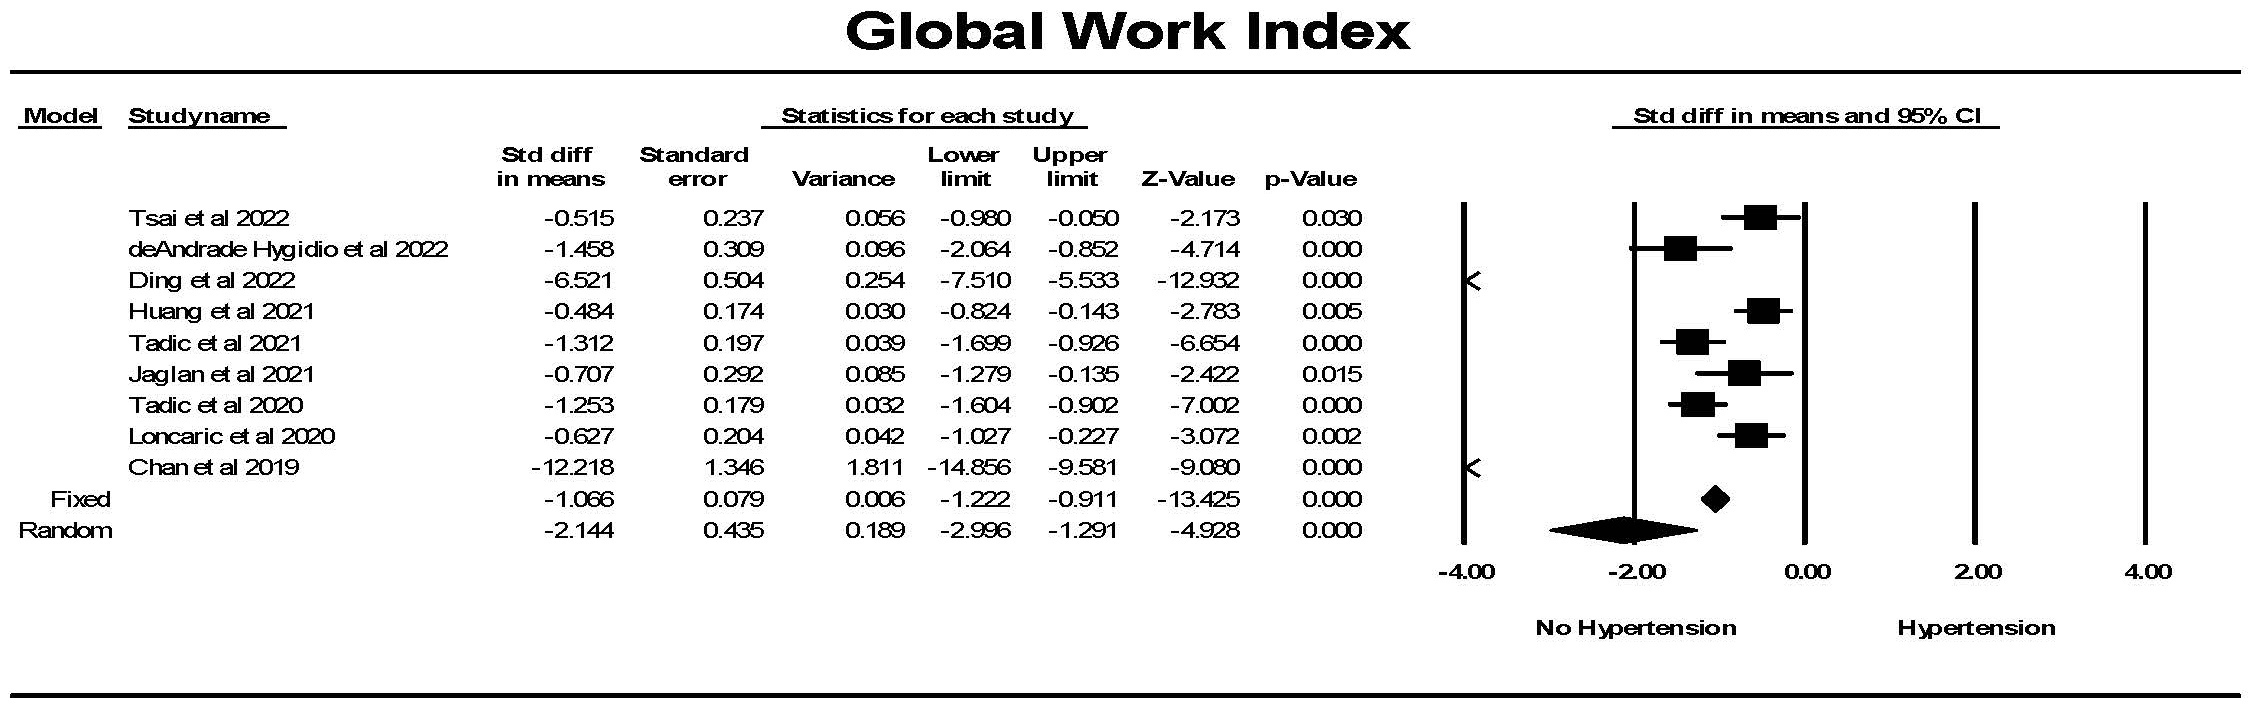 Fig. 10.
The forest plot for global myocardial work index (mmHg%)
(GWI) in patients with no hypertension (Control) compared to the group with
hypertension. There was significant heterogeneity with Q = 212.7, p
Global constructive work (GCW) was significantly lower in controls than in
individuals with hypertension (Fig. 11). While there was significant
heterogeneity between studies, each study found a significant difference between
the groups. Hedges’ g was larger for GWI comparing hypertension to
control than for GLS comparing hypertension to control (1.101
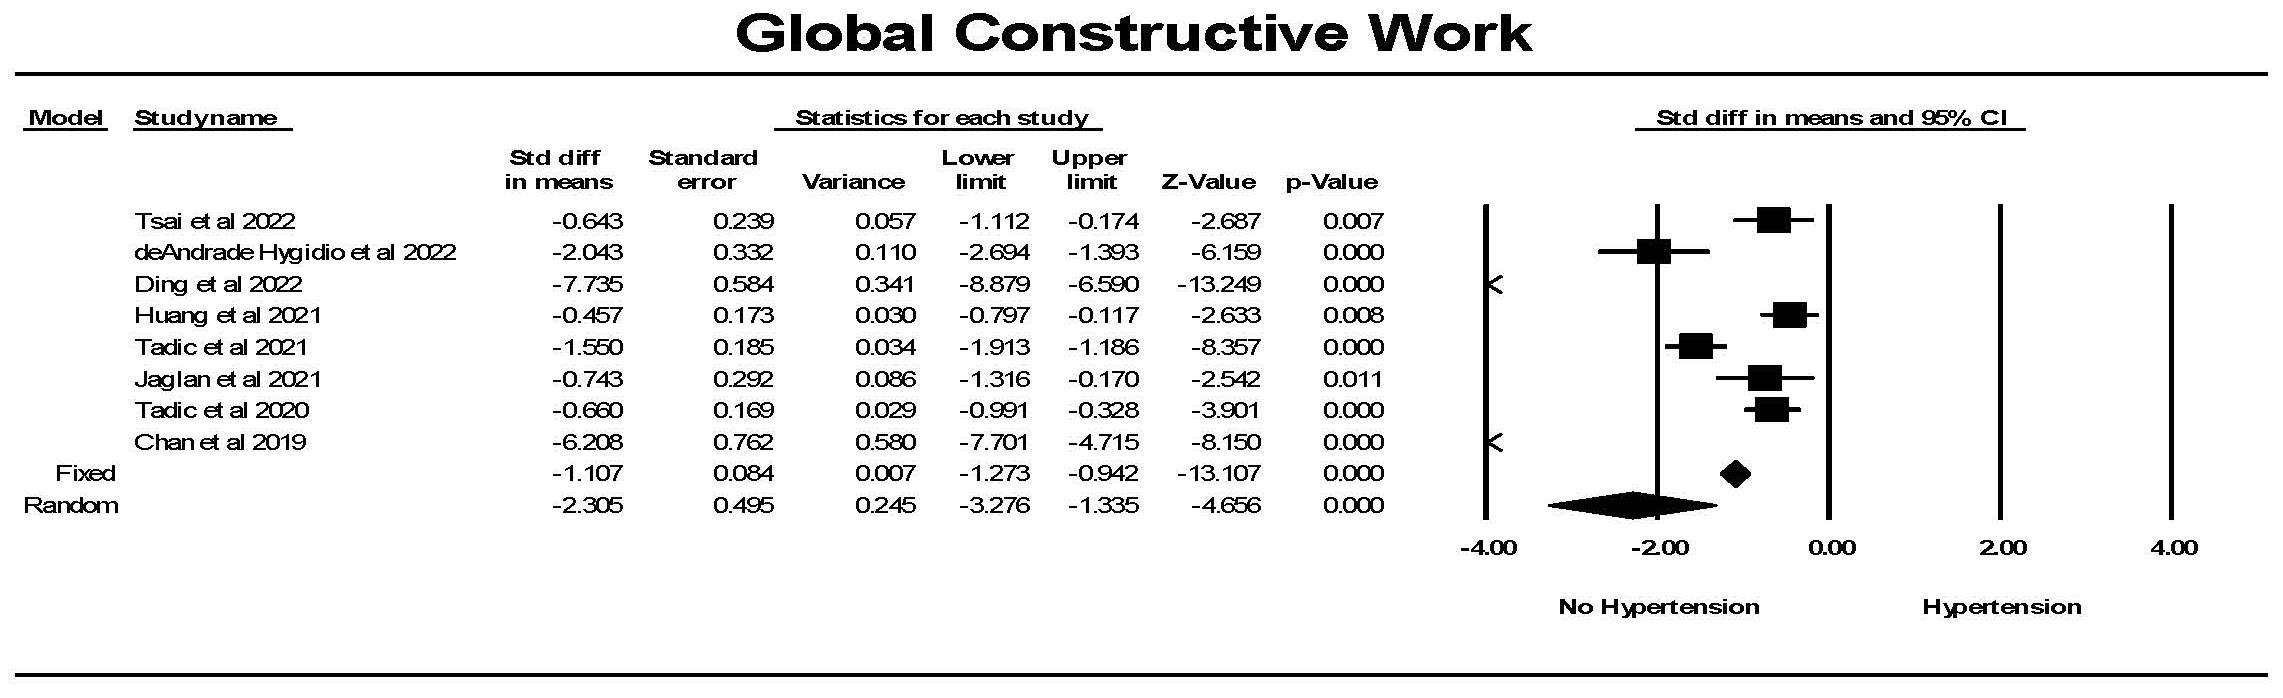 Fig. 11.
The forest plot for global constructive work (mmHg%) (GCW) in
patients with no hypertension (Control) compared to the group with hypertension.
The arrow represents confidence interval extending beyond the scale. There was
significant heterogeneity with Q = 213.8, p
Global work efficiency (GWE) was significantly different in hypertension
compared to the control group (Fig. 12). There was one study in which this was
not the case and one study where the reverse was found, resulting in considerable
heterogeneity between studies. Overall a significant difference between the
groups was found. Hedges’ g was smaller for GWI comparing hypertension
to control than for GLS comparing hypertension to control (0.502
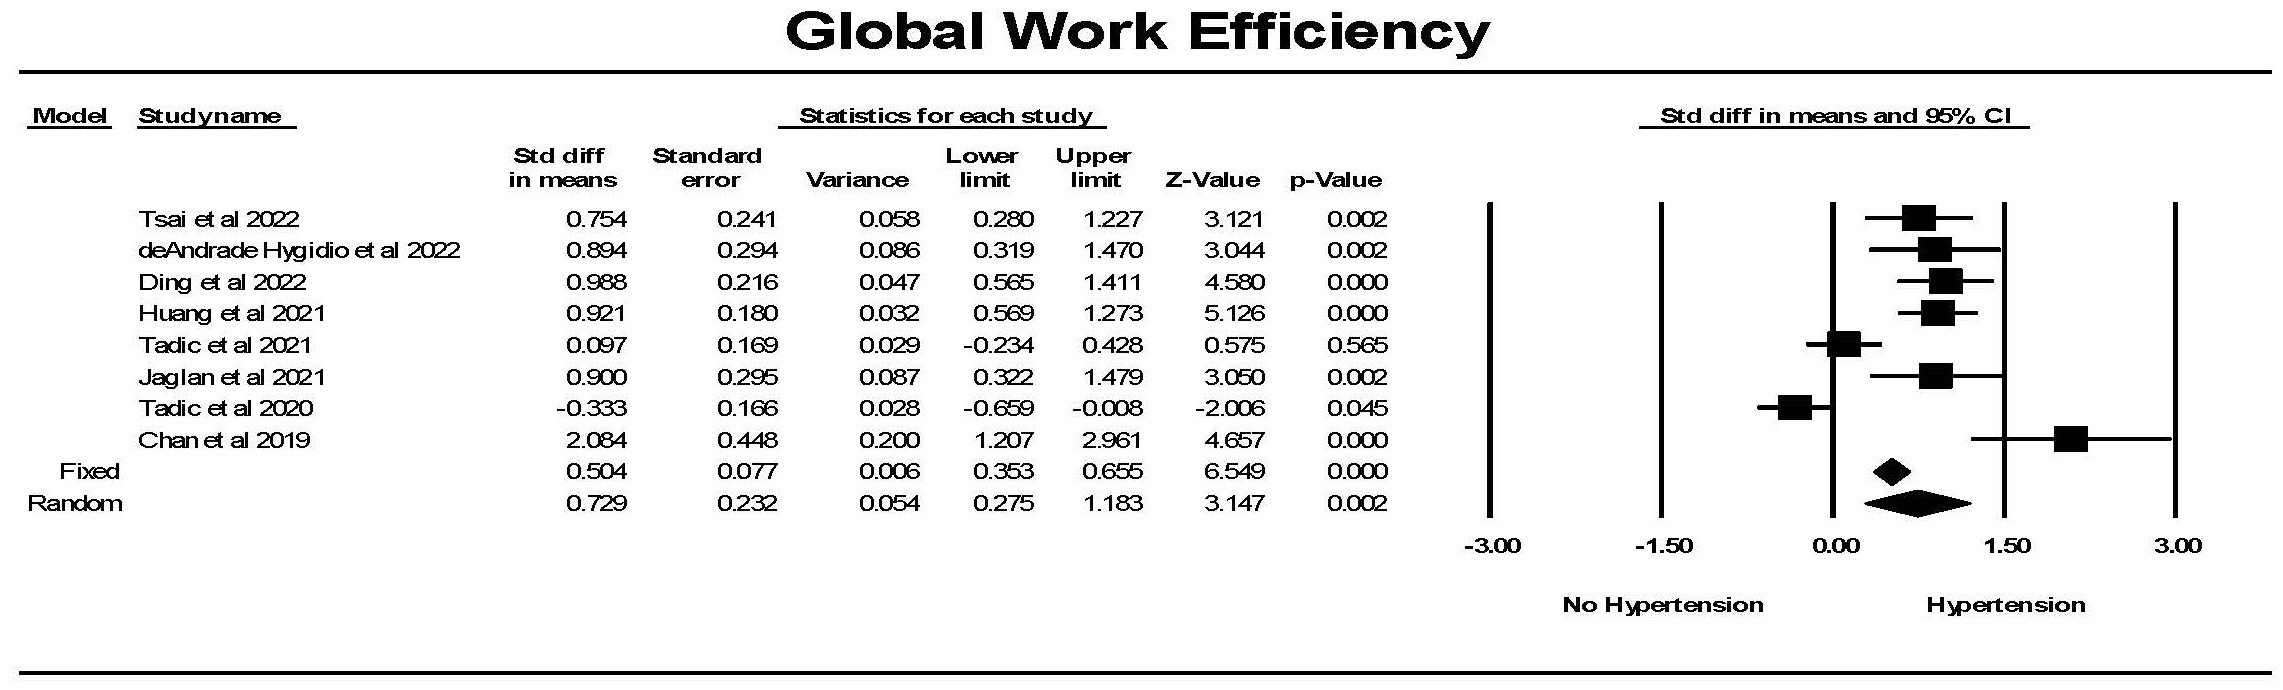 Fig. 12.
The forest plot for global work efficiency (GWE) (%) in
patients with no hypertension (Control) compared to the group with hypertension.
There was significant heterogeneity with Q = 58.7, p
For global wasted work (GWW), there was significantly less wasted work in
controls compared to hypertension (Fig. 13). Although there was significant
heterogeneity between studies but each study found a significant difference
between the groups. Hedges’ g was larger for GWW comparing hypertension
to control than for GLS comparing hypertension to control (1.472
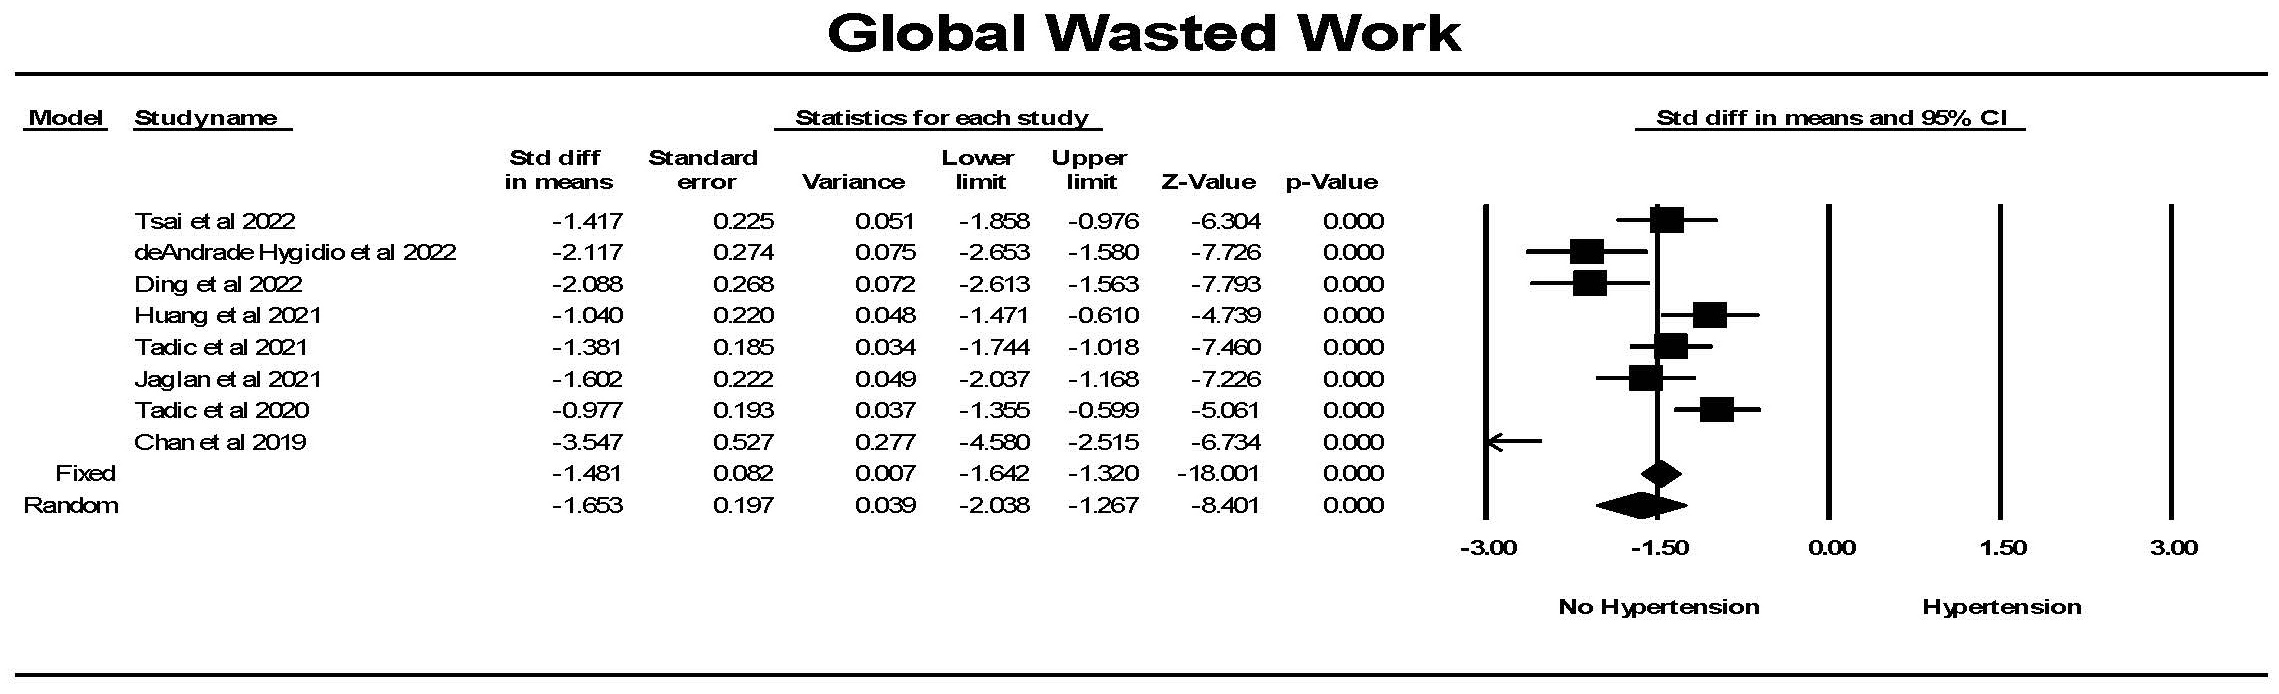 Fig. 13.
The forest plot for global wasted work index (mmHg%) (GWW) in
patients with no hypertension (Control) compared to the group with hypertension.
The arrow represents confidence interval extending beyond the scale. There was
significant heterogeneity with Q = 37.4, p
This review concluded that there was a significant reduction in GLS and GCS in hypertension while GRS was increased in hypertension. GLS and GCS were significantly related, with GCS and GRS being strongly associated while GLS and GRS were not significantly related. There was a minimal reduction in LVEF in hypertension. There was no correlation between LVEF and GLS or GCS but a significant negative relationship was noted between LVEF and GRS. The reduction in GLS in hypertension was not dependent on the presence of LVH as GLS was significantly reduced in individuals with hypertension but without LVH compared to individuals without hypertension. However, GLS was further reduced in persons with hypertension and LVH compared to those with hypertension without LVH. In contrast, there were no or minimal differences in GCS and GRS for individuals with LVH compared to those without LVH. The various aspects of myocardial work showed significant differences between persons with hypertension and individuals without hypertension.
In the hypertensive and the control populations, GLS and GCS as well as GCS and GRS were significantly related. In contrast, GLS and GRS were not significantly related. These data suggest that there is some commonality of myocardial fibers and their location within the myocardium while there are distinct differences in the nature of the strain that is being measured when one assessing GLS, GCS or GRS. Subendocardial and subepicardial layers are purported to be mainly responsible for longitudinal strain; mid-myocardial layers mainly account for circumferential strain and thickening of all fibers in all three layers is mainly responsible for radial strain [10]. The distribution and angulation of myofibers in all layers, however, contributes to each of these three kinds of strain [10].
Hypertension was associated with a reduction in GLS, i.e., the deformation from the apex to base was smaller in hypertension. The reduction in GLS is a reflection of a reduction in cardiac contractility. This finding was highly significant in the studies by Lembo et al. [22], Xu et al. [36], Sun et al. [38], Minatoguchi et al. [29], Szelenyi et al. [30], Shin et al. [35], Tadic et al. [34], Celic et al. [27], Ozkan et al. [26], Kouzu et al. [31], Imbalzano et al. [33], Galderisi et al. [32], Cappelli et al. [24] and Narayanan et al. [21]. There was a minority of studies that did not show a reduction in GLS in hypertension.
Hypertension was associated with a reduction in GCS. Because GCS evaluates the change in circumferential deformation, a smaller GCS is an indicator of a reduction in cardiac contractility. This finding was highly significant in the studies by Mordi et al. [28], Minatoguchi et al. [29], Santoro et al. [19], Celic et al. [27], and Cappelli et al. [24]. In contrast to GLS, the significant finding with GCS was present in a minority of the 17 studies.
Hypertension was associated with a greater GRS. Because GRS evaluates the change in radial deformation, a larger GRS is an indicator of a hypercontractile left ventricle in this dimension. This finding was highly significant in the studies by Minatoguchi et al. [29], Celic et al. [27], and Cappelli et al. [24]. Thus a significant abnormality was present in only a small proportion of the 14 studies with GRS data.
A major finding during this review was that the reduction in GLS in hypertension was not dependent on the presence of LVH. This finding suggests that GLS is a marker for hypertensive heart disease in the absence of LVH. In contrast, GCS and GRS were not different in patients with hypertension without LVH and individuals without hypertension. The presence of LVH is indicative of hypertensive heart disease. GLS was further reduced in persons with hypertension and LVH compared to those with hypertension without LVH. This was evident in the majority (five of eight) of studies. In contrast, there were no or minimal differences in GCS and GRS for individuals with LVH compared to those without LVH. These data support the contention that GLS is an early marker of hypertensive heart disease. Furthermore it suggests that if there were only one strain marker to measure, it would be GLS.
This study suggests the concept of a continuum in the impact of hypertension on the heart. The continuum goes from a healthy person without hypertension who has a normal GLS to a person with hypertension, who because of the hypertension, has a reduction in GLS to a person with hypertension who has a further reduction in GLS to a person with hypertension who is in heart failure. Some patients travel this continuum. Clinically, a physician would not recognize the reduction in GLS so that the measurement of GLS may be a critical method to identify the beginning of the process of decline in left ventricular function.
Examining the relationship between LVEF and global strain found that there was
no significant relationship between LVEF and either GLS or GCS but a significant
negative correlation between LVEF and GRS. In animal studies, GLS also correlates
strongly with left ventricular +dp/dt
To our knowledge, this is the first meta-analysis to evaluate myocardial work indices in hypertension compared to individuals without hypertension. Each of the four indices of myocardial work showed significant differences between patients with hypertension compared to individuals without hypertension specifically GWS, GWI and GWW were increased while GWE was reduced in hypertension.
A major limitation of the use of left ventricular ejection fraction as an indicator of cardiac muscle function is the dependence of EF on both preload and afterload as well as its relative insensitivity to identify patients with early stage heart failure [54]. Assessment of LV strain minimizes the impact of preload and myocardial work adjusts for afterload.
The increase in the global work index in hypertension has been considered to be a compensatory mechanism to preserve LV contractility and function against an increase in afterload [42]. Restating this concept, an increased work demand is required to maintain adequate contractility against an increased afterload [39].
The severity of hypertension influences the magnitude of the changes in myocardial work [41, 44]. Global myocardial work index and global constructive work were higher in resistant hypertension compared to individuals with controlled-hypertension [41, 44]. Individuals with resistant hypertension have lower global work efficiency and higher global wasted work compared to individuals with controlled hypertension [40]. The concomitant presence of diabetes mellitus accentuates the effect of hypertension on myocardial work [43].
There were not a large enough number of studies that examined global work in patients with hypertension with and without LVH to perform a similar analysis that was conducted for global myocardial strain. However, it is noteworthy that Huang et al. [42] reported that GWI and GWW were significantly increased in hypertension with and without LVH while GWE was significantly reduced in hypertension. Comparing individuals with LVH to those without LVH, GWW was significantly increased in patients with hypertension and LVH compared with those without LVH, while GWE was significantly reduced in patients with hypertension and LVH compared with those without LVH.
The nature of meta-analysis is that it is dependent on the available published literature. The strength of the conclusions is based on the validity of each study. The available data relies on mean results from each study and does not utilize individual data from all studies. Second, while strain analysis is a relatively independent factor, it is not totally independent of other factors such as age, sex and left ventricular loading conditions [10]. Furthermore, two dimensional speckle tracking echocardiography is not without its limitations [55]. The meta-analysis examined GLS, GCS and GRS did not include assessment of strain in the various specific layers of the myocardium but rather focused on the three major global strain measurements because of their relative ease in measurement and potential extrapolation to the clinical patient care. Third, it is important to recognize that there are differences in calculated LV strain between different vendors of products to measure LV strain. This is especially an issue in the measurement of GCS and GRS which may limit the consistency in the measurement of these two factors producing greater variability so as to reduce their value. However, an analysis of the literature must be all encompassing and is unable to separate vendor specific differences from other factors such as between patient differences. The kind of LV geometry such as eccentric or concentric changes in LV mass may have a significant impact on myocardial work. However, the studies did not uniformly assess LV geometry so this factor could not be included in the assessment of LV work [56]. Lastly, in most of the analyses, in this paper, there was a considerable amount of heterogeneity between studies. A high amount of heterogeneity between studies of LV strain has been found even in controls—people without hypertension or concomitant diseases, in 24 studies considering 2597 subjects [57]. The only cause for heterogeneity in that analysis was blood pressure [57].
There was considerable heterogeneity between studies in some of the analyses which likely is responsible for ambiguity in the field. The strength of meta-analysis is the ability to bring the studies together and obtain an overall (group) average (‘consensuses’).
There was a significant reduction in GLS and GCS in hypertension while GRS is increased. The reduction in GLS in hypertension was not dependent on the presence of LVH. GLS, however, was further reduced in persons with hypertension and LVH compared to those with hypertension without LVH. In contrast, there were no or minimal differences in GCS and GRS for individuals with LVH compared to those without LVH. GLS is independent of LV ejection fraction. These data support the contention that GLS is an early marker of hypertensive heart disease. Global myocardial work index (GWI) and global constructive work (GCW) were significantly greater in patients with hypertension compared to controls. Global wasted work (GWW) indicated significantly less wasted work in controls compared to hypertension. In contrast, global work efficiency (GWE) was significantly lower in hypertension compared to the control.
Sole author responsible for all phases of authorship.
Not applicable.
Not applicable.
This research received no external funding.
The authors declare no conflict of interest. Simon W. Rabkin is serving as Guest Editor of this journal. We declare that Simon W. Rabkin had no involvement in the peer review of this article and has no access to information regarding its peer review. Full responsibility for the editorial process for this article was delegated to Vincent Figueredo.
Publisher’s Note: IMR Press stays neutral with regard to jurisdictional claims in published maps and institutional affiliations.