
- Academic Editor
Catheter ablation (CA) is the first-line treatment for atrial fibrillation (AF) patients. However, the risk of recurrence associated with CA treatment should not be ignored. Therefore, the preoperative identification of patients at risk of recurrence is essential for identifying patients who will benefit from non-invasive surgery. Echocardiography, computed tomography (CT), and magnetic resonance imaging (MRI) are essential for the preoperative non-invasive prediction of AF recurrence after CA. Compared to laboratory examinations and other examination methods, these modalities can identify structural changes in the heart and assess functional variations. Accordingly, in past studies, morphological features, quantitative parameters, and imaging information of the heart, as assessed by echocardiography, CT, and MRI, have been used to predict AF recurrence after CA noninvasively. This review summarizes and discusses the current research on echocardiography, CT, MRI, and machine learning for predicting AF recurrence following CA. Recommendations for future research are also presented.
Atrial fibrillation (AF) is the most common type of sustained arrhythmia in clinical settings, with prevalence and incidence increasing over the years and posing serious survival and economic burdens [1, 2]. Catheter ablation (CA) and antiarrhythmic drugs are the primary modalities to treat AF patients [3]. With advances in the technology of CA, it has become significantly superior to antiarrhythmic drugs in maintaining sinus rhythm in patients with persistent AF and has become an effective treatment modality for patients with drug-refractory AF [4, 5]. In addition, CA has been outperformed by antiarrhythmic drugs in reducing cardiovascular death and all-cause mortality in patients with AF [6]. Therefore, CA is being increasingly recommended as first-line therapy for patients with AF.
However, it should be noted that some patients with AF have a recurrence rate of up to 30% following CA and that approximately 10% of cases of AF are not terminated following CA [7]. Moreover, complications caused by CA, such as atrioesophageal fistula and cardiac tamponade, should not be ignored [8]. Consequently, identifying patient groups at a higher risk of recurrent AF can help ensure a higher success rate after CA and avoid unnecessary risks associated with invasive procedures [2, 7]. This also helps clinicians develop appropriate treatment and prevention strategies for patients with AF and adjust the rhythm control approach after CA promptly [9].
It is well known that age, sex, hypertension, and AF type, as well as other clinical information, are high-risk factors for recurrence after CA [10, 11]. Moreover, biomarkers such as B-type natriuretic peptides and high-sensitivity C-reactive proteins are also associated with AF recurrence [12]. Notably, with advances in imaging technology, non-invasive imaging with high temporal and spatial resolution plays an increasingly important role and has a wide range of applications in assessing postoperative recurrence in patients with AF who undergo CA [13, 14, 15]. Accordingly, we herein review the current status of echocardiography, computed tomography (CT), and magnetic resonance imaging (MRI) in the non-invasive assessment of AF recurrence after CA. Finally, the progress of machine learning (ML) in predicting AF recurrence after CA will also be reviewed.
Echocardiography is the preferred modality for evaluating left atrial (LA)
structure and function because it is more convenient, cost-effective, and safer
than cardiac CT and MRI [7]. Multiple studies have identified that a larger LA
diameter [16, 17, 18, 19] and volume [7, 15, 20, 21] measured via transthoracic
echocardiography before CA are associated with a higher probability of AF
recurrence. Moreover, the LA volume index, calculated by dividing LA volume by
body surface area, including the maximum, mean, minimum, and
Epicardial adipose tissue (EAT) has been recognized as a specialized visceral adipose tissue with important biological activity and endocrine and inflammatory functions [27, 28]. Studies have reported that increased EAT thickness measured using ultrasound is significantly associated with AF recurrence after CA and that this association is mainly related to pro-inflammatory cytokine release in EAT [23, 29, 30]. Moreover, speckle tracking echocardiography (STE) is an advanced, non-invasive echocardiographic technique independent of the angle of sound waves and has great potential for clinical application [7]. Nielsen et al. [31] found that LA strain during the reservoir and contraction phases, as assessed by two-dimensional (2D) STE, is associated with an increased risk of recurrence in patients with AF treated with CA. Koca et al. [23] and Ma et al. [32] showed that decreased LA global longitudinal strain values, measured by STE, helped identify patients at high risk of AF recurrence after CA. A meta-analysis demonstrated that lower LA peak atrial longitudinal strain values, as measured by 2DSTE, were independent predictors of AF recurrence after radiofrequency ablation [33].
Furthermore, peak right atrial (RA) and LA longitudinal strains and their combined values were correlated with AF recurrence after CA in patients with chronic lung disease [34]. Liżewska-Springer et al. [35] also found that biatrial strain was the best predictor of AF recurrence after radiofrequency CA. Thus, STE is a promising tool for identifying AF recurrence following CA in clinical practice. A summary of studies using echocardiography to predict AF recurrence after CA is shown in Table 1 (Ref. [15, 16, 17, 18, 19, 20, 21, 22, 23, 24, 25, 26, 29, 30, 31, 32, 34]). Fig. 1 shows the cardiac echocardiography images.
| Author (reference) | Sample size | Risk factors | Follow-up time | Predictive performance |
| Bossard et al. [15] | 276 | Large LA volume | 12 months | - |
| Zhao et al. [16] | 485 | LA diameter, LA ejection fraction, type of AF, and systemic inflammation score | 25 |
C-statistic = 0.741, 0.750 |
| Ding et al. [17] | 263 | Increased neutrophil-to-lymphocyte ratio, high-sensitivity C-reactive protein and LA diameter | 12 months | AUC = 0.684 |
| Lee et al. [18] | 263 | Non-paroxysmal AF, larger LA diameter and female gender | 3 years | AUC = 0.747, 0.802 and 0.789 |
| Kim et al. [19] | 2352 | Type of AF, duration of AF, diabetes, LA diameter |
5 years | AUC = 0.717 |
| Li et al. [20] | 87 | Age, history of hypertension, LA maximum volume and LAA area change percentage | 6 months | - |
| Lorenzo et al. [21] | 53 | Large LA volume | 17 |
- |
| Motoc et al. [22] | 172 | LA volume index | 11.7 |
AUC = 0.68 |
| Koca et al. [23] | 190 | High LA volume index and EAT thickness, and low LA global longitudinal strain | 12 |
AUC = 0.857, 0.814 and 0.969 |
| Soga et al. [24] | 156 | ΔLA volume index | 24 months | AUC = 0.68 |
| Shono et al. [25] | 111 | LV ejection fraction and baseline Δ LA expansion index | 14.2 months | - |
| Chen et al. [26] | 67 | The time interval between the onset of early transmitral flow peak velocity and that of early diastolic mitral annular velocity increased | 12 months | - |
| Canpolat et al. [29] | 234 | Thick EAT thickness | 20 (IQR: 13, 24) months | AUC = 0.79 |
| Dereli et al. [30] | 262 | Thick EAT thickness | 6 months | - |
| Nielsen et al. [31] | 678 | LA strain during reservoir and contraction phase | 12 months | - |
| Ma et al. [32] | 115 | LA global longitudinal strain | 12 months | AUC = 0.94, 0.86 |
| Bai et al. [34] | 87 | Peak RA and LA longitudinal strain and their combined values | 32 months | C-index = 0.788, 0.759 and 0.793 |
AF, atrial fibrillation; LA, left atrial; AUC, area under the curve; IQR, inter quartile range; LAA, left atrial appendage; LV, left ventricle; EAT, epicardial adipose tissue; RA, right atrial.
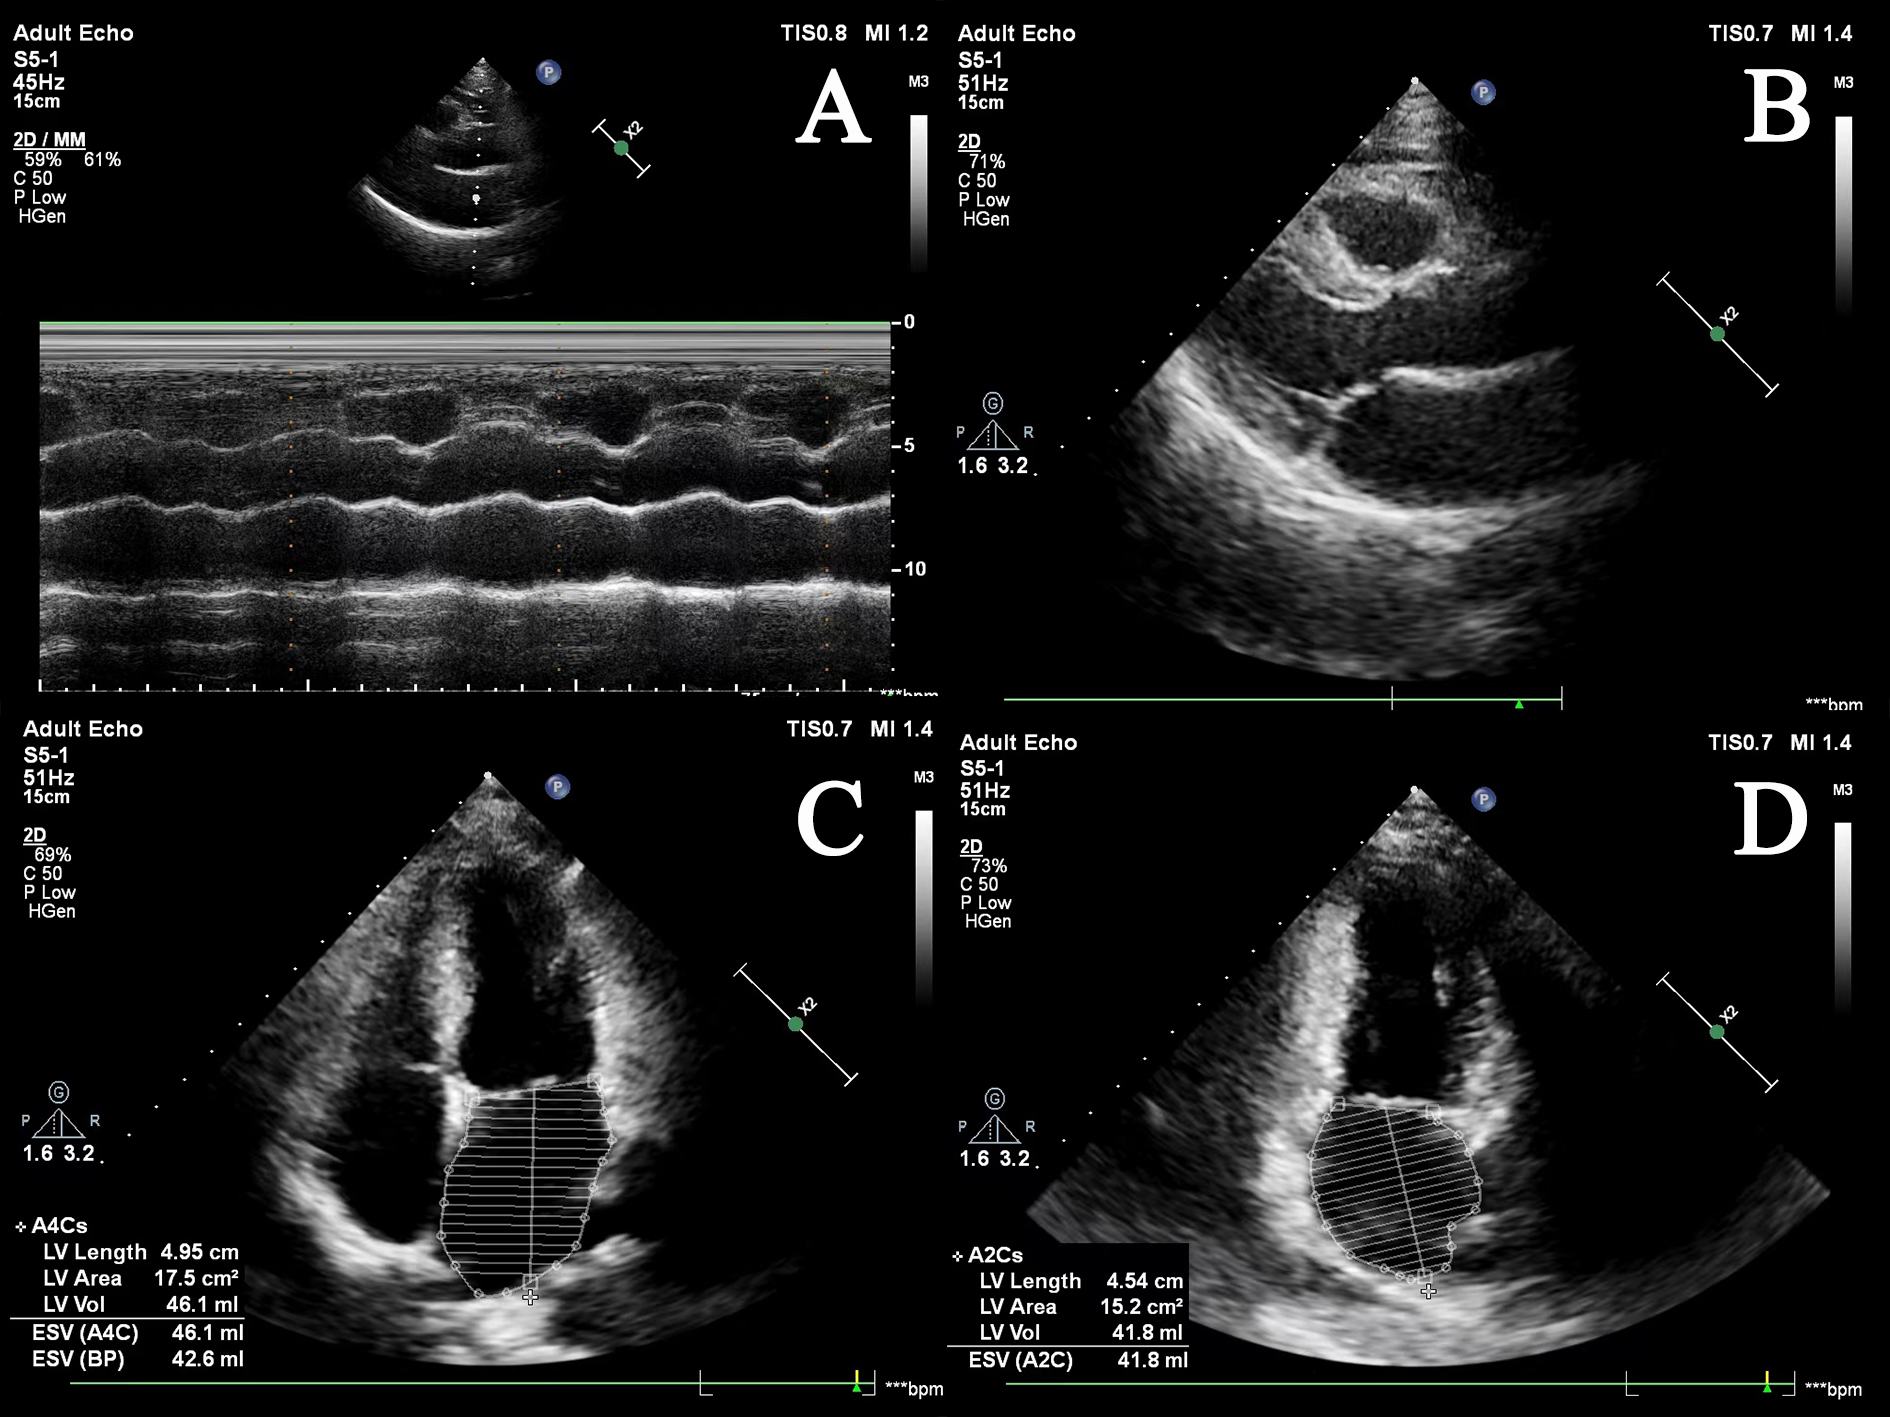 Fig. 1.
Cardiac echocardiography images of the left atrium. (A) M-mode of left atrial echocardiography; (B) B-mode of left atrial in long-axis view; (C) apical four-chamber view; (D) apical two-chamber view. ESV, end-systolic volume; LV, left ventricular; BP, blood pressure.
Although LA diameter is a commonly used parameter in AF research, it has been well demonstrated that LA volume measured by CT or MRI is superior in accuracy and confidence of measurements and prognostic ability compared to LA volume measured through other examination methods [36]. Recent studies have suggested that not only a larger LA diameter [37, 38] but also greater LA wall thickness [39], sphericity [14, 40], box surface ratio [41], volume [42, 43], and volume index [44, 45, 46, 47] and lower ejection fraction [42, 45, 48] are indicative of late postoperative AF recurrence. This may be due to the adverse remodeling of LA, which leads to AF recurrence after CA. A growing body of evidence also shows that pulmonary veins (PVs)’ morphology and orientation correlate with AF recurrence [46, 49, 50]. Moreover, cardiac enhancement CT is a non-invasive and useful method for assessing the anatomy of the LA and PV and a more precise tool to estimate the left atrial appendage (LAA) [37, 38]. Previous studies have found that a larger LAA area, volume, and lower ejection fraction, as measured by CT preoperatively, marked poor surgical outcomes and correlated with late AF reappearance in patients undergoing CA [37, 42, 43, 48, 51, 52]. More particularly, the LAA contrast defect shown on cardiac enhancement CT images preoperatively was a non-invasive predictor of AF recurrence [53, 54]. This is probably because LAA CT contrast defects result from LAA function decline, which is associated with a greater incidence of recurrence after CA [53]. Therefore, CT examination before CA is expected to be a valuable predictor of AF recurrence after CA. Fig. 2 illustrates the cardiac CT images.
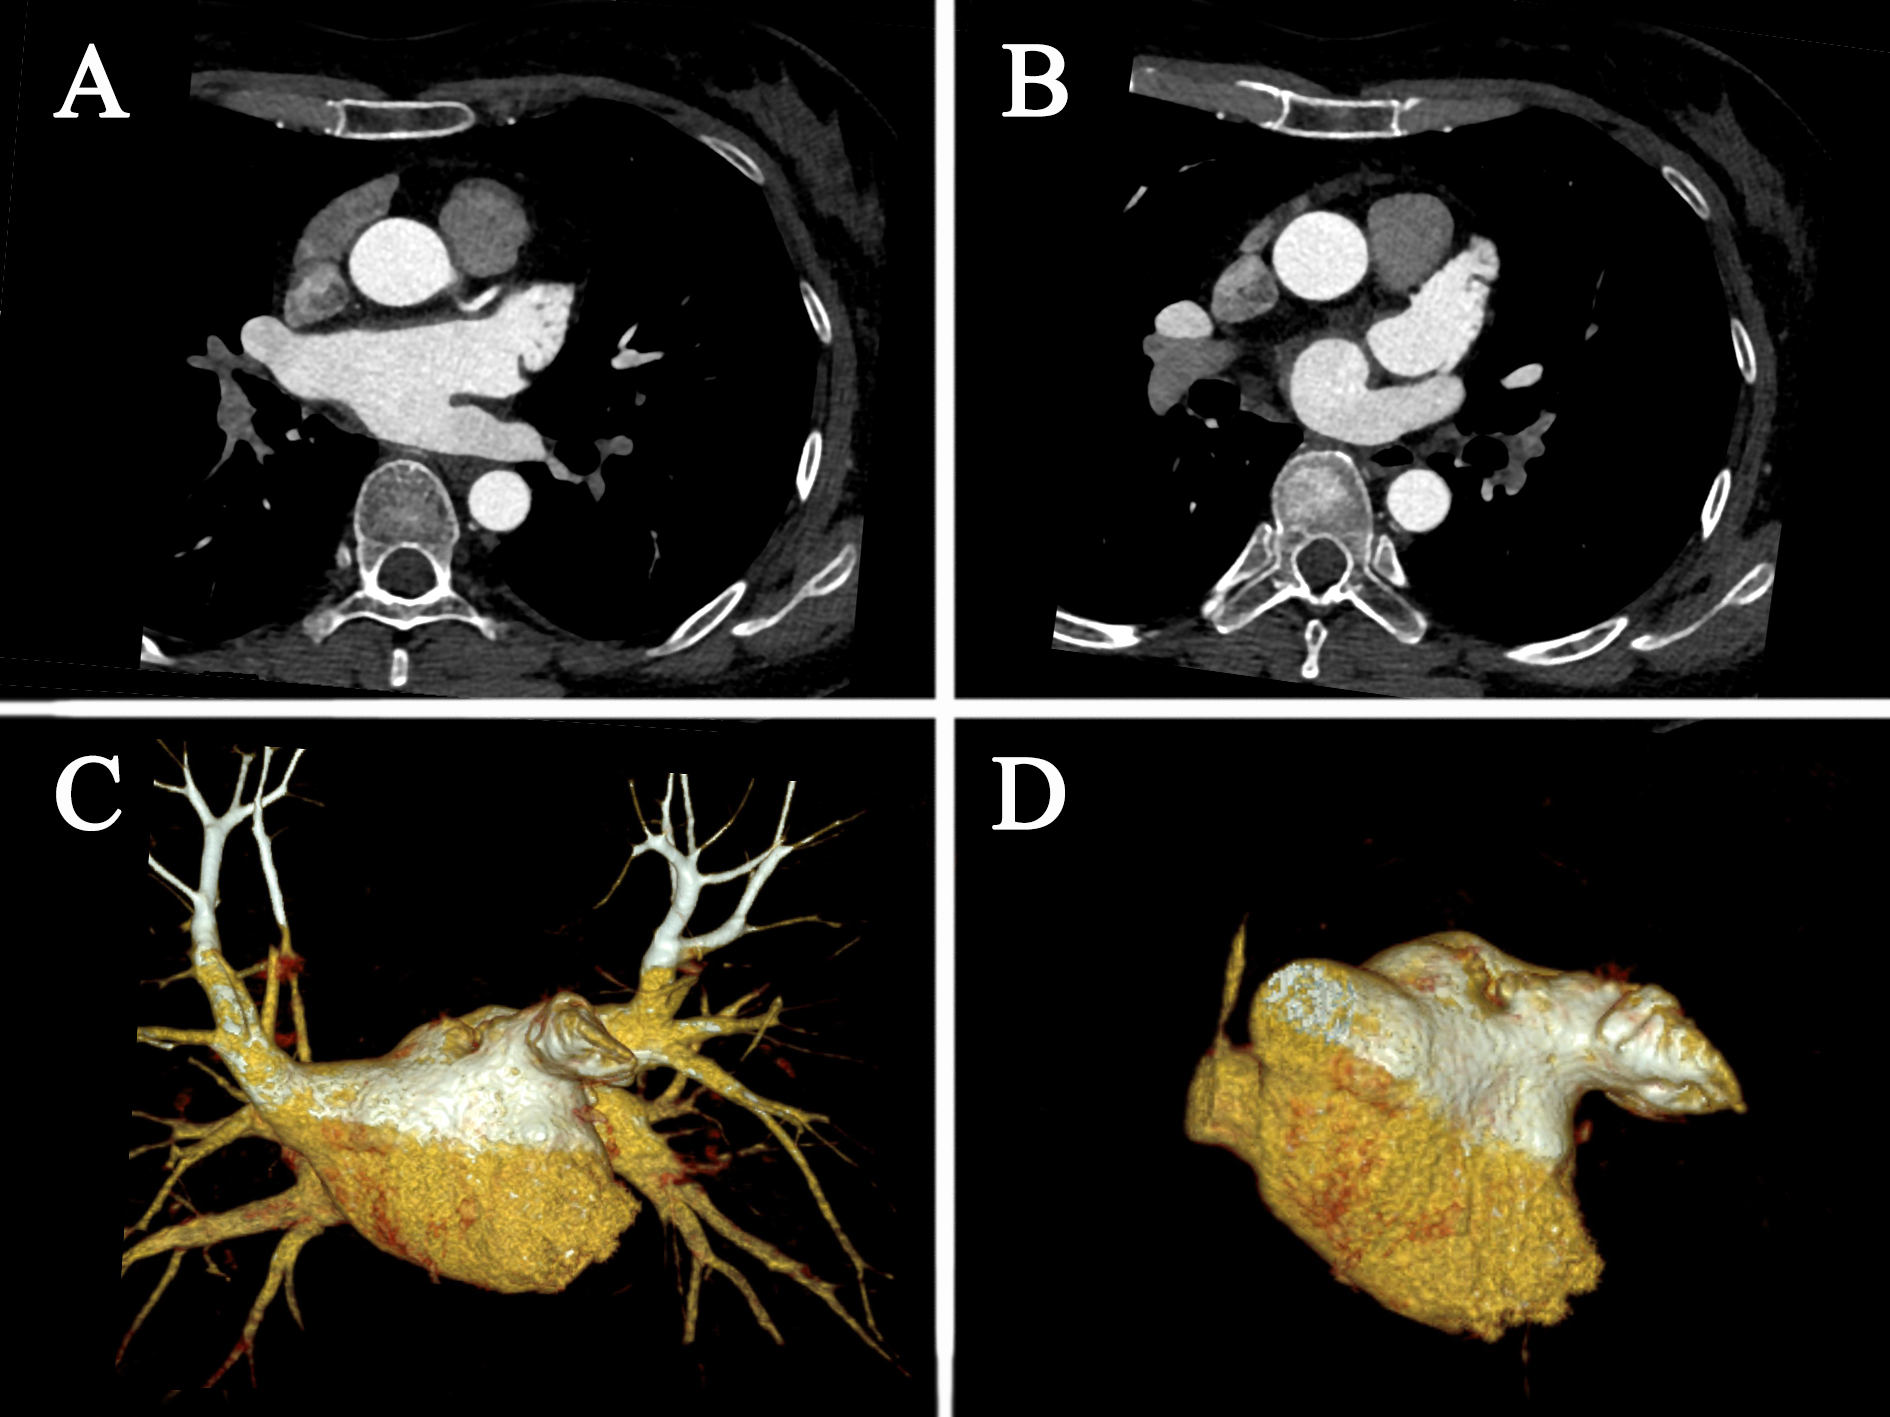 Fig. 2.
Cardiac CT images. (A) axis position; (B) axis position; (C) volume rendering; (D) volume rendering. CT, computed tomography.
Given that it shows EAT more clearly than other imaging methods, CT is increasingly employed for EAT measurements [28, 55, 56]. Except for EAT volume, its attenuation, a novel indicator that has emerged in recent years, has been demonstrated to be an independent predictor of AF recurrence after CA [56, 57, 58]. Huber et al. [28] found that the EAT of the LA measured on cardiac enhancement CT images was independently associated with AF recurrence after CA. Recent meta-analyses have also reported that patients with AF recurrence after CA had larger EAT volumes than those who did not experience recurrence [55]. Ciuffo et al. [58] showed that the quality of peri-LA adipose tissue measured using CT attenuation was associated with recurrence after initial CA in patients with paroxysmal or persistent AF. Similarly, Beyer et al. [56] discovered that a higher EAT volume and lower attenuation observed on CT angiography before CA predicted AF recurrence after CA. The detection of AF recurrence by EAT was probably attributed to the sympathetic imbalance associated with AF recurrence, while cholinergic activity promoted inflammation and lipid accumulation in the EAT secretome and epicardial stromal microenvironment [59]. Few studies have also observed that interatrial septum fat volume [60], pericardial fat volume [61], and pericoronary adipose tissue attenuation [62] are linked to an increased risk of AF recurrence, which warrants further clinical investigation. Studies that used CT to predict recurrence following CA in patients with AF are summarized in Table 2 (Ref. [14, 28, 37, 38, 39, 40, 41, 42, 43, 44, 45, 46, 47, 48, 49, 50, 53, 54, 56, 58, 60, 61, 62]). Fig. 3 shows the measurement of EAT on CT images.
| Author (reference) | Sample size | Risk factors | Follow-up time | Predictive performance |
| Bisbal et al. [14] | 243 | LA sphericity | 12 months | AUC = 0.687 |
| Huber et al. [28] | 212 | LA enhancing EAT | 12 months | - |
| Du et al. [37] | 108 | LAA volume |
12 months | AUC = 0.733 |
| Kocyigit et al. [38] | 359 | LA diameter and cauliflower-type LAA morphology | 37 months | - |
| Nakatani et al. [39] | 213 | Thick and heterogeneous LA wall | 12 months | - |
| Moon et al. [40] | 148 | LA sphericity | 12 months | AUC = 0.772 |
| Keçe et al. [41] | 70 | Small box lesion surface area as a ratio of total LA surface area | 13 (IQR: 10, 17) months | - |
| Tian et al. [42] | 83 | LAA ejection fraction and volume | 19 (range 4–24) months | AUC = 0.817, 0.82 |
| Straube et al. [43] | 1103 | LA volume and LAA volume | 19 months | AUC = 0.63, 0.59 |
| Strisciuglio et al. [44] | 352 | LA volume index | 19 (IQR: 12, 24) months | - |
| Oka et al. [45] | 292 | LA ejection fraction, and indexed maximum and minimum LA volume | 3 years | AUC = 0.666, 0.564, 0.611 (single procedure); 0.701, 0.616, 0.616 (multiple procedures) |
| Istratoaie et al. [46] | 80 | Large LA volume index and variant PV anatomy | 14 (IQR: 12, 15) months | AUC = 0.713 |
| Maier et al. [47] | 415 | LA volume index, BMI and type of AF | 53 (IQR: 34.5, 73) months | AUC = 0.647 |
| Kaufmann et al. [48] | 50 | Ejection fraction of LA and LAA | 229 days | AUC = 0.94, 0.96 |
| Mamchur et al. [49] | 230 | Large diameters and ovality of the left superior PV | 14 (IQR: 12, 24) months | - |
| Li et al. [50] | 97 | Major diameter and cross-sectional area of right inferior pulmonary vein | 12 months | AUC = 0.665, 0.659 |
| C-index = 0.766, 0.758 | ||||
| Nakamura et al. [53] | 283 | LAA CT contrast defect | 858 days | - |
| Kawaji et al. [54] | 1019 | Severe filling defect in LAA in contrast CT | 4.4 |
- |
| Beyer et al. [56] | 732 | LA wall thickness, EAT volume and EAT attenuation | 12 months | AUC = 0.649 |
| Ciuffo et al. [58] | 143 | LA fat attenuation | 12 months | - |
| Samanta et al. [60] | 55 | Interatrial septal fat volume, LA volume index, EAT volume and LA low-voltage area | 11 |
- |
| Goldenberg et al. [61] | 130 | EAT volume and pericardial fat volume | 19.5 |
- |
| Nogami et al. [62] | 364 | Pericoronary adipose tissue attenuation and EAT volume | 26 (IQR: 19, 42) months | AUC = 0.726 |
CT, computed tomography; AF, atrial fibrillation; LA, left atrial; BMI, body mass index; EAT, epicardial adipose tissue; AUC, area under the curve; IQR, inter quartile range; LAA, left atrial appendage; PV, pulmonary vein.
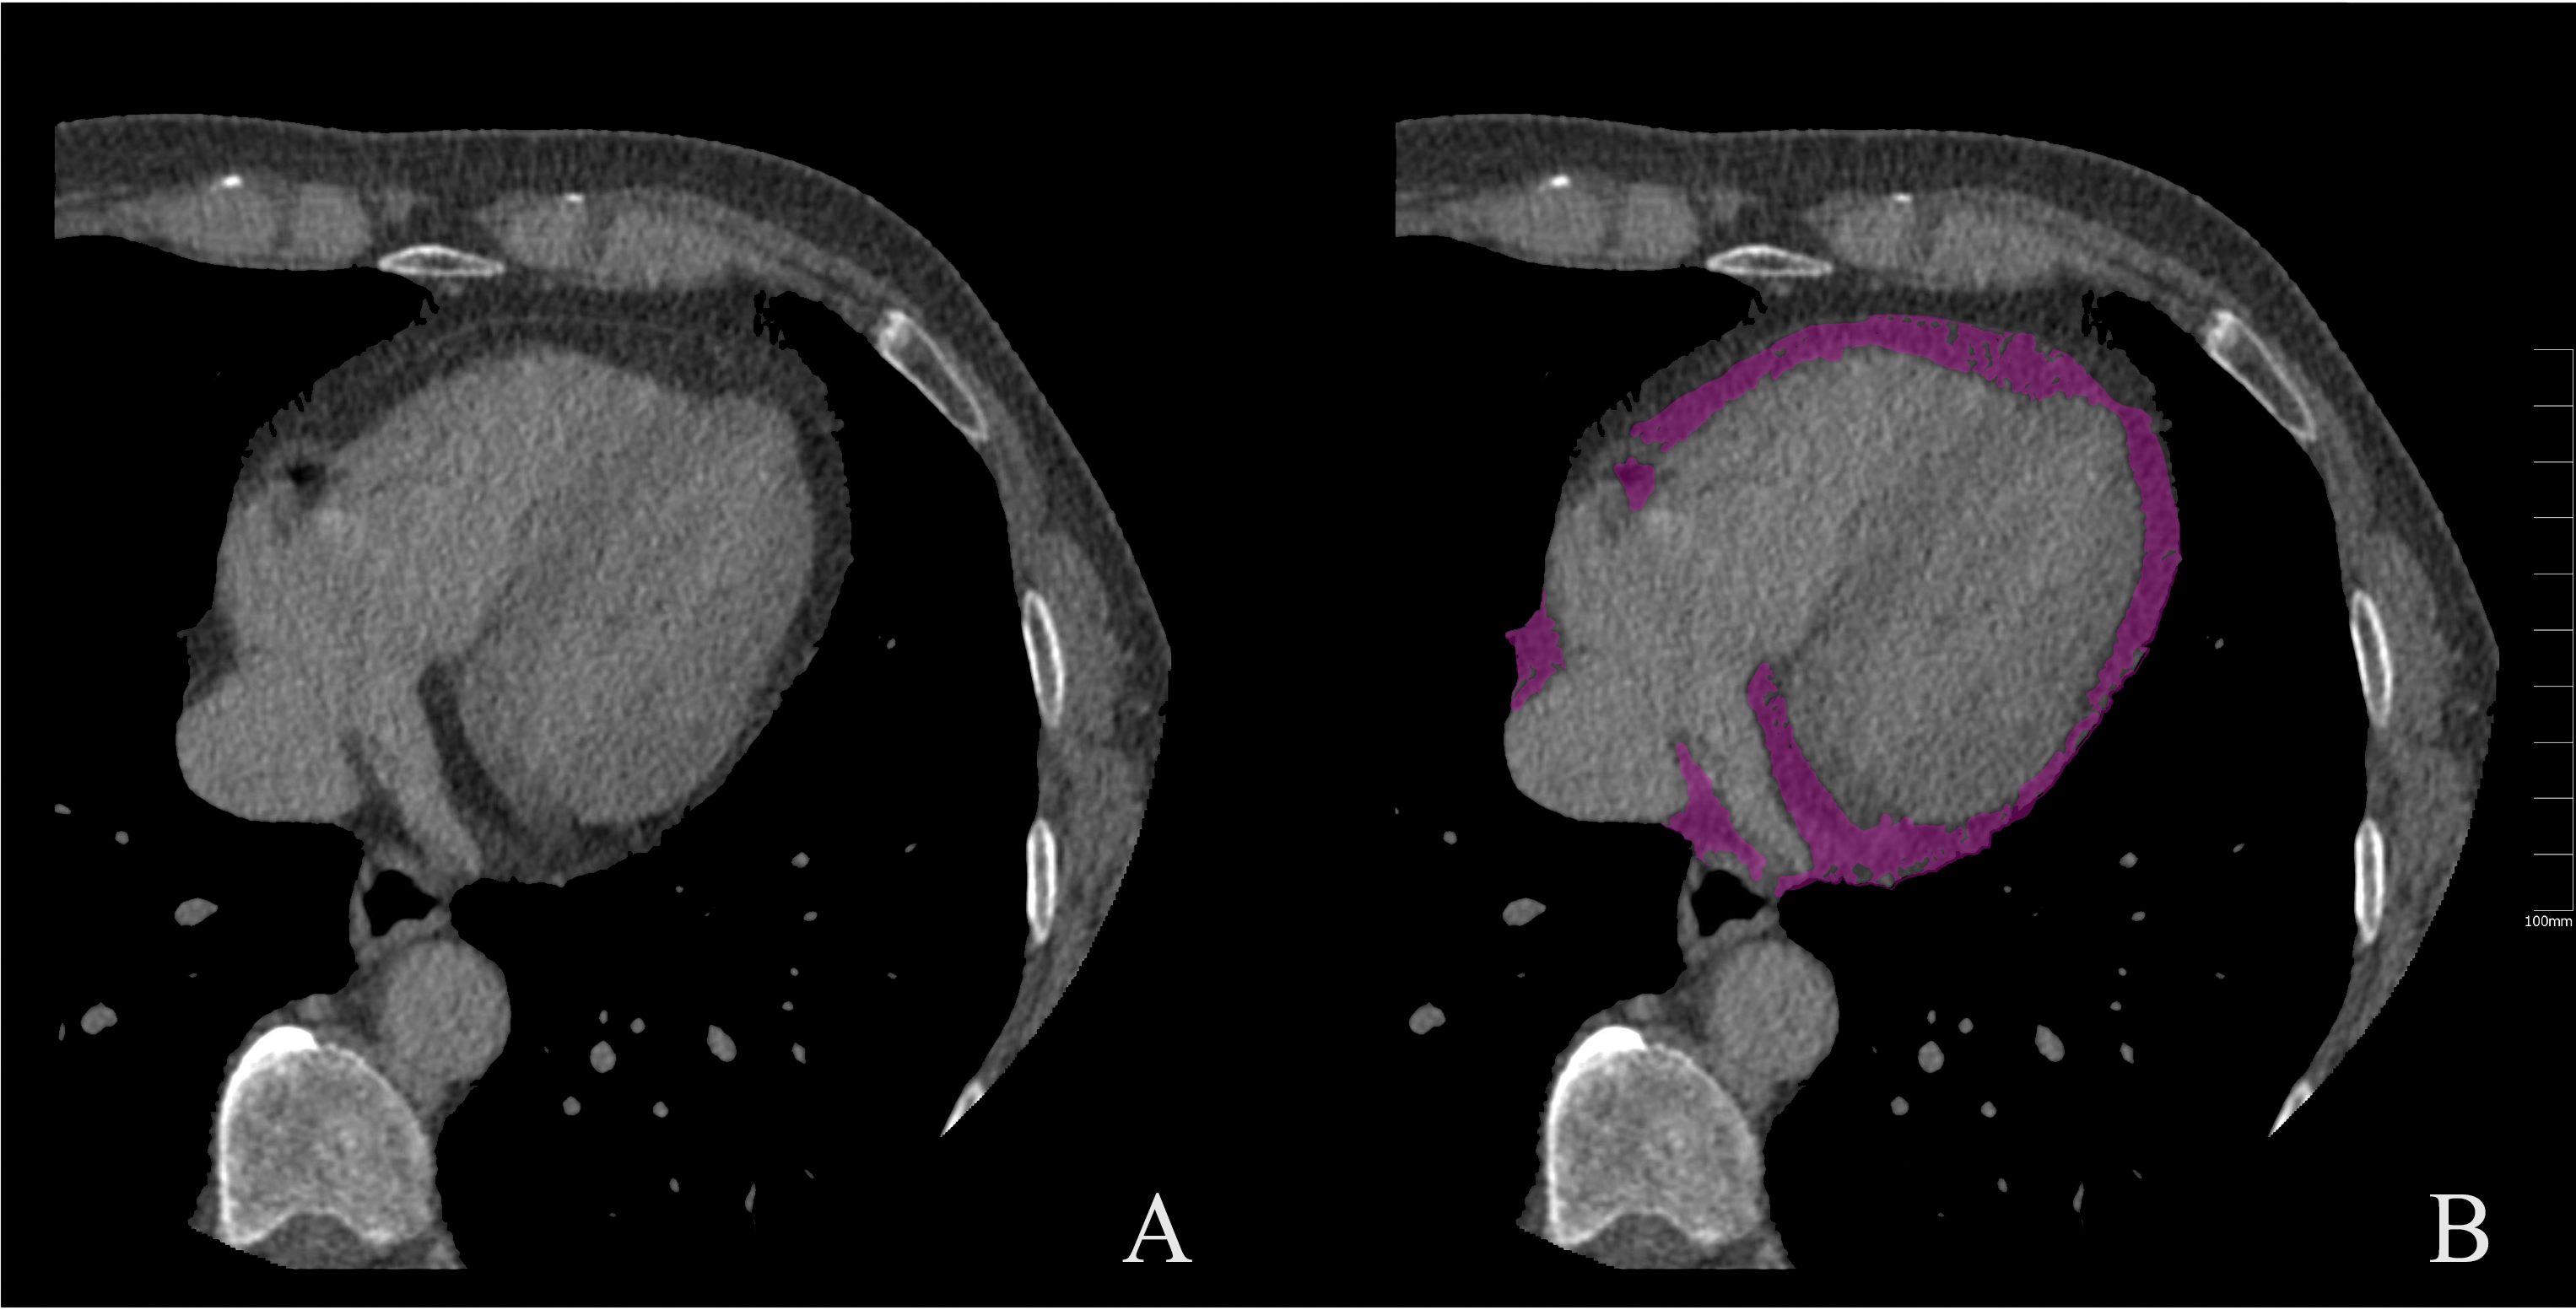 Fig. 3.
Measurement of EAT on CT images. (A) unenhanced CT image; (B) measurement of EAT (purple). CT, computed tomography; EAT, epicardial adipose tissue.
Cardiovascular MRI can assess both LA structure and function in a single examination, thereby serving as an early indicator of AF recurrence [63, 64]. den Uijl et al. [64] demonstrated that LA volume, as determined by preoperative cardiovascular MRI, is a powerful predictor of AF recurrence after CA. Further studies have shown that, in addition to LA volume, RA volume and biatrial volume quantified by MRI can also predict AF recurrence after CA [65]. Alternatively, LA shape has been found to provide prognostic information for CA treatment [14, 66]. Bieging et al. [66] revealed that LA shapes, such as rounder, shorter, and more laterally rotated appendages, were associated with recurrence at postoperative follow-up of patients with AF undergoing CA. In a real-world study, LA sphericity measured using preoperative cardiovascular CT or MRI was the strongest predictor of AF ablation outcomes in patients with AF [14]. In contrast, Varela et al. [67] showed that LA vertical asymmetry is a new preoperative MRI index for differentiating patients with AF recurrence from those without. Moreover, an increasing number of studies have found impaired LA function parameters obtained by cardiovascular MRI, including decreased booster pump [63], reservoir strain [68], expansion index [68], emptying fraction [69], and ejection fraction [70], to be independently related to AF recurrence following CA therapy.
LA fibrosis was also evaluated on MRI late gadolinium-enhanced images, which performed well in predicting the risk of recurrence following CA in patients with AF [13, 70, 71, 72]. Nevertheless, a recent study suggested no difference in LA and RA fibrosis between patients with and without AF recurrence [73]. Caixal et al. [74] further probed and found that the extent of LA fibrosis, especially near the descending aorta, was more predictive of the late recurrence of AF post-CA than was LA. Previously, Suksaranjit et al. [75] also reported that the higher the degree of structural remodeling of LAA in patients with AF with gadolinium enhancement quantification, the higher the risk of recurrence following CA. These findings may provide novel therapeutic targets in clinical settings. A controversial issue is whether LV fibrosis determined by MRI extracellular volume fraction measurements before CA is associated with AF recurrence [76, 77]. Gunasekaran et al. [76] discovered that LV extracellular volume fraction was irrelevant to AF recurrence following CA, whereas Li et al. [77] found that LV extracellular volume fraction predicted AF recurrence following CA. Further investigations are warranted to determine the importance of extracellular volume fraction in AF recurrence. Additionally, intra-atrial dyssynchrony during sinus rhythm [78] and total relative gap length in the ablation line [79] evaluated via MRI was also proven to be risk factors for AF recurrence in patients following CA. Accordingly, the preoperative MRI of patients with AF may be useful for the early identification of CA recurrence. A summary of studies that used MRI to predict recurrence after CA in patients with AF is presented in Table 3 (Ref. [13, 14, 63, 64, 65, 66, 67, 68, 69, 70, 72, 74, 75, 77, 78, 79]). Fig. 4 demonstrates the cardiac MRI images.
| Author (reference) | Sample size | Risk factors | Follow-up time | Predictive performance |
| Chelu et al. [13] | 308 | LA fibrosis | 5 years | - |
| Bisbal et al. [14] | 243 | LA sphericity | 12 months | AUC = 0.687 |
| Gastl et al. [63] | 52 | Impaired LA booster pump function | 12 months | AUC = 0.73 |
| den Uijl et al. [64] | 83 | Large LA volume | 12 months | AUC = 0.680 |
| Kumagai et al. [65] | 100 | Large LA volume, RA volume and biatrial volume | 8 months | AUC = 0.73, 0.78 and 0.79 |
| Bieging et al. [66] | 254 | More round LA shape with a shorter, more laterally rotated appendage | 475 days | C-statistic = 0.72 |
| Varela et al. [67] | 144 | LA sphericity, LA vertical asymmetry | 12, 24 months | AUC = 0.68, 0.65 (12 months); 0.63, 0.63 (24 months) |
| Benjamin et al. [68] | 80 | Large minimum LA volume, and low LA reservoir strain and expansion index | 12 months | - |
| Habibi et al. [69] | 51 | Low LA emptying fraction | 12 months | - |
| Chubb et al. [70] | 89 | Low LA and LV ejection fraction, and LA fibrosis | 24 months | AUC = 0.646, 0.639 and 0.661 (150 days postprocedure) |
| Csécs et al. [72] | 55 | LA fibrosis | 12 months | AUC = 0.768 |
| Caixal et al. [74] | 108 | LA fibrosis especially near the descending aorta | 12 months | AUC = 0.65 |
| Suksaranjit et al. [75] | 74 | LAA structural remodeling | 18 months | - |
| Li et al. [77] | 130 | LV extracellular volume fraction expansion | 13 (IQR: 12, 16) months | - |
| Ciuffo et al. [78] | 208 | Intra-atrial dyssynchrony during sinus rhythm | 20 |
C-statistics = 0.77 |
| Linhart et al. [79] | 94 | Total relative gap length in the ablation line | 15 |
- |
MRI, magnetic resonance imaging; AF, atrial fibrillation; LA, left atrial; RA, right atrial; LV, Left ventricle; AUC, area under the curve; LAA, left atrial appendage; IQR, inter quartile range.
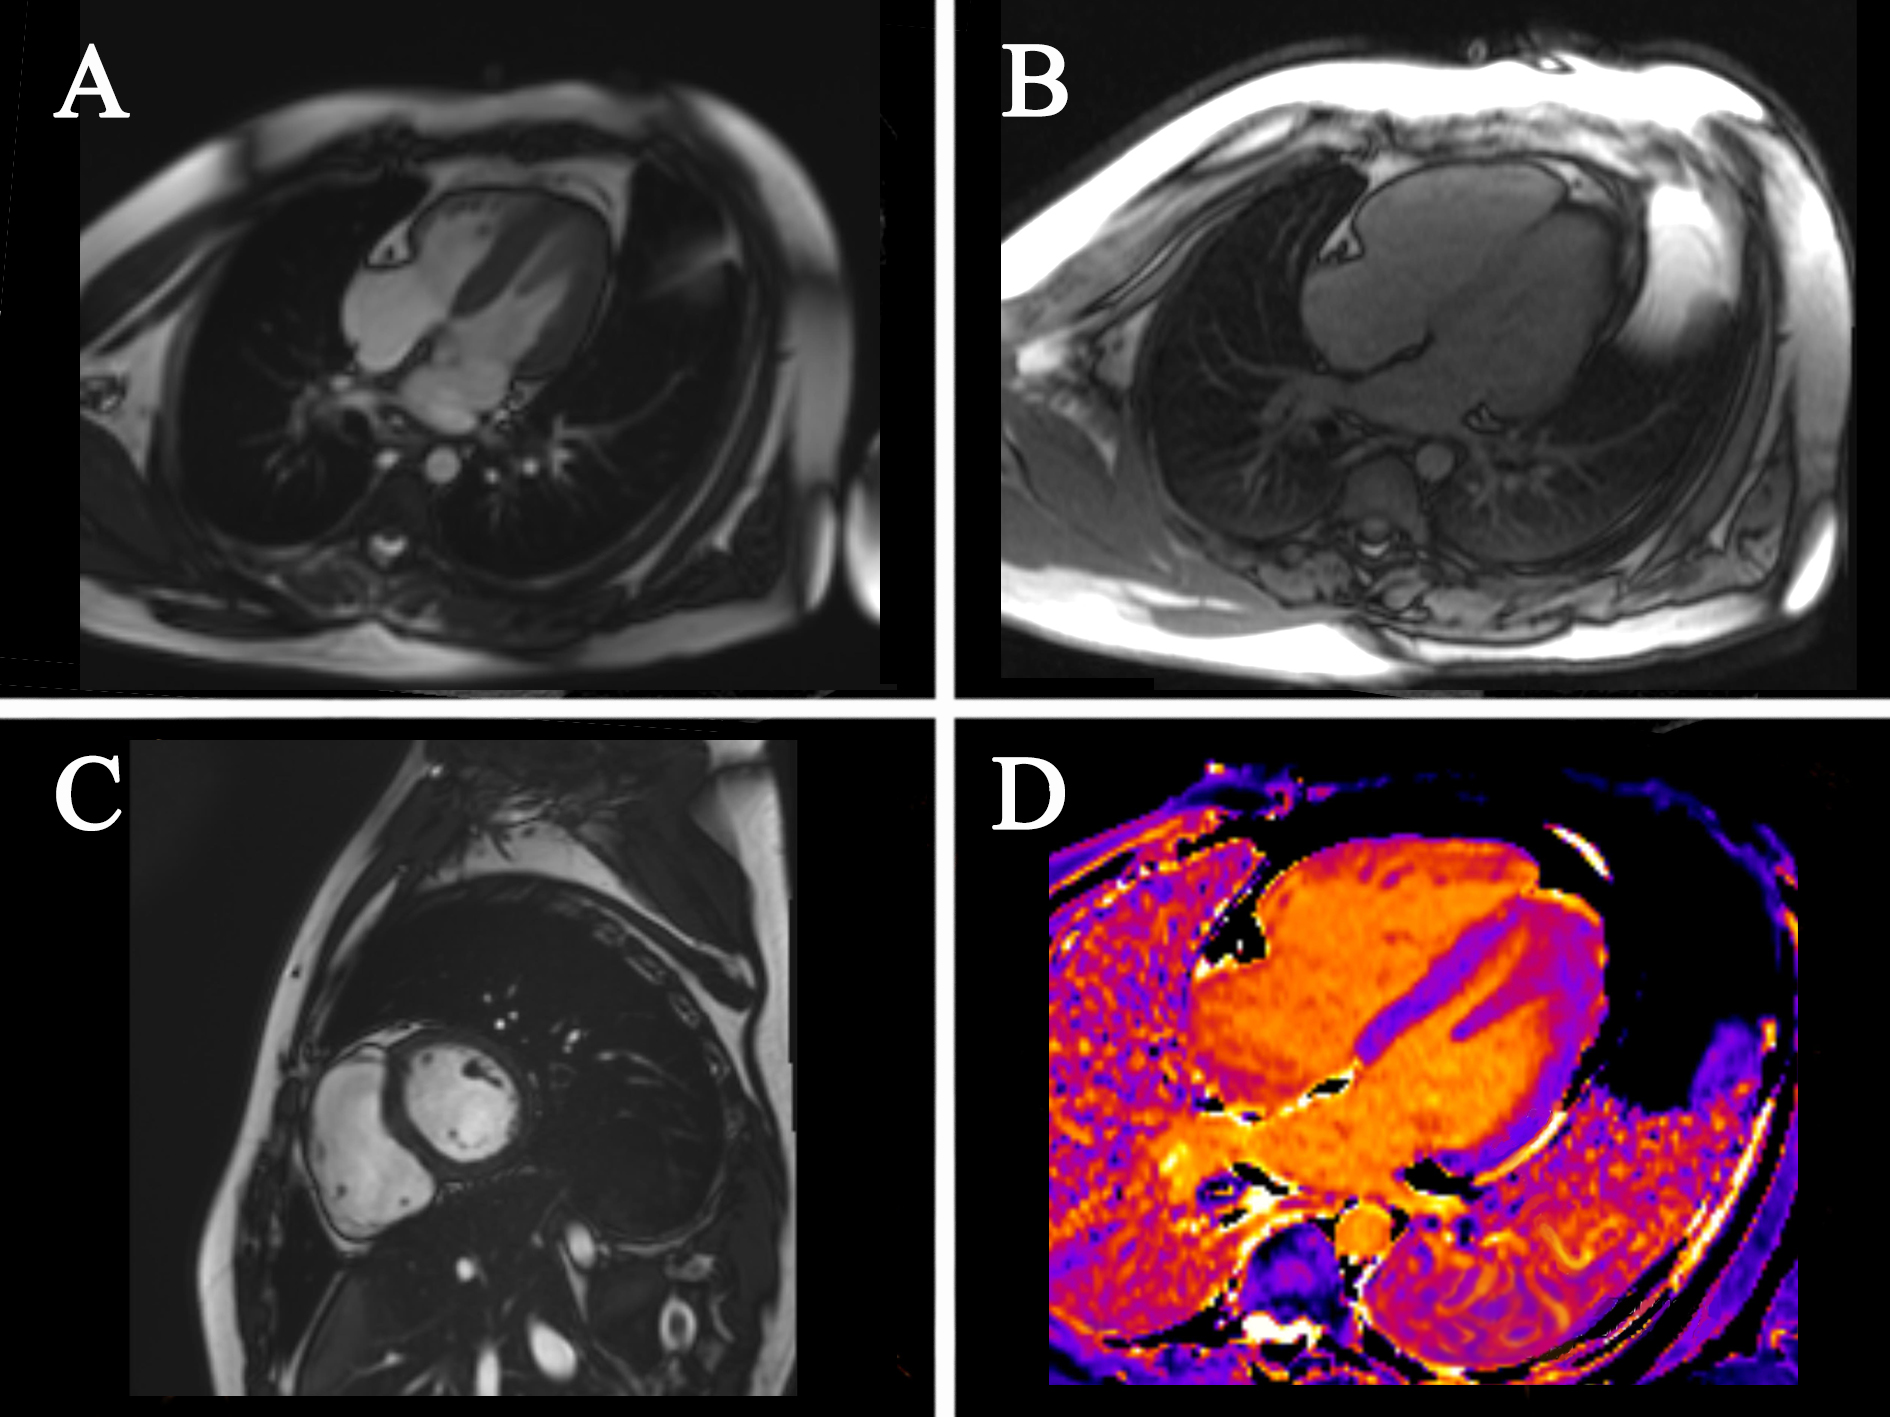 Fig. 4.
Cardiac MRI images. (A) four-chamber cardiac images; (B) four-chamber cardiac images; (C) cardiac short-axis images; (D) T1 mapping. MRI, magnetic resonance imaging.
ML based on medical imaging is not limited by the maximum limit of grayscale that the human eye can observe, thus observing lesion features that cannot be recognized by the naked eye and providing more information for disease assessment [80, 81]. ML is widely used in the diagnosis, differential diagnosis, and prognosis evaluation of various diseases and plays an increasingly important role in assessing AF recurrence [82, 83, 84]. As mentioned above, EAT is closely related to AF recurrence [27, 28]. It has been demonstrated that the assessment of EAT based on CT radiomics is a more promising tool for predicting AF recurrence than EAT volume and attenuation [85]. Yang et al. [86] discovered that the radiomic signatures of EAT based on CT image extraction were associated with recurrence within 1 year after CA in patients with AF and that the area under the curve values of their constructed prediction models were 0.808 and 0.793, respectively. In addition, Ilyushenkova et al. [85] found that EAT-based normalized gray-level nonuniformity strongly predicted late postoperative CA in patients with lone AF compared to other risk factors.
Furthermore, ML research has increasingly been applied to identify AF recurrence by LA and PVs in CT images [83, 84]. Chen et al. [84] constructed a model to measure LA volume using a deep learning approach, which allowed the prediction of AF recurrence 1 and 2 years after CA. Atta-Fosu et al. [87] used CT angiography and applied ML algorithms to identify LA shape features, showing that shape differences in the area around the LA and PVs were associated with the late recurrence of AF. Furthermore, Labarbera et al. [88] and Firouznia et al. [83] reported that not only LA morphology but also alterations in PVs could be novel imaging markers for patients with AF recurrence after CA; therefore, they used ML to extract the radiomic features of LA and PVs, respectively, and demonstrated that they could be good predictors for AF recurrence. It is worth noting that MRI-based ML will strengthen the identification of LA fibrosis by late gadolinium-enhanced MRI, thus improving the predictive ability for AF recurrence [89, 90]. Moreover, deep learning-based LA-curved M-mode speckle tracking also provides a novel method to predict AF recurrence following CA [91]. Therefore, following extensive studies, ML in non-invasive imaging is expected to be a superior imaging biomarker in the future, improving the early detection and prevention of recurrence in patients with AF undergoing imaging evaluation. The findings of studies using ML to predict recurrence following CA in patients with AF are summarized in Table 4 (Ref. [83, 84, 85, 86, 87, 88, 89, 91]).
| Author (reference) | Sample size | Methods | Risk factors | Follow-up time | Predictive performance |
| Firouznia et al. [83] | 203 | CT-ML | Morphological and texture variation of the LA and PV | - | AUC = 0.70, 0.78 |
| Chen et al. [84] | 58 | CT-deep convolutional neural networks | LA volume and LA volumes normalized by the body surface area | 12 and 24 months | AUC = 0.742, 0.736; 0.696, 0.684 |
| Ilyushenkova et al. [85] | 63 | CT-rediomics | EAT-gray level nonuniformity normalized | 12 months | AUC = 0.809 |
| Yang et al. [86] | 314 | CT-ML | LA-EAT radiomic signatures and volume | 12 months | AUC = 0.915, 0.808 (training); 0.853, 0.793 (validation) |
| Atta-Fosu et al. [87] | 68 | CT-ML | Shape features of the LA and areas around the PV | 12 months | AUC = 0.67 |
| Labarbera et al. [88] | 150 | CT-rediomics | Greate right carina angle, reduced anterior-posterior atrial diameter, greater atrial volume normalized to height, and steeper right inferior pulmonary vein angle. | 12 months | AUC = 0.68 |
| Shade et al. [89] | 32 | MRI-ML | LA | 366 (IQR: 365, 467) days | AUC = 0.82 |
| Hwang et al. [91] | 606 | Curved M-mode speckle-tracking images-deep convolutional neural network | LA | - | AUC |
ML, machine learning; CT, computed tomography; MRI, magnetic resonance imaging; AF, atrial fibrillation; LA, left atrial; PV, pulmonary vein; AUC, area under the curve; EAT, epicardial adipose tissue; IQR, inter quartile range.
Preoperative imaging for the non-invasive prediction of AF recurrence following CA has demonstrated encouraging results, as the value of imaging for the assessment of structural and functional changes in the hearts of patients with AF is superior to that of clinical and laboratory tests. Moreover, imaging can provide incremental value in predicting recurrence following CA in patients with AF through the evaluation of LA fibrosis and EAT. However, there are some limitations to assessing the efficacy of CA in patients with AF using imaging modalities. First, although studies have found that larger LA diameter and volume and lower ejection fraction are independent risk factors for AF recurrence after CA, there is a lack of consensus on this “greater and lesser” phenomenon owing to individual and racial differences [16, 21]. Furthermore, the anatomy of the LA and PVs is complicated, rendering manual measurement and profiling more time-consuming [87]. There is also often interobserver variability in the morphological assessment of LA, LAA, and PVs, which would lead to different predictive outcomes pertaining to recurrence following CA. Second, while LA fibrosis estimated on MRI gadolinium-enhanced images shows promising performance in predicting the risk of recurrence after CA in patients with AF, it should only be performed in patients for whom MRI gadolinium-enhanced images of sufficient quality can be acquired to quantify fibrosis. Furthermore, compared with conventional LV-MRI gadolinium enhancement, LA-MRI gadolinium enhancement requires high spatial resolution, patient-specific scan parameters, and strict contrast dosing [13]. Finally, evaluating EAT opens a novel window for the non-invasive prediction of recurrence after CA in patients with AF; however, the manual segmentation of EAT is time-consuming and challenging. The normal range of reference values for EAT in clinical settings remains unknown.
Future studies with larger sample sizes and more centers are needed to determine a range of reference values for LA and EAT. Moreover, appropriate LA-MRI gadolinium enhancement scan parameters should be established through technical exploration. With the development of artificial intelligence, ML based on medical images can not only discover imaging features that cannot be recognized by the naked eye but also fully realize the automatic segmentation of LA, PVs, and EAT quickly and effectively, immensely improving the efficiency and accuracy of the physician’s assessment, and therefore showing potential for clinical application as a non-invasive method for the prediction of AF recurrence following CA. However, current studies on medical imaging-based ML for AF recurrence are scarce and have small sample sizes; thus, further research is warranted.
Furthermore, preoperative imaging for safety and efficacy assessment of AF ablation is a direction worth exploring but remains controversial. Di Cori et al. [92] showed that preprocedural CT does not improve the safety and efficacy of AF ablation but rather significantly increases the cumulative radiological exposure. Teres et al. [93] found that personalized AF ablation with a customized ablation index based on CT-measured LA wall thickness was feasible, effective, and safe. Marrouche et al. [94] demonstrated that using MRI-guided fibrosis ablation for persistent AF did not significantly reduce the recurrence rate.
In summary, echocardiography, CT, and MRI are meaningful in predicting recurrence after CA in patients with AF and can assist cardiologists in clinical decision-making and improve the long-term prognosis of patients with AF. Medical imaging-based ML may have the potential for clinical application, but large, multicenter, prospective studies are needed to confirm its value in assessing AF recurrence. With ongoing progress in imaging technology and artificial intelligence, imaging is expected to accurately identify patient groups at a higher risk of recurrent AF preoperatively, thus avoiding unnecessary risks associated with non-invasive surgery.
AF, atrial fibrillation; CA, catheter ablation; CT, computed tomography; MRI, magnetic resonance imaging; ML, machine learning; LA, left atrial; LV, left ventricular; E/e’, the ratio of mitral inflow velocity to mitral annular tissue velocity; EAT, epicardial adipose tissue; STE, speckle tracking echocardiography; 2D, two-dimensional; RA, right atrial; PVs, pulmonary veins; LAA, left atrial appendage.
Data curation—MJ, HX, YZ, DL and JZ. Writing-original draft—MJ, JZ, DL, YZ and HX. All authors have read and agreed to the published version of the manuscript. All authors have participated sufficiently in the work and agreed to be accountable for all aspects of the work.
Not applicable.
We would like to thank Editage (https://www.editage.cn/) for English language editing.
This work was supported by the National Natural Science Foundation of China [grant number 82071872].
The authors declare no conflict of interest.
Publisher’s Note: IMR Press stays neutral with regard to jurisdictional claims in published maps and institutional affiliations.