
- Academic Editor
Background: Pulse pressure variation (PPV) is based on heart-lung
interaction and its association with the imbalance between pulmonary and systemic
blood flow (Qp:Qs) has been understudied. We hypothesized that (1) baseline PPV
(after induction of anesthesia) is different in a mixed congenital heart disease
population with different Qp:Qs, (2) baseline PPV is different between a pooled
group with high Qp:Qs and one with low Qp:Qs, and (3) a systemic-pulmonary shunt
procedure results in reduced PPV compared to baseline. Methods: We
retrospectively reviewed the medical charts of children who presented to the
operating room for cardiac surgery between 2010 and 2018. General patient
characteristics, PPV, and other hemodynamic parameters following the induction of
general anesthesia were retrieved. Patients were grouped according to the type of
congenital heart disease, and whether the Qp:Qs ratio was higher or lower than 1.
We also identified patients who received a systemic-pulmonary shunt in order to
evaluate changes in PPV. Results: A total of 1253 patients were included
in the study. Baseline PPV differed significantly according to the type of
congenital heart disease, with atrial septal defect showing the lowest PPV (9.5
Despite advances in surgical technique, anesthesia and cardiopulmonary bypass management, the perioperative mortality rate for pediatric cardiac surgery remains relatively high, with low cardiac output being a major reason [1, 2]. Meticulous fluid administration is a challenging task in the treatment of critically ill children with low cardiac output. A young age and reduced cardiac function make it difficult to manage perioperative fluid in children with congenital heart disease (CHD). While hypovolemia reduces cardiac output, fluid overload is associated with increased mortality and morbidity in children undergoing cardiac surgery [3]. Many authors recommend the use of dynamic preload parameters derived from arterial waveforms to evaluate fluid status in critically ill patients [4, 5, 6]. These include pulse pressure variation (PPV), stroke volume variation and systolic blood pressure variation, of which PPV is easily accessible, operator-independent, and convenient for continuous monitoring in clinical settings.
PPV is generated mainly because the cyclical squeeze of mechanical ventilation on intrathoracic great vessels and pulmonary vasculatures reduces right ventricle preload, followed several heartbeats later by a decrease in left ventricle preload [7]. During hypovolemia, the preload of the left heart swings periodically and significantly, with the heart working on the steep portion of the Frank-Starling curve. This results in large cyclic alternations in stroke volume, blood pressures, and hence pulse pressure. In this scenario, volume replacement would augment the stroke volume and make the heart work in the flat portion of the Frank-Starling curve, resulting in a small PPV. PPV could therefore be used to predict a fluid response (FR). PPV is based on the heart-lung interaction, and the cyclic change of preload induced by mechanical ventilation originates from the right heart system (intrathoracic great vessels-right atrium-right ventricle-pulmonary-left atrium-left ventricle-large arteries) rather than the left heart system. It therefore seems reasonable to assume that PPV reflects the preload of pulmonary circulation more than that of systemic circulation.
Although PPV is usually used in patients with intact cardiac anatomy, its simple and practical features have encouraged clinicians to deploy PPV in children with CHD [8, 9, 10]. Several previous studies have shown that PPV is useful for the prediction of FR pre- and post-surgical modification in this population [11, 12]. However, the designs of previous studies were limited by the mixed CHD populations and the lack of analysis regarding the effect of circulation imbalance on FR predictivity, thereby decreasing the predictive power of PPV. CHD is a composite term used for a wide spectrum of structural heart diseases and great vessels. It is characterized by an imbalance between pulmonary and systemic blood flow (Qp:Qs), which varies substantially among different types of CHD. The circulation imbalance consists of either higher Qp:Qs or lower Qp:Qs. In the context of preserved cardiac function, hypovolemia results in low stroke volume and high PPV. Intuitively, children with high Qp:Qs should present systemic hypovolemia and hence elevated PPV values compared to children with low Qp:Qs, all other factors being equal. However, as mentioned previously, PPV reflects pulmonary circulation preload more than it reflects systemic circulation preload, therefore the converse of this intuition should be true.
The aim of this study was therefore to investigate the relationship between Qp:Qs imbalance and baseline PPV (after induction of anesthesia) in pediatric patients undergoing general anesthesia for cardiac surgery. Assuming that baseline PPV is associated with Qp:Qs imbalance, we hypothesized that (1) baseline PPV (after induction of anesthesia) was different among different types of CHD, (2) baseline PPV between pooled groups with high Qp:Qs or low Qp:Qs was different, and (3) the establishment of a systemic-pulmonary shunt would increase Qp:Qs dramatically, resulting in a lower PPV.
We performed a two-center, retrospective observational study of children presenting to the operation room for cardiac surgery between January 2010 to October 2018 at the Children’s Hospital affiliated to Capital Institute of Pediatrics and Beijing Anzhen Hospital, both located in Beijing, China.
Hemodynamic data derived from pressure recording analytical method (PRAM) were retrieved from a dataset containing electronic case report forms which had been collected previously for research purposes. Five graduate students participated in this study as observers and data collectors. PRAM data were merged with the clinical database according to the patient identification number. Patient characteristics collected from the clinical database included age, body weight, body surface area, and major diagnosis of cardiac disease.
Medical charts were retrieved for children aged
Exclusion criteria were lack of Qp:Qs imbalance, American Society of
Anesthesiologists physical classification greater than or equal to IV, prolonged
arterial cannulation time (duration from insertion of tracheal tube to artery
cannulation
Exposure was the specific type of CHD.
For pooled analysis, the type of CHD was divided into two groups: high Qp:Qs
(Qp:Qs ratio
For analysis of before-after changes in PPV following establishment of a systemic-pulmonary shunt, all patients in the sub-cohort received the procedure.
PRAM data included systolic pressure, diastolic pressure, heart rate, stroke
volume index, cardiac index, systemic vascular resistance index, maximal slope of
systolic upstroke (dp/dt
In our previous study procedure, data provided by PRAM was exported to Excel file format for offline analysis. Reasonable data were adopted and documented in a paper clinical record form. The Excel file contained predefined markers indicating the time of intraoperative events, such as artery cannulation, tracheal intubation, surgical incision, etc.
The acquisition time for PRAM data corresponded to the time after arterial cannulation, which was routinely performed after the induction of anesthesia. For patients who received a systemic-pulmonary shunt, data was acquired at the following time points: after the induction of anesthesia, one minute after shunt establishment, 10 minutes after shunt establishment, and at the end of surgery.
The primary endpoint was baseline PPV, while the secondary endpoints were other hemodynamic parameters.
Normally distributed continuous variables were presented as the mean
An exploratory before-after analysis was performed in a small subgroup that received the systemic-pulmonary shunt procedure. Paired t-tests with Bonferroni correction for multiple comparisons were used to investigate intra-group differences.
Pearson’s correlations between PPV and other variables were also explored. A
significant correlation was defined as p
A total of 1291 children fulfilled the inclusion criteria. After the exclusion of 38 ineligible patients, 1253 patients remained in the study. The reasons for exclusion included an absence of Qp:Qs imbalance (n = 10), prolonged arterial cannulation time (n = 14), and missing data (n = 14).
The baseline characteristics of children according to their type of CHD is shown
in Table 1. The parameters of age, weight, height, and BSA differed significantly
between CHD types (p
| Type of congenital heart disease | n | Gender (F/M) | Age (years) | Weight (kg) | Height (cm) | BSA (m |
| Atrial septal defect | 62 | 34/28 | 0.95 [0.72, 1.66] | 9.1 [7.5, 9.9] | 76 [70, 82] | 0.42 [0.36, 0.46] |
| Patent ductus arteriosus | 45 | 32/13 | 0.54 [0.3, 0.95] | 5.9 [4.4, 6.8] | 63 [58, 68] | 0.32 [0.26, 0.35] |
| Ventricular septal defect | 709 | 342/367 | 0.57 [0.38, 1.1] | 6.4 [5.5, 8.5] | 67 [62, 73] | 0.33 [0.30, 0.40] |
| Total anomalous pulmonary venous connection | 50 | 14/36 | 0.16 [0.08, 0.27] | 4.5 [3.5, 5.4] | 56 [52, 60] | 0.25 [0.22, 0.28] |
| Double outlet of right ventricle | 26 | 7/19 | 0.26 [0.15, 0.52] | 4.2 [3.9, 7.2] | 60 [57, 64] | 0.25 [0.25, 0.33] |
| Others with increased Qp:Qs | 40 | 20/20 | 0.44 [0.17, 0.71] | 5.2 [4.4, 7.0] | 63 [56, 71] | 0.29 [0.24, 0.36] |
| Tetralogy of Fallot | 208 | 86/122 | 0.87 [0.71, 1.21] | 8.7 [7.5, 10.0] | 72 [68, 78] | 0.40 [0.36, 0.45] |
| Pulmonary atresia | 53 | 23/30 | 0.88 [0.25, 2.21] | 8.5 [4.2, 11.6] | 70 [55, 86] | 0.40 [0.24, 0.49] |
| Tricuspid valve malformation | 19 | 6/13 | 1.81 [1.46, 5.36] | 11.0 [9.2, 16.0] | 82 [79, 107] | 0.47 [0.44, 0.69] |
| Others with decreased Qp:Qs | 41 | 14/27 | 0.84 [0.43, 1.36] | 8.5 [6.4, 9.5] | 70 [64, 80] | 0.39 [0.33, 0.45] |
| p value for intra-group comparison | - |
Data are shown as the median [25th, 75th percentiles]. BSA, body surface area; F/M, female/male.
| Type of congenital heart disease | n | PPV (Mean |
Upper limit of 95% CI of mean value | Lower limit of 95% CI of mean value |
| Atrial septal defect | 62 | 9.5 |
8.1 | 11.0 |
| Patent ductus arteriosus | 45 | 10.3 |
8.9 | 11.6 |
| Ventricular septal defect | 709 | 11.9 |
11.5 | 12.3 |
| Total anomalous pulmonary venous connection | 50 | 12.6 |
11.5 | 13.6 |
| Double outlet of right ventricle | 26 | 12.6 |
11.1 | 14.1 |
| Others with increased Qp:Qs | 40 | 11.4 |
8.9 | 13.8 |
| Tetralogy of Fallot | 208 | 14.7 |
13.5 | 15.8 |
| Pulmonary atresia | 53 | 14.9 |
12.6 | 17.2 |
| Tricuspid valve malformation | 19 | 21.8 |
15.0 | 28.6 |
| Others with decreased Qp:Qs | 41 | 12.9 |
10.9 | 14.8 |
PPV, pulse pressure variation.
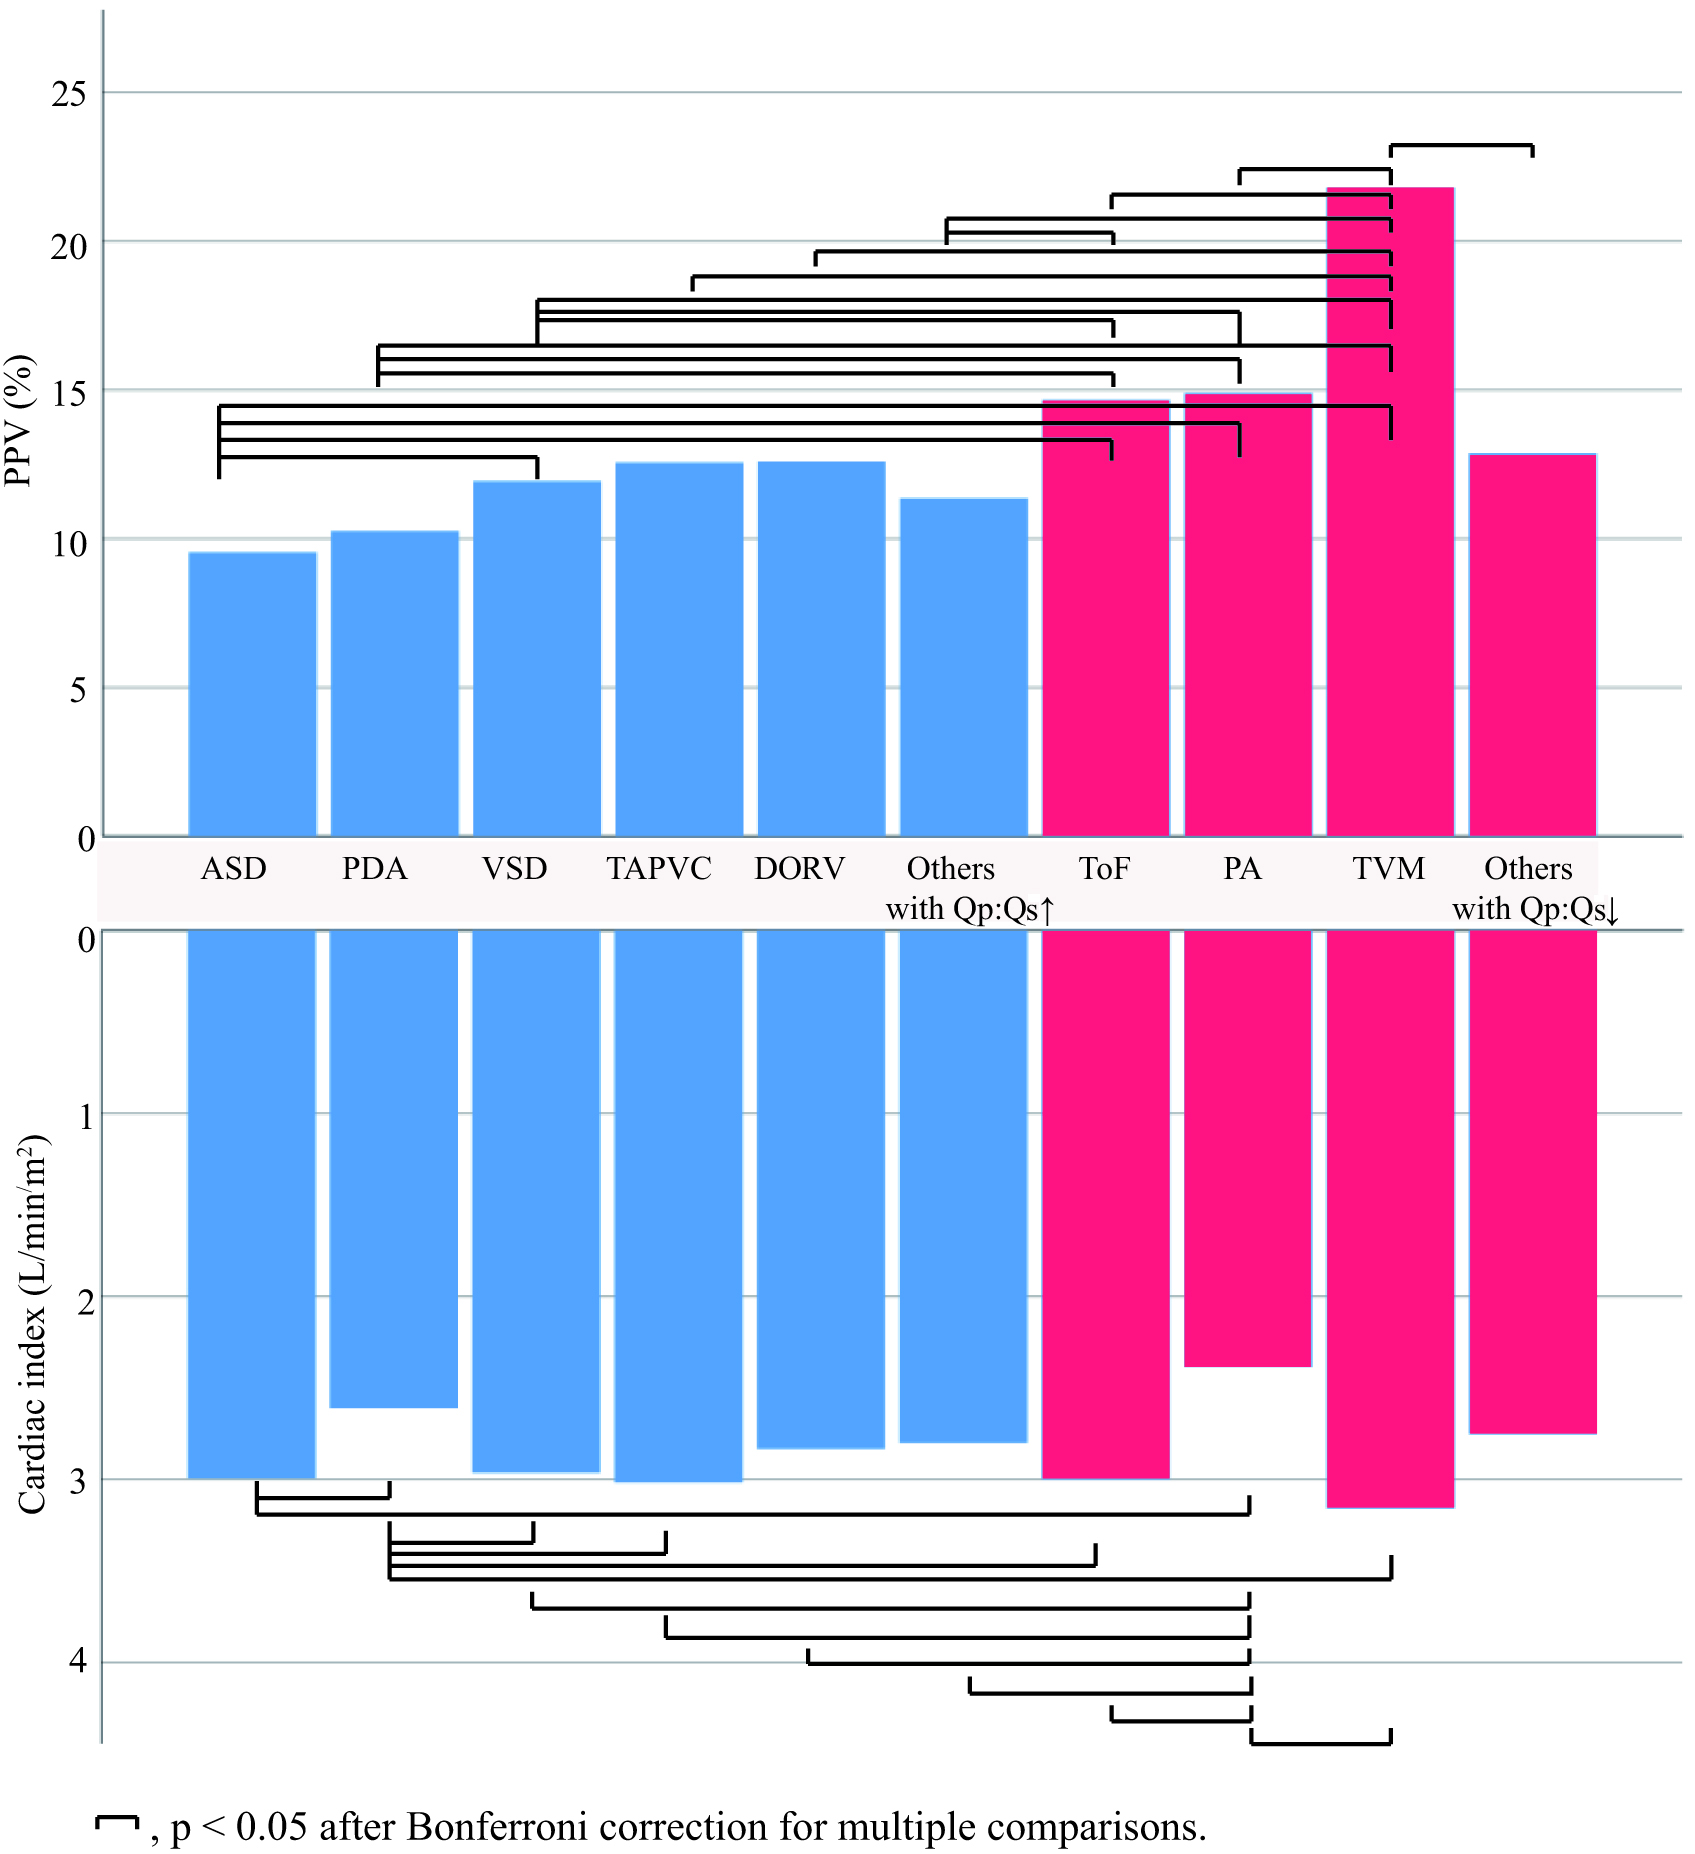 Fig. 1.
Baseline mean PPV value according to the type of CHD. ASD, atrial septal defect; PDA, patent ductus arteriosus; VSD, ventricular septal defect; TAPVC, total anomalous pulmonary venous connection; DORV, double outlet of right ventricle; ToF, tetralogy of Fallot; PA, pulmonary atresia; TVM, tricuspid valve malformation; PPV, pulse pressure variation; CHD, congenital heart disease. Blue color indicates high Qp:Qs and red color indicates low Qp:Qs.
Post-hoc analysis revealed that children with atrial septal defect had lower PPV
than those with ventricular septal defect (p = 0.001, difference = 2.4,
95% CI 1.0–3.8), tetralogy of Fallot (p
Patients with patent ductus arteriosus had lower PPV than those with tetralogy
of Fallot (p
Patients with ventricular septal defect had lower PPV than those with tetralogy
of Fallot (p
Patients with total anomalous pulmonary venous connection had lower PPV than
those with tricuspid valve malformation (p
Patients with double outlet of right ventricle had lower PPV than those with
tricuspid valve malformation (p
Patients with other types of CHD and with increased Qp:Qs had lower PPV than
those with tetralogy of Fallot (p = 0.002, difference = 2.8, 95% CI
1.0–4.6) or with tricuspid valve malformation (p
Patients with tetralogy of Fallot, pulmonary atresia, or other types of CHD
combined with pulmonary stenosis had lower PPV than those with tricuspid valve
malformation (p
The cardiac index was also analyzed because of its close relationship with PPV.
Preload plays an important role in determining cardiac output. Within the context
of preserved cardiac function, it is likely that a high PPV signifies a
hypovolemia status and is accompanied by a relatively low cardiac output/index.
The baseline cardiac index differed significantly between different types of CHD
(p
The baseline characteristics of the two Qp:Qs groups are shown in Table 3. The high Qp:Qs group (n = 932) was comprised of 709 patients with ventricular septal defect, 62 with atrial septal defect, 50 with total anomalous pulmonary venous connection, 45 with patent ductus arteriosus, 26 with double outlet of right ventricle, 10 with ventricular septal defect combined with atrial septal defect, 14 with endocardial cushion defect, 6 with partial anomalous pulmonary venous connection, and 10 with transposition of the great arteries.
| Variable | High Qp:Qs group (n = 932) | Low Qp:Qs group (n = 321) | p value |
| Gender (F/M) | 446/486 | 129/192 | 0.017 |
| Age (years) | 0.55 [0.35, 1] | 0.89 [0.69, 1.44] | |
| Weight (kg) | 7.2 |
9.3 |
|
| Height (cm) | 69 |
76 |
|
| BSA (m |
0.36 |
0.43 |
BSA, body surface area; F/M, female/male.
The low Qp:Qs group (n = 321) consisted of 208 patients with tetralogy of Fallot, 53 with pulmonary atresia, 19 with tricuspid valve malformation, and 41 with other types of cardiovascular anomalies combined with pulmonary stenosis.
As shown in Table 4, the low Qp:Qs group had significantly higher PPV, higher
diastolic blood pressure, lower heart rate, higher systemic vascular resistance
index, lower cardiac cycle efficiency, higher stroke volume index, and lower
dp/dt
| Variable | High Qp:Qs (n = 932) | Low Qp:Qs (n = 321) | Difference (95% CI) | p value |
| Systolic pressure (mmHg) | 86 |
87 |
–1.8 (–3.6, 0.1) | 0.060 |
| Diastolic pressure (mmHg) | 41 |
44 |
–3.6 (–4.7, –2.5) | |
| Heart rate (beats/min) | 112 |
106 |
6.4 (4.2, 8.6) | |
| Systemic vascular resistance index (dyn·s/cm |
1385 |
1557 |
–172 (–219, –124) | |
| Cardiac cycle efficiency (unit) | –0.02 |
–0.14 |
0.12 (0.08, 0.16) | |
| Cardiac index (L/min/m |
2.9 |
2.9 |
0.07 (–0.01, 0.14) | 0.122 |
| Stroke volume index (mL/m |
26.4 |
28.0 |
–1.6 (–2.6, –0.6) | 0.002 |
| Dp/dt |
1.01 |
0.94 |
0.07 (0.04, 0.10) | |
| PPV (%) | 11.8 |
14.9 |
–3.1 (–3.9, –2.2) |
PPV, pulse pressure variation; dp/dt
We identified 46 patients who received a systemic-pulmonary shunt. As shown in
Table 5, PPV showed a non-statistically significant decrease one minute after the
establishment of a systemic pulmonary shunt (p
| Variable | After induction of anesthesia | One minute after establishment of shunt | Ten minutes after establishment of shunt | End of surgery |
| Cardiac cycle efficiency (unit) | 0.02 |
0.02 |
0.06 |
0.12 |
| Cardiac index (L/min/m |
2.92 |
2.63 |
3.05 |
3.04 |
| Diastolic pressure (mmHg) | 46 |
41 |
46 |
46 |
| Dp/dt |
1.02 |
1.18 |
1.37 |
1.32 |
| Heart rate (beats/min) | 105 |
124 |
133 |
133 |
| PPV (%) | 13.0 |
11.2 |
6.5 |
6.1 |
| Stroke volume index (mL/m |
29.4 |
21.5 |
24.4 |
24.2 |
| Systemic vascular resistance index (dyn·s/cm |
1498 |
1656 |
1598 |
1640 |
| Systolic pressure (mmHg) | 94 |
98 |
110 |
108 |
*, p
PPV was not significantly correlated with any of the demographic or hemodynamic variables examined, according to the prior definition of a significant correlation.
There has been increased interest in the use of dynamic preload parameter to predict FR in ventilated and critically ill pediatric cardiac patients. Despite this, the effect of Qp:Qs imbalance on dynamic preload parameter has not been studied. In this study, we evaluated the effect of a wide and heterogeneous spectrum of CHD on PPV values, in line with the current strategy of precision medicine. The present results suggest that baseline PPV is associated with Qp:Qs imbalance in pediatric patients undergoing cardiac surgery.
The induction of anesthesia frequently leads to hemodynamic depression due to volume depletion from preoperative fasting, as well as vasodilation caused by anesthetics coexisting with the inhibition of myocardial contractility. The values for hemodynamic variables post-induction of anesthesia are usually referred to as the baseline. These serve as a reference for evaluating hemodynamic trends during the period before the onset of cardiopulmonary bypass (CPB), and can also be used to stratify the level of critical care. Further, the hemodynamic variables are relatively stable and reliable during the induction of anesthesia period, as there is little interference from surgical operations.
PPV accurately predicts FR only under restricted conditions. Several factors
have been reported to affect the magnitude of PPV and sometimes also its
performance to predict FR. First, transpulmonary pressure has a large impact on
the magnitude of PPV, which increases with increasing inspiratory pressure or
transpulmonary pressure [4, 14]. For patients subjected to protective lung
ventilation (small tidal volume plus positive end expiratory pressure), a
reduction in transpulmonary pressure has been shown to reduce the overall PPV and
to decrease the cutoff value for predicting FR [15]. Although data on
transpulmonary pressure or a similar metric such as lung compliance was not
available in this study, we presumed the high Qp:Qs group had higher
transpulmonary pressure than the low Qp:Qs group. This was because the former
usually has reduced lung compliance due to high Qp and therefore needs a higher
driving pressure to achieve an equal tidal volume. From this it follows the high
Qp:Qs group would have an elevated rather than reduced PPV compared to the low
Qp:Qs group. Second, cardiac dysfunction is another major factor that influences
the FR prediction of preload parameter [16]. Based on PRAM data, dp/dt
In the present study, the rationale underlying the biased baseline PPV should be
the difference in Qp:Qs. From this, a higher pulmonary pressure frequently
coexisting with high Qp:Qs should be associated with a lower PPV. This result is
in sharp contrast with previous findings on adult patients showing that transient
elevated pulmonary pressure coexisting with right ventricle dysfunction can lead
to false-positive (elevated) PPV in predicting FR [17]. The reason for this
discrepancy could be that the high Qp:Qs group in the present study population
had normal or even above normal right ventricle function due to functional
hypertrophy and infant physiology [18]. One could assume that the relatively
healthy status and less hemodynamic fluctuations in the high Qp:Qs group were
responsible for the lower PPV. However, our results showed that the low Qp:Qs
group had a comparable cardiac index, a higher stroke volume index, and a lower
heart rate compared with the high Qp:Qs group, thus indicating a similar or even
more stable hemodynamic status. Children in the low Qp:Qs group were older and
had higher body weight, probably because the timing of surgical intervention was
chosen to be at a later age in order to better cope with the surgical stress.
With advancing age the stroke volume and blood pressure increase, while the heart
rate decreases. Hence, the low Qp:Qs group had higher stroke volume index, higher
diastolic blood pressure, and lower heart rate compared to the high Qp:Qs group.
The higher systemic vascular resistance index in the low Qp:Qs group develops so
as to accommodate the relatively inferior cardiac function, as reflected by the
lower dp/dt
The establishment of a systemic-pulmonary shunt offers a good opportunity to test our hypothesis that PPV is associated more with Qp than with Qs. We found that a systemic to pulmonary shunt was associated with a trend for reduced PPV one minute after establishment of the shunt, instead of the anticipated elevation in PPV due to the pulmonary system taking blood from the systemic circulation. This reduction was unlikely to be related to volume expansion. As per our anesthesia protocol, only a small volume was given to avoid a full-loaded heart, thereby facilitating surgical manipulation prior to declamping the shunt. The PPV decreased significantly 10 minutes later, probably due to the start of extensive volume replacement therapy and further increases in Qp.
The results of this study may have practical value for when clinicians use PPV to discriminate fluid responders. Previous studies have delineated a wide range of threshold values for predicting FR across a large spectrum of CHD [9, 11, 19]. High Qp:Qs was associated with an overall decrease in PPV. Therefore, if PPV was able to predict FR in this population, the low Qp:Qs group would likely have a higher threshold of PPV for predicting FR compared to the high Qp:Qs group. Clinicians should take this bias into account when performing fluid loading based on parameters involving PPV and when conducting clinical trials with a mixed CHD population.
PPV may offer an alternative for estimating the degree of Qp:Qs imbalance in children with high Qp:Qs. It is well recognized that a low diastolic pressure signifies a large systemic to pulmonary shunt in cases presenting with patent ductus arteriosus. Moreover, diastolic pressure has been employed to assist surgeons in determining the amount of artificial shunt in systemic-pulmonary shunt procedures. Similarly, PPV is promising not only for predicting FR but also as a potential indicator of Qp in children with increased Qp.
This study has several limitations. First, it was retrospective in design and therefore subjected to the same limitations as any retrospective study. The results may be biased due to the failure to account for all confounders, such as the duration of preoperative fasting and other unmeasured factors.
Second, the number of subjects with different types of CHD varied. The study population consisted predominantly of ventricular septal defect for the high Qp:Qs group, and tetralogy of Fallot for the low Qp:Qs group. There was an increased risk of sampling error due to the small sample size for some types of CHD.
Third, children with low Qp:Qs were severe patients at risk of hemodynamic instability, and anesthesiologists therefore tend to perform fluid loading upon induction of general anesthesia. Additionally, vasoactive agents may also have been used as needed. The retrospective nature of this study meant these events were not thoroughly documented. However, in either scenario, PPV would have been higher in the low Qp:Qs group if a fluid loading or vasoactive agent was not used. Hence, the difference in PPV at baseline between the high and low Qp:Qs groups may have been reduced.
Fourth, baseline characteristics between the high and low Qp:Qs groups were not adjusted to match. However, general characteristics are not confounders of PPV magnitude according to our prior knowledge and correlation analyses.
Lastly, this study involved patients with intra- or extra-cardiac shunts, which could affect heart-lung interactions and hence the magnitude of PPV. However, the authors consider that PPV is related to preload status when patients are hemodynamically stable and intra- or extra-cardiac shunts remain in a homeostatic state. Indeed, previous studies have reported that dynamic preload parameter was predictive of FR in this study population [11, 12].
In children with imbalanced Qp:Qs undergoing general anesthesia for cardiac surgery, the intraoperative baseline PPV differed significantly between those with different types of CHD. Moreover, PPV was significantly lower in children with high Qp:Qs compared to those with low Qp:Qs. Imbalanced Qp:Qs contributes to the difference in baseline PPV, thereby potentially affecting the cutoff values for predicting FR. We envision two general directions for future prospective research. First, the theory outlined in this study could be strengthened by evaluating the association between PPV and pulmonary pressures (including pulmonary artery wedge pressure), as measured by pulmonary catheterization. The second future research area is to determine the optimal cutoff value for PPV (if it exits) to predict FR in different types of CHD.
The datasets used in the current study are available from the corresponding author upon reasonable request.
DH made substantial contributions to data collection, data analysis and manuscript writing. SX made contributions to data collection, analysis, and manuscript writing. CO made substantial contributions to study design and revising it critically for important intellectual content. All authors read and approved the final manuscript. All authors agreed to be accountable for all aspects of the work in ensuring that questions related to the accuracy or integrity of any part of the work are appropriately investigated and resolved.
This research protocol was approved by the Clinical Research Ethics Committee of Beijing Anzhen Hospital, Capital Medical University (Approval ID: 2019213X). The requirement for informed consent was waived given the retrospective nature of the study.
Not applicable.
This research received no external funding.
The authors declare no conflict of interest.
Publisher’s Note: IMR Press stays neutral with regard to jurisdictional claims in published maps and institutional affiliations.