
- Academic Editor
†These authors contributed equally.
Background: The choice between bioprosthetic and mechanical valves for aortic valve replacement (AVR) and mitral valve replacement (MVR) among patients aged 50–70 years is controversial. We compared the long-term outcomes of patients using bioprosthetic or mechanical valves to provide clinical evidence for valve selection. Methods: From 2002 to 2007, patients aged 50–70 years who underwent isolated AVR or MVR at the Fuwai Hospital were enrolled. After inverse probability-weighted (IPW) propensity balancing, we evaluated long-term mortality, stroke, and bleeding events between patients receiving mechanical and biological prostheses for MVR or AVR. Results: A total of 1639 patients were included in the study, including 1181 patients undergoing MVR (median follow-up: 11.6 years) and 458 patients undergoing AVR (median follow-up: 11.4 years). After IPW adjustment, there was no significant difference in long-term mortality and stroke rate between patients using bioprosthetic and mechanical valves for MVR [mortality: log-rank p = 0.802; stroke: log-rank p = 0.983] and AVR [mortality: log-rank p = 0.815; stroke: log-rank p = 0.537]. Landmark analysis at 12.5 years yielded significantly lower mortality in the patients receiving mechanical valves compared with bioprosthetic valves in the MVR cohort (p = 0.028). Patients receiving mechanical aortic valves displayed an increased risk of bleeding compared with those who received bioprosthetic aortic valves [Hazard Ratio (95% Confidence interval): 2.51 (1.06–5.93) p = 0.036]. Conclusions: For patients aged 50–70, there was no significant difference in overall long-term mortality between mechanical and bioprosthetic valve recipients. Patients receiving mechanical valves for MVR displayed lower mortality after 12.5 years follow-up. For AVR, bioprosthetic valves were associated with a lower risk of bleeding.
Valve replacement has been proven to be an effective treatment for improving the prognosis of patients with severe valvular disease [1, 2]. However, for patients undergoing valve replacement, the choice between biological and mechanical valves is always challenging because the outcome can be affected by the tradeoff between prosthesis durability, hemodynamics, and risk of hemorrhage thromboembolism [3, 4].
The age cut-off for prosthesis selection has been addressed in various international guidelines, but is inconsistent for those patients between 50 and 70 years [5, 6, 7, 8]. Current European Society of Cardiology (ESC)/European Association for Cardio-Thoracic Surgery (EACTS) guidelines recommend mechanical valves in patients younger than 60 years old and 65 years old for aortic valve replacement (AVR) and mitral valve replacement (MVR), respectively, and bioprosthetic valves in those older than 65 years old and 70 years old for AVR and MVR, respectively [8]. But in the American College of Cardiology (ACC)/American Heart Association (AHA) guidelines, the age threshold for the selection of bioprosthetic valves is older than 65 for both AVR and MVR, while it is stated that either type of valve can be considered for AVR in patients between 50 and 65 years old [7]. Such inconsistency is also a consequence of limited clinical evidence for the optimal prosthesis for patients between 50 and 70 years.
Therefore, we performed a retrospective study based on real-world data of all patients aged 50–70 years who had undergone primary, isolated MVR or AVR in a national cardiac center in China between 2002 and 2007. The aim of this study was to compare long-term survival, stroke, and bleeding events in bioprosthetic versus mechanical valve replacement among patients aged between 50 and 70 years.
This was a single-center retrospective cohort study. The clinical information of patients who received isolated MVR or AVR in the Fuwai Hospital from 2002 to 2007 was collected. They were followed for at least 10 years, and the long-term survival rates of patients who received bioprosthetic or mechanical valve replacement were compared. And the results were reported according to the Strengthening the Reporting of Observational studies in Epidemiology (STROBE) Statement [9].
Inclusion criteria were as follows:
1. The operation date was between January 1, 2002, and December 31, 2007;
2. 50 years old
3. The patient received an isolated MVR or AVR.
1. Patients died in the hospital or were discharged due to serious illness.
2. Patients underwent previous mitral or aortic replacement or repair.
3. Over 10% loss of any important items (demographic features, surgical information, and comorbidities) in the medical records.
4. Patients with concomitant coronary artery bypass surgery (CABG).
5. Patients undergoing emergency operation.
6. Patients with a history of drug abuse.
All patients underwent a median sternotomy under general anesthesia, cardiac valve replacement with cardiopulmonary bypass, and postoperative transesophageal echocardiography to assess the effects of valve replacement. Patients with bioprosthetic valves had routine warfarin anticoagulation for 6 months unless there were contraindications; patients with mechanical valves took warfarin for life. The bioprosthetic prostheses mainly included bovine pericardial valve (Carpentier-Edwards Perimount, Magna, Edwards Lifescience, Irvine, CA, USA), Hancock, Hancock II and Mosaic valves (Medtronic, Dublin, Ireland). The mechanical valve was mainly bileaftet valve (St. Jude, ATS, Medtronic, Sorin, Carbo). Tilting disk valve was also used in a small number of patients (10.11% (89/880) in mitral valve (MV) mechanical prostheses, 5.86% (19/324) in aortic valve (AV) mechanical prostheses).
Baseline information on demographics and co-morbidities, surgical procedures, and postoperative outcomes were obtained through the medical record system. Follow-up was conducted via telephone and letters by the surgical follow-up team of the Fuwai Hospital. For patients who could not be contacted by phone, the identity number registered on the front page of the medical record was used to perform a query on the resident death registration system. All the data used in this study were approved for scientific research and were not permitted for other purposes. Sensitive details of the patients were removed and patient information was kept strictly confidential.
The primary endpoint was all-cause mortality during the period from discharge to postoperative follow-up. Telephone and letter follow-ups were carried out until the death of the patient, and the patient was considered dead if the account was closed on the resident death registration system. The secondary endpoints included the incidence of stroke and major bleeding events. Incident stroke was defined as the first nonfatal or death due to ischemic, hemorrhagic, or iatrogenic stroke after valve surgery based on self-reporting or physician diagnosis. Major bleeding events included any intracerebral hemorrhage, gastrointestinal hemorrhage, hemarthrosis, retinal/choroidal hemorrhage, or receiving a blood transfusion. This was collected based on clinic visits and telephone calls. To minimize reporting discrepancies, these secondary endpoints events were reviewed and adjudicated by two senior clinicians (HS and ZZ) based on the documentation of each patient or presence of supporting laboratory or imaging results.
Patient characteristics are presented as frequencies with percentages for categorical variables and as mean with standard deviation for continuous variables. To reduce selection bias, in both the AVR and the MVR cohorts, logistic regression was constructed respectively to generate the propensity score (PS). All baseline characteristics were included as covariates in the PS model in the AVR and MVR cohorts. Stabilized inverse probability-weighted (IPW) were calculated for each patient as the inverse of the PS for patients undergoing mechanical valves and the inverse of (1-PS) for patients undergoing bioprosthetic valves [10]. The balance between treatment groups was assessed with the use of standardized mean differences (SMD). A standardized difference of 10% or less was deemed to be the ideal balance [11]. An SMD of 20% or less was also considered acceptable.
Crude survival curves and IPW-adjusted curves for long-term survival were
constructed in the MVR and AVR cohorts. The Kaplan–Meier method was used to
calculate cumulative survival and curves were compared by the log-rank test.
Since the effect of valve type is a time-varying variable, and the effect
direction changed between 12 and 13 years of follow-up in the MVR cohort, but not
the AVR cohort (Supplementary Figs. 1,2), a landmark analysis was
performed to compare the long-term survival after 12.5 years in the MVR cohort
[12]. The association of valve types with the primary and secondary outcomes were
assessed in MVR and AVR cohorts and different age (50–59 years) and (60–70
years) groups using an unadjusted and adjusted hazard ratio (HR) by univariate,
IPW weighted proportional model and multivariate cox proportional hazard models.
Prespecified confounders included demographic features, body mass index (BMI),
history of hypertension, hyperlipidemia, diabetes, chronic obstructive pulmonary
disease, stroke, atrial fibrillation (AF), coronary heart disease, and New York
Heart Association (NYHA) class were adjusted in the multivariate cox model. For
additional subgroup analyses, we applied the multivariate cox model, controlling
for other covariates other than the stratification variables, to evaluate the
effect of mechanical valves on all-cause death in patients with different sex,
BMI (divided by the median), AF, and NYHA class (I–II/III–IV) groups in both
the MVR and AVR cohort and reported adjusted HR of mechanical valve compared with
bioprosthetic valve in each subgroup. All tests were 2-tailed; an
A total of 1733 cases met the inclusion criteria. The surgical records and homepage information of the 1733 cases were reviewed to exclude cases that did not meet the inclusion criteria (32 deaths occurred in hospital, including 17 patients who had a bioprosthetic MVR, 6 patients who had a mechanical MVR, 7 patients who had a mechanical AVR, and 2 patients who had a bioprosthetic AVR). A total of 1639 patients were enrolled in the study, including 1181 MVR patients (301 bioprosthetic valve replacements and 880 mechanical valve replacements) and 458 AVR patients (134 bioprosthetic valve replacements and 324 mechanical valve replacements) (Fig. 1).
 Fig. 1.
Flow chart of patient enrollment.
In the unweighted analysis (Supplementary Table 1), patients who
received a bioprosthetic valve were older than those who received a mechanical
valve in both the MVR and AVR cohorts (mean [SD] age, 60.5
| Mitral-valve replacement | Aortic-valve replacement | ||||||
| Bioprosthetic | Mechanical | SMD | Bioprosthetic | Mechanical | SMD | ||
| (n = 1215.0) | (n = 1176.5) | (n = 455.4) | (n = 455.7) | ||||
| Age, yrs (mean (SD)) | 56.66 (5.37) | 57.04 (4.98) | 0.074 | 58.55 (6.03) | 58.78 (5.73) | 0.040 | |
| Female, n (%) | 837.9 (69.0) | 824.5 (70.1) | 0.024 | 126.6 (27.8) | 161.8 (35.5) | 0.166 | |
| BMI (mean (SD)) | 23.50 (3.16) | 23.53 (3.38) | 0.011 | 24.63 (3.31) | 24.45 (3.29) | 0.055 | |
| Hypertension, n (%) | 126.7 (10.4) | 128.8 (10.9) | 0.017 | 133.0 (29.2) | 136.2 (29.9) | 0.015 | |
| Hyperlipidemia, n (%) | 40.7 (3.3) | 38.6 (3.3) | 0.004 | 0.0 (0.0) | 9.0 (2.0) | 0.200 | |
| Diabetes, n (%) | 68.4 (5.6) | 67.1 (5.7) | 0.003 | 22.6 (5.0) | 20.8 (4.6) | 0.018 | |
| Stroke, n (%) | 57.3 (4.7) | 52.5 (4.5) | 0.012 | 3.3 (0.7) | 5.4 (1.2) | 0.046 | |
| COPD, n (%) | 71.9 (5.9) | 90.6 (7.7) | 0.071 | 38.6 (8.5) | 29.8 (6.5) | 0.073 | |
| PVD, n (%) | 0.0 (0.0) | 7.0 (0.6) | 0.109 | 1.0 (0.2) | 0.0 (0.0) | 0.066 | |
| Infective endocarditis, n (%) | 8.4 (0.7) | 8.5 (0.7) | 0.004 | 5.5 (1.2) | 7.2 (1.6) | 0.033 | |
| Atrial fibrillation, n (%) | 912.8 (75.1) | 884.1 (75.1) | 35.6 (7.8) | 40.3 (8.8) | 0.037 | ||
| Coronary heart disease, n (%) | 11.0 (0.9) | 15.5 (1.3) | 0.039 | 11.5 (2.5) | 14.0 (3.1) | 0.033 | |
| NYHA class, n (%) | 0.168 | 0.123 | |||||
| I | 67.4 (5.5) | 29.9 (2.5) | 22.5 (4.9) | 21.7 (4.8) | |||
| II | 738.2 (60.8) | 711.6 (60.5) | 313.2 (68.8) | 294.8 (64.7) | |||
| III | 383.6 (31.6) | 397.2 (33.8) | 111.9 (24.6) | 124.4 (27.3) | |||
| IV | 25.8 (2.1) | 37.8 (3.2) | 7.7 (1.7) | 14.7 (3.2) | |||
| Liver disease, n (%) | 2.6 (0.2) | 3.2 (0.3) | 0.011 | 0.0 (0.0) | 1.0 (0.2) | 0.066 | |
| Previous PCI, n (%) | 1.0 (0.1) | 0.0 (0.0) | 0.041 | 3.2 (0.7) | 2.2 (0.5) | 0.027 | |
Note: AVR, aortic valve replacement; MVR, mitral valve replacement; BMI, body mass index; COPD, chronic obstructive pulmonary disease; PVD, peripheral vascular disease; NYHA, New York Heart Association; PCI, percutaneous coronary intervention; SMD, standardized mean difference.
The actual survival rate and relative risk after IPW or multivariate adjustment in primary and secondary outcomes among recipients of mechanical and biologic valve were compared in the MVR and AVR cohorts.
For MVR patients, the median follow-up period was 11.6 years and the 15-year survival rate was 48.3% and 75.7% for bioprosthetic valve and mechanical valve recipients respectively. Crude survival curves are shown in the Supplementary Fig. 3. After IPW adjustment, there was no statistically significant difference between long-term risk of mortality (Fig. 2A) [log-rank p = 0.802, HR (95% CI): 0.93 (0.66–1.31), p = 0.678], stroke (Fig. 2B) [log-rank p = 0.983, HR (95% CI): 0.99 (0.58–1.70); p = 0.967] and bleeding events (Fig. 2C) [log-rank p = 0.433, HR (95% CI): 0.88 (0.63–1.23), p = 0.467] among patients receiving mechanical valve replacement and bioprosthetic valve replacement (Table 2). However, after IPW adjustment (Supplementary Table 2), in the landmark analysis for comparing the survival rate after 12.5 years, we observed a higher survival rate in the mechanical MVR group (Fig. 3).
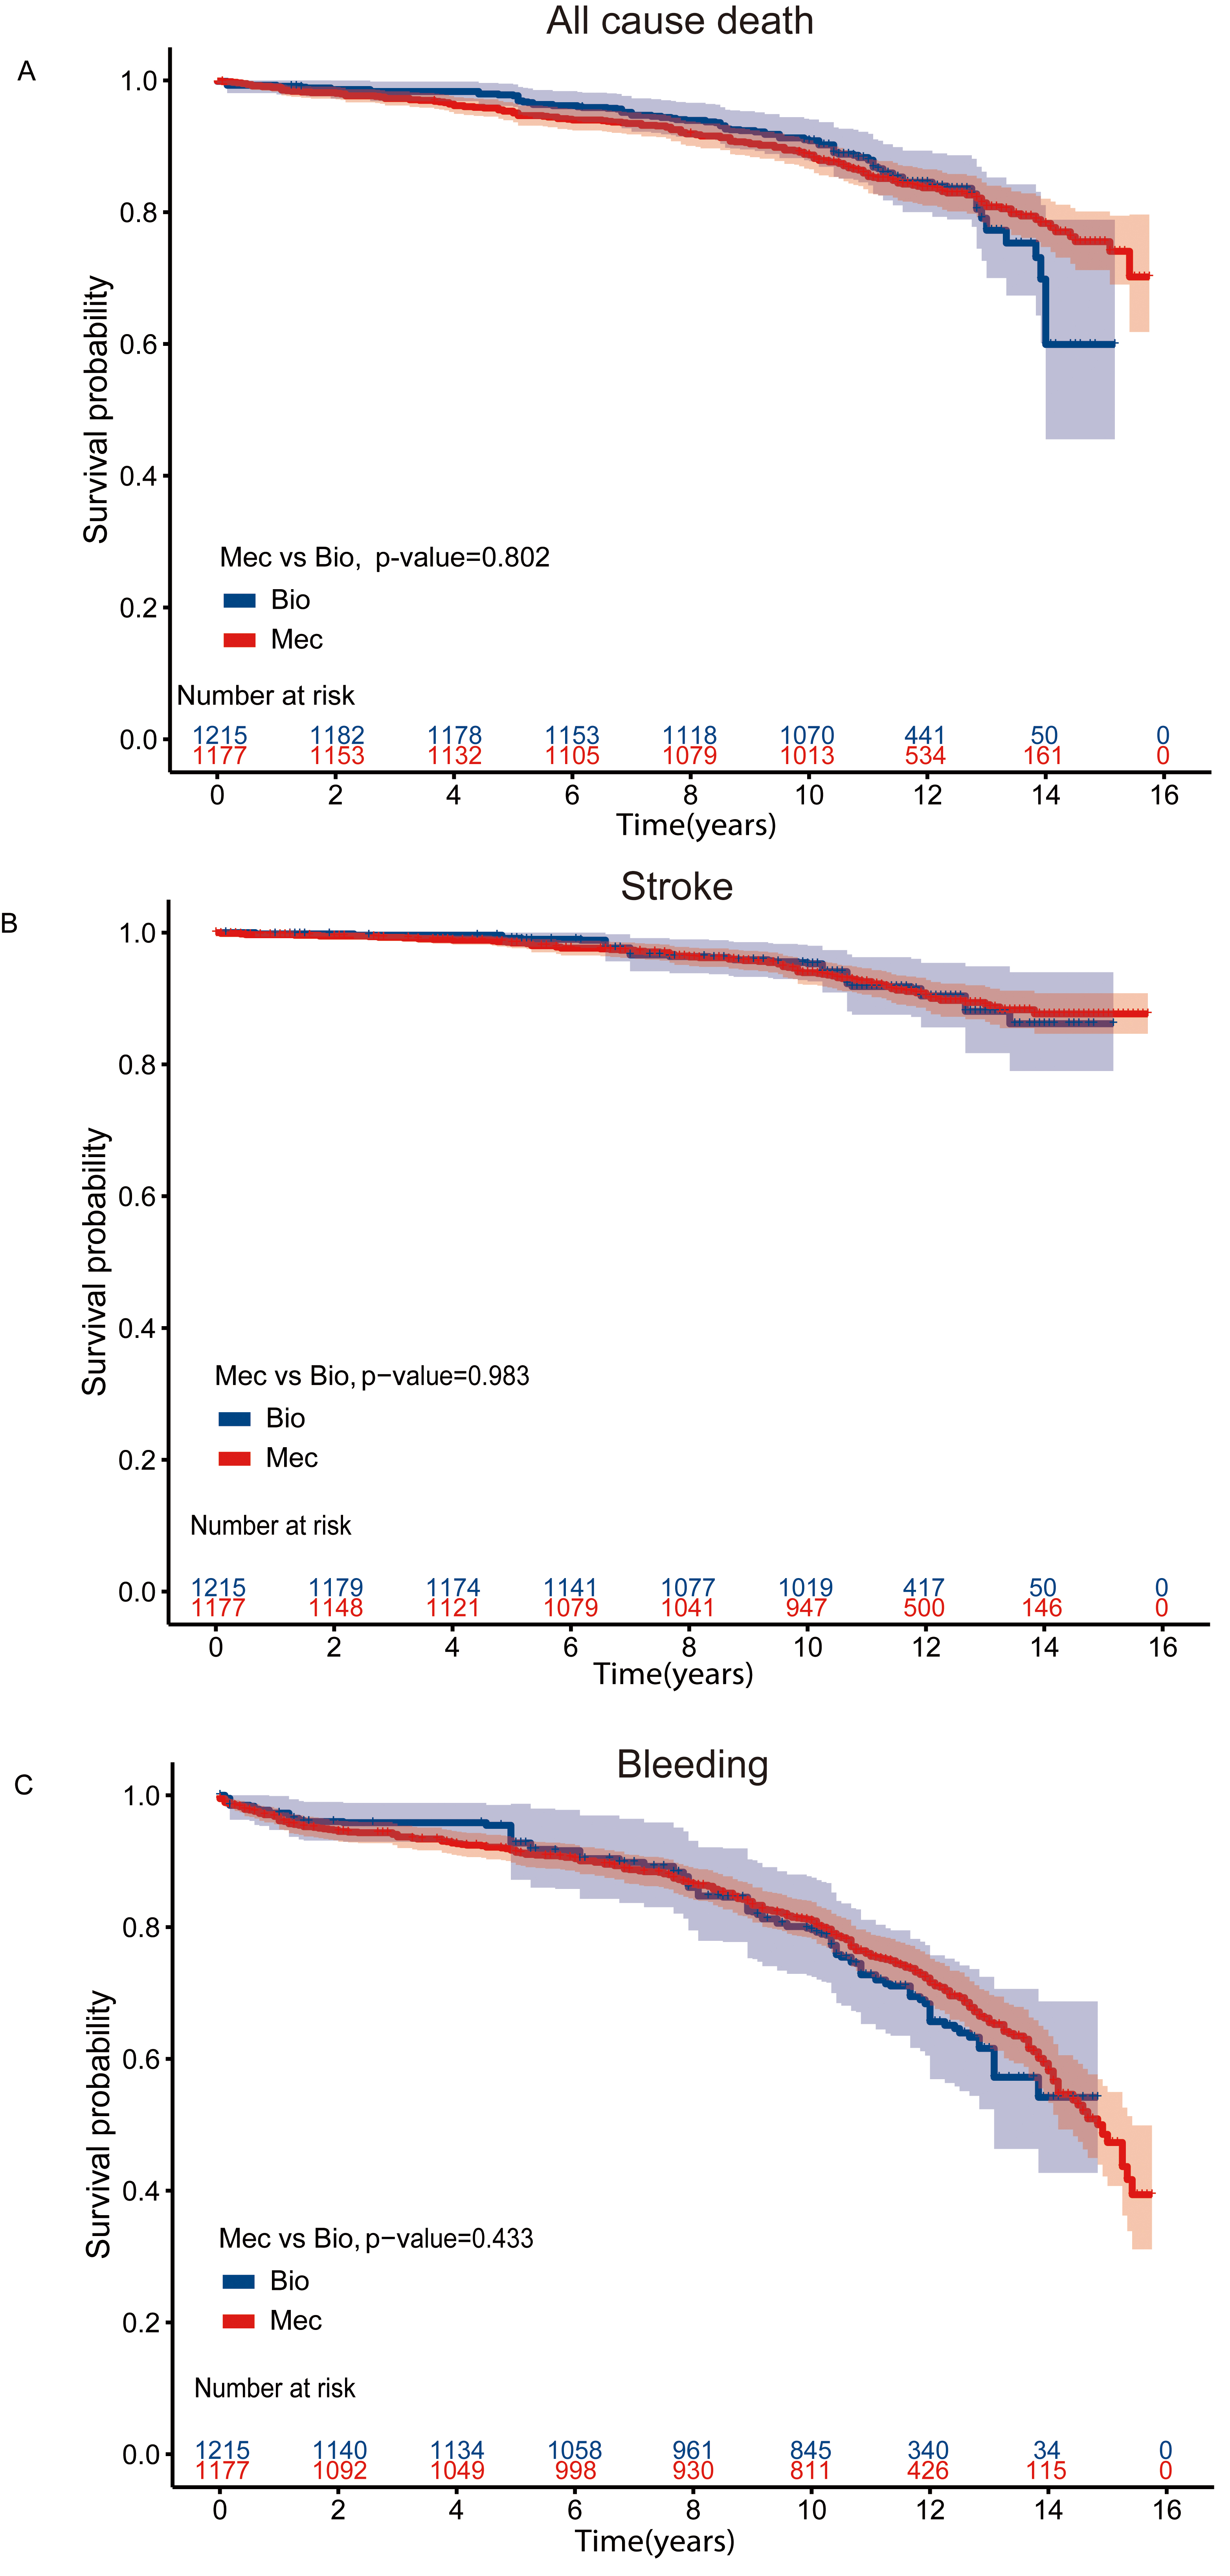 Fig. 2.
Kaplan-Meier Curves for Clinical outcomes in the MVR cohort. Kaplan-Meier curve of survival after IPW adjustment among patients aged 50–70 years who had undergone MVR (A) All cause death (B) Stroke events (C) Bleeding events. MVR, mitral valve replacement; IPW, inverse probability-weighted; Bio, bioprosthetic valves; Mec, mechanical values.
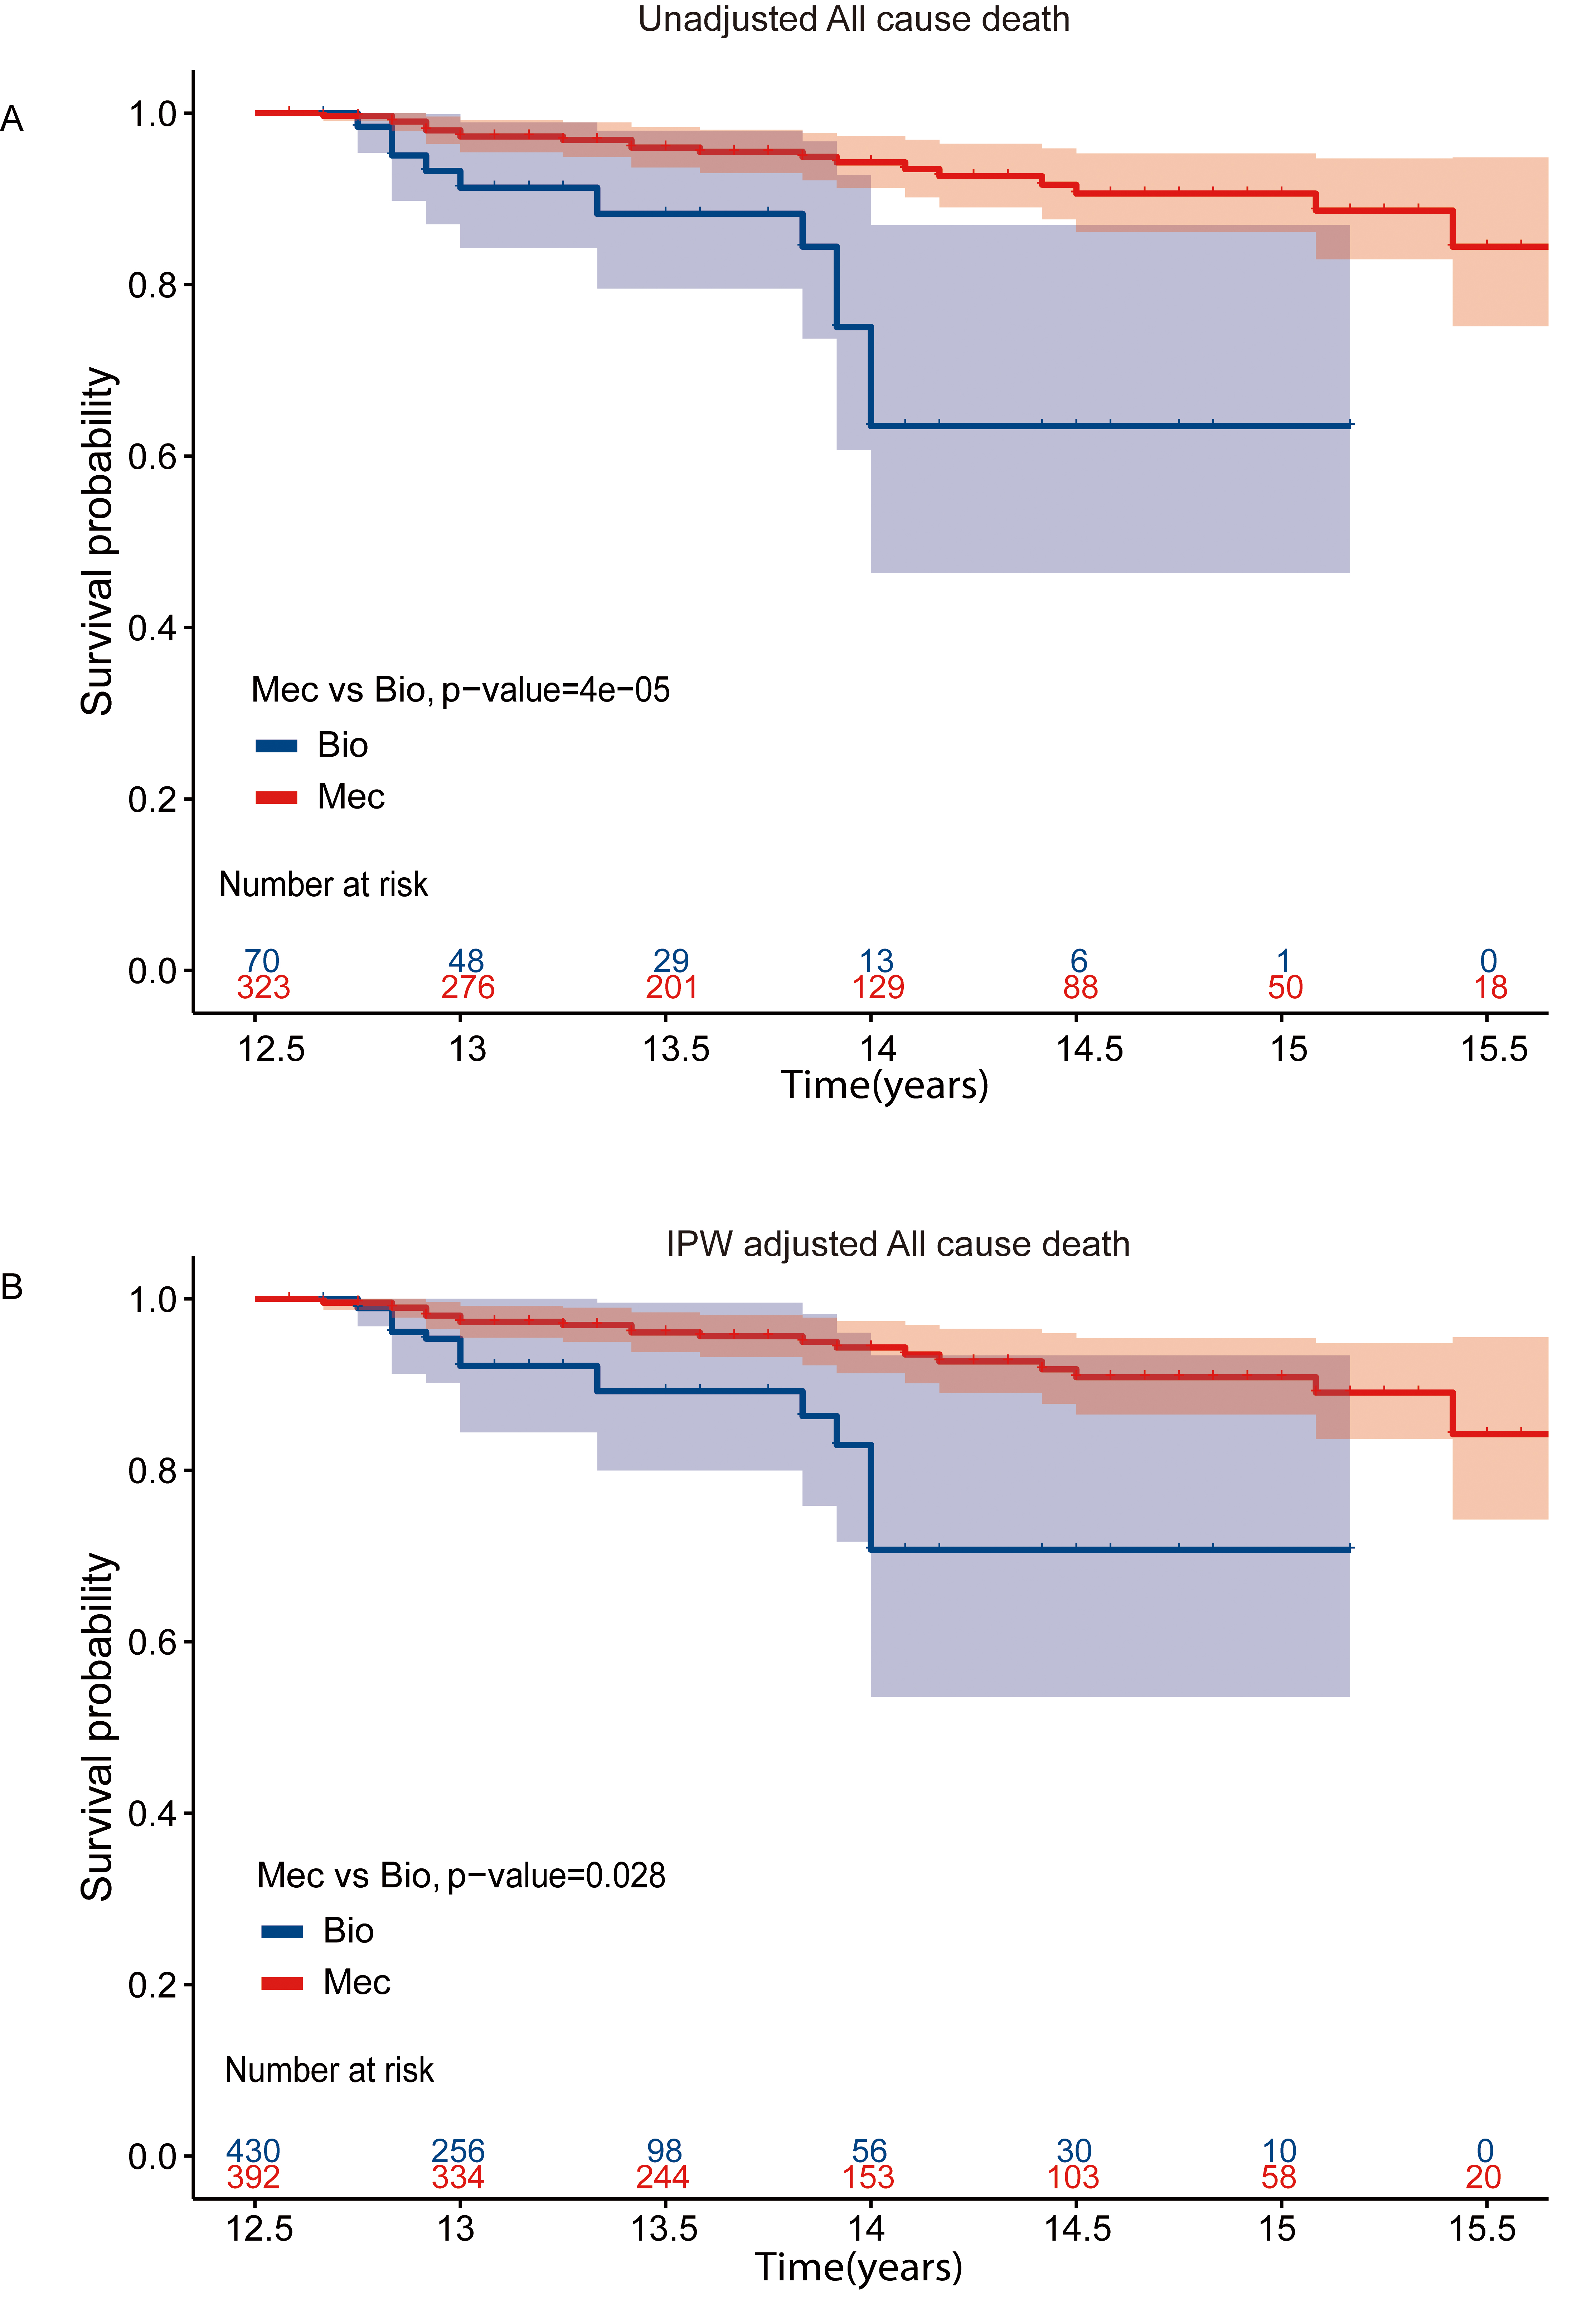 Fig. 3.
Kaplan-Meier Curves for all cause mortality with landmark analysis in MVR cohort. Kaplan-Meier curve of survival among patients aged 50–70 years with landmark analysis at 12.5 years in MVR cohort (A) Unadjusted survival curves (B) IPW adjusted survival curves. MVR, mitral valve replacement; IPW, inverse probability-weighted; Bio, bioprosthetic valves; Mec, mechanical values.
| Mitral-valve replacement (50–70 yrs) | Mitral-valve replacement (50–59 yrs) | Mitral-valve replacement (60–70 yrs) | |||||||
| Bioprosthetic (n = 301) | Mechanical (n = 880) | p-value | Bioprosthetic (n = 129) | Mechanical (n = 703) | p-value | Bioprosthetic (n = 172) | Mechanical (n = 177) | p-value | |
| Death | 73 (48.3%) | 152 (75.7%) | 22 (60.1%) | 117 (76.8%) | 0.5 | 51 (41.6%) | 35 (71.7%) | 0.020 | |
| (15-yrs survival rate) | |||||||||
| Crude model | ref | 0.61 (0.46–0.81) | ref | 0.85 (0.54–1.35) | 0.498 | ref | 0.61 (0.40–0.94) | 0.023 | |
| HR (95% CI) | |||||||||
| IPW model | ref | 0.93 (0.66–1.31) | 0.678 | ref | 1.16 (0.70–1.93) | 0.561 | ref | 0.66 (0.42–1.06) | 0.085 |
| HR (95% CI) | |||||||||
| Cox HR | ref | 0.82 (0.59–1.12) | 0.207 | ref | 0.98 (0.61–1.58) | 0.937 | ref | 0.71 (0.44–1.14) | 0.16 |
| HR (95% CI) | |||||||||
| Stroke (percentage) | 27 (9.0%) | 74 (8.4%) | 0.400 | 10 (7.8%) | 60 (8.5%) | 0.900 | 17 (9.9%) | 14 (7.9%) | 0.300 |
| Crude model | ref | 0.84 (0.54–1.30) | 0.428 | ref | 1.03 (0.53–2.02) | 0.928 | ref | 0.71 (0.35–1.44) | 0.339 |
| HR (95% CI) | |||||||||
| IPW model | ref | 0.99 (0.58–1.70) | 0.967 | ref | 0.92 (0.45–1.90) | 0.824 | ref | 0.90 (0.43–1.90) | 0.788 |
| HR (95% CI) | |||||||||
| Cox HR | ref | 1.01 (0.62–1.64) | 0.982 | ref | 1.11 (0.56–2.21) | 0.762 | ref | 0.85 (0.40–1.83) | 0.682 |
| HR (95% CI) | |||||||||
| Bleeding (percentage) | 73 (24.3%) | 266 (30.2%) | 0.500 | 38 (29.5%) | 215 (30.6%) | 0.600 | 35 (20.3%) | 51 (28.8%) | 0.200 |
| Crude model | ref | 1.09 (0.84–1.41) | 0.530 | ref | 0.92 (0.65–1.30) | 0.629 | ref | 1.316 (0.85–2.03) | 0.213 |
| HR (95% CI) | |||||||||
| IPW model | ref | 0.88 (0.63–1.23) | 0.467 | ref | 0.87 (0.59–1.27) | 0.471 | ref | 1.18 (0.75–1.86) | 0.483 |
| HR (95% CI) | |||||||||
| Cox HR | ref | 1.06 (0.79–1.41) | 0.710 | ref | 0.93 (0.65–1.33) | 0.683 | ref | 1.18 (0.74–1.89) | 0.488 |
| HR (95% CI) | |||||||||
MVR, mitral valve replacement; HR, hazard ratio; CI, confidence interval; Crude model HR, analyzed in the univariate model, inverse probability-weighted (IPW) model HR, analyzed in IPW model; Cox HR: adjusted for demographic features, body mass index (BMI), history of hypertension, hyperlipidemia, diabetes, chronic obstructive pulmonary disease (COPD), stroke, atrial fibrillation (AF), coronary heart disease (CHD) and New York Heart Association (NYHA) class. ref refers to the reference in the model.
For AVR patients, the median follow-up time was 11.4 years, with a 15-year survival rate of 80.4% and 81.0% in the bioprosthetic and mechanical valve groups, respectively. Crude survival curves are shown in Supplementary Fig. 4. The long-term risk of mortality (Fig. 4A) and stroke (Fig. 4B) in the two types of valve among AVR patients was not significantly different [Mortality: log-rank p = 0.815, HR (95% CI): 1.12 (0.6–2.09), p = 0.725; Stroke: log-rank p = 0.537, HR (95% CI): 1.39 (0.64–3.02), p = 0.405]. Patients receiving mechanical valves had a higher risk of bleeding (Fig. 4C) compared with those with bioprosthetic valves [log-rank p = 0.03, HR (95% CI): 2.52 (1.06–5.93), p = 0.036] (Table 3).
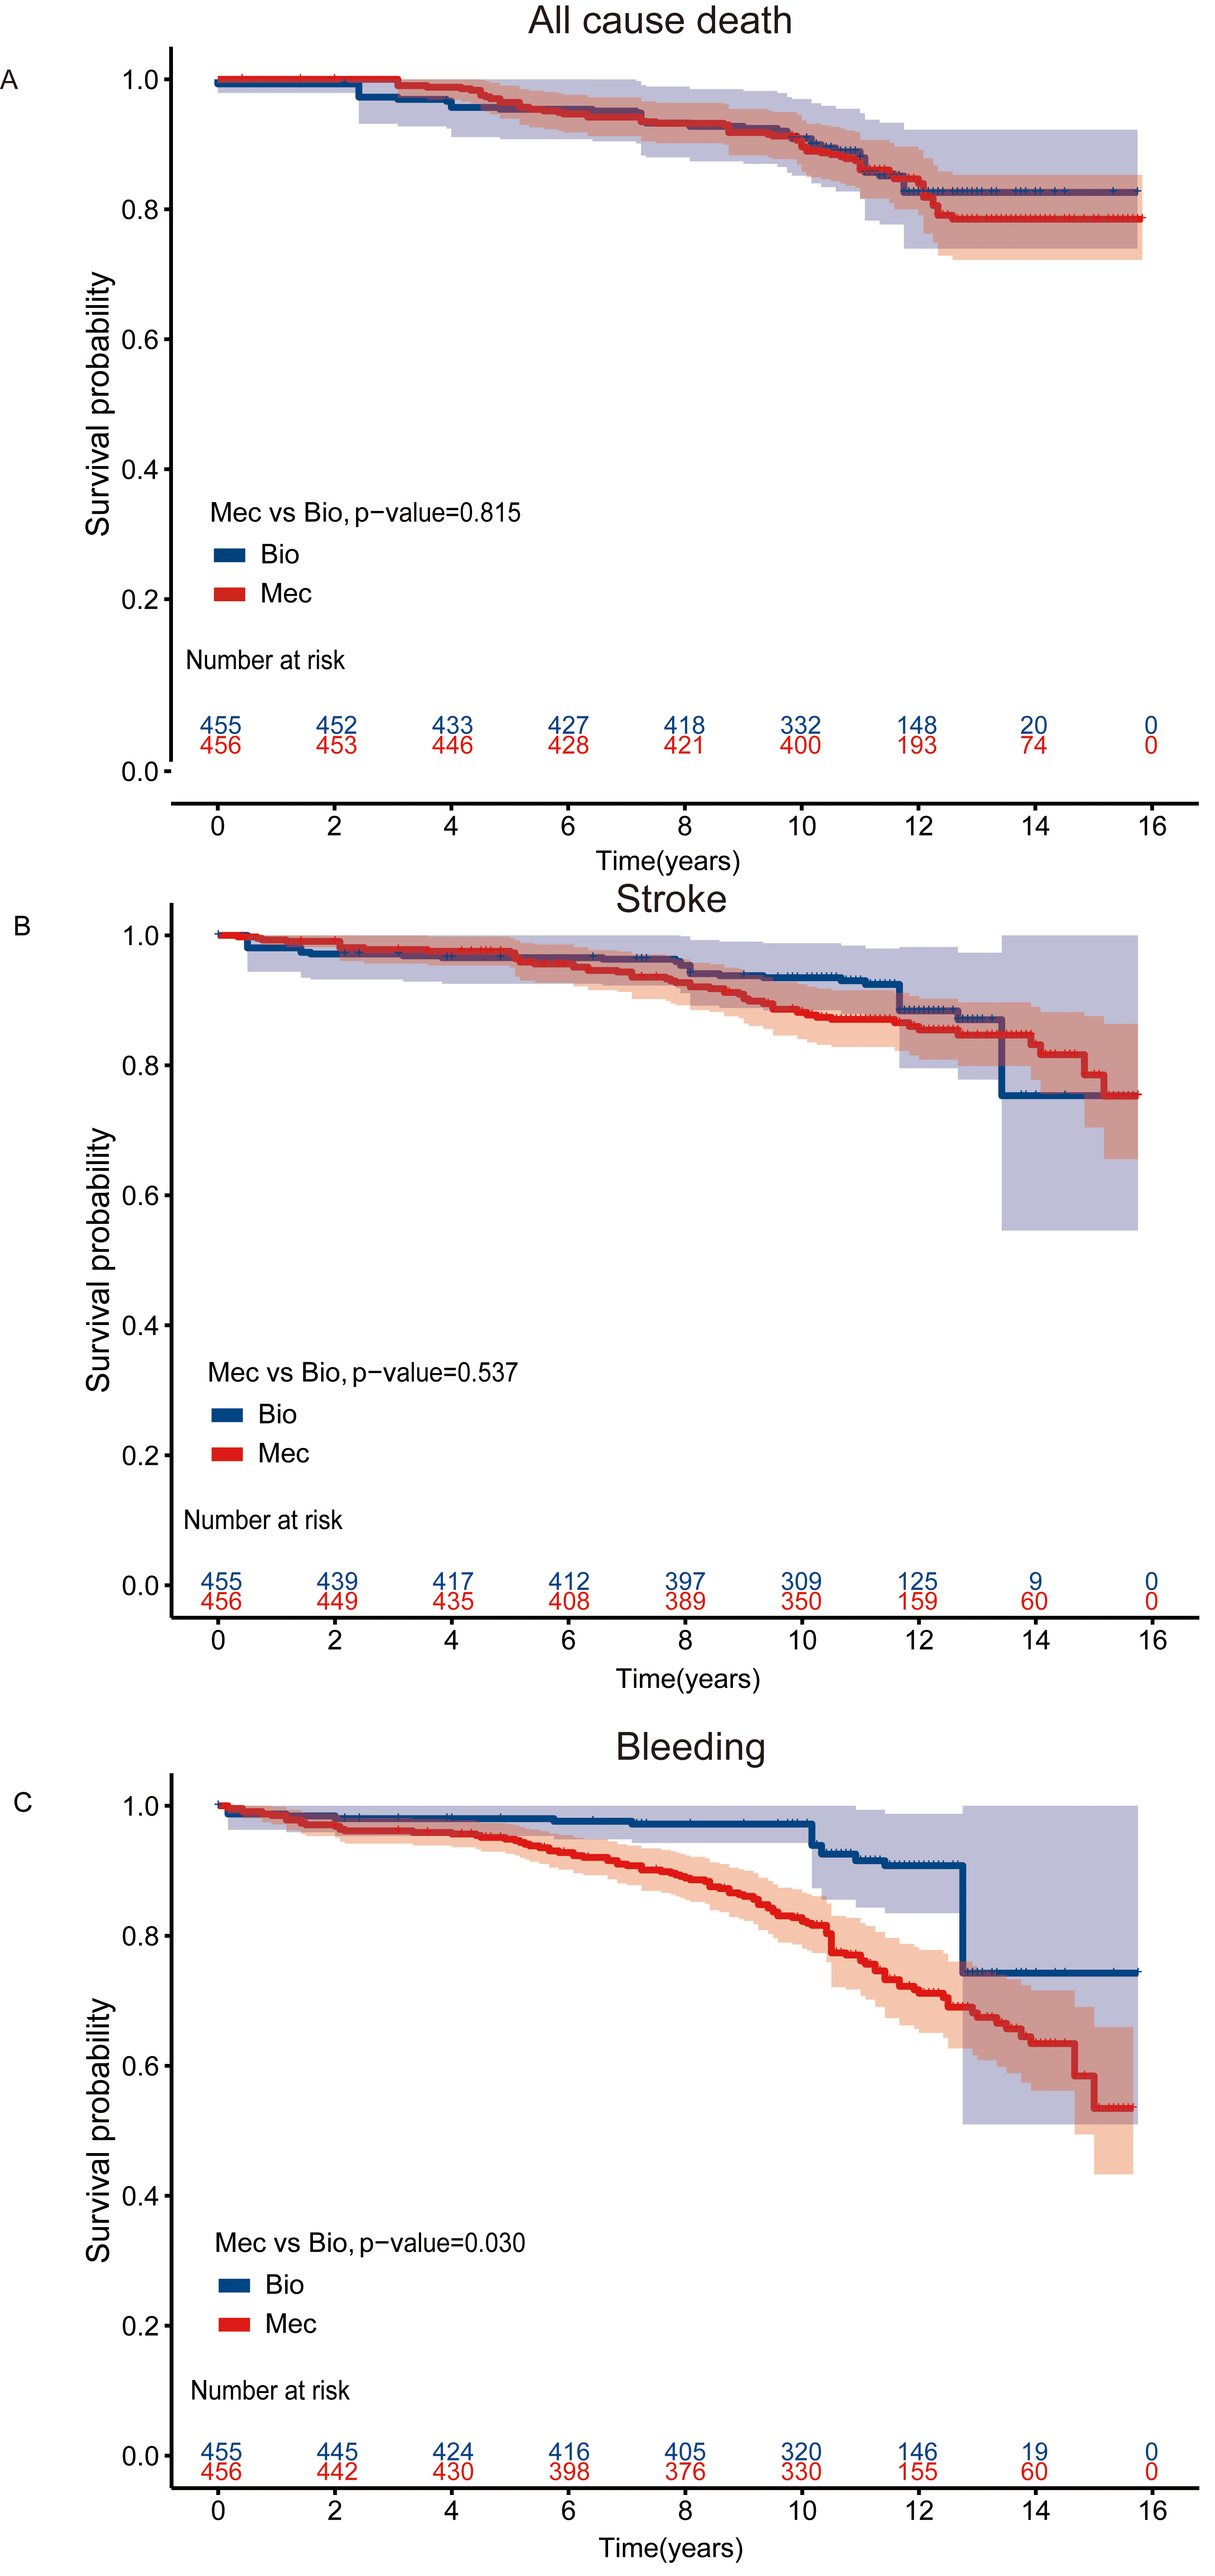 Fig. 4.
Kaplan-Meier Curves for Clinical outcomes in the AVR cohort. Kaplan-Meier curve of survival after IPW adjustment among patients aged 50–70 years who had undergone AVR (A) All cause death (B) Stroke events (C) Bleeding events. AVR, aortic valve replacement; IPW, inverse probability-weighted; Bio, bioprosthetic valves; Mec, mechanical values.
| Aortic–valve replacement (50–70 yrs) | Aortic–valve replacement (50–59 yrs) | Aortic–valve replacement (60–70 yrs) | |||||||
| Bioprosthetic (n = 134) | Mechanical (n = 324) | p-value | Bioprosthetic (n = 33) | Mechanical (n = 237) | p-value | Bioprosthetic (n = 101) | Mechanical (n = 87) | p-value | |
| Death | 23 (80.4%) | 49 (81.0%) | 0.500 | 6 (77.0%) | 34 (83.0%) | 0.500 | 17 (81.9%) | 15 (73.2%) | 1.000 |
| (15–yrs survival rate) | |||||||||
| Crude model | ref | 0.83 (0.51–1.37) | 0.469 | ref | 0.73 (0.31–1.75) | 0.482 | ref | 1.00 (0.50–2.00) | 1.000 |
| HR (95% CI) | |||||||||
| IPW model | ref | 1.12 (0.60–2.09) | 0.725 | ref | 1.00 (0.35–2.92) | 0.996 | ref | 1.11 (0.54–2.27) | 0.777 |
| HR (95% CI) | |||||||||
| Cox HR | ref | 0.84 (0.45–1.56) | 0.588 | ref | 0.55 (0.21–1.44) | 0.222 | ref | 1.12 (0.56–2.25) | 0.742 |
| HR (95% CI) | |||||||||
| Stroke (percentage) | 16 (11.9%) | 45 (13.9%) | 0.999 | 3 (9.1%) | 34 (14.3%) | 0.6 | 13 (12.9%) | 11 (12.6%) | 0.800 |
| Crude model | ref | 1.02 (0.57–1.82) | 0.950 | ref | 1.35 (0.41–4.41) | 0.623 | ref | 0.92 (0.41–2.07) | 0.842 |
| HR (95% CI) | |||||||||
| IPW model | ref | 1.39 (0.64–3.02) | 0.405 | ref | 2.02 (0.54–7.56) | 0.296 | ref | 1.31 (0.53–3.22) | 0.554 |
| HR (95% CI) | |||||||||
| Cox HR | ref | 1.09 (0.54–2.18) | 0.808 | ref | 1.098 (0.34–3.60) | 0.878 | ref | 1.69 (0.75–3.80) | 0.203 |
| HR (95% CI) | |||||||||
| Bleeding (percentage) | 10 (7.5%) | 97 (29.9%) | 4 (12.1%) | 76 (32.1%) | 0.06 | 6 (5.9%) | 21 (24.1%) | ||
| Crude model | ref | 3.97 (2.07–7.62) | ref | 2.54 (0.93–6.95) | 0.07 | ref | 4.31 (1.74–10.71) | 0.002 | |
| HR (95% CI) | |||||||||
| IPW model | ref | 2.51 (1.06–5.93) | 0.036 | ref | 2.11 (0.76–6.23) | 0.176 | ref | 3.57 (1.36–9.36) | 0.010 |
| HR (95% CI) | |||||||||
| Cox HR | ref | 3.07 (1.51–6.24) | 0.002 | ref | 2.50 (0.88–7.09) | 0.084 | ref | 3.48 (1.29–9.41) | 0.014 |
| HR (95% CI) | |||||||||
AVR, aortic valve replacement; HR, hazard ratio; CI, confidence interval; Crude model HR, analyzed in the univariate model, inverse probability-weighted (IPW) model HR, analyzed in IPW model; Cox HR: adjusted for demographic features, body mass index (BMI), history of hypertension, hyperlipidemia, diabetes, chronic obstructive pulmonary disease (COPD), stroke, atrial fibrillation (AF), coronary heart disease (CHD) and New York Heart Association (NYHA) class. ref refers to the reference in the model.
In the subgroup analysis, patients receiving a valve replacement were stratified
into “50
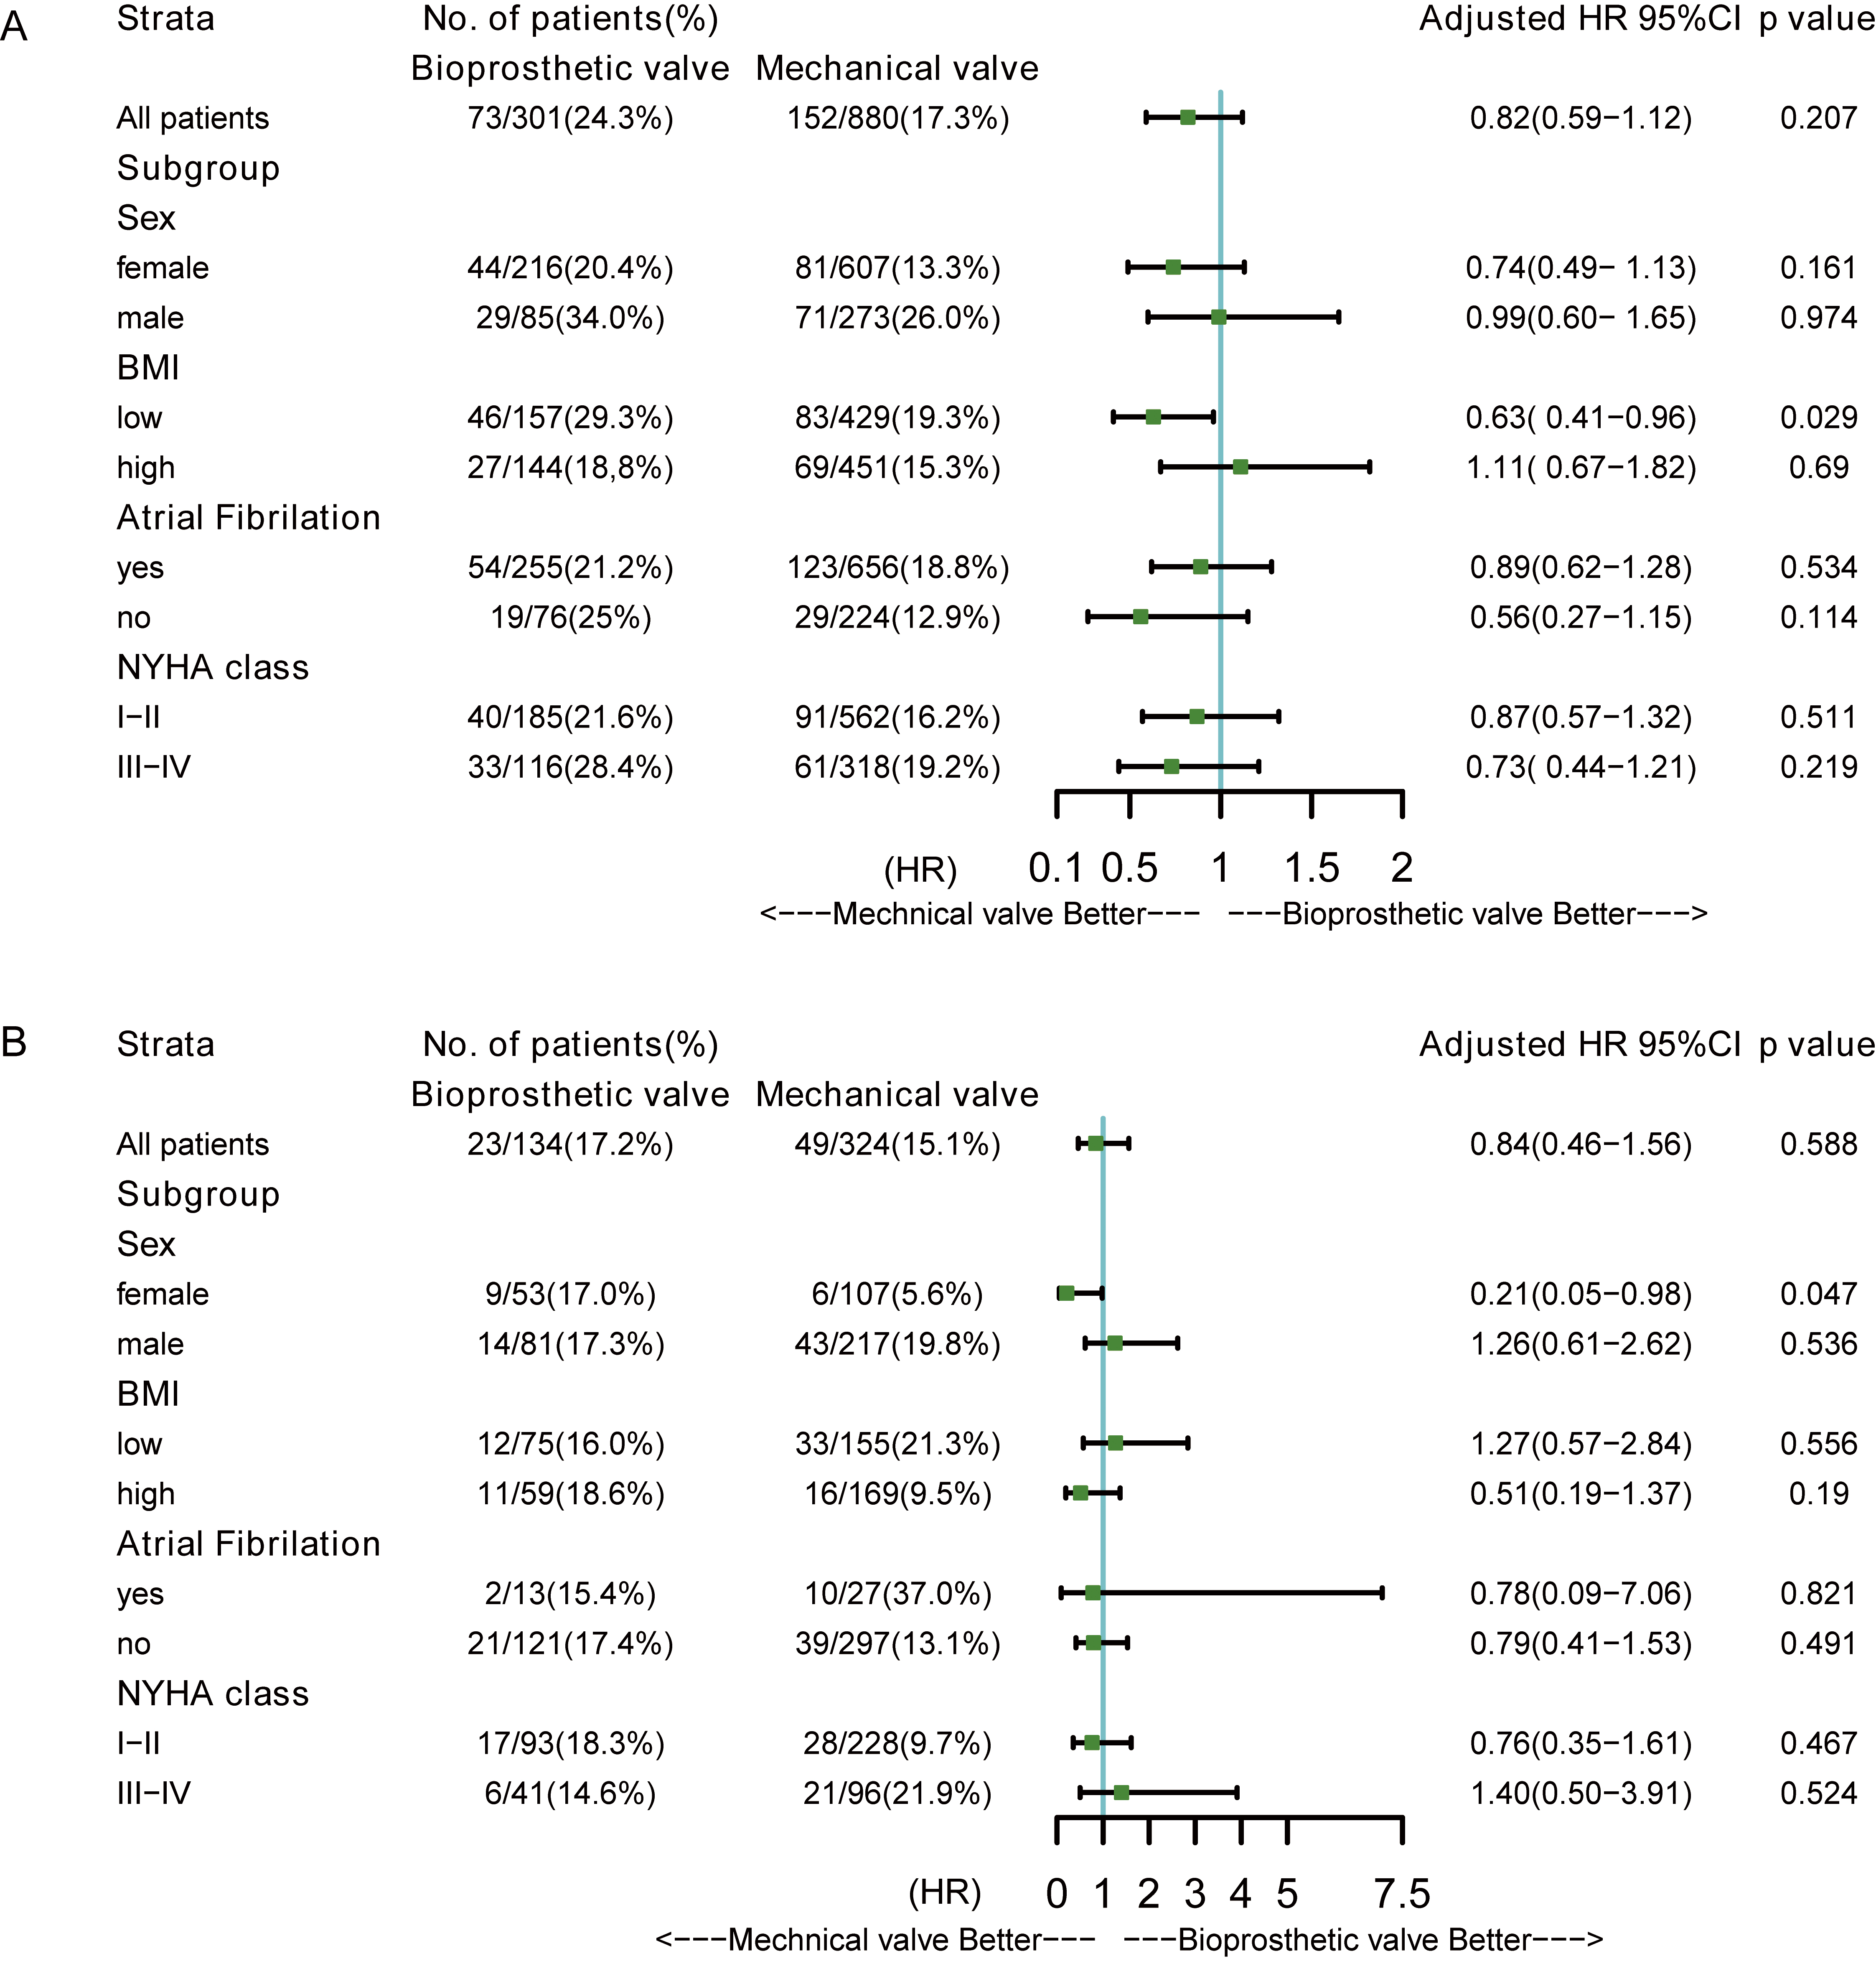 Fig. 5.
Forest plots for subgroup analysis. (A) Multivariate adjusted HR of mechanical valves versus bioprosthetic valves in MVR cohort. (B) Multivariate adjusted HR of mechanical valves versus bioprosthetic valves in AVR cohort. AVR, aortic valve replacement; MVR, mitral valve replacement; HR, hazard ratio; BMI, body mass index; NYHA, New York Heart Association.
Based on a large series of isolated MVR and AVR cohorts, the present study did not find a significant difference using IPW in overall survival rates and stroke rates between mechanical valves and bioprosthetic valves among patients between 50 and 70 years old in both MVR and AVR cohorts. However, landmark analysis revealed a significantly lower mortality in patients receiving a mechanical MVR after 12.5 years. In the AVR cohort, bioprosthetic valves were associated with a significantly lower risk of bleeding events.
In the IPW adjustment for the MVR cohorts, all the baseline characteristics were well-balanced in the MVR except for NYHA class, which had the SMD of 16.8%. We did not observe a significant difference in mortality between the mechanical and bioprosthetic groups, although the HR point estimates trended towards a benefit for mechanical valves [HR (95% CI): 0.93 (0.66–1.31)]. For the sensitivity analysis, we also performed a multivariate adjustment by the Cox model, and found that the HR of mechanical valves was in the same direction but without statistical significance [HR (95% CI): 0.82 (0.59–1.12)]. These results are in line with the previous results reported by Chikwe et al. [13]. In their retrospective cohort analysis of 3433 patients aged 50–69 years who underwent primary MVR in a single center, they found no survival difference at 15 years between the use of mechanical and bioprosthetic mitral valves [HR (95% CI): 0.95 (0.79–1.15)]. Another study of 8015 MVR patients aged 50–69 and a longer-follow-up time, found a relatively higher 15-year mortality in recipients of biologic prostheses [HR (95% CI): 1.16 (1.04–1.30)] [14]. In this study, we only included patients with isolated MVR and excluded those patients undergoing other valve surgeries and CABG. The point estimate of HR showed a similar direction, indicating bioprosthetic valves might be related to unsatisfactory long-term outcomes. This might be due to the shorter durability of bioprosthetic valves, which only last between 10–15 years [6, 15]. We also found that in the MVR cohorts, the valve type was a time-varying variable and the effect direction changed between 12 and 13 years of follow-up (Supplementary Fig. 1). Therefore, we employed a landmark analysis with the landmark time of 12.5 years. In the crude analysis and IPW adjustment, after a follow-up of 12.5 years, patients with mechanical valves had a higher survival rate, indicating that at least for those reaching the landmark year, mechanical valves for MVR might be associated with benefits over the bioprosthetic valves. This finding supports evidence for the new ESC guideline recommendations which states that mechanical protheses should be considered for those with a reasonable life expectancy and would be at risk for undergoing future valve surgery [8].
Among the current publications comparing mechanical and bioprosthetic valves, the present study is unique for using IPW to compare the outcomes of the two types of valves in the isolated MVR and AVR cohorts based on a relatively large sample size with long-term follow-up in the Chinese population. Although accumulating studies focused on the issue of valve selection in patients between 50 and 70 years [4, 16, 17], the results were mainly derived from western populations with limited evidence from Asian populations. The clinical demographics of Asian populations are quite distinct from the western population as seen in our study. There are more female patients, and a higher proportion of AF in both the mechanical and bioprosthetic MVR cohort, suggesting that the recipients of bioprosthetic valves had more risk factors. Prior to 2010, guidelines (for example ACC/AHA 2006) recommended a similar targeted range of international normalized ratio of 2.5–3.5 for warfarin among both those receiving mechanical MVR and bioprosthetic MVR with risk factors [18]. Therefore, the distinct population features in our study might be a possible explanation for our observed comparable rates of bleeding events between the two types of valves, in contrast to previously reported significantly lower bleeding rates in the bioprosthetic MVR group.
In the AVR group, no difference was observed in survival rate or stroke rate between recipients of mechanical and bioprosthetic valves, but the mechanical valves were associated with a higher likelihood of bleeding. Similar results were found by Chiang and colleagues in 4253 patients aged 50–69 years who underwent primary isolated AVR [19]. The age and sex distribution in that study was similar to ours. After PS matching, 1001 patients were paired, and the HR for death, stroke and bleeding in mechanical versus biologic prostheses were 0.97 (95% CI, 0.83–1.14), 1.04 (95% CI, 0.75–1.43) and 1.75 (95% CI, 1.27–2.43) respectively. Glaser reported a lower risk of major bleeding events [HR (95% CI): 0.49 (0.34–0.70)] in the bioprostheses group and a non-significant difference in stroke risk [HR (95% CI): 1.04 (0.72–1.50)] [20]. Despite the absence of a significant survival benefit, the higher risk of bleeding events should be considered for valve selection in an Asian population with a relatively low burden of comorbidities undergoing isolated AVR.
It is also necessary to note that the low low re-operation rate in the bioprosthetic group might also be associated with increased long-term mortality. Due to the concerns about surgical risk and economic factors, patients are not that active in the second operation. Many people choose supportive treatment. In our study, only 4 patients (2.98%) in the AVR bioprosthetic valve group and 9 patients (2.99%) in the MVR bioprosthetic valve group receive second operation for new bioprostheic valve due to the valve failure, none of whom died during the follow-up. As an alternative to surgical valve replacement, transcatheter aortic valve replacement (TAVR) is also an emerging strategy for bioprosthetic valve replacement in the intermediate-to-low-risk population. Recent studies have also indicated that TAVR is a safe procedure, with low rates of in hospital death and severe complications in mid-term follow-up for patients under 70 years old [21]. Therefore, in the population between 50 and 70 years old, a TAVR might be a reasonable choice considering the lower rate of major bleeding events and surgical risk. Furthermore, valve-in-valve technology was introduced as an alternative to surgical valve replacement opportunities to patients with valve failure after bioprosthetic valve replacement. Retrospective studies have also demonstrated early benefits of valve in valve technique in patients presenting with failed aortic and mitral bioprostheses [22, 23]. But more data, longer follow-up times, and multicenter studies are needed in the future to evaluate its efficiency, efficacy and benefits compared with the surgical valve replacement.
We explored the primary and secondary outcomes in different age subgroups and
did not observe a significant difference between the mechanical and prosthetic
groups in both the MVR and AVR cohorts except for a higher risk of bleeding in
those older patients (60–70 years old) receiving mechanical aortic valves. In
subgroups, after multivariate adjustment, we found a relatively lower risk of
mortality in mechanical valve recipients compared with those receiving
bioprosthetic valves in those undergoing MVR with a lower BMI (less than 23.4
kg/m
Compared to other studies analyzing patients with valve replacement, our study has the longest follow-up and the largest sample size in China. Given that patients in a national center come from a variety of areas and are associated with diverse demographic characteristics, our findings may, to a certain extent, reflect and represent the overall state of long-term survival rate of patients following valve replacement in China. Both IPW and multivariate cox models were used to adjust the cofounders to strengthen the results.
In any retrospective study, there may be residual confounding owing to unmeasured variables although the inverse probability weighting method addressed the issue of selection bias. The main outcomes evaluated in this study were long-term mortality as well as stroke and bleeding events following surgery, while the data related to postoperative valve failure and reoperation, or quality of life were limited. Furthermore, since the sample size in the AVR cohort was limited, there might be a risk of overfitting in the multivariate model in the subgroup analysis. Though the primary outcomes were obtained through telephone contact or query on the resident death registration system, we could not rule out the possibility that patients who were lost during the long-term follow-up had experienced subsequent events that were not captured in our study.
In summary, in this study we did not observe significant differences in the long-term survival rates and stroke rates of Chinese patients aged 50–70 with bioprosthetic or mechanical valves for MVR or AVR. However, those mechanical mitral valve recipients who were followed for over 12.5 years showed a lower mortality while the recipients of bioprosthetic aortic valves displayed a lower risk for long-term bleeding events. The life expectancy and risk of undergoing future valve surgery should be considered when selecting the biroprosthetic valves for MVR while the need for anticoagulation medication and the risk of bleeding should not be ignored when selecting mechanical aortic valves. Additional long-term follow-up is needed to more adequately assess the lifetime risks of different types of valve prostheses.
All data generated or analyzed during this study are included in this published article.
ZZ, LH, WF contributed to conceptualization. ZZ designed the work. WZ, ZLC, SPC, YZ, HSS help and advice on methodology. WZ, ZLC, SPC, JZD & HZ, YZ, HSS, LH, WF tackled investigation. ZZ, JZD & HZ, YZ, HSS focused on data curation. WZ, ZLC, SPC sacrificed a lot for data acquisition and formal analysis. ZZ, WZ, ZLC, SPC Interpreted data for the work. ZZ reviewed and edited the work. WZ, ZLC, SPC completed the original draft. WZ, ZLC, SPC, JZD & HZ reviewed and edited the draft. WZ, ZLC, YZ, LH, WF, HSS & ZZ revised the manuscript critically for the results and discussion. All authors read and approved the final manuscript. All authors have participated sufficiently in the work and agreed to be accountable for all aspects of the work.
The Ethics Committee of Fuwai Hospital approved this research (Approval NO.2017-880). All patients provided written informed consent before the study inclusion.
Not applicable.
This research was funded by National Major research and development Project for “Major Chronic Non-Communicable Diseases”, 2016YFC1302000.
The authors declare no conflict of interest.
Publisher’s Note: IMR Press stays neutral with regard to jurisdictional claims in published maps and institutional affiliations.