
- Academic Editor
Background: Elevated levels of troponin-I (TnI) are common in
out-of-hospital cardiac arrest (OHCA) patients. However, studies evaluating the
prognostic value of TnI clearance in OHCA patients are lacking. We aimed to
examine how TnI clearance (TnI-C) differed according to the neurological outcome
group and mortality group at 6 months. Methods: This retrospective
observational study involved adults (
Although progress in post-cardiac arrest management has improved clinical outcomes, including in targeted temperature management (TTM) and goal-directed therapies, the prognosis for most patients suffering out-of-hospital cardiac arrest (OHCA) remains poor [1, 2, 3]. Guidelines recommend a multimodal prognostic approach in cardiac arrest survivors to promote the patient’s prognostication [1]. Of the available prognostic tools, biomarkers have the advantage of being minimally affected by sedatives.
Troponin testing has high sensitivity and specificity for myocardial injury, while elevated troponin levels are common after OHCA since myocardial injury occurs [4, 5]. However, in several studies, the initial troponin level did not reflect the prognosis of OHCA patients [5, 6, 7]. Conversely, lactate may also be related to myocardial ischemia, while lactate clearance was related to OHCA prognosis in previous studies [8, 9, 10]. While troponin clearance has been associated with patient prognosis in several severe diseases [11, 12], studies evaluating troponin clearance for the prognosis of OHCA patients are lacking.
We hypothesized that a lower troponin clearance after the return of spontaneous circulation (ROSC) is related to a poor neurological outcome or mortality in OHCA patients. Therefore, we aimed to investigate any differences in troponin clearance between neurological outcome groups and mortality groups 6 months after cardiac arrest.
This retrospective observational study involved adult (age
Comatose cardiac arrest patients underwent TTM according to the written
guideline-based protocol. Patients were cooled to a target temperature of 32–36 °C, avoiding a fever
Data related to the following variables were obtained from each patient’s
hospital records: age, sex, body mass index, preexisting illnesses, witnessed
collapse, bystander cardiopulmonary resuscitation (CPR), first on-scene monitored
rhythm, time from sudden cardiac arrest to ROSC, and calculated Sequential Organ
Failure Assessment (SOFA) score within 24 hours of admission. Serum laboratory
values, such as lactate and glucose levels, and results from arterial blood gas
analyses, such as partial pressure of oxygen (PaO
Blood samples were drawn to measure the TnI levels between 6 and 12 (T1), 12 and
18 (T2), 24 and 30 (T3), and 48 and 54 (T4) hours after ROSC. Additional TnI
measurements were taken according to the physician’s discretion. The serum TnI
measurement method used in this study was the high-sensitivity one-step
immunoassay with an analytical range of 0 to 0.05 ng/mL (ADVIA
Centaur® XP/XPT, Siemens AG, Munich, Germany). Peak TnI levels
were expressed according to the time from ROSC as follows: before 24 (TnI1st); 24
to 48 (TnI2nd); 48 to 72 (TnI3rd) hours. The TnI clearances (TnI-C) were
calculated as ((TnI1st – TnI2nd)/TnI1st)
Neurological outcomes and mortality were evaluated 6 months after ROSC through structured telephone interviews with patients or their caregivers [14]. A neurological outcome was evaluated via the cerebral performance category (CPC) scale (CPC 1, good performance; CPC 2, moderate disability; CPC 3, severe disability; CPC 4, vegetative state; or CPC 5, brain death or death) [15]. The primary outcome was a poor neurological outcome at 6 months, defined as CPC 3, 4, or 5. The secondary outcome was mortality at 6 months.
We presented the categorical variables as frequencies and percentages, and we
illustrated continuous variables as the mean
We performed a multivariable logistic regression analysis to identify the
association between TnI-C and poor neurological outcome or mortality at 6 months.
Variables with p-values
During the study period, 249 OHCA patients were treated with TTM. Fig. 1 provides an overview of the study. A total of 227 patients were involved in the study. Their median age was 62.0 (50.0–71.0) years, and the median downtime was 27.0 (17.0–43.0) minutes (Table 1). Of the patients included, 150 (66.1%) had a witnessed collapse, 138 (60.8%) received bystander CPR, 93 (41.0%) had a shockable monitored rhythm, and 135 (59.5%) had a cardiac etiology. Poor neurological outcomes and death at 6 months were reported in 150 (66.1%) and 118 (52.0%) patients, respectively.
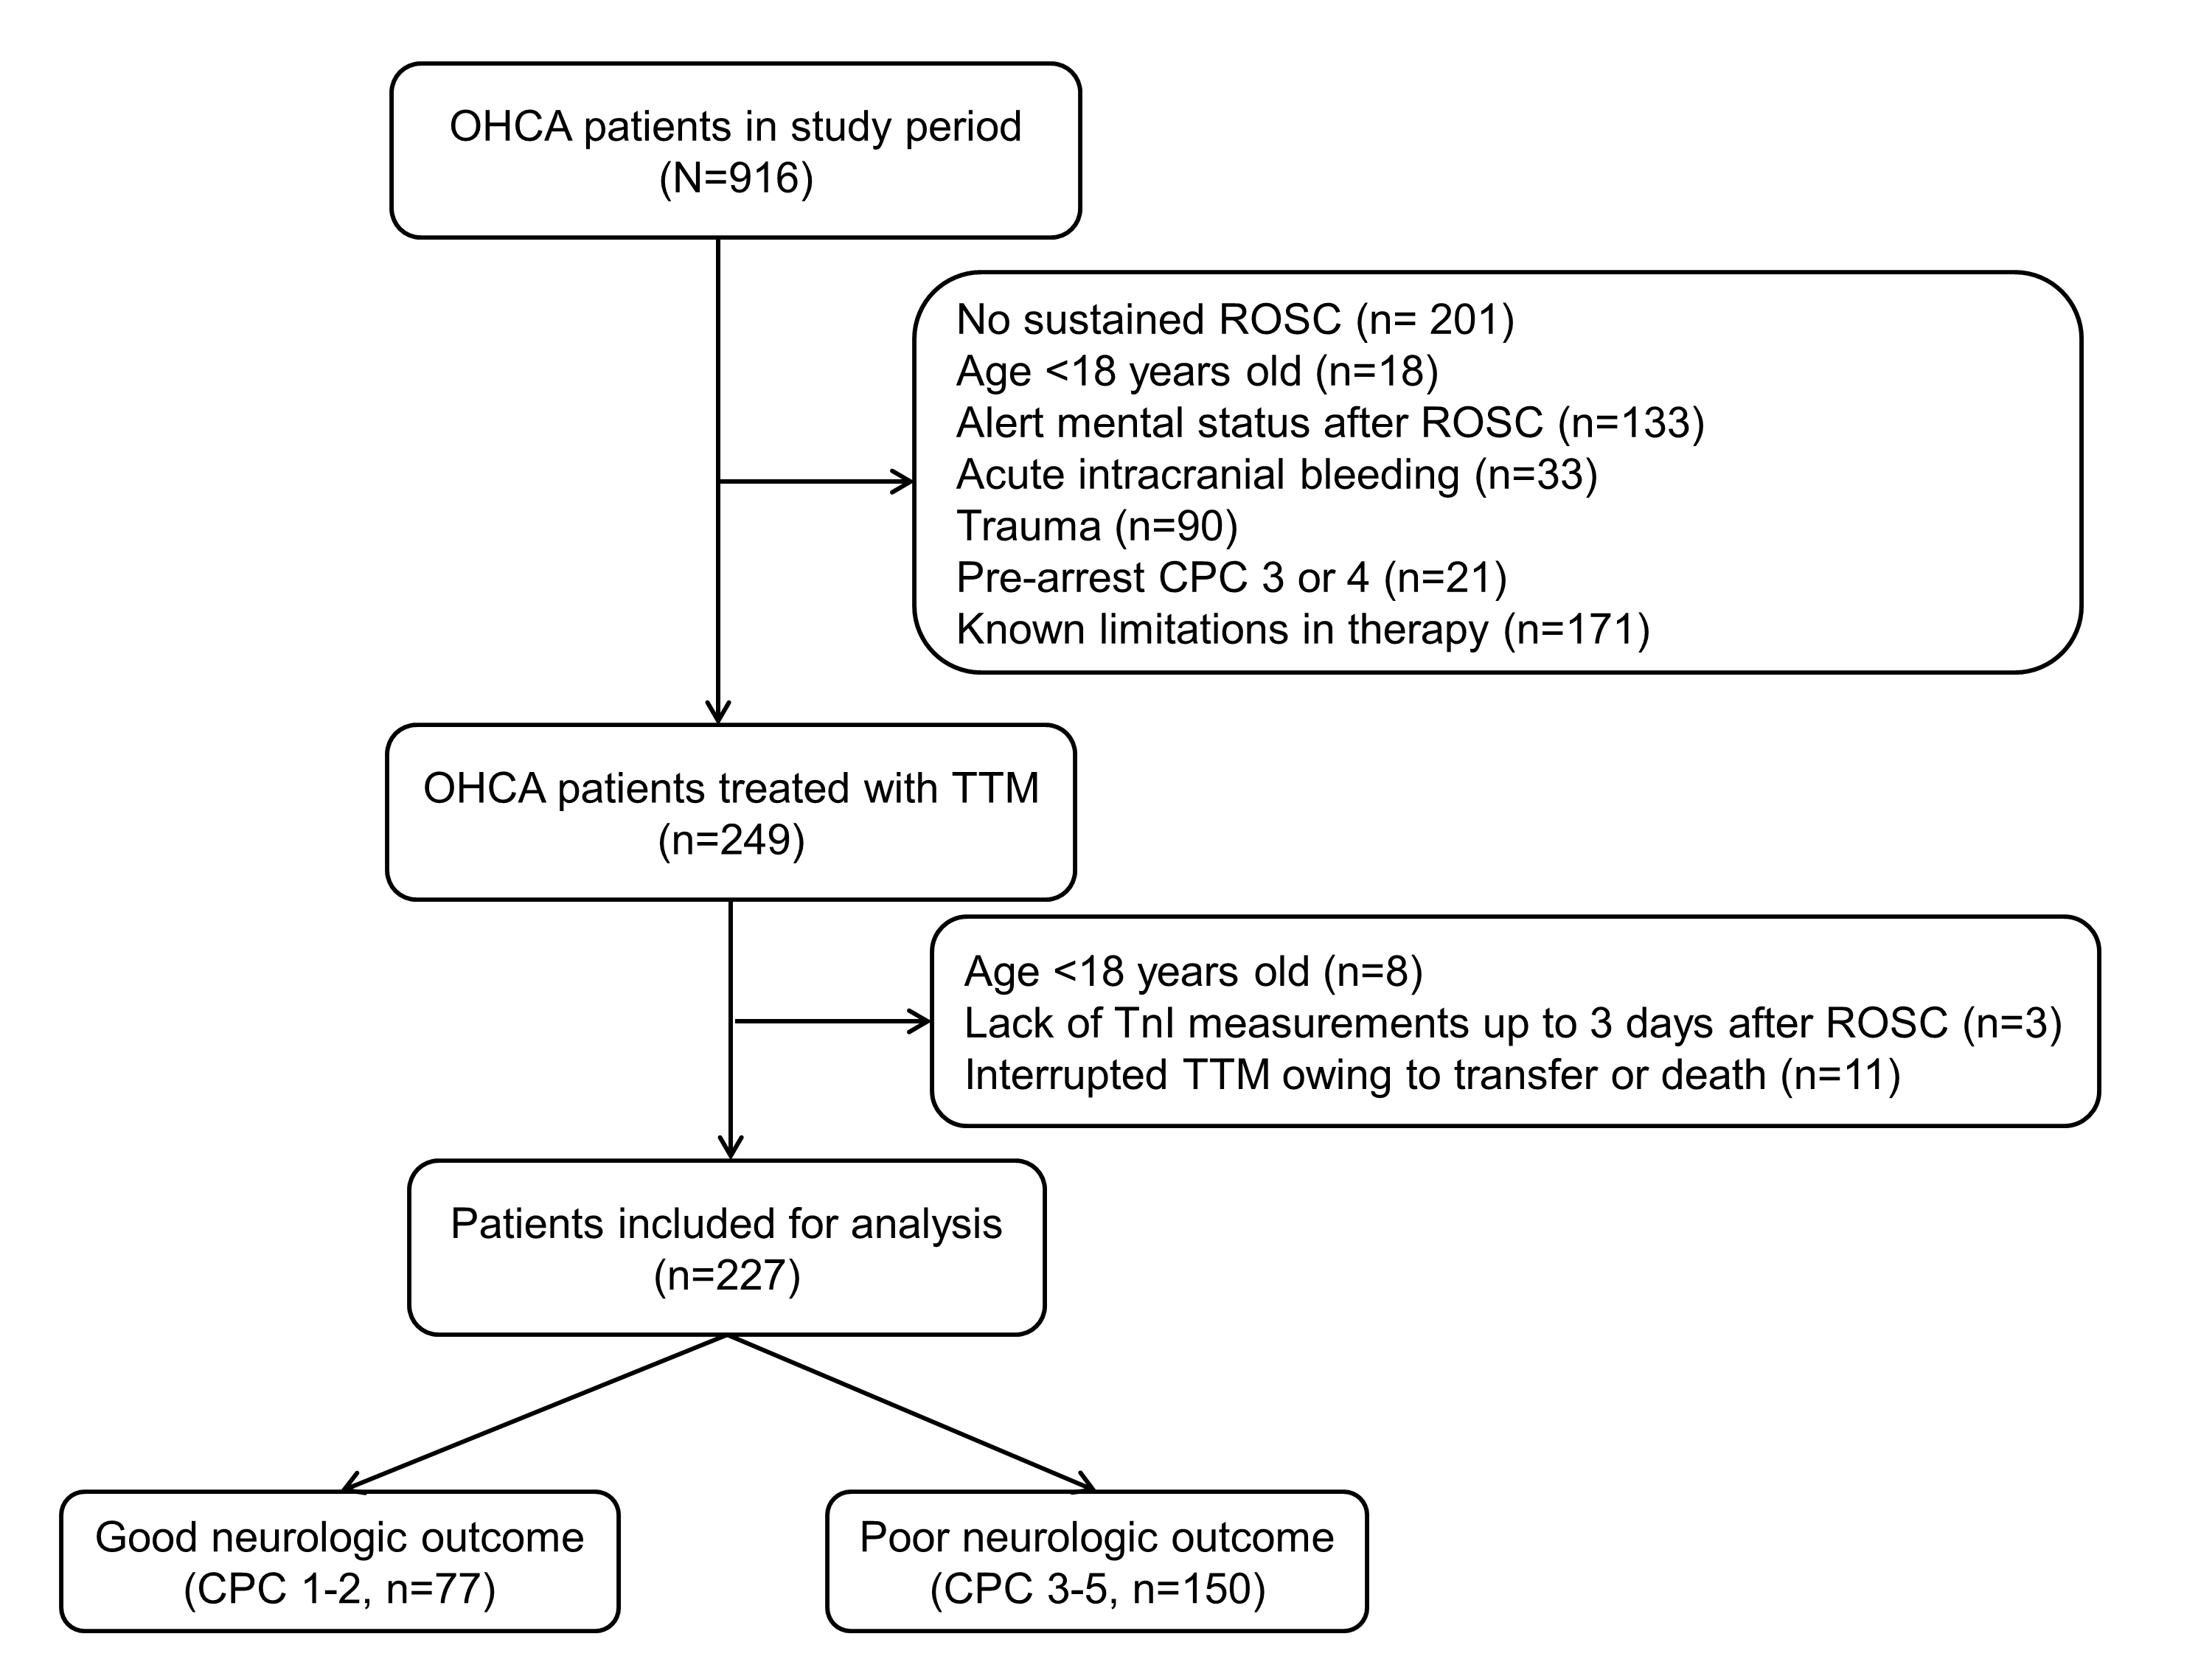 Fig. 1.
Schematic diagram showing the number of out-of-hospital cardiac arrest patients. OHCA, out-of-hospital cardiac arrest; ROSC, return of spontaneous circulation; CPC, cerebral performance category; TTM, targeted temperature management.
| Variables | Total (n = 227) | Neurological outcomes at 6 months | Mortality at 6 months | |||||
| Good (n = 77) | Poor (n = 150) | p | Survivors (n = 109) | Non-survivors (n = 118) | p | |||
| Demographics | ||||||||
| Age, years | 62.0 (50.0–71.0) | 57.0 (44.5–66.5) | 66.0 (52.8–75.0) | 59.0 (47.0–69.5) | 66.5 (51.8–75.0) | |||
| Male, n (%) | 165 (72.7) | 57 (74.0) | 108 (72.0) | 0.867 | 85 (78.0) | 80 (67.8) | 0.116 | |
| Body mass index, kg/m |
23.5 (21.1–23.5) | 24.2 (22.5–26.4) | 23.1 (20.6–25.1) | 0.003 | 23.7 (21.6–25.9) | 23.4 (20.8–25.8) | 0.003 | |
| Preexisting illness, n (%) | ||||||||
| Coronary artery disease | 42 (18.5) | 15 (19.5) | 27 (18.0) | 0.927 | 21 (19.3) | 21 (17.8) | 0.909 | |
| Congestive heart failure | 9 (4.0) | 3 (3.9) | 6 (4.0) | 1.000 | 4 (3.7) | 5 (4.2) | 1.000 | |
| Hypertension | 113 (49.8) | 27 (35.1) | 86 (57.3) | 47 (43.1) | 66 (55.9) | 0.072 | ||
| Diabetes | 68 (30.0) | 12 (15.6) | 56 (37.3) | 26 (23.9) | 42 (35.6) | 0.074 | ||
| Renal impairment | 21 (9.3) | 3 (3.9) | 18 (12.0) | 0.080 | 7 (6.4) | 14 (11.9) | 0.236 | |
| Cardiac arrest characteristics | ||||||||
| Witnessed collapse, n (%) | 150 (66.1) | 58 (75.3) | 92 (61.3) | 0.050 | 79 (72.5) | 71 (60.2) | 0.069 | |
| Bystander CPR, n (%) | 138 (60.8) | 52 (67.5) | 86 (57.3) | 0.178 | 74 (67.9) | 64 (54.2) | 0.049 | |
| Shockable rhythm, n (%) | 93 (41.0) | 59 (76.6) | 34 (22.7) | 71 (65.1) | 22 (18.6) | |||
| Cardiac etiology, n (%) | 135 (59.5) | 66 (85.7) | 69 (46.0) | 84 (77.1) | 51 (43.2) | |||
| Time to ROSC, min | 27.0 (17.0–43.0) | 19.0 (14.0–27.0) | 31.5 (21.5–47.3) | 20.0 (14.0–35.0) | 31.5 (22.0–48.0) | |||
| Characteristics after ROSC | ||||||||
| Lactate, mmol/L | 8.2 (5.0–11.4) | 6.4 (6.2–9.6) | 9.4 (6.0–12.2) | 6.7 (4.1–9.5) | 9.6 (6.0–12.2) | |||
| Glucose, mg/dL | 262 (186–331) | 249 (187–305) | 274 (186–349) | 0.310 | 254 (190–309) | 274 (184–361) | 0.418 | |
| PaO |
143.0 (87.0–243.0) | 125.5 (77.5–224.5) | 163.5 (91.8–253.3) | 0.076 | 138.0 (81.7–237.0) | 162.0 (89.0–248.5) | 0.452 | |
| PaCO |
44.0 (34.0–63.0) | 38.0 (32.8–44.0) | 51.9 (35.8–70.0) | 38.9 (32.9–49.0) | 53.5 (37.8–70.0) | |||
| SOFA score | 11 (10–13) | 10 (9–12) | 12 (10–14) | 11 (9–12) | 12 (10–14) | |||
CPR, cardiopulmonary resuscitation; ROSC, return of spontaneous circulation;
PaO
Table 1 compares baseline characteristics between the neurological outcome and
mortality groups. Compared to patients with a poor neurological outcome, patients
with a good neurological outcome were younger and had lower incidence of
comorbidities (hypertension and diabetes), a higher incidence of shockable
monitored rhythm and cardiac etiology, shorter downtimes, lower lactate, and
PaCO
Table 2 compares the TnI levels and TnI-C between neurological outcome and
mortality groups. The TnI1st was higher in patients with a good neurological
outcome than in patients with a poor neurological outcome (Table 2). There were
no differences in the TnI levels between survivors and non-survivors. Survivors
and patients with a good neurological outcome had a higher TnI1st compared with
non-survivors and patients with a poor neurological outcome (Table 2). The
proportion of patients with a TnI-C1st
| Variables | Total (n = 227) | Neurological outcomes at 6 months | Mortality at 6 months | ||||
| Good (n = 77) | Poor (n = 150) | p | Survivors (n = 109) | Non-survivors (n = 118) | p | ||
| TnI1st, ng/mL | 4.07 (0.88–19.53) | 5.06 (1.84–29.96) | 2.79 (0.77–13.94) | 0.039 | 4.73 (0.98–25.73) | 2.79 (0.84–11.95) | 0.185 |
| TnI2nd, ng/mL | 1.72 (0.42–10.11) | 2.84 (0.57–13.28) | 1.45 (0.41–9.45) | 0.215 | 2.47 (0.41–13.28) | 1.46 (0.43–9.17) | 0.475 |
| TnI3rd, ng/mL | 1.20 (0.24–7.80) | 1.62 (0.28–9.98) | 0.98 (0.21–7.40) | 0.281 | 1.61 (0.24–9.98) | 1.00 (0.24–7.54) | 0.581 |
| TnI-C1st, % | 45.5 (23.1–62.6) | 54.4 (33.6–71.0) | 42.3 (17.3–57.7) | 0.001 | 52.1 (30.1–65.9) | 42.7 (17.3–55.9) | 0.015 |
| TnI-C1st |
131 (57.7) | 33 (42.9) | 98 (65.3) | 0.002 | 52 (47.7) | 79 (66.9) | 0.005 |
| TnI-C2nd, % | 37.0 (15.7–51.7) | 43.0 (16.0–54.7) | 35.9 (10.1–51.1) | 0.306 | 40.5 (21.6–52.0) | 32.4 (8.1–51.9) | 0.170 |
| TnI-C2nd |
158 (69.6) | 52 (67.5) | 106 (70.7) | 0.739 | 76 (69.7) | 82 (69.5) | 1.000 |
TnI, troponin-I; TnI-C, troponin-I clearance.
Table 3 shows the association between TnI-C and poor neurological outcome or
mortality at 6 months. Age, shockable monitored rhythm, time to ROSC, and
PaCO
| Variables | Neurological outcomes at 6 months | Mortality at 6 months | ||
| Adjusted OR (95% CI) |
p | Adjusted OR (95% CI) |
p | |
| TnI1st, ng/mL | 1.003 (0.994–1.012) | 0.489 | 1.006 (0.998–1.015) | 0.138 |
| TnI2nd, ng/mL | 1.008 (0.997–1.018) | 0.158 | 1.009 (1.000–1.019) | 0.060 |
| TnI3rd, ng/mL | 1.008 (0.997–1.020) | 0.157 | 1.011 (1.000–1.022) | 0.051 |
| TnI-C1st, % | 1.194 (0.602–2.368) | 0.612 | 1.027 (0.614–1.718) | 0.919 |
| TnI-C1st |
2.078 (1.080–3.995) | 0.028 | 2.131 (1.114–4.078) | 0.022 |
| TnI-C2nd, % | 1.479 (0.837–2.614) | 0.178 | 1.098 (0.674–1.789) | 0.707 |
| TnI-C2nd |
1.255 (0.623–2.528) | 0.524 | 1.233 (0.615–2.469) | 0.555 |
Each variable was individually entered into the final model and analyzed separately.
OR, odds ratio; CI, confidence interval; TnI, troponin-I; TnI-C, troponin-I
clearance; PaCO
Supplementary Table 3 shows the association between the TnI-related
variables and the patients’ renal impairment due to a preexisting illness. The
TnI1st, TnI2nd, TnI3rd, and TnI-C1st in patients without renal impairment were
higher compared with patients with renal impairment. The proportion of patients
with a TnI-C1st of
In this retrospective cohort study of OHCA patients treated with TTM, we found
that the TnI-C1st after ROSC was lower in patients with a poor neurological
outcome and in non-survivors at 6 months than in those with a good neurological
outcome and survivors. After adjusting for potential confounders, TnI-C1st
In the present study, the TnI levels were higher than normal in most OHCA patients after ROSC. While previous studies have also reported elevated TnI levels after cardiac arrest [4, 6, 16], the peak TnI level exhibited at admission was lower than in the present study. The time to ROSC and the proportion of patients with a shockable rhythm during either arrest, witnessed arrest, or bystander CPR may help explain this difference, although this information was not available in every study. Various mechanisms can cause elevated TnI levels, such as secondary ischemic injury to the heart during cardiac arrest, the effects of defibrillation, acute myocardial infarction due to coronary artery occlusion, and cardiogenic shock after ROSC [17, 18, 19]. However, in OHCA patients, the relationship between elevated TnI levels and prognosis is controversial [6, 20]. In a single-center retrospective cohort study of OHCA patients, the peak TnI level was neither associated with in-hospital mortality nor poor neurological outcome at discharge [6]. Another study reported an association between high troponin levels and survival to discharge in OHCA patients with elevated ST [20]. A multivariable analysis in the present study showed that elevated TnI levels up to 3 days after ROSC were neither associated with poor neurological outcome nor mortality at 6 months in OHCA patients.
Although TnI-C1st did not have a linear relationship with the outcome of
OHCA patients in the present study, a TnI-C1st
In the present study, TnI1st was higher in patients with a good neurological outcome compared with patients with a poor neurological outcome; a similar trend was observed in survivors and non-survivors. It may seem paradoxical that the TnI levels, which are related to myocardial ischemia, were higher in the good outcome group since TnI is specific for coronary artery disease [26]. Previous studies have shown that patients whose OHCA has a cardiac origin, including coronary artery disease, have a better prognosis than patients whose OHCA is non-cardiac in origin [27]. Simply, it is not possible to determine OHCA severity or prognosis using a TnI level taken at a single time point instead of examining changes in the TnI level. The TnI-C can help select patients who may need more intensive treatment by identifying their OHCA severity.
In this study, patients with renal impairment due to a preexisting illness had a lower TnI-C compared with patients without renal impairment. Previous studies have shown that the TnI values frequently rise and fall slowly in patients with renal disease, even those without coronary artery disease [28]. However, we do not believe that renal impairment due to a preexisting illness influenced this study’s findings because for renal impairment to affect the TnI-C, the peak TnI value must also be high. However, in this study, patients with renal impairment had lower peak TnI values than those without, making it difficult to conclude that renal impairment was affected. In addition, renal impairment due to a preexisting illness was not related to a poor neurological outcome or mortality of patients at 6 months post-OHCA.
This study has several limitations. First, as this was a single-center retrospective observational study, multicenter studies with larger sample sizes are warranted to assess generalizability and causality. Second, our study did not analyze TnI levels immediately after ROSC since blood sampling was delayed because of patients being transferred after treatment at another hospital or initial intensive treatment. Third, although we tried, we could not measure TnI at the designated time in our study, making it impossible to confirm the relationship between changes in TnI level over time and patient prognosis. However, because TnI levels were collected within a maximum of 6 hours from the designated time and presented through the peak value, the associated error is not expected to be substantial. Fourth, there were three patients whose TnI could not be measured. Although this number was small, selection bias may have occurred because these patients were excluded. Fifth, the OHCA patients who did not undergo TTM were excluded from this study. Most of the OHCA patients who did not undergo TTM were transferred to other hospitals without being hospitalized at our hospital, and their long-term prognosis could not be accurately measured. Therefore, we decided to exclude the OHCA patients who did not undergo TTM from this study. Sixth, although we investigated renal impairment due to a preexisting illness and TnI-related variables, these relationships do not fully explain the effect of renal impairment on the TnI-related variables in OHCA patients. Furthermore, this study did not investigate whether an acute kidney injury occurred post-resuscitation or if continuous renal replacement therapy was administered. Thus, further research is needed to clarify this in the future. Finally, 11 patients were withdrawn from the study because of interrupted TTM after transfer or death, which may have led to selection bias.
In OHCA patients, a TnI-C1st
All data generated or analyzed during this study are included in this article and its supplementary material files. Further inquiries can be directed to the corresponding author.
These should be presented as follows: DHL, BKL and SJR designed the research study. DHL, BKL and SJR performed the research. SJR provided help and advice on the study. DHL and BKL analyzed the data. All authors contributed to editorial changes in the manuscript. All authors read and approved the final manuscript. All authors have participated sufficiently in the work and agreed to be accountable for all aspects of the work.
Informed consent was waived because this was a retrospective study. This was approved by the Chonnam National University Hospital Institutional Review Board (CNUH-2023-139).
Not applicable.
This study was supported by a grant (BCRI-23087) of Chonnam National University Hospital Biomedical Research Institute.
The authors declare no conflict of interest.
Publisher’s Note: IMR Press stays neutral with regard to jurisdictional claims in published maps and institutional affiliations.