
- Academic Editors
Background: To identify the decrease in estimated glomerular filtration
rate (eGFR) as an independent risk factor associated with ventricular
tachyarrhythmias (VTA). Methods: This retrospective file review
collected information from patients diagnosed with acute myocardial infarction
(AMI), with and without VTA, from January 2017 to December 2019. We first applied
the chi-square test to assess 12 risk factors and one outcome variable (incident
rate of VTA). Next, all the 12 risk factors were further adjusted using the
propensity score matching (PSM) method to simulate the dataset as a randomized
controlled cohort, which can reduce the defects derived from confounding factors
and the imbalance in baseline characteristics. To investigate the relationship
between eGFR and VTA, univariate logistic regression analysis was applied to the
cohort before and after PSM analysis. Results: A total of 503 patients
diagnosed as AMI were included in the study. There were eight of twelve risk
factors in baseline characteristics with a p-value
Ventricular tachyarrhythmias (VTA), encompassing ventricular tachycardia (VT), ventricular flutter, and ventricular fibrillation (VF), represents life-threatening complications that frequently manifest in the aftermath of acute myocardial infarction (AMI). The occurrence of VTA brings about a significant medical challenge, given the association with a substantial proportion of sudden cardiac deaths (SCD). In-hospital mortality approaches 20 percent or more in patients who accompany with VTA following by AMI [1, 2]. Rapid identification and treatment of high-risk patients susceptible to VTA is paramount in clinical cardiology. The interplay between renal function and cardiac disease is a subject of intricate reciprocity which could be summarized as cardiorenal syndrome (CRS). It describes a spectrum of disorders involving both the heart and kidneys in which acute or chronic dysfunction in one organ may induce acute or chronic dysfunction in the other organ [3]. Impaired renal function is increasingly recognized as a risk factor for adverse cardiovascular events including SCD [4, 5]. In this context, the estimated glomerular filtration rate (eGFR) emerges as a pivotal biological marker. Beyond its conventional role as an indicator of renal health, eGFR assumes significance as a predictive factor for cardiovascular events.
This premise leads us to a critical research question: Dose decrease in eGFR is
an independent risk factor of the occurrence of VTA in patients with AMI? A brief
retrospective review of existing literature reveals Anna C van der Burgh
demonstrated that every 10 mL/min/1.73 m
In this research, we employ the propensity score matching (PSM) method, which attempts to adjust post hoc for recognized unbalanced factors at baseline such that the data once analyzed will hopefully approximate or indicate what a prospective randomized dataset. It is well-regarded for its capacity to enhance the robustness of observational studies, allowing for an ideal assessment of correlation of interested variables in situations where randomized controlled trials may not be feasible [7]. Thus, the study aims to systematically explore the association between eGFR and VTA in the context of AMI rigorously, and provide more supporting evidence to the prevention of SCD.
The research was a retrospective cohort study and approved by the ethics committee of the Affiliated Hospital of Guangdong Medical University. Since to the retrospective nature of the analysis, the need for informed consent was waived.
Our team reviewed the information of hospitalized patients in electronic medical
system that the primary discharge diagnosis as AMI, fulfilling the fourth
universal definition of myocardial infarction (2018) [8] as inclusion criteria,
from January 2017 to December 2019. We focus on the incident rate of VTA among
the AMI patients. In this study, the diagnosis of VTA was validated through
electrocardiogram (ECG) monitoring, Holter monitoring, or medical rescue
treatment records. VTA refers to ventricular fibrillation, ventricular flutter,
and sustained and non-sustained ventricular tachycardia, regardless of the
presence of hemodynamic disorder. Thus, the symptoms of the patients suffering
from VTA were heterogeneous, ranging from asymptomatic to sudden cardiac death,
even with positive rescue treatment. Meanwhile, there were 13 kinds of variables
were record, following as Age, Sex, Diabetes history, Hypertension history, Type
of AMI, Number of diseased vessels, High-sensitivity troponin T (hs-TNT),
N-terminal prohormone of brain natriuretic peptide (NT-proBNP), Percutaneous
coronary intervention (PCI) treatment timing, Left ventricular ejection fraction,
Hypokalemia, Infection during hospitalization and eGFR. The definitions and
specific description of these 13 variables were listed in Table 1 (Ref.
[1, 9, 10]). The case with incomplete clinical information of the 13 variables
would be excluded. Given the retrospective design, our approach involved the
comprehensive inclusion of clinical samples based on strict adherence to the
inclusion and exclusion criteria. The cohort was divided into two groups base on
the value of eGFR (eGFR
| Variables | Definition |
| 1. Age | |
| 2. Sex | Female/Male |
| 3. Diabetes history | Yes/No |
| 4. Hypertension history | Yes/No |
| 5. Type of AMI | ST elevated myocardial infarction (STEMI) |
| Non-ST elevated myocardial infarction (NSTEMI) | |
| 6. Number of diseased vessels | Single vessel/Double vessels/Triple vessels |
| 7. hs-TNT | Less than 5 times the threshold ( |
| More than 5 times the threshold (0.50 ng/mL–1.00 ng/mL) | |
| More than 10 times the threshold ( | |
| 8. NT-proBNP | Normal threshold |
| Less than 5 times the threshold | |
| More than 5 times the threshold | |
| 9. PCI treatment timing | Without PCI treatment in hospitalized |
| PCI treatment timing | |
| PCI treatment timing in 24 h | |
| 10. Left ventricular ejection fraction | |
| 11. Hypokalemia | Yes ( |
| 12. Infection during hospitalization | Yes/No |
| 13. eGFR | |
hs-TNT, high-sensitivity troponin T; AMI, acute myocardial infarction;
NT-proBNP, N-terminal prohormone of brain natriuretic peptide; PCI, percutaneous
coronary intervention; eGFR, estimated glomerular filtration rate.
Note: Risk factors definition interpretation.
1. Number of diseased vessels: The number of diseased vessels was determined
based on coronary angiography findings in three main cardiac vessels: the left
main artery to the left anterior descending branch, the left circumflex artery,
and the right coronary artery. A single lesion vessel was characterized by a main
vessel or one of its branches with more than 75% stenosis. Meanwhile,
double-lesion vessels were identified when a main vessel, along with another main
vessel and/or its branches, showed more than 75% stenosis. The presence of more
than 75% stenosis in all three main vessels and/or their branches classified
them as triple-lesion vessels [1, 9].
2. hs-TNT and NT-proBNP: The reference intervals of hsTnT were as: normal
3. PCI treatment timing: The timing of PCI was calculated from the admission of
the patient to the completion of the PCI procedure, as documented in the
operation record.
4. Left ventricular ejection fraction (LVEF): The intervals of LVEF (
5. Infections during hospitalization, such as catheter-related infections or
pneumonia, were defined based on whether they were accompanied by fever symptoms
and/or antibiotic therapy.
6. eGFR: There were five intervals of eGFR: 90–120 mL/min/1.73 m
The 12 variables (Age, Sex, Diabetes history, Hypertension history, Type of AMI,
Number of diseased vessels, hs-TNT, NT-proBNP, PCI treatment timing, Left
ventricular ejection fraction, Hypokalemia, Infection during hospitalization) and
one outcome variable (incident rate of VTA) were recorded as categorical
variables and were expressed as numbers and percentages by the Chi-square test.
The variables with p-value
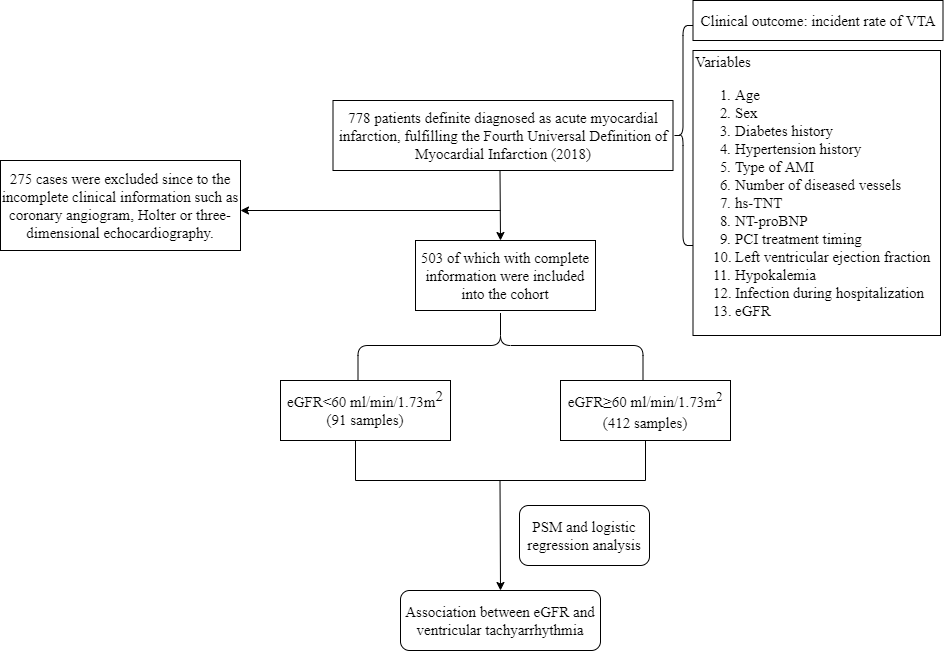 Fig. 1.
The flowchart of the study. hs-TNT, high-sensitivity troponin T; AMI, acute myocardial infarction; NT-proBNP, N-terminal prohormone of brain natriuretic peptide; PCI, percutaneous coronary intervention; VTA, ventricular tachyarrhythmias; eGFR, estimated glomerular filtration rate; PSM, propensity score matching.
According to the statistic, there were totally 778 patients clearly diagnosis as
AMI during the period. However, 275 cases of which were excluded since to the
incomplete clinical information primarily centered on coronary angiogram, Holter
or three-dimensional echocardiography. Among the 503 samples including in this
study cohort, 91 had suffered kidney damage with a decrease in eGFR below 60
mL/min/1.73 m
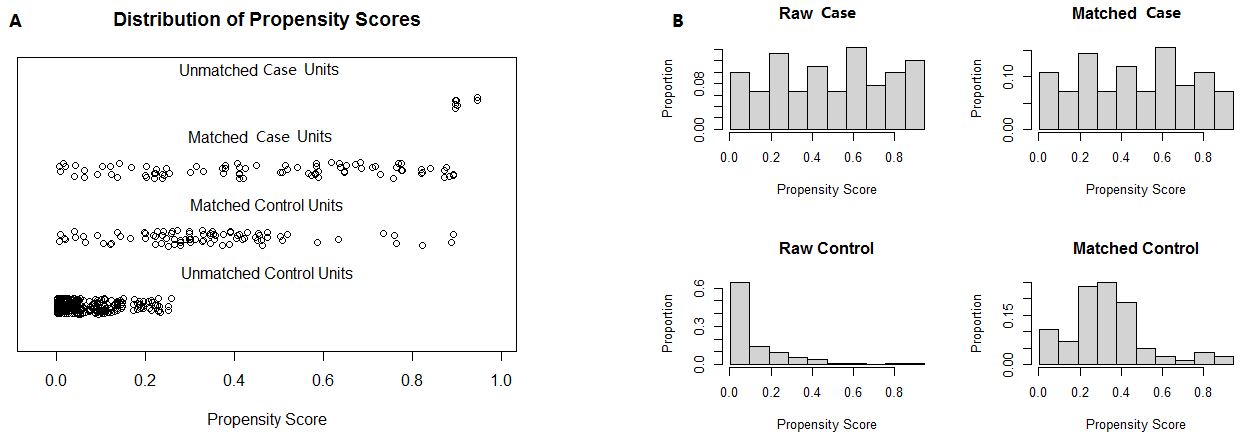 Fig. 2.
The result of PSM analysis illustrated by scatter plot and histogram. Note: (A) is a scatter plot, while (B) is a histogram. The case and control samples were imbalanced in the raw dataset and were adjusted by PSM analysis. PSM, propensity score matching.
| Variables | Before PSM analysis | After PSM analysis | |||||||
| Total (n = 503) | eGFR |
eGFR |
p-value | Total (n = 172) | eGFR |
eGFR |
p-value | ||
| Age, n (%) | 0.821 | ||||||||
| 71 (14.11) | 5 (5.49) | 66 (16.02) | 12 (6.98) | 5 (5.82) | 7 (8.14) | ||||
| 60 y–75 y | 244 (48.51) | 35 (38.46) | 209 (50.73) | 66 (38.37) | 34 (39.53) | 32 (37.21) | |||
| 188 (37.38) | 51 (56.05) | 137 (33.25) | 94 (54.65) | 47 (54.65) | 47 (54.65) | ||||
| Sex, n (%) | 0.745 | 0.871 | |||||||
| Female | 176 (35.00) | 30 (32.97) | 146 (35.44) | 56 (32.56) | 27 (31.40) | 29 (33.72) | |||
| Male | 327 (65.00) | 61 (67.03) | 266 (64.56) | 116 (67.44) | 59 (68.60) | 57 (66.28) | |||
| STEMI, n (%) | 1.000 | 1.000 | |||||||
| No | 265 (52.68) | 48 (52.75) | 217 (52.67) | 86 (50.00) | 43 (50.00) | 43 (50.00) | |||
| Yes | 238 (47.32) | 43 (47.25) | 195 (47.33) | 86 (50.00) | 43 (50.00) | 43 (50.00) | |||
| Number of diseased vessels, n (%) | 0.391 | ||||||||
| Single vessel | 250 (49.70) | 12 (13.19) | 238 (57.77) | 29 (16.86) | 12 (13.95) | 17 (19.77) | |||
| Double vessels | 149 (29.62) | 34 (37.36) | 115 (27.91) | 71 (41.28) | 34 (39.54) | 37 (43.02) | |||
| Triple vessels | 104 (20.68) | 45 (49.45) | 59 (14.32) | 72 (41.86) | 40 (46.51) | 32 (37.21) | |||
| PCI treatment timing, n (%) | 0.356 | ||||||||
| No PCI treatment | 85 (16.90) | 35 (38.46) | 50 (12.13) | 52 (30.23) | 30 (34.88) | 22 (25.58) | |||
| PCI treatment timing |
192 (38.17) | 20 (21.98) | 172 (41.75) | 46 (26.74) | 20 (23.26) | 26 (30.23) | |||
| PCI treatment timing in 24 h | 226 (44.93) | 36 (39.56) | 190 (46.12) | 74 (43.03) | 36 (41.86) | 38 (44.19) | |||
| Hypokalemia, n (%) | 0.492 | 0.121 | |||||||
| No | 470 (93.44) | 87 (95.60) | 383 (92.96) | 168 (97.67) | 82 (95.34) | 86 (100) | |||
| Yes | 33 (6.56) | 4 (4.40) | 29 (7.04) | 4 (2.33) | 4 (4.66) | 0 (0) | |||
| Diabetes history, n (%) | 0.756 | ||||||||
| No | 387 (76.94) | 50 (54.95) | 337 (81.80) | 103 (59.88) | 50 (58.14) | 53 (61.63) | |||
| Yes | 116 (23.06) | 41 (45.05) | 75 (18.20) | 69 (40.12) | 36 (41.86) | 33 (38.37) | |||
| Hypertension history, n (%) | 0.739 | 0.878 | |||||||
| No | 298 (59.24) | 52 (57.14) | 246 (59.71) | 98 (56.98) | 50 (58.14) | 48 (55.81) | |||
| Yes | 205 (40.76) | 39 (42.86) | 166 (40.29) | 74 (43.02) | 36 (41.86) | 38 (44.19) | |||
| Infection, n (%) | 0.081 | ||||||||
| No | 414 (82.31) | 49 (53.85) | 365 (88.59) | 110 (63.95) | 49 (56.98) | 61 (70.93) | |||
| Yes | 89 (17.69) | 42 (46.15) | 47 (11.41) | 62 (36.05) | 37 (43.02) | 25 (29.07) | |||
| NT-proBNP, n (%) | 0.097 | ||||||||
| Normal | 137 (27.24) | 9 (9.89) | 128 (31.07) | 25 (14.53) | 9 (10.46) | 16 (18.60) | |||
| Less than 5 times threshold | 264 (52.49) | 33 (36.26) | 231 (56.07) | 70 (40.70) | 32 (37.21) | 38 (44.19) | |||
| More than 5 times threshold | 102 (20.27) | 49 (53.85) | 53 (12.86) | 77 (44.77) | 45 (52.33) | 32 (37.21) | |||
| LVEF, n (%) | 0.144 | ||||||||
| 300 (59.64) | 31 (34.07) | 269 (65.29) | 66 (38.37) | 29 (33.72) | 37 (43.02) | ||||
| 40%–50% | 170 (33.80) | 43 (47.25) | 127 (30.83) | 84 (48.84) | 42 (48.84) | 42 (48.84) | |||
| 33 (6.56) | 17 (18.68) | 16 (3.88) | 22 (12.79) | 15 (17.44) | 7 (8.14) | ||||
| hs-TnT, n (%) | 0.373 | ||||||||
| Less than 5 times threshold | 109 (21.67) | 15 (16.48) | 94 (22.82) | 35 (20.35) | 15 (17.44) | 20 (23.26) | |||
| More than 5 times threshold | 168 (33.40) | 15 (16.48) | 153 (37.13) | 34 (19.77) | 15 (17.44) | 19 (22.09) | |||
| More than 10 times threshold | 226 (44.93) | 61 (67.04) | 165 (40.05) | 103 (59.88) | 56 (65.12) | 47 (54.65) | |||
| Outcome status, n (%) | |||||||||
| Non-VTA | 429 (85.29) | 55 (60.44) | 374 (90.78) | 128 (74.42) | 54 (62.79) | 74 (86.05) | |||
| VTA | 74 (14.71) | 36 (39.56) | 38 (9.22) | 44 (25.58) | 32 (37.21) | 12 (13.95) | |||
hs-TnT, high-sensitivity troponin T;
NT-proBNP, N-terminal prohormone of brain natriuretic peptide; PCI, percutaneous
coronary intervention; VTA, ventricular tachyarrhythmias; LVEF, left ventricular
ejection fraction; eGFR, estimated glomerular filtration rate; PSM, propensity score matching; STEMI, ST elevated myocardial infarction.
Note:
Univariate (eGFR) logistic regression analysis was performed to develop a model
based on the original cohort and the cohort after PSM. The OR of the cohort were
6.442 (95% CI = 3.770–11.05), and 3.654 (95% CI = 1.764–7.993) before and
after PSM analysis, respectively (Table 3). Meanwhile, the ROC curve of eGFR in
the cohort before and after PSM were illustrated as Fig. 3. The area under the curve (AUC) of ROC curve
before PSM was 0.692 (95% CI = 0.649–0.732), with sensitivity as 48.65% (95%
CI = 36.9%–60.6%), specificity as 87.18% (95% CI = 83.6%–90.2%). The AUC
of ROC curve after PSM was 0.653 (95% CI = 0.576–0.724), with sensitivity as
72.73% (95% CI = 57.2%–85%), specificity as 57.81% (95% CI =
48.8%–66.5%). The result proved that a decrease in eGFR (
| Variable | Odds ratio (95% CI) | p-value | ||
| Before PSM analysis | ||||
| eGFR ( |
–2.287 | 0.102 (0.072–0.140) | ||
| eGFR ( |
1.863 | 6.442 (3.770–11.05) | ||
| After PSM analysis | ||||
| eGFR ( |
–1.819 | 0.162 (0.084–0.287) | ||
| eGFR ( |
1.296 | 3.654 (1.764–7.993) | ||
Note:
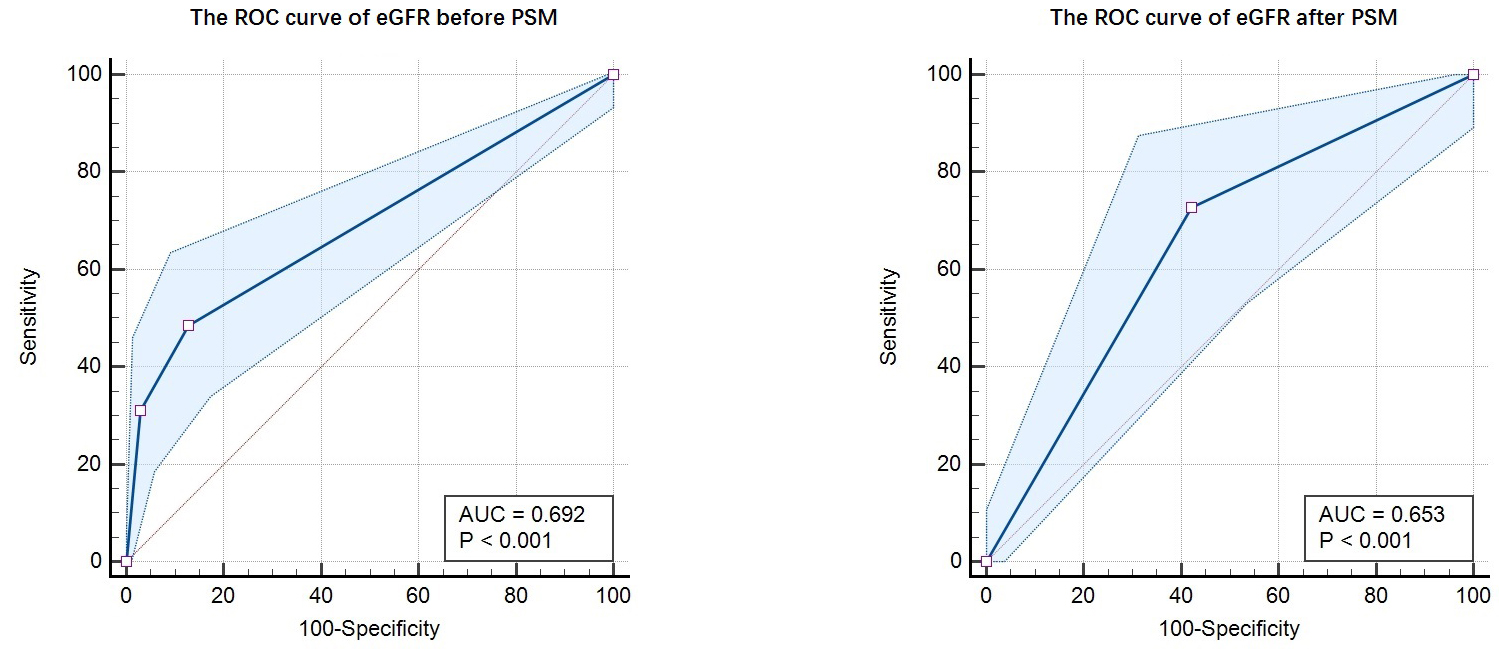 Fig. 3.
The ROC curve of eGFR before and after PSM. Note: The AUC of ROC curve before PSM was 0.692 (95% CI = 0.649–0.732), with sensitivity as 48.65% (95% CI = 36.9%–60.6%), specificity as 87.18% (95% CI = 83.6%–90.2%). The AUC of ROC curve after PSM was 0.653 (95% CI = 0.576–0.724), with sensitivity as 72.73% (95% CI = 57.2%–85%), specificity as 57.81% (95% CI = 48.8%–66.5%). ROC, receiver operating characteristic; eGFR, estimated glomerular filtration rate; AUC, area under the curve; PSM, propensity score matching.
The definition and classification of chronic kidney disease (CKD) based on
glomerular filtration rate (GFR), raised in 2002 and acknowledged since 2004, has
been followed until today [12, 13]. eGFR is a common indicator based on serum
creatinine levels, age, sex and cystatin C (according to the 2012 Chronic Kidney Disease Epidemiology Collaboration (CKD-EPI)
cystatin C equation), which is ideal for reflecting kidney function and is
considered an alternative to GFR in clinical practice [14]. The relationship
between kidney damage and major adverse cardiovascular events remains a concern
for researchers. In this study, we aimed to explore the relationship between the
decrease in eGFR and the incidence rate of VTA in AMI patients. The PSM method
was applied to simulate the cohort as a randomized controlled trial, to reduce
the effects of different confounding factors. The result of PSM analysis showed
that 86 of 91 patients with renal dysfunction were matched. The univariate (eGFR)
logistic regression analysis demonstrated that the OR of the original cohort was
6.442 (95% CI = 3.770–11.05), and the OR of the cohort after PSM analysis was
3.654 (95% CI = 1.764–7.993). The study concluded that the decrease in eGFR
(
According to previous studies, CKD is considered to be one of the strongest risk
factors for the development of cardiovascular disease [15]. The prevalence of
cardiovascular disease among patients older than 65 years of age with CKD in the
United States is 64.5%, compared with only 32.4% among those without CKD [16].
Several meta-analyses with large samples have shown that a decrease in eGFR
(
Cardiac structural remodeling and electrophysiological changes in patients with CKD are the main causes of fatal arrhythmias. Sympathetic hyperactivity is evident at the earliest stage of CKD, which can trigger adratic-related ventricular tachyarrhythmias in susceptible individuals and is directly related to the progression of renal failure [23, 24]. Several studies have demonstrated that renal denervation can decrease the susceptibility of the heart to ventricular fibrillation, in dog and rabbit CKD models [25, 26]. Cardiac structural remodeling includes left ventricular hypertrophy (LVH) and myocardial fibrosis. LVH is easily detected on electrocardiography or echocardiography. The Framingham study followed more than 3000 samples over 14 years and concluded that SCD in the normal population was 1.64%, while SCD in the LVH population was up to 21.5% [27]. Overactivity of the renin–angiotensin–aldosterone system (RAAS) is the most important mechanism of myocardial hypertrophy as it can promote vasoconstriction, cardiac ischemia, myocardial apoptosis, and fibrosis, which are fundamental to ventricular tachyarrhythmias [28]. Myocardial fibrosis is a common pathological state in various cardiac diseases and is an essential cause of ventricular tachyarrhythmia caused by reentrant activity and initiation trigger mechanisms. Cardiac magnetic resonance imaging can directly reflect the degree of myocardial fibrosis through late gadolinium enhancement (LGE) [29]. Multiple clinical studies and meta-analyses have shown that ventricular fibrosis detected using LGE is a powerful predictor of SCD events in patients with ischemic heart disease, dilated cardiomyopathy, and hypertrophic cardiomyopathy [30, 31, 32]. Moreover, ventricular arrhythmias and SCD in patients with ESRD may be related to sharp changes in blood pressure, hypovolemia, and electrolyte disturbance caused by dialysis treatment [33, 34].
Nevertheless, some limitations need to be mentioned. First, this was a single-center retrospective study and the selective bias was inevitable. Moreover, the risk factors related to VTA were numerous, while the study did not cover certain aspects, such as body mass index, drug treatment, the location of the culprit’s vessel, and history of heart failure.
The result of our study has demonstrated the decrease in eGFR (
eGFR, estimated glomerular filtration rate; VTA, ventricular tachyarrhythmia; AMI, acute myocardial infarction; PSM, propensity score matching; OR, odds ratio; CI, confidence interval; LVEF, left ventricular ejection fraction; ESRD, end-stage renal disease; CKD, chronic kidney disease.
The datasets used and/or analyzed during the current study are available from the corresponding author on reasonable request.
ML and CZ were involved in the conception, statistics, article writing and revision. ZH was responsible for the conception, statistics and scientific supervision. XZ and CC were involved in data collection. All authors contributed to editorial changes in the manuscript. All authors read and approved the final manuscript. All authors have participated sufficiently in the work and agreed to be accountable for all aspects of the work.
The study and waiver of informed consent was approved by the Ethics Committee of the Affiliated Hospital of Guangdong Medical University (KT2023-062-01). Informed consent was waived due to the retrospective nature of the analysis. All methods were carried out in accordance with relevant guidelines and regulations (Declaration of Helsinki). Researchers tried their best to protect the information from disclosure.
We would like to thank Burcu from Editage (www.editage.cn) for English language editing.
The research was funded by “Affiliated Hospital of Guangdong Medical University Clinical Research Program, No. LCYJ2022B004”.
The authors declare no conflict of interest.
Publisher’s Note: IMR Press stays neutral with regard to jurisdictional claims in published maps and institutional affiliations.