
- Academic Editor
Background: An example of a sodium-glucose cotransporter-2 (SGLT-2)
inhibitor is Empagliflozin. It is a new medicine for treating type 2 diabetes
mellitus (T2DM), but there is increasing interest in how empagliflozin affects
the heart. This study aims to examine the impact of empagliflozin treatment on
ventricular repolarization parameters in T2DM patients. Methods: T2DM
patients were included in a prospective study. Measurements of ventricular
repolarization parameters, including QT interval, corrected QT interval (QTc), QT
dispersion (QTd), Tpeak-to-Tend interval (Tp-e), and Tpeak-to-Tend interval
corrected for QTc (Tp-e/QTc), were obtained before initiating empagliflozin
treatment and six months following treatment initiation. Statistical analysis was
performed to assess changes in these parameters. Results: In this study,
95 patients were diagnosed with T2DM out of 177 patients. Among T2DM patients, 40
were male (42%) compared to 48% males in controls (p = 0.152). The
average age of the T2DM patients was 60.2
There has been a consistent increase in the global occurrence of type 2 diabetes mellitus (T2DM). It is predicted that there will be 500 million people with diabetes by 2035, and that one in three people could have T2DM by 2050 [1, 2]. T2DM is a significant cause of cardiovascular disease [3]. T2DM also damages the heart’s conduction system, leading to cardiac neuropathy, which affects around a third of people with T2DM [1]. This damage can increase sympathetic nervous system activity, potentially affecting cardiac repolarization and causing fatal ventricular arrhythmias, independent of disorders like hypertension, coronary artery disease (CAD), or heart failure [2].
Metabolic and mechanical abnormalities in CAD can lead to a greater degree of repolarization dispersion, which in some cases may be the basis for ventricular arrhythmias. The QT interval, as seen in electrocardiography, represents the repolarization of the heart. Numerous studies have shown that the QT interval represents potentially fatal ventricular arrhythmias [4, 5]. In addition to the QT interval, changes in the QT dispersion and T wave are also used to assess arrhythmias [6]. Research suggests that the difference between the highest and lowest points of the T wave (Tp-e) on the electrocardiogram (ECG) is more sensitive than the QT interval in predicting fatal ventricular arrhythmias [7, 8, 9]. In addition, it has been determined that the Tp-e/QT ratio is an important indicator of ventricular arrhythmias [6].
Compelling evidence has been offered in recent studies regarding the efficacy of sodium-glucose co-transporter 2 (SGLT-2) inhibitors in preventing cardiovascular complications [10, 11, 12]. In particular, the EMPA-REG (Empagliflozin Cardiovascular Outcome Event Trial in Type 2 Diabetes Mellitus Patients-Removing Excess Glucose) study demonstrated how empagliflozin was effective in reducing hospitalizations related to both glycemic control as well as heart failure in people with T2DM [13]. SGLT2 inhibitors significantly reduce mortality, major adverse cardiac events, nonfatal heart attacks and heart failure in T2DM patients, according to a meta-analysis. Interestingly, different SGLT-2 inhibitor subtypes appear similarly beneficial [11]. However, the effect of SGLT-2 inhibitors on cardiac electrical activity and the risk of ventricular arrhythmias is unclear.
The objective of this study is to investigate the way empagliflozin affects ECG parameters in T2DM patients associated with ventricular arrhythmias.
This is an observational, prospective, single-centre research. Patient enrolment began in January 2021, and each patient was followed up after six months. In total, the study included 177 patients, 95 with T2DM and 82 controls. T2DM patients who had been started on the SGLT-2 inhibitor empagliflozin by the internal medicine and endocrinology departments at our hospital, as well as those without a history of T2DM, were included in the study. Patients with hemoglobin A1c (HbA1c) levels persistently above 6.5% despite treatment were prescribed empagliflozin at doses of either 10 mg or 20 mg. Forty-five patients not meeting the inclusion criteria were excluded (Fig. 1). Exclusion criteria included a history of type 1 diabetes or other specific types of diabetes, heart failure (including that with preserved ejection fraction), modest to intense valvular heart disease, bundle branch block or atrioventricular block on ECG, atrial fibrillation, permanent cardiac pacing, history of pulmonary embolism, pulmonary hypertension, malignancy, familial hyperlipidemia, intolerance to chronic kidney disease medications and pregnancy. Those patients that required switching medication (including antidiabetic, antiarrhythmic, antihypertensive and antihyperlipidemic drug classes) were also eliminated to offset potential metabolic effects of non-SGLT-2 inhibitors, or if they had unstable medical conditions (such as decompensated heart failure, acute coronary syndrome, or unstable arrhythmias) during the study period.
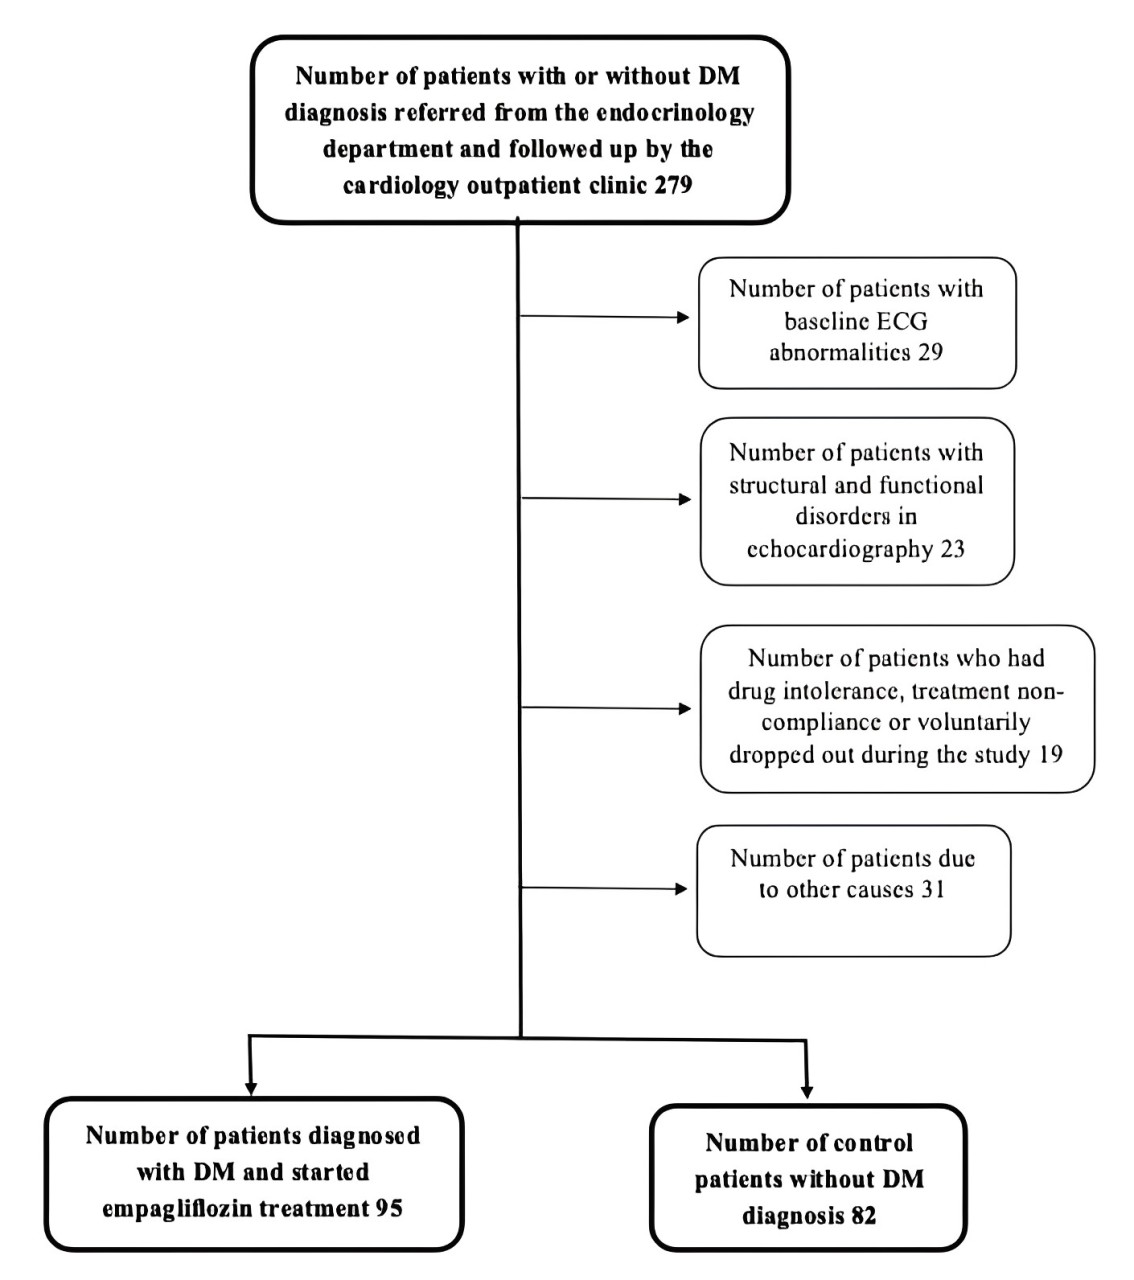 Fig. 1.
Flow chart of the study design. DM, diabetes mellitus; ECG, electrocardiogram.
Biochemical analyses, complete blood counts and HbA1c measurements were performed prior to treatment. For every patient, body mass index (BMI) was calculated. A total of twelve-lead surface ECGs were carried out and patients underwent echocardiography before starting empagliflozin treatment. At the end of the sixth month, all these assessments were repeated. The Declaration of Helsinki was adopted by the study protocol, which was accepted by the local medical ethics committee. Each subject had the study protocol explained to them in detail, after which written informed consent was obtained.
Echocardiographic evaluations, including M-mode, two-dimensional, and Doppler echocardiography, were conducted using the Vivid E9 instrument and the X5-1 transthoracic probe (Vivid 9 Pro, General Electric Medical Systems, Milwaukee, WI, USA). These assessments were performed in the left lateral position following a rest period of at least 15 minutes. Echocardiography was carried out in accordance with the standard images and techniques outlined in the directives of the American Society of Echocardiography (ASE) [14].
For every patient, a 12-lead ECG was noted following a 30-minute rest period in
a room at 20–24 °C. Participants were required to fast for at least 2
hours, abstain from smoking and alcohol consumption for the previous 24 hours,
and avoid strenuous physical activity prior to ECG recording. All ECGs were
performed with the following settings: filter range between 0.5 Hz and 150 Hz, AC
filter of 60 Hz, paper speed of 25 mm/s and amplitude of 10 mm/mV. All standard
12-lead ECGs were examined independently by two clinicians blinded to the study
design and clinical data. On-screen digital caliper software (Cardio Calipers
version 3.3, Iconico, Inc., New York, NY, USA) was used to digitize ECG data and
for each lead, the mean value for the three measurements was computed. The QT
interval was determined from the onset of the QRS complex till the T wave ended,
and the Bazett formula (QTc = QT
Six months after starting treatment with empagliflozin, patients’ QT, QTc, QTd and Tp-e values were re-evaluated and compared with their baseline values (Fig. 2).
 Fig. 2.
Changes in the pre-treatment and post-treatment Tp-e and corrected QT (QTc) values on ECG. ECG, electrocardiogram; Tp-e, Tpeak-to-Tend interval; QTc, corrected QT interval.
SPSS 25.0 for Windows (SPSS Inc., Chicago, IL, USA) was used to perform all
statistical tests. The normality of the data was analyzed by employing the
Kolmogorov-Smirnov test. To represent normally distributed numerical data, mean
Of the 177 patients who were part of the study, 95 were diagnosed with T2DM and
their clinical and demographic attributes are depicted in Table 1. Of the 95 T2DM
patients, 40 were male (42%), whereas in the control group of 82 patients, 40
were male (48%) (p = 0.152). The average age of the T2DM patients was
60.2
| Characteristic | DM patients (n = 95) | Control (n = 82) | p | |
| Age (years) | 60.2 |
58.2 |
0.152 | |
| Male, n(%) | 40 (42%) | 40 (48%) | 0.374 | |
| BMI (kg/m |
26.2 |
24.9 |
0.067 | |
| Smoking, n(%) | 55 (58%) | 42 (51%) | 0.374 | |
| SAP (mmHg) | 121.3 |
118.5 |
0.237 | |
| DAP (mmHg) | 62.3 |
65.0 |
0.091 | |
| Chronic medical illness | ||||
| HT, n (%) | 57 (60%) | 44 (53%) | 0.395 | |
| DM, n (%) | 95 (100%) | - | - | |
| HPL, n (%) | 41 (43%) | 31 (37%) | 0.470 | |
| CAD, n (%) | 43 (45%) | 27 (33%) | 0.094 | |
| Laboratory findings | ||||
| Haemoglobin (g/dL) | 13.1 |
12.9 |
0.118 | |
| WBC (10 |
7.0 |
7.2 |
0.273 | |
| Creatinine (mg/dL) | 0.95 |
0.92 |
0.080 | |
| Sodium (mmol/L) | 139.5 |
138.7 |
0.530 | |
| Potassium (mmol/L) | 4.1 |
4.2 |
0.203 | |
| Calcium (mg/dL) | 9.3 |
9.2 |
0.850 | |
| Magnesium (mg/dL) | 1.9 |
2.0 |
0.166 | |
| HbA1c (%) | 9.1 |
5.0 |
||
| Treatment | ||||
| ACE-I/ARB, n (%) | 67 (70%) | 49 (59%) | 0.133 | |
| BB, n (%) | 71 (74%) | 50 (61%) | 0.051 | |
| CCB, n (%) | 20 (21%) | 27 (32%) | 0.074 | |
| ASA, n (%) | 61 (64%) | 32 (39%) | 0.001 | |
| Statin, n (%) | 50 (52%) | 27 (33%) | 0.008 | |
| Empagliflozin, n (%) | ||||
| 10 mg start | 68 (72%) | - | - | |
| 20 mg start | 27 (28%) | - | - | |
Abbreviations: BMI, body mass index; SAP, systolic arterial pressure; DAP, diastolic arterial pressure; HbA1c, hemoglobin A1c; HT, hypertension; DM, diabetes mellitus; HPL, hyperlipidemia; CAD, coronary artery disease; ACE-I, angiotensin converting enzyme inhibitor; ARB, angiotensin receptor blocker; BB, beta-blockers; CCB, calcium channel blocker; ASA, acetylsalicylic acid; WBC, white blood cell.
Table 2 demonstrates the conventional echocardiographic and electrocardiographic
properties of the patients taking part in the study. In the conventional
echocardiographic assessment, the left ventricular ejection fraction (LVEF) was
statistically significantly less in the T2DM patients in comparison to the
control group (LVEF 58.6
| Conventional echocardiographic findings on admission hospital | |||
| T2DM patients (n = 95) | Control (n = 82) | ||
| LVEF (%) | 58.6 |
60.9 |
0.029 |
| LVEDD (mm) | 47.2 |
46.2 |
0.103 |
| LVESD (mm) | 30.7 |
28.8 |
|
| IVS (mm) | 9.6 |
9.6 |
0.981 |
| PW (mm) | 9.6 |
9.4 |
0.346 |
| LA (mm) | 32.4 |
32.6 |
0.842 |
| E (cm/s) | 76.0 |
73.8 |
0.377 |
| A (cm/s) | 68.2 |
65.6 |
0.244 |
| E/A ratio | 1.1 |
1.1 |
0.833 |
| Electrocardiography findings on admission hospital | |||
| HR (beat/min) | 71.8 |
74.5 |
0.093 |
| QT (msec) | 408.5 |
370.9 |
|
| QTc (msec) | 427.0 |
385.8 |
|
| QTd (msec) | 52.1 |
46.2 |
|
| Tp-e (msec) | 82.3 |
61.2 |
|
| Tp-e/QTc ratio | 0.19 |
0.16 |
|
Abbreviations: LVEF, left ventricle systolic diameter; LVEDD, left ventricle end-diastolic diameter; LVESD, left ventricle end-sistolic diameter; IVS, interventicular septum; PW, posterior wall; LA, left atrium; HR, heart rate; QTc, corrected QT interval; QTd, QT dispersion; Tp-e, Tpeak-to-Tend interval; T2DM, type 2 diabetes mellitus.
The blood pressure and laboratory results of the patient group before and
following treatment are summarised in Table 3. There was no significant variation
in blood pressure before and following treatment. Although no significant
difference was observed in haemogram, white blood cell count, creatinine, sodium,
potassium, calcium and magnesium results, a significant difference was noted in
the levels of HbA1c (HbA1c 9.1
| Parameters | Before the treatment | After the treatment | p |
| SAP (mmHg) | 121.3 |
117.1 |
0.095 |
| DAP (mmHg) | 62.3 |
61.9 |
0.179 |
| Haemoglobin(g/dL) | 13.1 |
13.0 |
0.085 |
| WBC (10 |
7.0 |
7.1 |
0.135 |
| Creatinine (mg/dL) | 0.958 |
0.958 |
0.058 |
| Sodium (mmol/L) | 139.5 |
139.2 |
0.021 |
| Potassium (mmol/L) | 4.13 |
4.14 |
0.051 |
| Calcium (mg/dL) | 9.3 |
9.2 |
0.034 |
| Magnesium (mg/dL) | 1.97 |
1.96 |
0.158 |
| HbA1c (%) | 9.1 |
8.0 |
Abbreviations: SAP, systolic arterial pressure; DAP, diastolic arterial pressure; WBC, white blood cell; HbA1c, hemoglobin A1c.
Table 4 depicts the conventional echocardiographic and electrocardiographic
characteristics of patients with T2DM prior to and following empagliflozin
treatment. Regarding echocardiographic parameters, there were no significant
changes in LVEF, LVEDD, LVESD, IVS, PW, LA, E wave, A wave and E/A ratio values
between the pre- and post-treatment assessments. However, when examining the
electrocardiographic parameters, no differences in heart rate (HR) were observed
between the pre-treatment and post-treatment phases. In particular, the values of
QT, QTc, QTd, Tp-e and Tp-e/QTc showed statistically significant reductions after
empagliflozin treatment compared to pre-treatment values (QT 408.5
| Echocardiographic parameters | Before the treatment | After the treatment | p |
| LVEF (%) | 58.6 |
59.8 |
0.254 |
| LVEDD (mm) | 47.2 |
46.6 |
0.287 |
| LVESD (mm) | 30.7 |
30.1 |
0.139 |
| IVS (mm) | 9.6 |
9.6 |
0.916 |
| PW (mm) | 9.6 |
9.5 |
0.683 |
| LA (mm) | 32.4 |
32.3 |
0.080 |
| E (cm/s) | 76.0 |
72.6 |
0.105 |
| A (cm/s) | 68.2 |
66.9 |
0.503 |
| E/A ratio | 1.1 |
1.0 |
0.097 |
| Electrocardiography parameters | |||
| HR (beat/min) | 71.8 |
74.2 |
0.174 |
| QT (msec) | 408.5 |
378.8 |
|
| QTc (msec) | 427.0 |
404.7 |
|
| QTd (msec) | 52.1 |
47.8 |
|
| Tp-e (msec) | 82.3 |
67.1 |
|
| Tp-e/QTc ratio | 0.19 |
0.17 |
Abbreviations: LVEF, left ventricle systolic diameter; LVEDD, left ventricle end-diastolic diameter; LVESD, left ventricle end-sistolic diameter; IVS, interventicular septum; PW, posterior wall; LA, left atrium; HR, heart rate; QTc, corrected QT interval; QTd, QT dispersion; Tp-e, Tpeak-to-Tend interval.
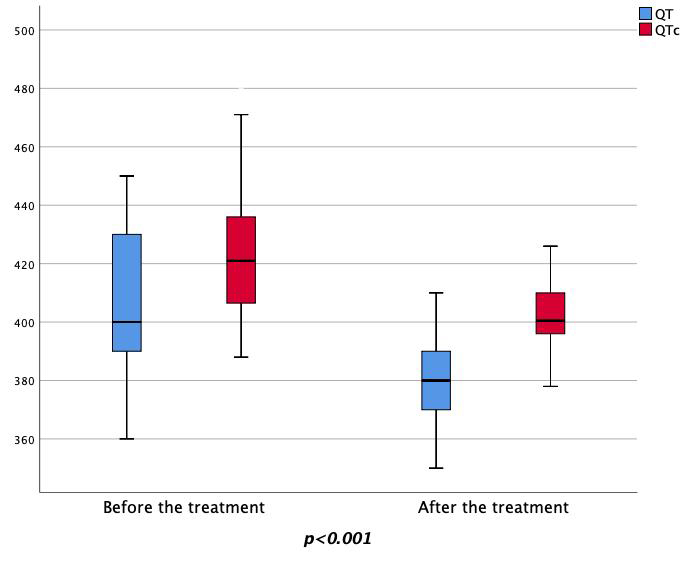 Fig. 3.
Changes in the pre-treatment and post-treatment QT and QTc values. QTc, corrected QT interval.
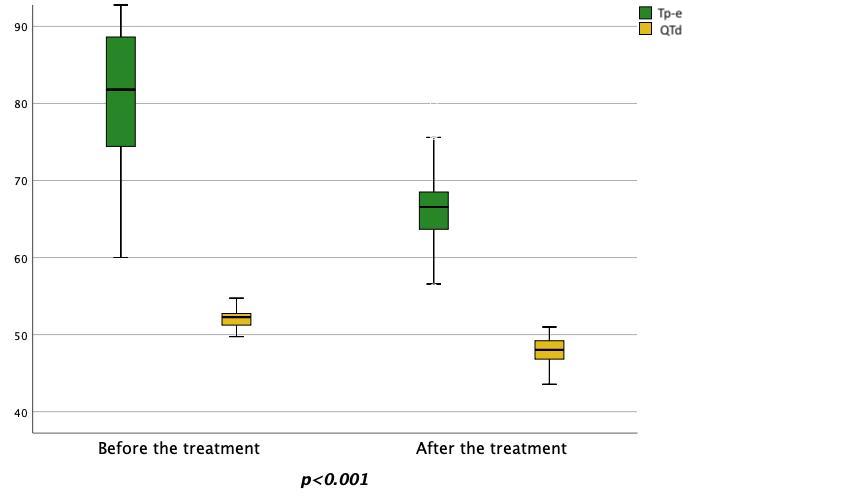 Fig. 4.
Changes in the pre-treatment and post-treatment Tp-e and QTd values. Tp-e, Tpeak-to-Tend interval; QTd, QT dispersion.
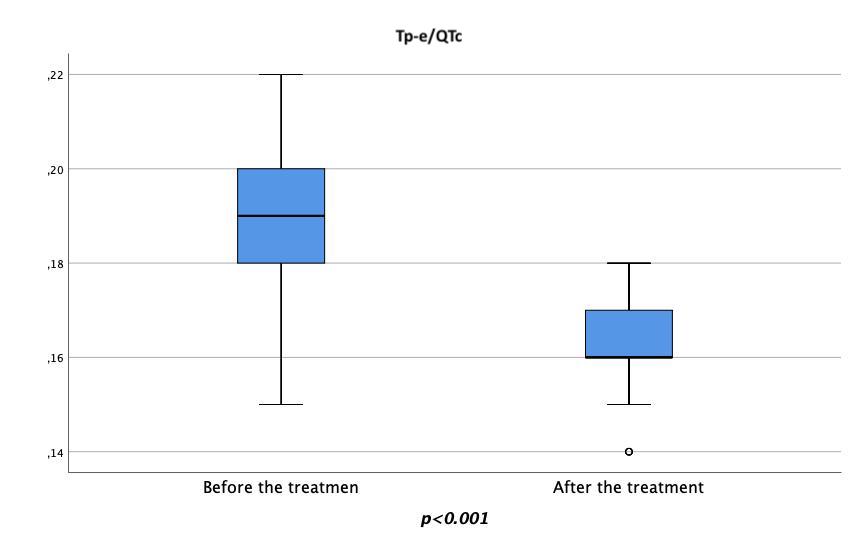 Fig. 5.
Changes in the pre-treatment and post-treatment Tp-e/QTc ratio. Tp-e, Tpeak-to-Tend interval; QTc, corrected QT interval.
The mean difference values for conventional echocardiographic and electrocardiographic characteristics before and after empagliflozin treatment, grouped by treatment dose in patients with T2DM, are shown in Table 5. In this analysis, no significant differences in LVEF, LVEDD, LVESD and E/A wave values were observed between treatment doses. However, in the group receiving the 20 mg dose of empagliflozin, changes in left atrium (LA) values were increasingly prominent, showing a statistically significant difference (Delta-LA –0.02/0.55, p = 0.026). When electrocardiographic parameters were similarly examined, changes in HR, QT, QTd, Tp-e and Tp-e/QTc were not influenced by empagliflozin dose. However, the QTc showed a more pronounced decrease in the 20 mg empagliflozin group, with a statistically significant reduction (QTc 19.4/29.6, p = 0.038).
| Echocardiographic parameters | Empagliflozin 10 mg (n = 68) | Empagliflozin 20 mg (n = 27) | p |
| Mean difference | Mean difference | ||
| Delta-LVEF (%) | –1.75 | 0.14 | 0.420 |
| Delta-LVEDD (mm) | 0.52 | 0.81 | 0.823 |
| Delta-LVESD (mm) | 1.08 | –0.55 | 0.075 |
| Delta-LA (mm) | –0.02 | 0.55 | 0.026 |
| Delta-E/A ratio | 0.07 | 0.16 | 0.402 |
| Electrocardiography parameters | |||
| HR (beat/min) | –0.64 | –6.62 | 0.115 |
| QT (msec) | 31.9 | 24.0 | 0.135 |
| QTc (msec) | 19.4 | 29.6 | 0.038 |
| QTd (msec) | 4.43 | 3.65 | 0.067 |
| Tp-e (msec) | 14.1 | 17.5 | 0.055 |
| Tp-e/QTc ratio | 0.02 | 0.02 | 0.317 |
Abbreviations: LVEF, left ventricle systolic diameter; LVEDD, left ventricle end-diastolic diameter; LVESD, left ventricle end-sistolic diameter; LA, left atrium; HR, heart rate; QTc, corrected QT interval; QTd, QT dispersion; Tp-e, Tpeak-to-Tend interval.
A stepwise method of linear regression assessment was used to assess the parameters affecting post-treatment QTc values, as shown in Table 6. First, statistically significant parameters and those likely to influence the QTc parameter were included in the model. In this context, the relationship between HbA1c, empagliflozin dose, beta-blocker (BB) use, age, BMI, LVEF, sex, CAD, SAP, Haemoglobin, Creatinine, Potassium, Calcium, Magnesium, ACE-I/ARB use, HT and smoking status with post-treatment QTc was evaluated. HbA1c and empagliflozin dose were identified as independent predictors of post-treatment QTc.
| Coefficients | ||||
| Model | Unstandardized coefficients | Standardized coefficients | p value | |
| B | Std. Error | Beta | ||
| (Constant) | 263.277 | 8.615 | ||
| HbA1c | 3.836 | 1.000 | 0.399 | |
| Empagliflozin dose | –7.991 | 3.217 | –0.252 | 0.015 |
| Excluded Variables | ||||
| Model | B | Partial correlation | Collinearity statistics | p value |
| Tolerance | ||||
| BB | 0.072 | 0.076 | 0.978 | 0.467 |
| Age | 0.138 | 0.134 | 0.816 | 0.198 |
| BMI | –0.054 | –0.058 | 0.989 | 0.579 |
| LVEF | 0.116 | 0.118 | 0.901 | 0.258 |
| Gender | 0.070 | 0.074 | 0.952 | 0.480 |
| CAD | –0.038 | –0.041 | 0.998 | 0.696 |
| ACE-I/ARB | –0.101 | –0.107 | 0.971 | 0.305 |
| HT | 0.072 | 0.076 | 0.971 | 0.464 |
| Smoke | 0.024 | 0.026 | 0.989 | 0.805 |
| SAP | 0.063 | 0.067 | 0.994 | 0.552 |
| Haemoglobin | –0.112 | –0.119 | 0.987 | 0.252 |
| Creatinine | –0.107 | –0.114 | 0.998 | 0.273 |
| Potassium | 0.100 | 0.104 | 0.943 | 0.320 |
| Calcium | 0.120 | 0.128 | 0.999 | 0.218 |
| Magnesium | 0.041 | 0.044 | 0.998 | 0.675 |
The agreement of echocardiographic and electrocardiographic parameters for intra-observer and inter-observer variability was evaluated in a randomly selected group of 20 patients. The intraclass correlation coefficient for intraobserver and interobserver variability was 0.91 (95% CI, 0.85–0.96) and 0.89 (95% CI, 0.81–0.95) for echocardiographic measurements and 0.92 (95% CI, 0.86–0.96) and 0.90 (95% CI, 0.84–0.96) for electrocardiographic measurements.
We investigated the impact of empagliflozin on ECG ventricular repolarisation factors in patients with T2DM in this research. Our findings can be summarised as follows: (i) We observed that the QT, QTc, QTd, Tp-e and Tp-e/QTc values significantly varied among the patient group and the control group. (ii) We observed a significant variation in QT, QTc, QTd, Tp-e and Tp-e/QTc values within the patient group when comparing measurements taken before empagliflozin treatment and those obtained six months after the start of treatment. (iii) We analysed the difference in ventricular repolarisation factors on the ECG based on the treatment dose and found a statistically significant dose-related reduction in the QTc parameter. (iv) Using linear regression analysis, we identified HbA1c levels and empagliflozin treatment dose as independent factors affecting QTc.
Empagliflozin, a potent SGLT-2 inhibitor, is the first glucose-lowering medicine shown to reduce cardiovascular events [16]. Despite several studies suggesting potential effects on atherosclerosis, cardiac remodelling or inflammatory processes, the precise pathophysiology underlying its cardiac effects remains unclear. There is consensus that the drug acts through a complex mechanism of action [17, 18, 19].
The effect of this drug on heart rhythm is also unclear. Some studies have shown that therapeutic doses of the drug do not prolong the QT interval [20], others have reported longer QT intervals in people with T2DM and CAD in comparison to the general population [18, 20]. We also noticed in our research that ventricular repolarisation parameters (QT, QTc, QTd, Tp-e and Tp-e/QTc) were all considerably prolonged in the patient group in contrast to the control group. However, at the six-month follow-up after the addition of empagliflozin to glucose control, a significant shortening of these ventricular repolarisation parameters (QT, QTc, QTd, Tp-e and Tp-e/QTc) was observed.
Although QTd has historically been considered a marker of increased repolarization dispersion and a useful indicator of arrhythmogenic events, contemporary preferences have shifted to more sensitive parameters for predicting arrhythmogenic events on ECGs [21]. Nonetheless, several studies have pointed to impaired QT intervals and QTd in individuals with T2DM and CAD [22]. It is worth noting that increased QT and QTd values in the presence of autonomic neuropathy and arrhythmias are significant contributors to the possibility of death due to sudden cardiac arrest [8, 23]. In our study, we also observed that in comparison to the control group, both QT and QTd were substantially greater in the patient group and that QTd decreased in the patient group after treatment with empagliflozin. These findings suggest that empagliflozin may be linked to decreasing the possibility of death due to sudden cardiac arrest.
The Tp-e interval and the Tp-e/QT ratio are key markers of ventricular repolarisation and greater dispersion [24]. The findings of recent studies have emphasised that the Tp-e/QT ratio provides a more precise assessment of ventricular repolarisation dispersion compared to QT dispersion, QTc dispersion and Tp-e intervals, independent of heart rate variations. In addition, an elevated Tp-e/QT ratio has been linked to a greater risk of arrhythmogenic events [7, 8, 25]. The primary mechanism of Tp-e interval prolongation is the disruption of ion transfer during ventricular repolarization [26]. The Tp-e interval reflects epicardial and myocardial repolarisation, but subendothelial M-cells are vulnerable to early depolarisation. This vulnerability can lead to arrhythmias, and inappropriate stimulation of M-cells can result in lethal cardiac rhythms such as ventricular fibrillation or ventricular tachycardia [8, 27, 28, 29]. A substantial difference in Tp-e interval and Tp-e/QTc ratio among the patient and control groups was observed in this research. When these parameters were remeasured six months after the start of treatment with empagliflozin, we observed significant improvements compared with baseline values. Therefore, it is reasonable to conclude that empagliflozin may reduce the risk of arrhythmias by decreasing the Tp-e interval as well as the Tp-e/QTc ratio. According to the information available, our study seems to be one of the first to examine the link between empagliflozin and the Tp-e interval, as we could not identify any previous studies investigating this aspect.
In the study carried out by Taha et al. [30], a significant association was found between left ventricular diastolic dysfunction (LVDD) and the length of QTc duration. In our study, we found that the values of E and A waves decreased with treatment, but this change was not statistically significant and in this context, we concluded that LVDD does not independently show a significant effect on QTc duration. Of course, we are aware that the hypothesis of our study is not relevant to this issue and in this context, the number of LVDD patients in the patient group is not sufficient to reach such a conclusion [30].
Studies investigating the relationship between empagliflozin dose and QTc in the literature are limited and there is no comprehensive study with long-term results. A study by Ring et al. [20] investigated empagliflozin doses of 25 and 200 mg, but found no significant relationship with QTc. It is worth noting that this study was based on data from a 24-hour monitoring period [20]. Treatment of chronic diseases often requires longer-term studies, and our study with a 6-month follow-up suggests that empagliflozin dosing leads to significant changes in QTc, in contrast to the findings of that study. There is one study in the literature suggesting that empagliflozin may prevent QTc prolongation induced by amitriptyline. However, this study only used a 10 mg dose [31]. Our study supports the idea that higher doses may produce more favourable results. Another study did not find a direct relationship between empagliflozin dose and cardiovascular effects, but suggested that increasing the dose of empagliflozin because of metabolic disorders associated with glycaemic control would not change cardiovascular effects. In other words, it argues that there is no need to increase the dose for cardiovascular effects and that if dose escalation is needed for metabolic reasons, it should be done accordingly [32]. Our study contributes to these considerations in the literature by emphasising that dose may be independently effective in preventing arrhythmias and by suggesting a new perspective on the need for dose adjustment.
Although the cardiovascular effects of SGLT-2 inhibitors were initially thought to be due to an increase in the amount of fasting ketones in the body, this was not clinically supported [33]. On the other hand, there are articles in the literature investigating how sodium-hydrogen exchanger-1 is inhibited, which is a potent receptor in the renal proximal tubule and myocyte membrane, thus keeping calcium, which causes myocardial toxicity, inside the cell [34, 35]. Another hypothesis is that renal medullary hypoxia is caused by SGLT-2 inhibitors due to increased active sodium reabsorption in the distal convoluted tubule, which leads to the formation of hypoxia-inducible factors, and this brings about the release of erythropoietin. The mass of erythrocytes increases, characterized by an increase in haematocrit, which enhances the provision of oxygen to the myocardium and decreases the mass of the left ventricle [36, 37]. In a review by Talha et al. [38], it was noted that many hypotheses have been put forward for the cardiovascular effects of SGLT-2 inhibitors, but it was argued that the exact mechanism of action is not yet clear. Unfortunately, we could not prove the results that would reveal the cardiac effects of SGLT-2 inhibitors, but we hope that it will be useful in future studies on this topic.
The QT, QTc, QTd, Tp-e and Tp-e/QTc values in our research were impaired in CAD and T2DM, as shown in similar studies. However, unlike previous studies, we investigated the response of these parameters to empagliflozin and found that the drug reduced them all. Although the mechanism of empagliflozin’s beneficial effects on the heart has not yet been elucidated, we hope that the results of our study will help to explain this mechanism. In particular, our finding that empagliflozin has a beneficial effect on the cardiac conduction system is a new contribution to the literature.
Very limited cases are studied in this research and there is a need for further publications with more cases. The observation period of the patients in this study was relatively limited. Therefore, multicenter studies with a longer follow-up are needed. In addition, because we did not include T2DM patients without CAD, we could not clarify whether the changes we observed in the ECG occurred in relation to T2DM or CAD, or only when both diseases coexisted. Finally, our study was not sufficient to clarify the mechanism of action of empagliflozin on the cardiovascular system.
In conclusion, our study sheds light on the possible advantages of empagliflozin in enhancing ventricular repolarisation factors in patients suffering from T2DM. We observed significant reductions in QTc, QTd, Tp-e and Tp-e/QTc after six months of empagliflozin treatment. These findings suggest that the use of empagliflozin is potentially linked to reduced incidence of ventricular arrhythmias. Further long-term studies need to be carried out to validate these effects and to investigate the underlying mechanisms. In addition to providing glycaemic control, empagliflozin may also have cardiovascular benefits, making it a valuable addition to the treatment options for people with T2DM who are at risk of cardiac complications.
The datasets used in the current study are available from the corresponding author upon reasonable request.
FO, HT and AA designed the research study. HT, AA and HAB performed the research. FO, HT and HAB conducted data collection. FO and HAB provided help and advice on language. AA analyzed the data. FO and HAB wrote the manuscript. AA and HT conducted writing review. All authors contributed to editorial changes in the manuscript. All authors read and approved the final manuscript. All authors have participated sufficiently in the work and agreed to be accountable for all aspects of the work.
The study was conducted in accordance with the Declaration of Helsinki. This study received ethics approval from Yuzuncu Yıl Universty Hospital Faculty of Medicine University Ethics Committee. The ethics approval number is 2019-09. All individuals have signed informed consent.
Not applicable.
This research received no external funding.
The authors declare no conflict of interest.
Publisher’s Note: IMR Press stays neutral with regard to jurisdictional claims in published maps and institutional affiliations.