
- Academic Editor
†These authors contributed equally.
Background: Identifying effective pharmacological
interventions to prevent the progressive enlargement and rupture of aortic
aneurysms (AAs) is critical. Previous studies have suggested links between
metformin use and a decreased incidence of AAs. In this study, we employed
Mendelian randomization (MR) to investigate causal effects of metformin’s targets
on AA risk and to explore the underlying mechanisms underlying these effects.
Methods: To examine the relationship between metformin use and AA risk,
we implemented both two-sample MR and multivariable MR analyses. Utilizing
genetic instrumental variables, we retrieved cis-expression quantitative trait
loci (cis-eQTL) data for potential targets of metformin from the Expression
Quantitative Trait Loci Genetics Consortium (eQTLGen)
Consortium and Genotype-Tissue Expression (GTEx) project. Colocalization analysis was employed to ascertain
the probability of shared causal genetic variants between single nucleotide
polymorphisms (SNPs) associated with eQTLs and AA. Results: Our findings
reveal that metformin use reduces AA risk, exhibiting a protective effect with an
odds ratio (OR) of 4.88
An aortic aneurysm (AA) is characterized by localized dilations in the aorta, caused by thinning of the medial and adventitial layers due to extracellular matrix degradation and loss of vascular smooth muscle cells [1]. The rupture of large aneurysms can result in life-threatening hemorrhage and significantly increased mortality rates [2]. Established risk factors for AA encompass advanced age, male sex, hypertension, hyperlipidemia, and tobacco use [2]. At present, the standard for AA treatment is open or endovascular surgical intervention [3]. Consequently, a crucial clinical objective is to identify effective pharmaceutical treatments that can slow or prevent the growth and rupture of AAs [3].
Metformin, a widely used oral antihyperglycemic agent, is the primary pharmacological intervention for management of type 2 diabetes [4]. Its modulation of the inflammatory response has led to its consideration as a potential therapeutic target across a spectrum of cardiovascular conditions [5]. Epidemiological observations have indicated that metformin protects against the initiation and growth of AAs [6, 7], underscoring its possible utility in AA management. However, the challenge in drawing causal inferences from epidemiological studies lie in the presence of confounders, potential reverse causation, and confounding biases [5]. Furthermore, it is important to ascertain if the use of metformin can mitigate AA enlargement, in both diabetic and non-diabetic individuals. Consequently, a comprehensive investigation is warranted to determine if there is a causal link between metformin use and AA susceptibility.
Mendelian randomization (MR) is a method that uses single nucleotide polymorphisms (SNPs) as instrumental variables (IVs) to reduce the impact of confounding biases inherent to conventional observational studies [8]. Furthermore, integrating molecular phenotypes, including gene expression profiles with advanced techniques like genetic colocalization [9], have gained traction for identifying tissue-specific causal genes implicated in complex diseases. Such techniques are pivotal in unraveling the biological mechanisms of metformin’s impact on AA.
In this study, our objectives are to determine the causal impact of metformin on the risk of AA and to uncover the underlying therapeutic mechanisms behind these effects through MR and colocalization analyses. Our ultimate aim is to explore the potential of metformin as a potential therapeutic agent for AA.
Our study’s primary objective was to assess the causal impact of metformin on AA risk and investigate the associated therapeutic targets relevant to metformin’s mechanism of action. The flow diagram illustrating the study methodology is presented in Fig. 1. Our approach involved the utilization of both two-sample MR and multivariable MR techniques to explore the causal relationships between metformin use, type 1 diabetes, type 2 diabetes, and AA risk. Furthermore, we employed a two-sample MR approach to assess the effects of gene-expression levels of metformin-related targets on AA risk, utilizing independent cis-expression quantitative trait (locicis-eQTL) variants. Subsequent steps were taken only for MR outcomes that achieved statistical significance, followed by validation in an independent dataset. Finally, upon identifying potential causal genetic variants, we performed a colocalization analysis to elucidate shared regulatory mechanisms underlying the observed effects.
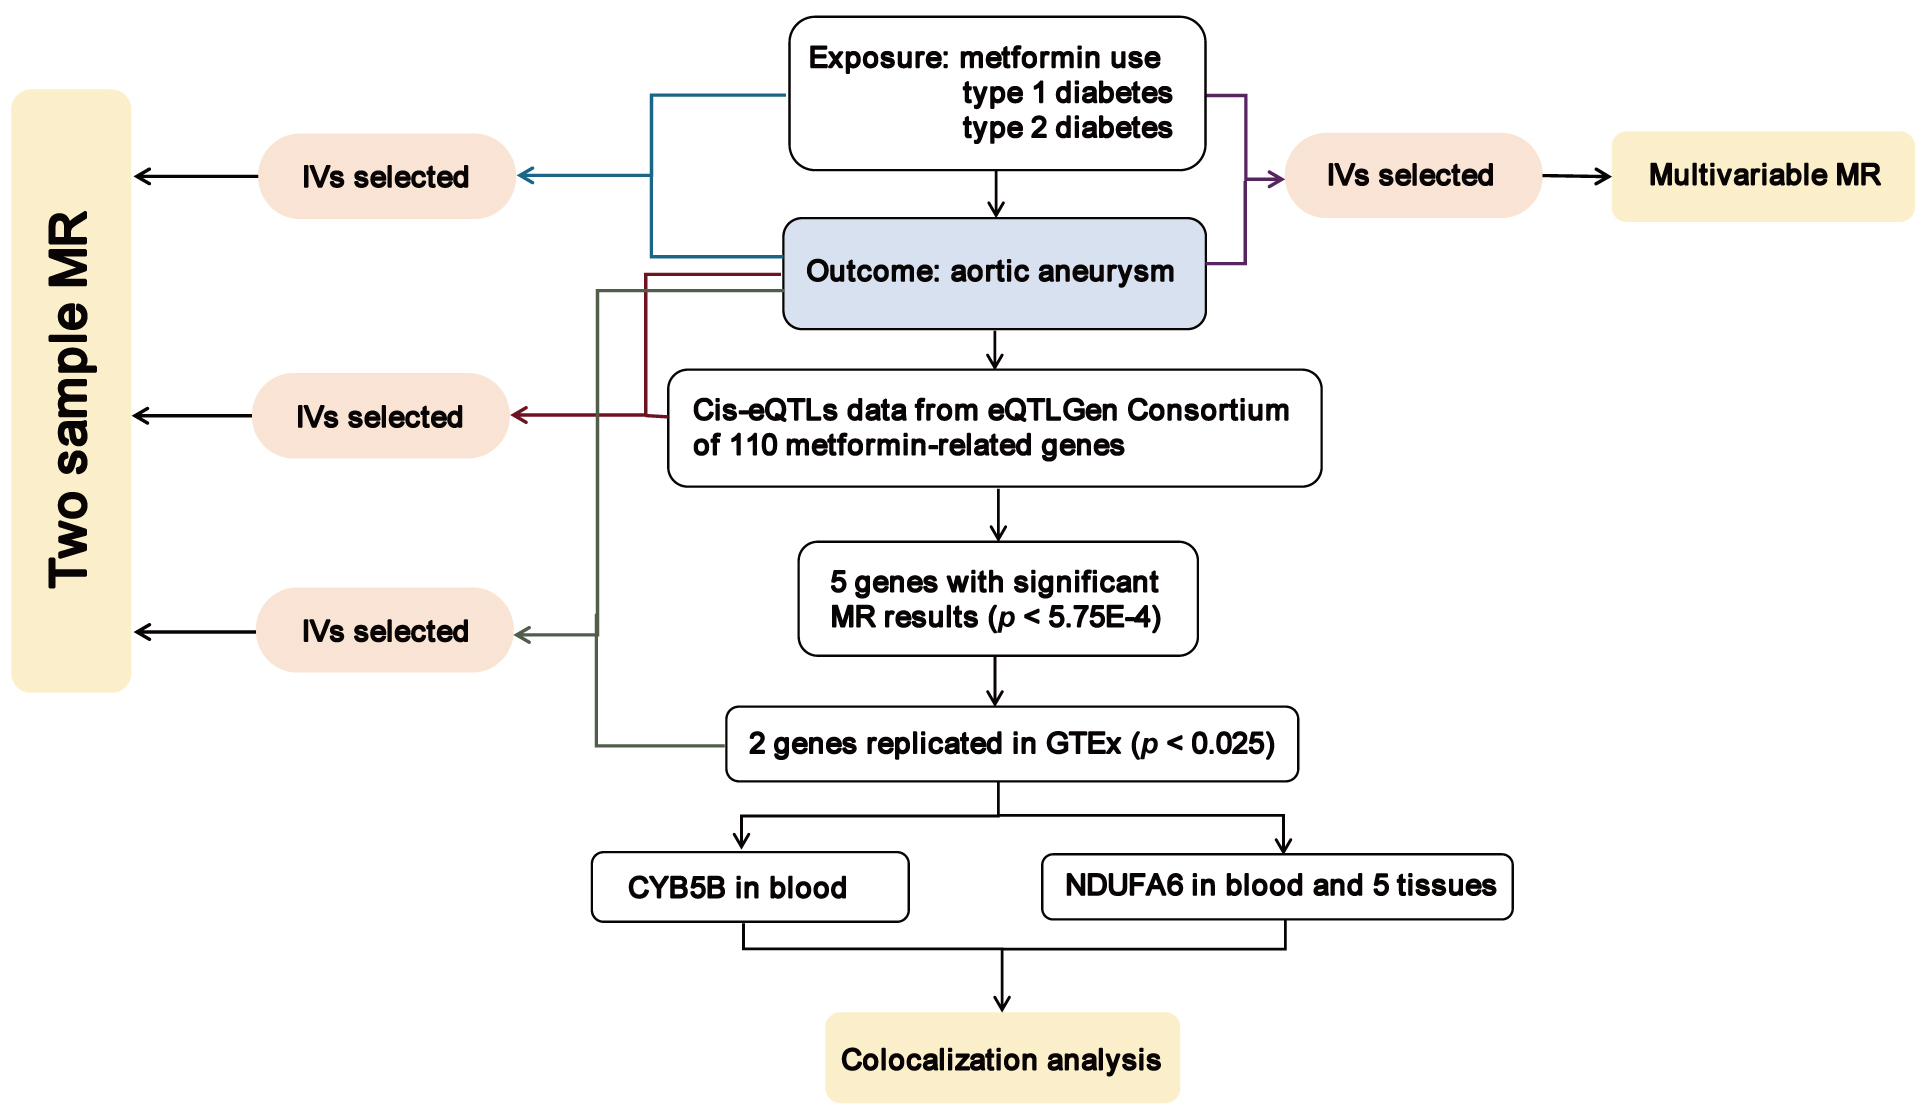 Fig. 1.
Overview of the study design in our study. MR, Mendelian randomization; IVs, instrumental variables; cis-eQTL, cis-expression quantitative trait loci; CYB5B, cytochrome b5 type B; NDUFA6, NADH:ubiquinone oxidoreductase subunit A6; GTEx, Genotype-Tissue Expression.
For the metformin exposure dataset, we utilized genome-wide association study (GWAS) summary statistics involving a total of 462,933 individuals, which comprises 11,552 cases and 451,381 controls. Participants were categorized based on their metformin treatment status, irrespective of age and sex. The type 1 diabetes and type 2 diabetes datasets encompassed 189,302 individuals (6729 cases and 182,573 controls) and 202,046 individuals (17,268 cases and 184,778 controls), respectively. The primary outcome was AA, which was defined based on diagnoses recorded in hospital episodes using the ICD-10 system, as well as the underlying and contributing causes of death documented with ICD-10 codes. The AA outcome dataset included GWAS summary statistics for 209,366 individuals (2825 cases and 206,541 controls). All datasets were exclusively of European origin and were obtained from the MRC-IEU OpenGWAS database, originating from the UK Biobank and FinnGen biobank. Refer to Supplementary Table 1 for comprehensive details.
We retained SNPs associated with metformin use, type 1 diabetes, and type 2
diabetes at the genome-wide significance threshold (p
In subsequent analyses, we obtained statistically significant cis-eQTL (false discovery rate
F-statistics were employed to gauge the strength of the selected IVs [15] and
were calculated as follows: F = R
We identified metformin targets through three distinct avenues: the drug-interaction database (DGldb) [16], the connectivity map (CMap) [17], and other pertinent literature [18, 19, 20, 21]. We encompassed all genes within DGldb that were implicated in potential metformin interactions. Genes with a connectivity score exceeding 90% or falling below –90% in response to metformin administration were selected. Additionally, we searched potential drug targets of metformin from other relevant literature. Genes meeting the aforementioned criteria were retained for subsequent analyses (Supplementary Table 2).
Our two-sample MR approach was based on three fundamental assumptions: (1) Direct relevance of IVs to exposure; (2) Independence of IVs from confounding variables; (3) Influence of IVs on results through exposure [22].
The inverse-variance weighted (IVW) MR method was employed as the primary analysis, serving to quantify the strength of the association between exposure and outcome. Supplementary analyses encompassed MR-Egger, weighted median, simple mode, and weighted mode. Wald ratios were calculated for each SNP, providing individual estimates of the causal effect between exposure and outcome. For multivariable Mendelian randomization (MVMR), regression-based IVW and MR-Egger methodologies were utilized.
To assess IV heterogeneity, Cochran’s Q test was used. Random-effects IVW was adopted when heterogeneity was detected. Conversely, fixed-effects IVW was employed when there was no heterogeneity. The intercept of the MR-Egger regression estimated the potential impact of pleiotropic effects from genetic variants on causal estimates. Furthermore, a leave-one-out sensitivity analysis was conducted to determine the susceptibility of MR results to individual SNPs. Verification of the directional causality from exposure to AA was facilitated through the MR Steiger test.
The colocalization analysis estimated the likelihood of shared causal variants
between cis-eQTLs (as identified via MR) and AA risk. Genes meeting
Bonferroni-corrected significance thresholds in the MR analysis for
metformin-related genes underwent colocalization analysis for AA risk using
default priors. The first prior, which was the likelihood of any variant serving
as a causal determinant for any trait (H1 and H2), was set at 1
All analytical procedures were executed using the R software (version 4.1.2, R Foundation for Statistical Computing, Vienna, Austria, https://www.r-project.org) and the following R packages: TwoSampleMR (version 0.5.7, https://mrcieu.github.io/TwoSampleMR/), MendelianRandomization (version 0.8.0, https://cran.r-project.org/web/packages/MendelianRandomization/) [23], and Coloc (version 5.2.2, https://chr1swallace.github.io/coloc/index.html) for colocalization analyses [9].
The two-sample MR analysis suggested a potential negative association between
metformin use and AA risk, with metformin users showing a reduced risk (odds
ratio [OR] = 4.88
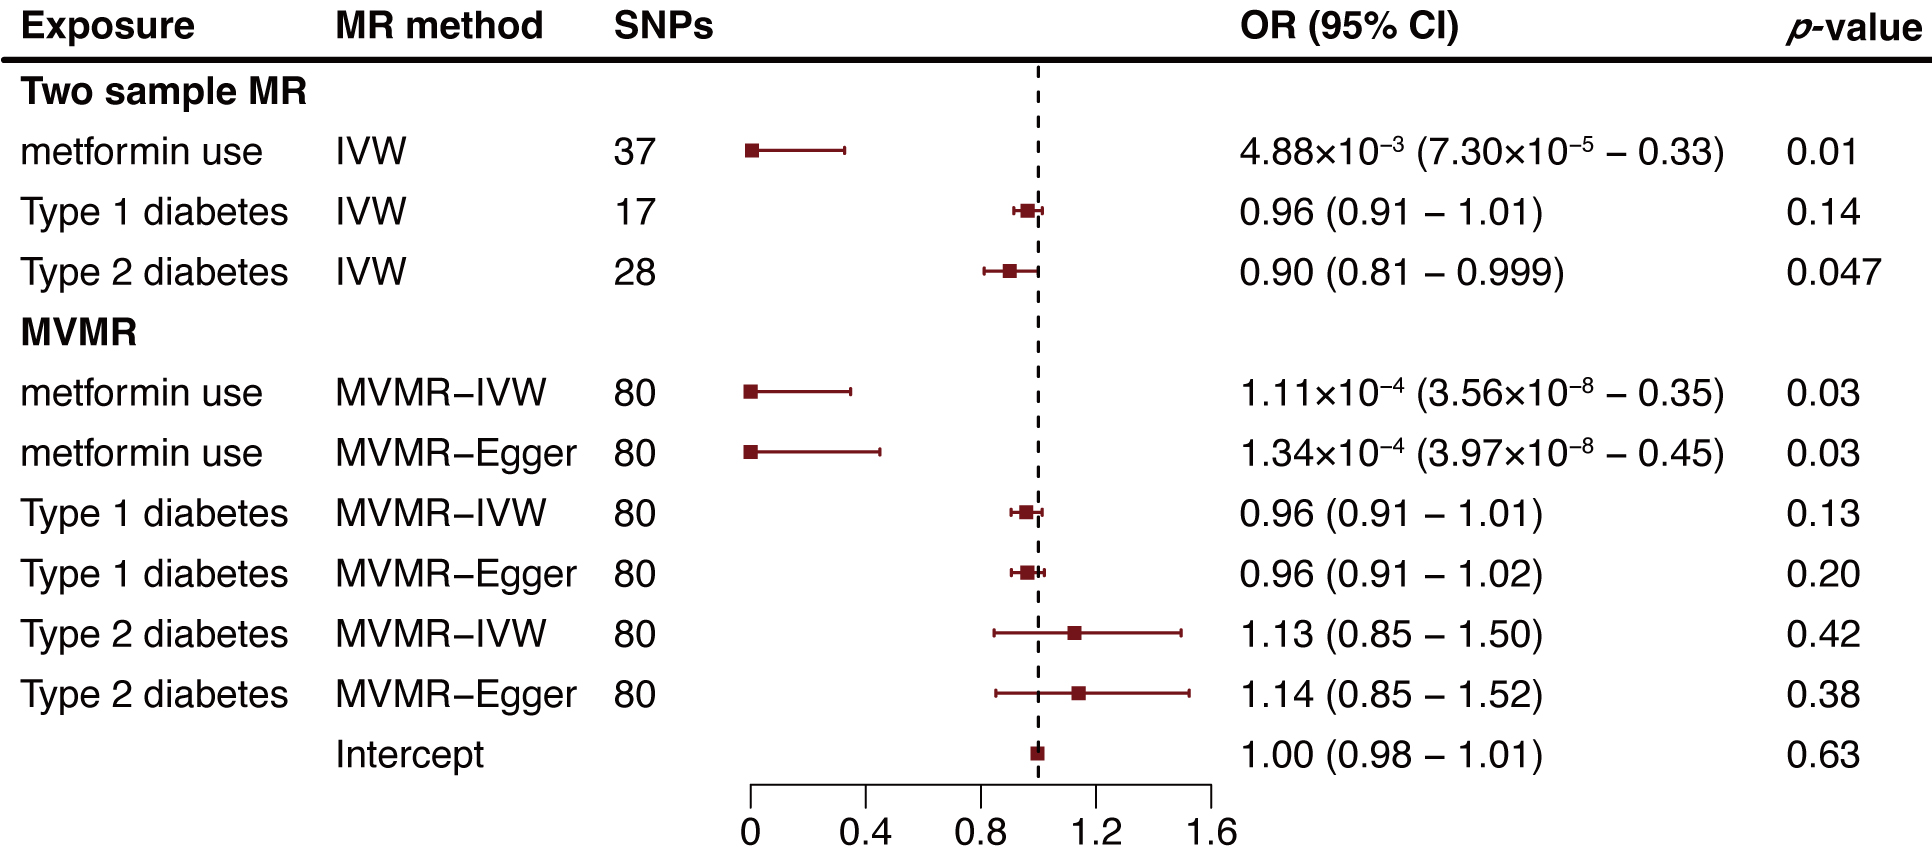 Fig. 2.
Two-sample and multivariable mendelian randomization analysis results for metformin use, type 1 diabetes, and type 2 diabetes on aortic aneurysm risk. MR, mendelian randomization; SNP, single nucleotide polymorphism; OR, odds ratio; CI, confidence intervals; IVW, inverse variance weighted method; MVMR, multivariable Mendelian randomization.
To identify genes potentially affected by metformin treatment that may reduce AA
risk, we compiled data on genes interacting with metformin, gathering 38 from
DGldb, 20 from CMap, and 52 from relevant literature (Supplementary Table
2). We then selected conditionally independent cis-expression quantitative trait
loci (cis-eQTL) variants that correlated with whole blood concentrations from the
eQTLGen. Following this selection, we focused on 87 metformin-related genes, examining
their mRNA expression in relation to AA risk. We employed a two-sample MR
approach based on European summary statistics for AA patients. After multiple
testing adjustments (p
| Genes | eQTLGen Consortium | GTEx Project | ||||||||
| SNPs | OR (95% CI) | IVW/Ward Ratio | MR-Egger intercept | Egger intercept | SNPs | OR (95% CI) | IVW/Ward Ratio | MR-Egger intercept | Egger intercept | |
| p-value | p-value | p-value | p-value | |||||||
| PRKAA1 | 12 | 0.65 (0.52–0.81) | 1.08 × 10 |
–0.05 | 0.37 | |||||
| HMGB3 | 1 | 0.09 (0.003–0.25) | 6.29 × 10 |
- | - | |||||
| CYB5B | 39 | 1.35 (1.20–1.51) | 2.41 × 10 |
0.01 | 0.42 | 1 | 1.77 (1.14–2.74) | 1.10 × 10 |
- | - |
| NDUFA6 | 78 | 1.12 (1.07–1.17) | 1.69 × 10 |
–0.004 | 0.62 | 12 | 1.30 (1.16–1.45) | 6.76 × 10 |
0.02 | 0.44 |
| NDUFAF3 | 47 | 0.70 (0.63–0.78) | 1.89 × 10 |
0.03 | 0.05 | |||||
eQTLGen, Expression Quantitative Trait Loci Genetics Consortium; GTEx, Genotype-Tissue Expression Project; SNP, single nucleotide polymorphism; OR, odds ratio; CI, confidence intervals; IVW, inverse variance weighted method; MR-Egger, Mendelian Randomization Egger; PRKAA1, protein kinase AMP-activated catalytic subunit alpha 1; HMGB3, high mobility group box 3; CYB5B, cytochrome b5 type B; NDUFA6, NADH, ubiquinone oxidoreductase subunit A6; NDUFAF3, NADH:ubiquinone oxidoreductase complex assembly factor 3.
We extended our analysis by extracting NDUFA6-related cis-eQTLs from
the GTEx Project, examining their impact across various tissues including the
aorta, tibial artery, coronary artery, visceral omental adipose, and tibial
nerve. The MR results revealed a consistent positive association between
increased NDUFA6 expression in arterial tissues and elevated AA risk.
Specifically, the ORs were 1.13 for aorta (95% CI: 1.07–1.20, p = 2.13
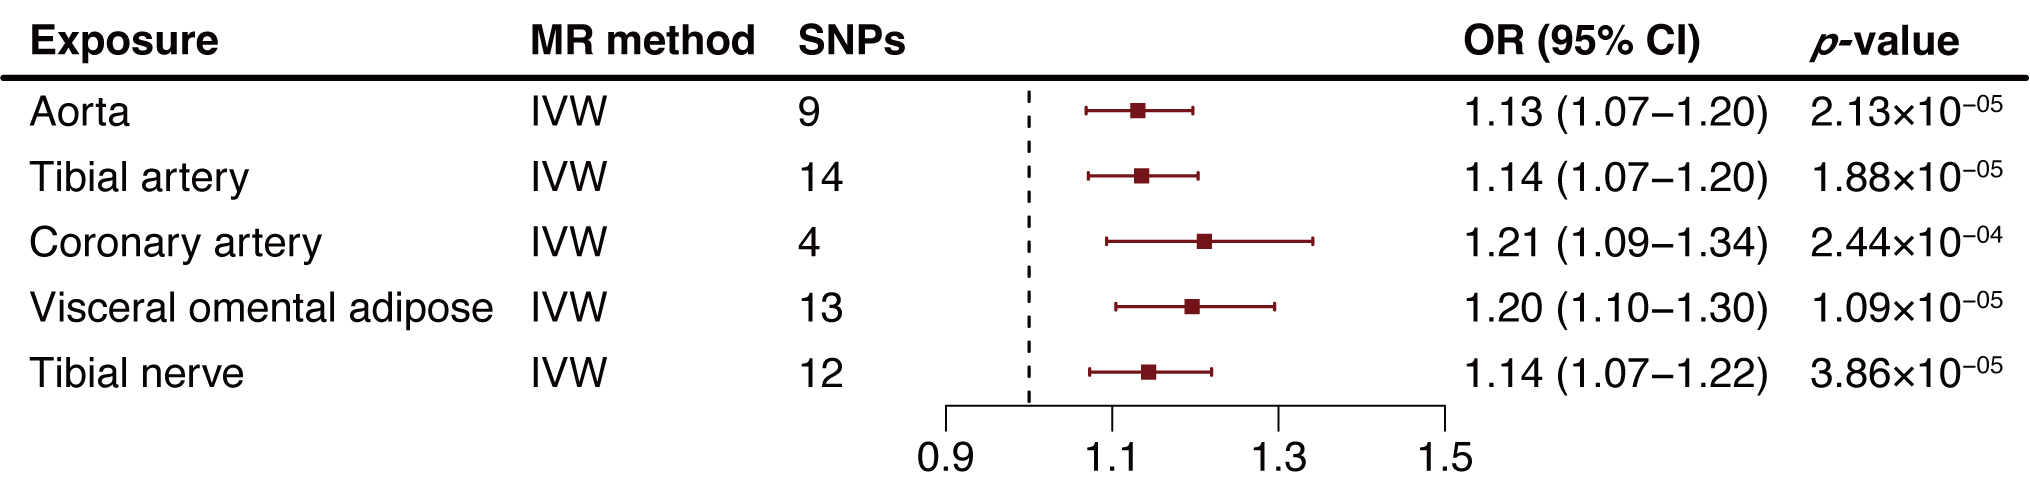 Fig. 3.
Two-sample mendelian randomization analysis results of NADH:ubiquinone oxidoreductase subunit A6 (NDUFA6) in tissues on aortic aneurysm (AA) risk. MR, Mendelian randomization; SNP, single nucleotide polymorphism; OR, odds ratio; CI, confidence intervals; IVW, inverse variance weighted method; AA, aortic aneurysm.
Our colocalization analysis probed the likelihood of shared causal genetic variants between SNPs associated with AAs and eQTLs. Intriguingly, our findings indicated a shared causal variant between AAs and eQTLs for both CYB5B and NDUFA6 in blood with posterior probabilities of 0.77 and 0.99 respectively (Table 2; Supplementary Table 14). Notably, two cis-eQTLs of NDUFA6 in the tibial artery and visceral omental adipose also presented compelling evidence for a shared causal variant with AA, each with a posterior probability 1 (Table 2; Supplementary Table 14). These results, derived from both MR and colocalization analyses highlighted two potentially metformin-related genes with a possible shared genetic influence between eQTLs and AAs risk.
| Gene | Tissue | Variants | SNP | Position | Alleles | EAF | Beta | PPH4 |
| CYB5B | Blood | 534 | rs72797202 | 16:69519790 | A/C | 0.21 | 0.14; 0.05 | 0.77 |
| NDUFA6 | Blood | 1340 | rs117529804 | 22:42669104 | T/C | 0.04 | 1.03; 0.18 | 0.99 |
| NDUFA6 | Tibial artery | 431 | rs1989202 | 22:42486080 | A/G | 0.02 | 1.41; 0.15 | 1.00 |
| NDUFA6 | Visceral omental adipose | 304 | rs1989202 | 22:42486080 | A/G | 0.02 | 0.95; 0.15 | 1.00 |
SNP means the shared causal variant (PPH
This study investigated the causal effects of metformin use on AA risk as well as the therapeutic mechanisms by employing two-sample and multivariable MR analyses. We established that the observed protective effect of type 2 diabetes on AA is likely due to metformin use. By using both eQTL and colocalization analyses, we discovered that variations in CYB5B and NDUFA6 gene expression, present in blood and tissue, may provide insight into metformin’s protective effect on AA.
The paradoxical protective effect of type 2 diabetes on AAs has been substantiated by numerous studies, in both observational studies and MR investigations [25, 26]. This phenomenon challenges the conventional understanding that elevated glucose levels promote endothelial and platelet dysfunction [27], leading to chronic inflammation in vessel walls [28]—a pivotal factor in AA development [29, 30]. Even with careful glycemic control, other factors such as hypertension, can lead to vascular inflammation and AA development [31]. Various antidiabetic treatments, including metformin, have been linked to reduced AA risk [7]. Among these, metformin represents a long-standing, well-established pharmacological intervention with proven safety and efficacy. While observational studies have explored its effects on AA, our study used MR to avoid potential confounders, reverse causation, and biases inherent in traditional observational research, thus providing a more robust assessment of metformin’s impact on AA.
The protective effects of both type 2 diabetes and metformin on AA, initially supported by two-sample MR, exhibited notable differences when analyzed using MVMR. In MVMR, the protective effect attributed to type 2 diabetes diminished, while the influence of metformin remained consistent. This observation suggests that the apparent protective effect of type 2 diabetes on AA might indeed stem from metformin treatment.
The effort to reveal the underlying mechanisms by which metformin may mitigate AA risk holds significant importance. Apart from its effects on glucose metabolism, metformin’s influence on immunometabolism has positioned it as a promising target for treating cardiovascular disease [32]. Experimental animal models have illustrated metformin’s role in preserving medial elastin and smooth muscle while reducing immune cell infiltration, ultimately inhibiting aortic aneurysm formation and progression [33]. Moreover, patient-derived microphysiological models underscore metformin’s potential to regulate contractile phenotypes and metabolic abnormalities in aortic smooth muscle cells, effectively reducing aortic dilation [34].
We explored three pathways to investigate metformin targets: DGldb, CMap, and other pertinent literature [20]. Notably, a significant portion of these targets were related to mitochondrial complex I (MCI) and adenosine monophosphate-activated protein kinase (AMPK) families, which intrinsically correlate with their anti-inflammatory mechanisms [35]. Through the integration of MR with GWAS datasets and eQTL, our analysis yielded significant outcomes for NDUFA6 and CYB5B.
NDUFA6 encodes a pivotal accessory subunit of MCI (NADH:ubiquinone oxidoreductase), the principal enzyme within the mitochondrial membrane respiratory chain responsible for energy conversion [36, 37]. Notably, MCI also emerges as a primary source of reactive oxygen species (ROS), which have been implicated in the regulation of the NLRP3 inflammasome [38]. In line with our study, higher levels of NDUFA6 in blood were associated with an elevated risk of AA. This trend persisted across various tissues, including aorta, tibial artery, coronary artery, visceral omental adipose, and tibial nerve. These tissues are all potential sites of metformin action [39, 40]. Existing literature hints at metformin’s role in inhibiting MCI activity and cellular respiration [41, 42]. Intriguingly, our colocalization analysis pinpointed shared causal variants in blood, tibial artery, and visceral omental adipose that further suggested an intricate interplay between NDUFA6 expression across diverse tissues and AA risk. This finding provides support for the idea that metformin’s possible inhibition of MCI activity, and even mitochondrial ATP synthase [43], could be mediated through NDUFA6 suppression.
In addition to investigating NDUFA6 expression in various arterial tissues (aorta, tibial artery, coronary artery), our study also explored the visceral omental adipose and tibial nerve (limited to available data). The consistent elevation in NDUFA6 levels across these tissues correlated with increased AA risk. The link between perivascular adipose tissue (PVAT) and AA pathophysiology has been provided, given PVAT’s status as a paracrine organ that produces inflammatory agents with potential vascular impact [44]. Similarly, studies have hinted at the association between PVAT deposition and abdominal aortic aneurysm (AAA) pathology [45, 46], with metformin reducing visceral fat and adipose inflammation [47, 48]. Increased overall and regional aortic sympathetic nervous system activities within aortic lesions has been observed, along with metformin’s impact on peripheral nerve recovery [49, 50]. While not directly parallel to interactions in PVAT and the sympathetic nervous system, our findings offer mechanistic insights into metformin’s potential risk reduction in AA.
CYB5B, primarily located on the outer mitochondrial membrane, plays a role in the heme-dependent nitric oxide biosynthetic process [51, 52]. A study demonstrated the potential to enrich mitochondria using anti-CYB5B immunomagnetic beads, offering a viable method for mitochondrial micro-preparation from cultured cells [53]. Additionally, CYB5B overexpression has been identified in Hodgkin Lymphoma and aggressive Non-Hodgkin Lymphomas [54], further underscoring its link to mitochondria and immune response. Single-cell RNA sequencing studies have also revealed heightened immune cell presence and extensive mitochondrial dysfunction within ascending thoracic aortic aneurysm tissues [55]. Our study’s observation of elevated CYB5B levels in blood correlating with increased AA risk aligns with this framework. However, the absence of eQTL data for CYB5B across various tissues hinders our understanding of this gene’s specific role.
This study has several strengths. It elucidates the association between metformin and AA using the potent MR method, which effectively overcomes the potential influence of confounders, reverse causation, and traditional observational biases. Furthermore, we reveal the protective effect of type 2 diabetes on AA, attributing it to metformin and substantiating its mediating role. The identification of other possible metformin targets and their variants provides a robust foundation for guiding future drug repurposing studies.
Nevertheless, certain limitations should be acknowledged. The persistent influence of directional pleiotropy cannot be entirely ruled out due to the varying dosages of metformin across studies. Moreover, since the data we used lacked information on metformin dosage, patient sex, and lesion location, we were unable to conduct subgroup analysis to assess whether the protective effect of metformin on AA differed based on lesion site, sex, or dose-dependency. Another concern is that MR gene expression analysis depends on a limited set of genetic predictors, which raises potential issues about the bias of weak instrumental variables. In addition, the complex mechanisms underlying metformin’s effects still remain unclear, which could result in the omission of relevant targets and genes. Further experimental investigations are warranted. Moreover, it’s important to note that the study was confined to individuals of European ancestry, which may limit the generalizability of findings to other ethnicities.
This comprehensive study establishes a foundation for exploring the effects of metformin, grounded in genetics. It provides evidence supporting metformin’s causal impact on diminishing AA risk within the European population. The underlying mechanisms appear to be linked to disruptions in mitochondrial and immune regulation, with the MCI-associated gene NDUFA6 emerging as a critical mediator. These findings not only underscore the potential of repurposing metformin but also highlight to researchers the significance of focusing on NDUFA6 as a metformin-associated target for the prevention of AA in the broader population.
AA, aortic aneurysm; CI, confidence intervals; cis-eQTL, cis-expression quantitative trait loci; CYB5B, cytochrome b5 type B; EAF, effect allele frequency; GWAS, genome-wide association study; HMGB3, high mobility group box 3; IVW, inverse variance weighted method; LD, linkage disequilibrium; MR, Mendelian randomization; MR-PRESSO, Mendelian Randomization Pleiotropy RESidual Sum and Outlier; MVMR, multivariable Mendelian randomization; NDUFA6, NADH:ubiquinone oxidoreductase subunit A6; NDUFAF3, NADH:ubiquinone oxidoreductase complex assembly factor 3; OR, odds ratio; PRKAA1, protein kinase AMP-activated catalytic subunit alpha 1; SNP, single nucleotide polymorphisms.
Data on exposures and outcome were contributed by a number of studies in the IEU OpenGWAS database and were downloaded from https://gwas.mrcieu.ac.uk/. eQTL data from version 8 EUR of the GTEx Project were downloaded in https://gtexportal.org/home/datasets. eQTL data from eQTLGen Consortium were downloaded in https://www.eqtlgen.org/cis-eqtls.html. We also used the Phenoscanner web-based resource (http://www.phenoscanner.medschl.cam.ac.uk/). This study was presented in accordance with the Strengthening the Reporting of Observational Studies in Epidemiology using Mendelian Randomization (STROBE-MR) which downloaded from https://www.strobe-mr.org (checklist shown in Supplementary Table 15). The data generated from this paper are available in the Tables and the Supplementary Information. The data underlying this article will be shared upon reasonable request to the corresponding author.
JL conceived and designed the experiments. MX and LY performed the research and analyzed the data. BN, ZZ, XG and DZ collected the data and helped implement the research. JW, PL and ZY provided help and advice on the MR analysis. All authors contributed to editorial changes in the manuscript. All authors read and approved the final manuscript. All authors have participated sufficiently in the work and agreed to be accountable for all aspects of the work.
This manuscript includes public datasets from the IEU OpenGWAS database, GTEx Project, and eQTLGen Consortium. Each individual study included in this research received ethical approval from qualified institutional review boards, and all participants involved in these studies provided informed consent.
Not applicable.
This work was supported by grants from the National Natural Science Foundation of China (nos. 82270443, 82170066, 81670275, 81670443) and National High Level Hospital Clinical Research Funding (2022-NHLHCRF-ZSYX-01), the International S&T cooperation program (2013DFA31900), Major New Drug Creation Special Project (No. 2020ZX09201-012), Ministry of Science and Technology of the People’s Republic of China.
The authors declare no conflict of interest.
Publisher’s Note: IMR Press stays neutral with regard to jurisdictional claims in published maps and institutional affiliations.