
- Academic Editor
Background: Cardiac rehabilitation (CR) is essential in reducing
cardiovascular mortality and morbidity. High-intensity interval training (HIIT)
has emerged as a promising exercise intervention for enhancing clinical outcomes
in cardiac patients. This study aimed to investigate the effects of two
short-term exercise-based programs employing HIIT and moderate-intensity
continuous training (MICT) in comparison to a control group concerning blood
pressure, body composition, and blood biomarkers in patients diagnosed with
coronary artery disease (CAD). Methods: Seventy-two CAD patients (14%
women) underwent randomization into three groups: HIIT, MICT, and control. The
training programs encompassed six weeks of supervised treadmill exercises,
conducted thrice weekly. MICT targeted
Cardiovascular disease (CVD) stands as the predominant global cause of
mortality, contributing to a substantial 30% of all recorded deaths (16.7
million individuals) [1]. Within the ambit of CVD, coronary artery disease (CAD)
emerges as the most prevalent etiology in CVD-related fatalities. Forecasts
indicate a looming surge of 16.6% in CAD-related mortalities by the year 2030
[2]. Consequently, the implementation of effective strategies to mitigate the
impact of CVD assumes paramount importance. Among these strategies, comprehensive
exercise-based cardiac rehabilitation (CR) has garnered worldwide acceptance as a
potent secondary prevention tool for patients with various forms of CVD. A key
component of a CR program is exercise training which has demonstrated its
efficacy in not only reducing mortality rates but also augmenting the quality of
life, ameliorating frailty, and enhancing cardiovascular fitness (defined as peak
oxygen uptake [VO
Comprehensive CR programs encompass distinct phases designed to facilitate patients’ transition from acute hospital care (Phase I) to the resumption of their daily activities, spanning phases II (subacute), III (outpatient), and IV (maintenance). The World Health Organization (WHO) recognizes the multifaceted impact of exercise-based CR on patients, acknowledging its potential to influence their physical, psychological, and social well-being, enhance their overall quality of life, and mitigate the risk of potential complications [1]. Moreover, the implementation of safe exercise protocols, tailored to various intensity levels, exerts discernible effects on training endurance, oxygen capacity, and intervention outcomes. Notably, extant research has evidenced the favorable impact of exercise-based CR on a spectrum of physiological and clinical parameters, including blood pressure [2, 4], blood lipids [2, 4], insulin dynamics [2, 4], physical fitness [5, 6], body composition [7, 8, 9], heart rate variability (HRV) [10, 11, 12] and health-related quality of life [13, 14].
Moderate-intensity continuous training (MICT) has historically served as a
cornerstone in the prescription of aerobic-based exercise, typically consisting
of 30–60 min, targeting an intensity range of 50–75% of heart rate (HR) [15].
This approach has demonstrated both short-term and enduring clinical benefits for
individuals afflicted with CVD [16]. Notwithstanding these advantages, a
noteworthy proportion of the adult population, approximately 30%, grapples with
an inability to fulfill this exercise regimen due to constraints such as time
scarcity [17]. The protracted duration and intricate nature of MICT can
contribute to patient attrition, rendering exercise compliance challenging [18].
Conversely, high-intensity interval training (HIIT) has recently emerged as an
alternative or supplementary strategy to MICT. HIIT entails recurring bouts of
relatively elevated exercise intensity, typically within the range of 85–100%,
interspersed with intervals of lower-intensity recovery, totaling 20–30 min of
exercise [19]. Notably, HIIT has exhibited the capacity to yield comparable or
even superior enhancements in VO
Despite the pronounced health enhancements associated with CR, it is disconcerting that less than 8% of survivors of various CVD are enrolled in CR programs within Portugal, and among those who do enrol, adherence rates remain notably suboptimal [26]. Regrettably, the dearth of exercise-based CR initiatives in the country exacerbates this situation, with a glaring paucity in the geographical dispersion of these facilities. Notably, the absence of any CR center in the Alentejo region, where the prevalence of CVD is notably elevated, accentuates this concern. Moreover, while the merits of HIIT have gradually emerged, there exists a notable dearth of research elucidating the role and validity of HIIT in the context of CAD patients within the country. Hence, the primary objective of the present study is to scrutinize the ramifications of two distinct six-week exercise-based regimens, namely HIIT and MICT, with regard to their impacts on body composition and cardiovascular biomarkers, while concurrently assessing risk factors. These outcomes will be juxtaposed against those of a control group.
This study is a single-blinded randomized controlled trial (RCT) and followed the Consolidated Standards of Reporting Trials (CONSORT) guidelines for RCTs (http://www.consort-statement.org).
Three hundred and eight patients were enrolled in the study between March 2018
and November 2021, at the cardiology unit of the Espírito Santo Hospital of
Évora, Portugal. The study included patients who had suffered a coronary
event and were referred to the community-based exercise programs by their
cardiologist, two months after angioplasty. Patients between the ages of 18 and
80, with a left ventricular ejection fraction
After the baseline assessment and before the start of community-based exercise programs, the 72 patients were randomly assigned in a 1:1:1 allocation ratio to one of three groups: HIIT, MICT (traditional), and control (usual medical recommendations) (Fig. 1). To ensure that allocation concealment was maintained, patients belonging to each group were scheduled to be seen at specific, separate times that did not coincide with appointments for patients in the other groups. The three groups were carefully matched in terms of age, extent of coronary artery disease, coronary risk factors, type of coronary event, and left ventricular ejection fraction. While patients and physicians assigned to the intervention group were aware of their allocated category, outcome assessors and data analysts remained blinded to the allocation throughout the study.
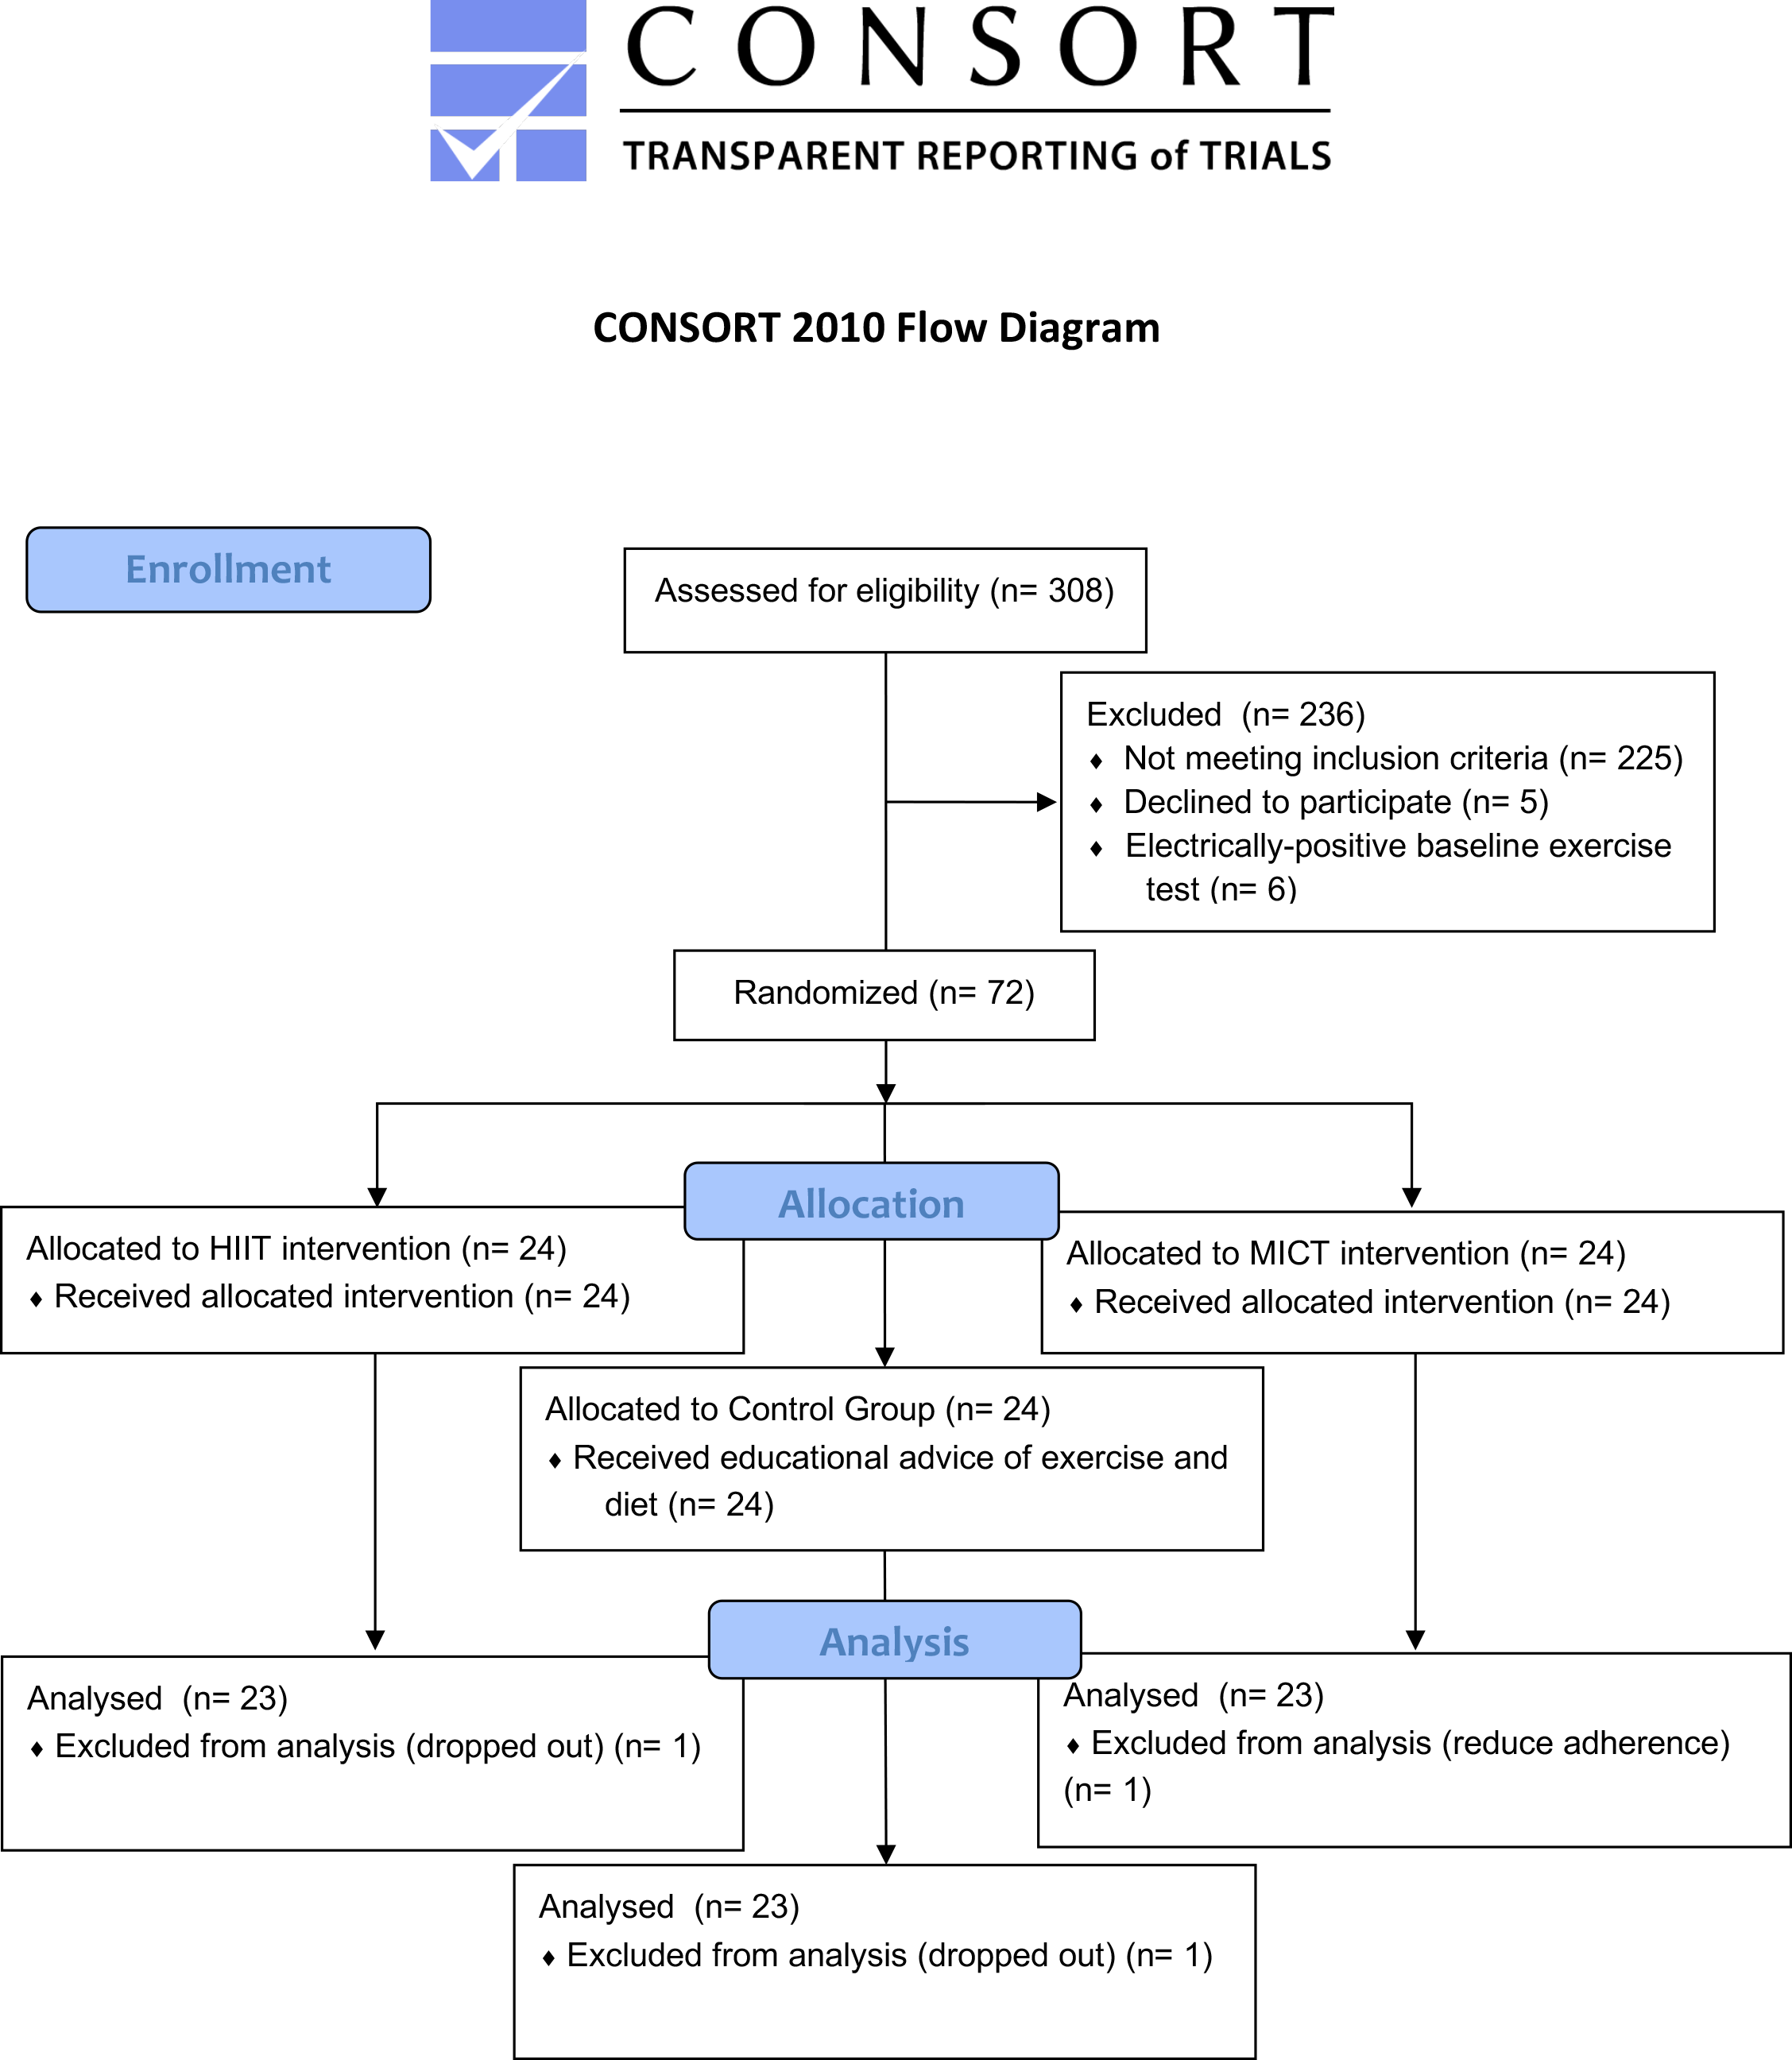 Fig. 1.
Diagram of the study. HIIT, high-intensity interval training; MICT, Moderate-intensity continuous training.
Initially, the CAD patients were submitted to a clinical evaluation performed by a cardiologist. A supervised graded exercise test to record volitional fatigue, risks or symptoms of ischemia was performed on a treadmill with the Bruce protocol [27] before the six-week intervention period. The test was done in non-fasting conditions and under medication. Electrocardiography was recorded continuously, and blood pressure was measured with an arm cuff every three minutes. Functional capacity in metabolic equivalents (METs) value was calculated. As a high proportion of patients with CAD are prescribed beta-blocker therapy, this relative method of exercise intensity takes into account the likely lower peak heart rate (HRpeak) achieved by these patients during the exercise test. To ensure training exercise intensity was reflective of medication effects, all patients were instructed to take their usual medications before the maximal exercise test.
Exercise capacity was considered as peak oxygen consumed (VO
Blood samples were collected on the same day as the exercise testing, but before the exercise. The final blood samples were collected 24–48 hours after the last exercise session. Levels of various biomarkers such as total cholesterol, low-density lipoprotein cholesterol (LDL-C), high-density lipoprotein cholesterol (HDL-C), triglycerides (TG), high-sensitive C-reactive protein (hsCRP), fasting blood glucose (FBG), hemoglobin A1c (HbA1c), higher free thyroxine (T4), and lower total triiodothyronine (T3), were measured. Blood samples were drawn at the beginning and at the end of the study.
On the second visit, the patients were submitted to a clinical evaluation of
body composition performed by a physiologist at the laboratory of the University
of Evora. Patients were asked to bring any medications that they were taking to
the assessments. Initially, each patient completed a standardized questionnaire
including medical history, medication use, demographic data, smoking status, and
family history of CVD. Body mass index (BMI) was calculated directly by the
standard formula: weight (kg) / height (m)
All measurements were taken at baseline and after the 6-week exercise-based programs.
After hospital discharge, educational intervention, dietary advice, and psychological support were performed for all patients. The exercise programs consisted of six weeks of supervised treadmill exercise, three sessions per week (Fig. 2). If a session was missed, it was made up that week or the following week. Patients performed each exercise session in a group, including a maximum of three patients per session.
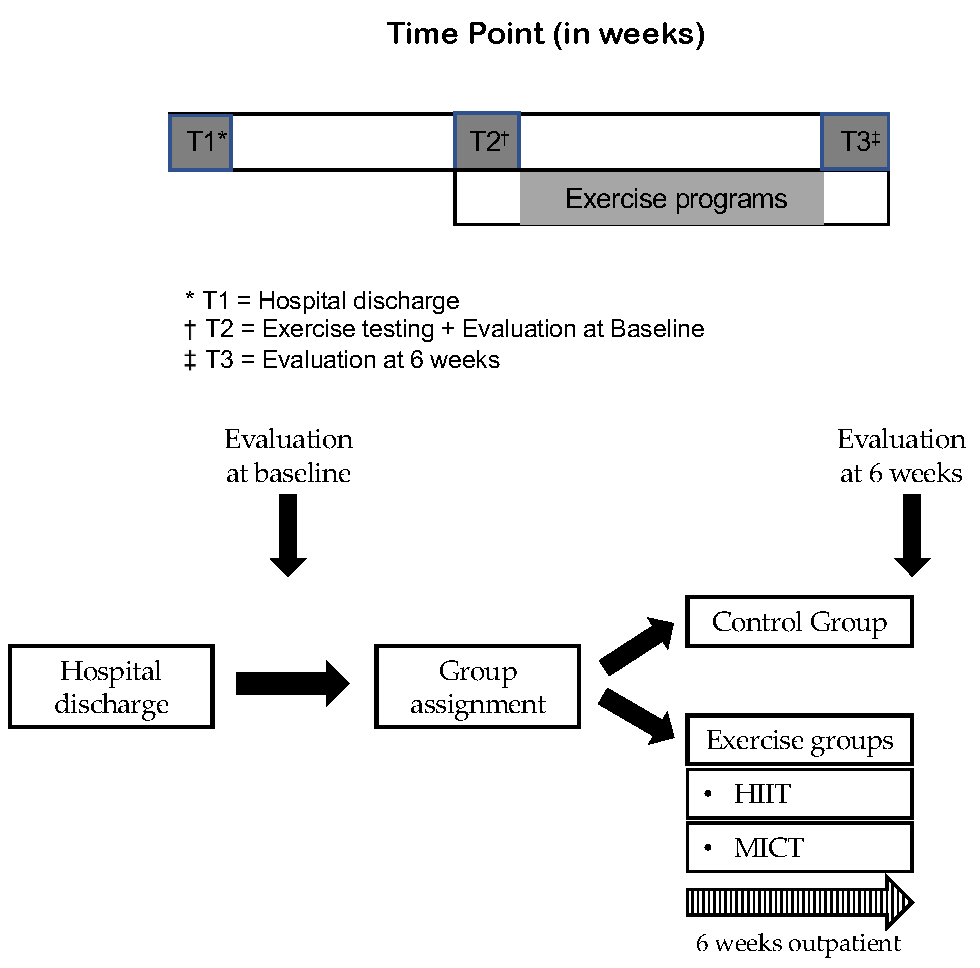 Fig. 2.
Study design and time frame. HIIT, high-intensity interval training; MICT, moderate-intensity continuous training; T, time point.
The exercise intensity was calculated using the following heart rate reserve
(HRR) equation: Target HR = [(HRmax (Maximum Heart Rate) – HRrest (Resting Heart Rate))]
Explanations for part labels A and B are ungiven in the Fig. 3 caption. Each
exercise session was initiated with a 5–10-minute warm-up at 50–60% HRpeak and
finished with 5 minutes of cool-down at 40% HRpeak. The HIIT group performed
4
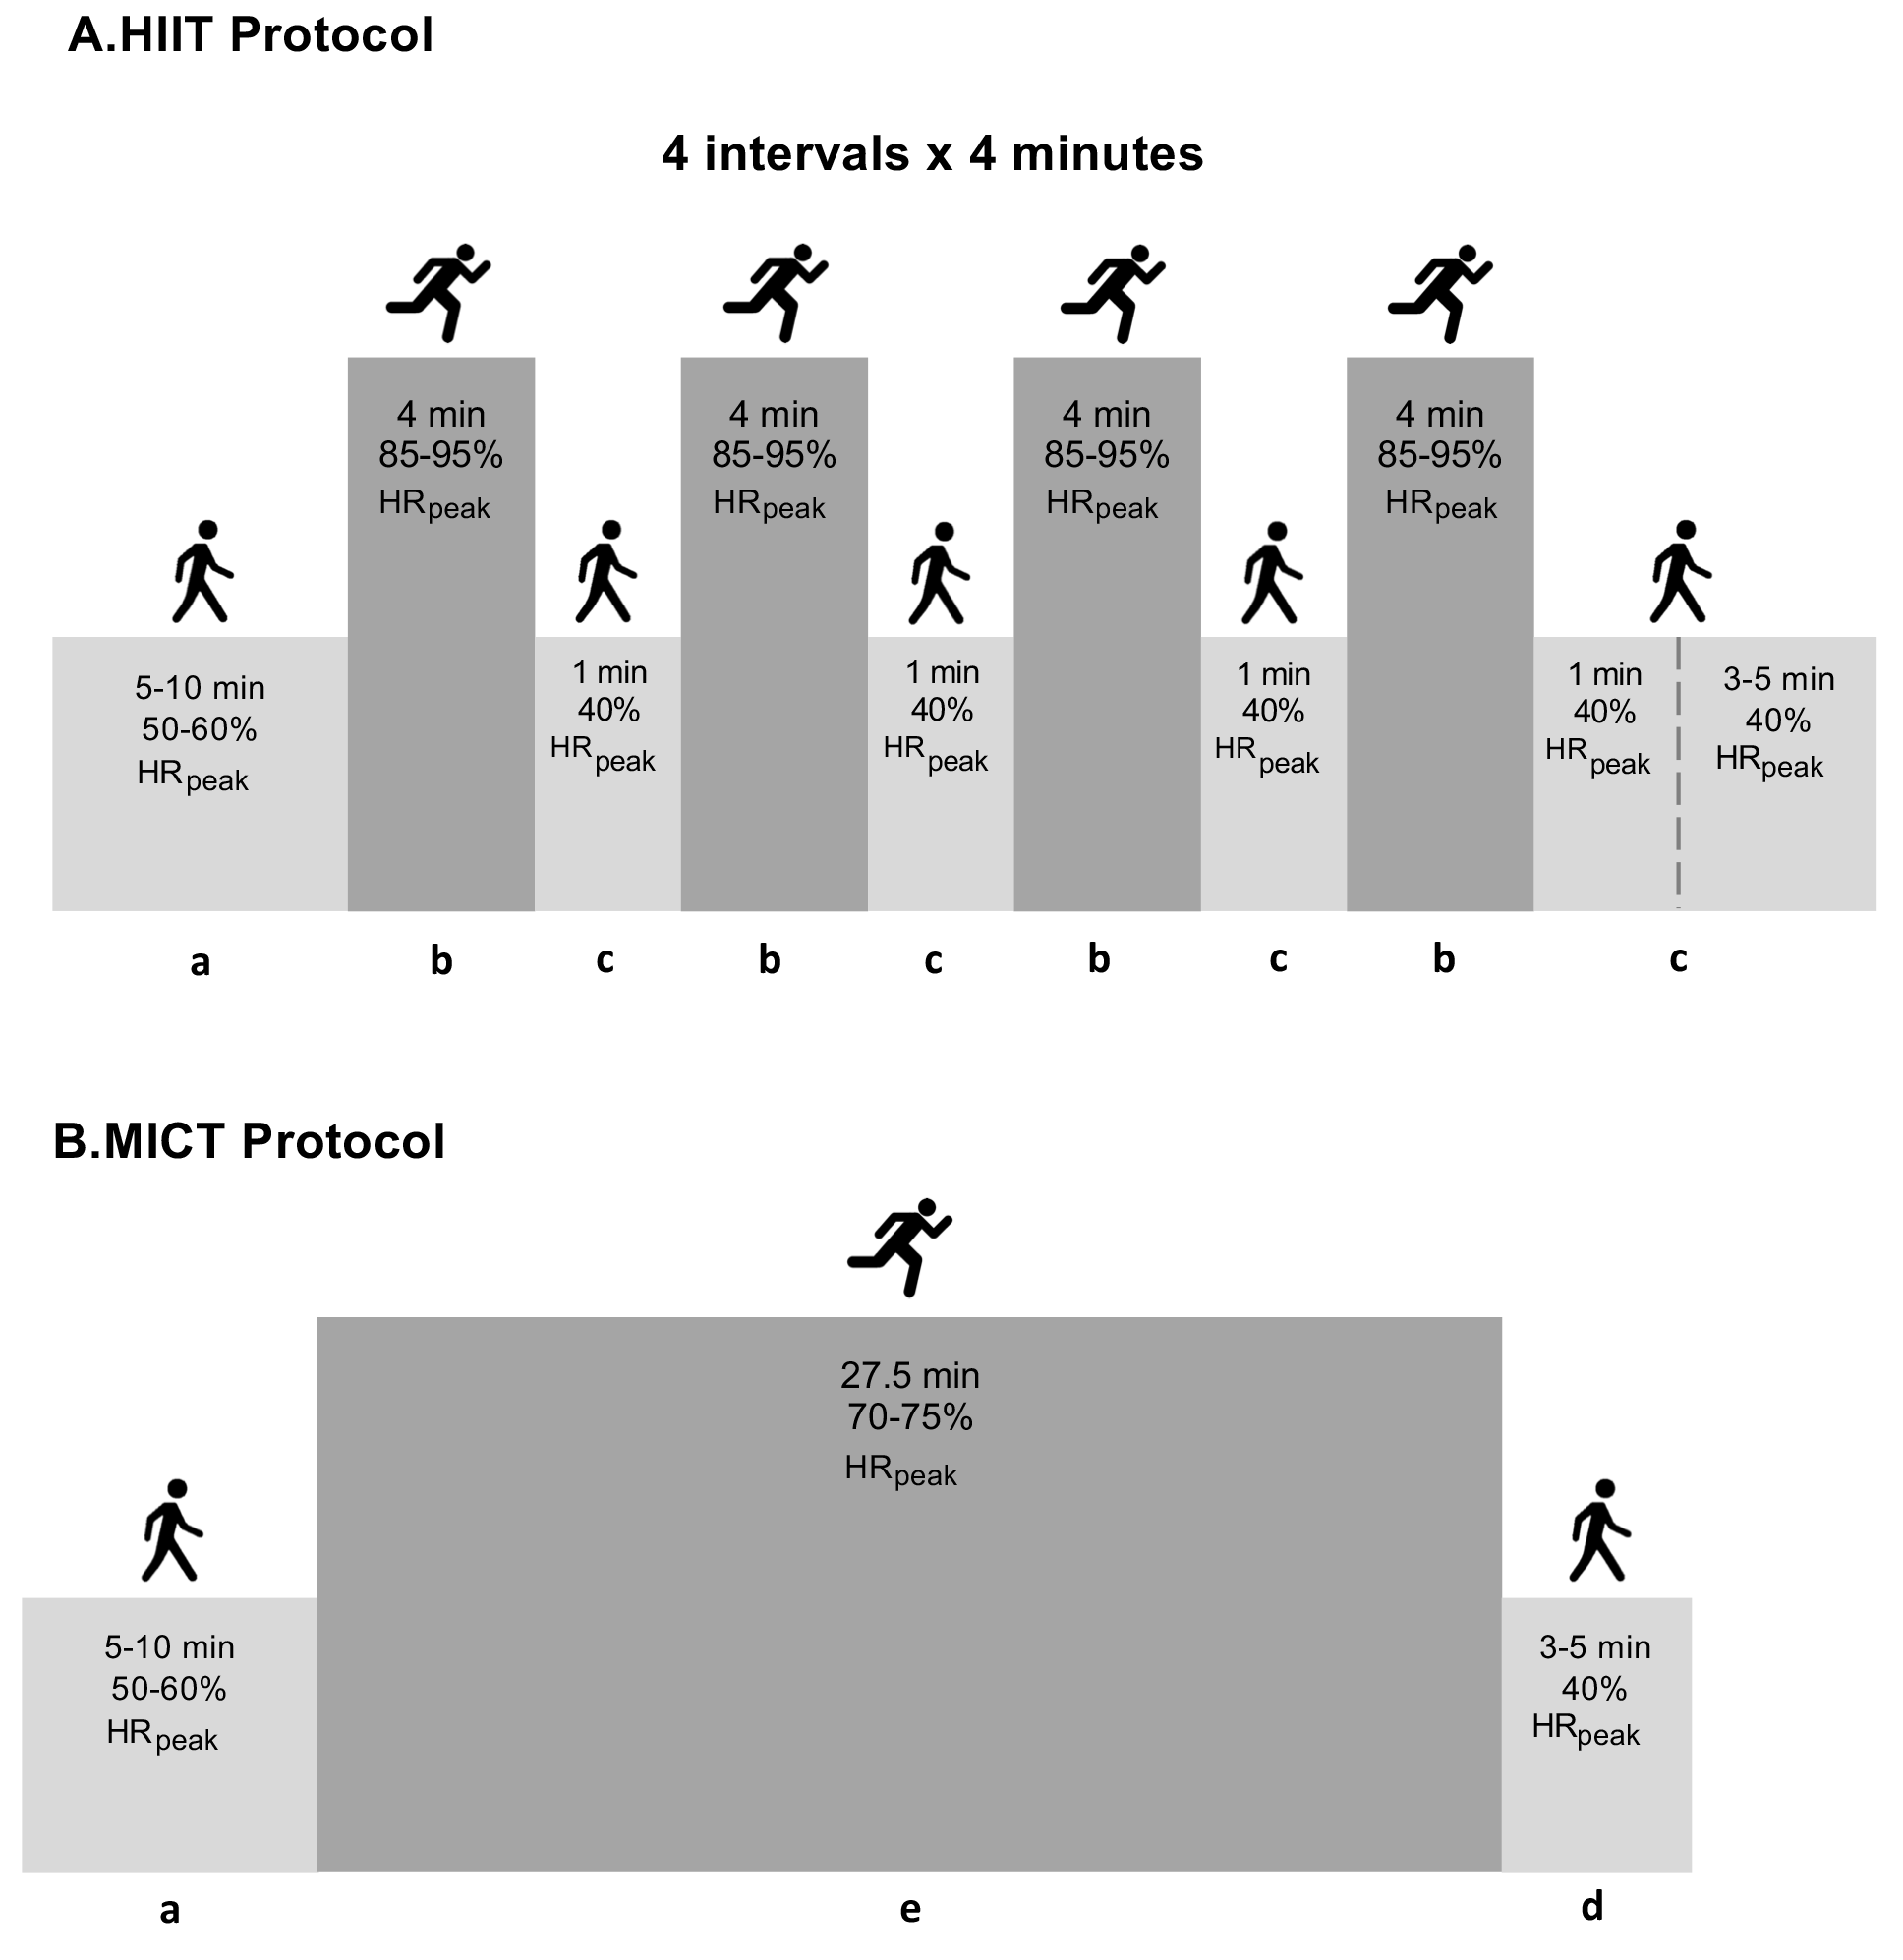 Fig. 3.
Summary of the exercise training protocols. Detailed description of exercise training protocol elsewhere [10]. Abbreviations: a, warm-up; b, interval bout of high-intensity exercise; c, one-minute recovery interval; d, cool-down; e, continuous bout of moderate-intensity exercise; HIIT, high-intensity interval training; MICT, moderate-continuous training; min, minutes; HRpeak, peak heart rate.
The sample size was calculated using the online G*Power software (University of Dusseldorf, Dusseldorf, Germany), considering an effect size of 0.3, a predefined sample power of 0.8, a predefined error probability defined as 0.05, and a statistical power of 95% [33]. As a result, we determined that a minimum sample size of 66 participants (22 participants for each group) was necessary to identify significant changes.
The normality and homogeneity assumptions were tested using the Kolmogorov-Smirnov and Levene tests, respectively. Since the majority of sample variables did not conform to a normal distribution, non-parametric statistical analyses were used. Between-group comparisons were performed using the Kruskal-Wallis test, while within-group comparisons were performed using the Friedman test. Both tests were then followed by post hoc pairwise comparisons.
The means and standard deviations were calculated for all variables. The delta
value (
The effect size (ES) was calculated using Cohen’s method since the data did not
follow a normal distribution [33]. The ES was classified based on Cohen’s
thresholds (defined as small: 0.10; medium: 0.30; and large: 0.50) [34]. The
analyses were performed using SPSS (version 26.0, SPSS Inc., Chicago, IL, USA). A
value of p
According to the standards for dyslipidemia, we considered a HDL-C level below
50 mg/dL (for women) or below 40 mg/dL (for men), as well as a TG level of 150
mg/dL or higher, as criteria for diagnosis [35]. A hsCRP test result of 1.0 and
10.0 milligrams per deciliter (mg/dL) is defined as moderately elevated [36]. For
the diagnosis of diabetes mellitus, we utilized the American Diabetic Association
criteria [37]. Namely, the pre-diabetic stage was identified by HbA1c levels
between 5.7 and 6.4, or impaired fasting blood glucose levels between 100 and 125
mg/dL, and diabetes mellitus was diagnosed with HbA1c
The baseline characteristics of participants, as presented in Table 1, exhibited
no statistically significant differences among the HIIT, MICT, and control
groups: age (50
| Exercise-based program | No exercise-based program | ||||
| HIIT (n = 23) | MICT (n = 23) | Control (n = 23) | |||
| Demographics | |||||
| Age (years), mean |
50 |
55 |
57 | ||
| 2 (8.7) | 3 (13.0) | 4 (17.4) | |||
| Gender (Male/Female) | 20/3 | 19/4 | 20/3 | ||
| Retired, n (%) | 2 (8.7) | 7 (30.4) | 7 (30.4) | ||
| Anterior MI, n (%) | 3 (13.0) | 4 (17.4) | 2 (8.7) | ||
| Coronary event/intervention | |||||
| CABG, n (%) | 1 (4.3) | 1 (4.3) | 1 (4.3) | ||
| PCI, n (%) | 22 (95.7) | 22 (95.7) | 22 (95.7) | ||
| VO |
24.7 |
23.4 |
23.5 | ||
| Risk factors or comorbidities | |||||
| Diabetes mellitus, n (%) | 10 (43.5) | 9 (39.1) | 10 (43.5) | ||
| Hypertension, n (%) | 13 (56.5) | 13 (56.5) | 14 (60.9) | ||
| Dyslipidemia, n (%) | 14 (60.9) | 15 (65.2) | 15 (65.2) | ||
| Body Mass index (kg/m |
28.2 |
29.4 |
29.4 | ||
| Waist Circumference (cm), mean |
98.4 |
101.1 |
101.1 | ||
| Active smoker, n (%) | 6 (26.1) | 4 (17.4) | 4 (17.4) | ||
| Non-smoker, but has been, n (%) | 9 (39.1) | 13 (56.5) | 12 (52.2) | ||
| Family history of CVD, n (%) | 14 (60.9) | 16 (69.6) | 16 (69.6) | ||
| Sedentarism, n (%) | 13 (56.5) | 19 (82.6) | 19 (82.6) | ||
| Sleep |
6 (26.1) | 9 (39.1) | 11 (47.8) | ||
| Current medication | |||||
| ACE inhibitor, n (%) | 21 (91.3) | 23 (100) | 22 (95.7) | ||
| ARBs, n (%) | 16 (69.6) | 7 (73.9) | 11 (47.8) | ||
| Antiplatelet, n (%) | 22 (95.7) | 22 (95.7) | 23 (100) | ||
| CCBs, n (%) | 2 (8.7) | 5 (21.7) | 5 (21.7) | ||
| Beta-blockers, n (%) | 21 (91.3) | 22 (95.7) | 22 (95.7) | ||
| Diuretics, n (%) | 2 (8.7) | 4 (17.4) | 6 (26.1) | ||
| Insulin, n (%) | 5 (21.7) | 5 (21.7) | 11 (47.8) | ||
| Statin, n (%) | 22 (95.7) | 22 (95.7) | 23 (100) | ||
CABG, coronary artery bypass graft; PCI, percutaneous coronary intervention;
CVD, cardiovascular disease; ACE, angiotensin-converting enzyme inhibitor; ARBs, angiotensin II receptor
blockers; CCBs, calcium channel blockers; HIIT, high-intensity interval training;
MI, myocardial infarction; MICT, moderate-intensity continuous training;
VO
Data are reported as Mean
At baseline, there were no differences across groups at rest for resting HR,
systolic blood pressure (SBP) or diastolic blood pressure (DBP). After six weeks,
the exercise-based groups reported a significant decrease in SBP and DBP compared
with the control (Table 2). The HIIT group reported a significant decrease in SBP
(
| Baseline (A) | 6-week (B) | p-value | ES (95% CI) | Pairwise comparison | ||
| Resting HR (bpm) | ||||||
| HIIT (n = 23) | 70 |
63 |
0.061 | –0.556 (–0.918; –0.194) | - | |
| MICT (n = 23) | 67 |
62 |
0.020 | –0.551 (–1.060; –0.043) | - | |
| Control (n = 23) | 69 |
68 |
0.835 | –0.202 (–0.459; 0.054) | - | |
| SBP (mm Hg) | ||||||
| HIIT (n = 23) | 135 |
121 |
–1.270 (–1.825; –0.715) | A | ||
| MICT (n = 23) | 135 |
125 |
–0.861 (–1.208; –0.514) | A | ||
| Control (n = 23) | 139 |
136 |
0.297 | –0.439 (–0.914; 0.035) | - | |
| DBP (mm Hg) | ||||||
| HIIT (n = 23) | 95 |
88 |
–1.106 (–1.624; –0.587) | A | ||
| MICT (n = 23) | 94 |
89 |
–1.191 (–1.659; –0.722) | A | ||
| Control (n = 23) | 95 |
97 |
0.144 | 0.360 (0.092; 1.052) | - | |
bpm, beats per minute; DBP, diastolic blood pressure; ES, effect size; HIIT,
high-intensity interval training; HR, heart rate; MICT, moderate-intensity
continuous training; SBP, systolic blood pressure.
Values are reported as Mean
At baseline, there were no differences across groups in body composition
measurements. Following six weeks of exercise, the results (Table 3) showed that
the HIIT group demonstrated significant improvements compared to MICT in body fat
mass (
| Baseline (A) | 6-week (B) | p-value | ES (95% CI) | Pairwise comparison | ||
| Body weight (kg) | ||||||
| HIIT (n = 23) | 82.6 |
79.9 |
–0.202 (–0.331; –0.073) | - | ||
| MICT (n = 23) | 81.9 |
81.1 |
0.003 | –0.072 (–0.160; 0.016) | - | |
| Control (n = 23) | 83.1 |
83.6 |
0.513 | 0.010 (–0.060; 0.079) | - | |
| BMI (kg/m |
||||||
| HIIT (n = 23) | 28.2 |
27.2 |
–0.221 (–0.358; –0.085) | - | ||
| MICT (n = 23) | 29.5 |
29.2 |
0.005 | –0.062 (–0.150; 0.026) | - | |
| Control (n = 23) | 29.4 |
29.5 |
0.655 | 0.014 (–0.074; 0.102) | - | |
| Body fat (%) | ||||||
| HIIT (n = 23) | 28.2 |
27.0 |
0.002 |
–0.186 (–0.280; –0.092) | A | |
| MICT (n = 23) | 32.6 |
31.2 |
–0.215 (–0.340; –0.089) | A | ||
| Control (n = 23) | 29.7 |
30.0 |
0.827 | 0.025 (–0.063; 0.114) | - | |
| Body fat mass (kg) | ||||||
| HIIT (n = 23) | 23.1 |
22.0 |
–0.146 (–0.236; –0.026) | A | ||
| MICT (n = 23) | 25.7 |
24.7 |
–0.217 (–0.377; –0.057) | A | ||
| Control (n = 23) | 24.8 |
25.3 |
0.061 | 0.089 (0.021; 0.158) | - | |
| Abdominal fat (%) | ||||||
| HIIT (n = 23) | 36.3 |
34.5 |
–0.283 (–0.427; –0.138) | A | ||
| MICT (n = 23) | 37.4 |
36.1 |
–0.192 (–0.285; –0.099) | A | ||
| Control (n = 23) | 37.4 |
38.4 |
0.023 | 0.165 (0.059; 0.271) | - | |
| Lean mass (kg) | ||||||
| HIIT (n = 23) | 54.7 |
55.3 |
0.144 | 0.041 (–0.034; 0.117) | - | |
| MICT (n = 23) | 55.7 |
56.4 |
0.007 | 0.130 (0.025; 0.235) | - | |
| Control (n = 23) | 56.6 |
56.9 |
0.835 | 0.021 (–0.031; 0.072) | - | |
| WC (cm) | ||||||
| HIIT (n = 23) | 98.3 |
93.8 |
0.002 |
–0.341 (–0.563; –0.119) | A | |
| MICT (n = 23) | 101.0 |
98.3 |
0.002 |
–0.272 (–0.456; –0.088) | A | |
| Control (n = 23) | 101.7 |
102.8 |
0.491 | 0.002 (–0.139; 0.144) | - | |
BMI, body mass index; ES, effect size; HIIT, high-intensity interval training;
MICT, moderate-intensity continuous training; WC, waist circumference.
Values are reported as Mean
Concerning blood biomarkers (Table 4), there were no differences across groups
at baseline, but significant within-group changes between the baseline and the
post-intervention were observed in both exercise protocols. The HIIT group
revealed significant results comparing to MICT in HbA1c (
| Baseline (A) | 6-week (B) | p-value | ES (95% CI) | Pairwise comparison | ||
| Total cholesterol (mmol/L) | ||||||
| HIIT (n = 23) | 175 |
151 |
–1.351 (–1.198; –0.714) | A | ||
| MICT (n = 23) | 173 |
150 |
–0.677 (–1.023; –0.331) | - | ||
| Control (n = 23) | 171 |
168 |
0.835 | –0.062 (–0.436; 0.312) | - | |
| HDL-C (mmol/L) | ||||||
| HIIT (n = 23) | 43 |
54 |
1.170 (0.640; 1.701) | A | ||
| MICT (n = 23) | 43 |
52 |
1.053 (0.598; 1.508) | A | ||
| Control (n = 23) | 40 |
47 |
0.002 | 0.588 (0.234; 0.942) | - | |
| LDL-C (mmol/L) | ||||||
| HIIT (n = 23) | 117 |
85 |
–1.330 (–1.857; –0.804) | A | ||
| MICT (n = 23) | 120 |
92 |
–0.659 (–0.950; 0.367) | A | ||
| Control (n = 23) | 117 |
119 |
0.144 | 0.039 (–0.227; 0.304) | - | |
| Triglycerides (mmol/L) | ||||||
| HIIT (n = 23) | 200 |
137 |
–1.119 (–1.544; –0.693) | A | ||
| MICT (n = 23) | 187 |
138 |
–0.598 (–0.856; –0.341) | A | ||
| Control (n = 23) | 188 |
187 |
1.00 | 0.036 (–0.207; 0.135) | - | |
| HbA1c (%) | ||||||
| HIIT (n = 23) | 6.1 |
5.4 |
–0.645 (–0.992; –0.298) | A | ||
| MICT (n = 23) | 5.8 |
5.4 |
–0.370 (–0.506; –0.233) | - | ||
| Control (n = 23) | 6.2 |
6.2 |
0.670 | 0.008 (–0.227; 0.227) | - | |
| FBG (mg/dL) | ||||||
| HIIT (n = 23) | 118 |
106 |
0.002 |
–0.466 (–0.776; –0.155) | A | |
| MICT (n = 23) | 114 |
109 |
0.007 |
–0.271 (–0.537; –0.004) | A | |
| Control (n = 23) | 122 |
122 |
0.532 | 0.003 (–0.245; 0.251) | - | |
| hsCRP (mg/L) | ||||||
| HIIT (n = 23) | 1.5 |
0.4 |
–0.796 (–1.312; –0.280) | A | ||
| MICT (n = 23) | 1.1 |
0.4 |
–0.805 (–1.280; –0.329) | A | ||
| Control (n = 23) | 1.3 |
1.1 |
0.532 | 0.004 (–0.604; –0.004) | - | |
| TSH (mU/L) | ||||||
| HIIT (n = 23) | 1.6 |
1.3 |
0.007 |
–0.407 (–0.830; 0.016) | A | |
| MICT (n = 23) | 1.9 |
1.7 |
0.201 | –0.242 (–0.543; 0.058) | - | |
| Control (n = 23) | 1.8 |
2.4 |
0.007 | 0.089 (–0.109; 0.760) | - | |
| T4 (ng/dL) | ||||||
| HIIT (n = 23) | 0.9 |
1.0 |
0.006 | 0.439 (0.086; 0.793) | - | |
| MICT (n = 23) | 0.9 |
1.0 |
0.007 | 0.089 (0.300; 1.138) | - | |
| Control (n = 23) | 1.0 |
1.1 |
0.022 | 0.188 (0.035; 0.341) | - | |
| T3 (ng/dL) | ||||||
| HIIT (n = 23) | 3.7 |
3.4 |
0.002 |
–0.465 (–0.844; –0.085) | A | |
| MICT (n = 23) | 3.7 |
3.5 |
0.002 |
–0.327 (–0.561; –0.094) | A | |
| Control (n = 23) | 4.4 |
5.3 |
0.144 | 0.260 (–0.156; 0.675) | - | |
ES, effect size; FBG, fasting blood glucose; HDL-C, high density lipoprotein
cholesterol; HIIT, high-intensity interval training; hsCRP, high-sensitive
C-reactive protein; HbA1c (%), hemoglobin A1C; LDL-C, low density lipoprotein
cholesterol; MICT, moderate-intensity continuous training; TSH, thyrotropin; T3, triiodothyronine; T4, thyroxin. Values are
reported as Mean
The respective ES from baseline to post-intervention in the HIIT group were small in FBG (d = 0.47) and endocrine variables: T4 (d = 0.44), T3 (d = 0.47) and TSH (d = 0.41); medium in HbA1c (d = 0.65) and hsCRP (d = 0.80); and large in the cholesterol variables: Total cholesterol (TC) (d = 1.35), HDL-C (d = 1.17), LDL-C (d = 1.33) and TG (d = 1.12). In the MICT group, the respective effect sizes were small in HbA1c (d = 0.37), FBG (d = 0.27), T3 (d = 0.33) and TSH (d = 0.24); medium in TC (d = 0.68), LDL-C (d = 0.66) and TG (d = 0.60); and large in hsCRP (d = 0.81) and HDL-C (d = 1.05).
For habitual physical activity and dietary intake, there was no specific control. Patients just followed the ideal recommendations given by the medical specialist.
Only one patient from each group discontinued the intervention, achieving 96% adherence in both groups, HIIT and MICT protocols. There were no adverse events in either protocol (HIIT and MICT) during the exercise interventions. Thus, HIIT protocols proved to be a safe, effective, and pleasant tool for low-risk patients with CAD as well.
To our knowledge, this study represents a pioneering endeavor as an inaugural randomized controlled trial to systematically evaluate and differentiate the impacts of HIIT as opposed to MICT, in contrast to a control group, throughout a 6-week community-based exercise program in Portugal. The main findings of our study are as follows: (i) in low-risk CAD patients HIIT and MICT exercise protocols promoted a significant improvement in blood pressure profile, body weight, BMI, body fat percentage, total body fat mass, abdominal fat percentage and waist circumference, compared to the control group; (ii) blood biomarkers improvement in patients undergoing the HIIT protocol was slightly higher than MICT and mainly detected by hsCRP and TSH. In contrast, the control group had no significant improvements in these parameters. It is noteworthy that several variables exhibited an overall increase from baseline to the post-intervention phase, underscoring the systemic physiological responses engendered by exercise interventions. However, it is of significance to highlight that exceptions to this trend were observed in the form of reductions in total cholesterol and hsCRP levels from baseline to post-intervention.
Elevated blood pressure constitutes a prevalent health condition associated with
heightened mortality and an augmented risk of cardiovascular disease [23].
Existing literature, as elucidated by Pattyn et al. [39],
underscores the favorable impact of aerobic exercise on both SBP and DBP.
Specifically, Cornelissen et al. [40] reported a reduction of 3.5
mm Hg (95% CI 2.3–4.6) and 2.5 mm Hg (95% CI 1.7–3.2) in SBP and DBP,
respectively, following aerobic exercise interventions. In consonance with these
findings, our study, conducted over a six-week exercise intervention period,
unveiled substantial reductions in both SBP and DBP among participants in the
HIIT group, with a decline of 9 mm Hg for SBP and 6 mm Hg for DBP. Similarly, the
MICT group exhibited significant
reductions in SBP (8 mm Hg) and DBP (6 mm Hg). Conversely, the control group
demonstrated an incremental increase in SBP (1.6 mm Hg) and DBP (1 mm Hg).
Remarkably, our results align with prior investigations, such as the study by
Nybo et al. [41] which examined HIIT and MICT interventions over a
12-week period and reported notable improvements in this cardiovascular risk
factor. Specifically, the HIIT group exhibited significant reductions of 8 mm Hg
for SBP and 2 mm Hg for DBP, while the MICT group experienced reductions of 8 mm
Hg for SBP and 5 mm Hg for DBP. Nevertheless, it is essential to acknowledge the
influence of exercise intensity on blood pressure outcomes. Molmen-Hansen
et al. [23], in their study, implemented high-intensity training at
80–90% of maximum heart rate for the HIIT group (n = 15) and moderate-intensity
training at 50–70% of maximum heart rate for the MICT group (n
Obesity, either as an independent risk factor or in conjunction with other comorbidities, significantly heightens the susceptibility to incident CAD [42]. Pertinently, measures of body fat mass and percentage have established associations with an elevated risk of cardiovascular events and all-cause mortality [43, 44]. Additionally, higher values of BMI, increased waist circumference, and augmented waist-hip ratio have been reliably linked to a heightened risk of premature mortality [2, 45, 46]. Within the framework of our RCT, we discerned a conspicuous positive influence of both HIIT and MICT on the body composition of CAD patients. Contrastingly, individuals who abstained from participating in any community-based exercise program after their cardiac event displayed tendencies towards weight gain and increased fat mass. Specifically, following a six-week intervention period within the community-based exercise program, patients in the HIIT group exhibited a weight reduction of 1.9 kg more than their counterparts in the MICT group. In contrast, the control group displayed an increment of 0.5 kg. Moreover, in terms of WC, the HIIT group demonstrated a substantial decrease of –4.5 cm, while the MICT group exhibited a decrease of –2.7 cm. In stark contrast, the control group evidenced an increase of 1.1 cm. These outcomes provide compelling evidence of the favorable impact exerted by higher-intensity exercise sessions within community-based exercise programs on body composition, which corroborates findings reported by previous studies [27, 42, 45, 46]. In our investigation, truncal fat percentage was assessed using DXA, a measure highly correlated with abdominal fat percentage [47]. Our results showcased a reduction in abdominal fat percentage, translating to a decline of 1.8% in the HIIT group and 1.3% in the MICT group, signifying a 2.8% advantage over the control group after six weeks. Previous research efforts have also probed into the efficacy of HIIT in reducing abdominal fat among CAD patients. For instance, Dun et al. [48] compared HIIT and MICT and reported that supervised HIIT engendered significant reductions in total fat mass, abdominal fat percentage, and an improved lipid profile in CAD patients. Similarly, Trapp et al. [49] conducted a comparative analysis of HIIT and MICT, finding that the HIIT group exhibited a more pronounced decrease in abdominal fat. Slightly different were the results of the study of Zhang et al. [50], once they demonstrated that both HIIT and MICT significantly reduced total and abdominal fat mass. It is worth noting that the study duration of six weeks in our investigation may be considered relatively short. With an extended intervention period, one could reasonably anticipate the emergence of clinically meaningful effects [48]. In the context of weight control strategies for this population, aerobic programs such as walking are crucial. The distribution of exercise intensity can affect the effectiveness of these programs. Depending on whether the load is concentrated, or continuous, different adaptations may occur due to varying levels of exertion [51]. Continuous doses can result in higher exertion for exercises with similar external intensity, while concentrating the load may lead to increased fatigue and more pronounced physiological alterations [10, 51]. For instance, a study on brisk walking in middle-aged obese females showed that both continuous and intermittent strategies were effective, but the continuous group had slightly better results in terms of weight loss and reduction of fat mass [52].
Considering the analysis of the patients’ blood biomarkers, our study results
demonstrated a significant improvement in the patients of the HIIT and MICT
groups. In contrast, the control group, which did not partake in any
community-based exercise program, exhibited minimal changes across these
biomarkers, with exceptions noted in HDL-C and T4, both of which increased. When
we scrutinized patients within each exercise program, we observed strikingly
similar and significant reductions in all blood lipid parameters, hsCRP, T3, and
blood sugar variables for both the HIIT and MICT groups. Importantly, following
the six-week intervention, the control group displayed deteriorating results
across all blood variables, whereas both HIIT and MICT engendered enhancements in
TC, HDL-C, LDL-C, TG, hsCRP, T3 and HbA1c. These findings bear clinical
significance, particularly in the context of patients with CAD who concurrently
grapple with type 2 diabetes and dyslipidemia, necessitating pharmacotherapeutic
interventions. Remarkably, both exercise protocols succeeded in driving variable
values back to normal levels. Our results resonate with existing literature that
has juxtaposed HIIT against MICT, showcasing HIIT’s potential to induce
alterations in numerous physiological and health-related markers [45]. Notably,
HIIT demonstrated more pronounced improvements in total cholesterol, low-density
lipoproteins, and triglycerides among CAD patients, as reported by Elmer
et al. [53] who also observed a greater reduction in triglyceride
concentrations in HIIT compared to MICT. According to Ouerghi et al.
[54], short-term CR programs (
In our study, it is noteworthy that the initial assessment revealed average
levels of TSH, T3, and T4 within the normal range for all groups. Following a
six-week exercise intervention, a notable trend towards further normalization of
these values was observed, contrasting with a slight increase in these levels
within the control group. It is crucial to underscore that subclinical
hypothyroidism characterized by TSH levels exceeding 6.57 µIU/mL has been
robustly linked to a significantly elevated risk of cardiovascular events and
all-cause mortality [57]. Two pertinent studies showed that high TSH levels have
a protective effect on stroke severity and prognosis [58, 59]. This observation
underscores the importance of early intervention in cases of asymptomatic
hypothyroidism, especially when TSH levels exceed or equal to 8 µIU/mL, and
particularly in individuals under the age of 65 who exhibit symptoms or possess
cardiac risk factors [60, 61]. Moreover, Ojamaa et al. [62] have
demonstrated that low T3 syndrome also happens in an animal model of acute
myocardial infarction (AMI), where T3 levels decreased within a week and stayed
Elevated levels of HbA1c exceeding 8.5% have been established as predictive of
an increased risk of all-cause CVD [65]. A normal HbA1C level is below 5.7%,
whereas levels between 5.7% and 6.4% signify prediabetes, and levels at or
above 6.5% indicate diabetes [65]. Notably, individuals with higher HbA1C levels
within the prediabetes range are at a heightened risk of progressing to type 2
diabetes. Furthermore, it’s worth noting that hypothyroid patients often exhibit
elevated HbA1c levels, which can be normalized through effective treatment
addressing thyroid function, without significantly affecting FBG levels [66]. The
normal range for FBG is typically 99 mg/dL or lower, while FBG levels between
100–125 mg/dL are indicative of prediabetes, and levels at or exceeding 126
mg/dL signify diabetes [66]. Within the context of our RCT, the initial
assessment indicated that the average FBG and HbA1c levels of the study groups
fell within the prediabetic range. However, following the six-week
community-based exercise interventions, these levels exhibited a noteworthy trend
towards normalization, whereas the control group experienced a marginal increase
in their levels. The well-established effect of physical activity on glycemic
control and body composition is corroborated by existing literature. Exercise
training has been recognized as a frontline intervention for type 2 diabetes
management, with numerous studies underscoring the efficacy of both HIIT [67, 68, 69]
and MICT [70, 71] in effectively managing this condition. For instance, Mitranun
et al. [72] reported that HIIT and MICT led to similar reductions in
blood glucose and body fat levels among individuals with type 2 diabetes, while
HbA1c levels exhibited a significant reduction with HIIT compared to MICT
(p
High-sensitive C-reactive protein is an indicator of metabolic disorders associated with an increased risk for CVD [74]. This heightened risk is attributed to the progression of atherosclerosis, characterized by the accumulation of cholesterol on the inner linings of blood vessels and inflammation within the vessel walls [75]. Generally, a healthy hsCRP level falls below 0.9 milligrams per deciliter (mg/dL). When hsCRP test results range between 1.0 to 10.0 mg/dL, they are typically categorized as moderately elevated [36]. In our study, baseline assessments revealed that all groups exhibited moderately elevated hsCRP levels. However, following a six-week exercise intervention, both HIIT and MICT regimens succeeded in lowering hsCRP levels to within the normal range, in stark contrast to the control group, which maintained elevated values. Additionally, a substantial proportion of patients in the HIIT and MICT groups achieved hsCRP levels of less than 1 mg/L, indicative of a low risk of developing cardiovascular complications [76]. This underscores the clinical significance of the exercise’s anti-inflammatory effects. Numerous studies have demonstrated that exercise regimens targeting cardiovascular health, such as HIIT or MICT, primarily induce reductions in pro-inflammatory markers, including hsCRP [77, 78, 79]. Our findings suggest that HIIT may be more efficient in reducing hsCRP levels compared to MICT, consistent with the findings of some prior studies [79, 80]. Nevertheless, it’s worth noting that recent meta-analyses have not yielded conclusive evidence regarding whether HIIT consistently outperforms traditional MICT in terms of its impact on inflammatory states [78, 81]. Furthermore, limited research has explored the interplay between hsCRP levels and exercise programs specifically within the context of CAD patients.
Regarding the adherence of CAD patients to our programs, we report that only one patient in each group discontinued the intervention, reaching 96% adherence in both protocols (HIIT and MICT). Importantly, these exercise regimens demonstrated a commendable safety profile, with no reported adverse events during the exercise interventions. Our study boasts several notable strengths. It adhered to a randomized design, employed objective outcome measures, and featured blinded assessors to minimize bias. Additionally, the training interventions were thoughtfully individualized while maintaining consistent relative intensity in accordance with the HIIT principle. The favorable efficacy outcomes are particularly encouraging, given the substantial and clinically relevant improvements achieved within a relatively brief timeframe of six weeks, with a total of 18 sessions per patient. Collectively, these findings underscore the HIIT protocol as a safe, effective, and enjoyable tool for CAD patients, holding promise for enhancing their rehabilitation and overall well-being.
This study includes certain limitations that should be acknowledged. Firstly, the relatively small sample size raises the possibility that only more substantial differences would attain statistical significance. Secondly, the unintended gender bias observed in the patient cohort, with only 13–17% representation of women, poses a limitation in terms of the generalizability of the findings. It is important to note that the sex distribution in the study was an unintended consequence of our clinical population composition. When considering the results of this study, due consideration must be given to potential confounding effects stemming from concurrent medications, although it is crucial to highlight that no alterations in medication dosages for lipid-lowering and heart rate control occurred throughout the study duration. Furthermore, it is noteworthy that the control group participants were not provided with diaries, thereby rendering us devoid of information regarding their physical activity patterns during the intervention period spanning from baseline to the six-week mark. The potential increase in physical activity within the control group could introduce a mitigating factor, potentially diminishing the observed differences in effects between the various groups.
In summary, our randomized controlled study demonstrated that both six-week HIIT and MICT programs were not only safe but also effective in eliciting favorable outcomes concerning blood pressure, body composition, and blood biomarkers in cardiac patients. Particularly noteworthy was the HIIT group’s superior performance compared to the conventional community-based exercise program (MICT), displaying enhancements in SBP, reductions in total body fat mass, abdominal fat percentage, and waist circumference, as well as improvements in lipid profiles, blood glucose levels, and T3 hormone concentrations among patients with CAD. Conversely, the absence of any exercise-based intervention post-cardiac event correlated with adverse outcomes across all clinical variables. Importantly, no adverse events were reported, supporting the inclusion of HIIT as a valuable adjunct or alternative to MICT within community-based exercise programs, positioning it as a significant therapeutic strategy for managing CAD patients.
The data that support the findings of this study are available from the corresponding author, CG, upon reasonable request.
Conceptualization, CG, AR, JP, and JB; methodology, CG and JP; validation, CG and JP; formal analysis, CG, AR, and JB; investigation, CG; resources, CG, AR, JP and JB; data curation, CG, AR, and JB; writing—original draft preparation, CG; writing—review and editing, CG, AR, AA, JP and JB; visualization, CG, AR, AA, JP, and JB; supervision, CG, AR, JP, and JB; project administration, CG, AR and JB; funding acquisition, CG, AR and JB. All authors have read and agreed to the published version of the manuscript. All authors have participated sufficiently in the work and agreed to be accountable for all aspects of the work.
The work conducted in this study followed the guidelines of the Declaration of Helsinki. Ethics approval was obtained from the University of Evora Ethics Committee (reference number: 17039). All patients signed a written informed consent before participating in this study.
This work was supported by the Foundation for Science and Technology (Portugal). We thank all authors of the original works cited in the present study, who readily assisted us by sharing their manuscripts for this Randomized Clinical Trial.
This work is funded by national funds through the Foundation for Science and Technology, under the project UIDB/04923/2020, and by the doctoral fellowship SFRH/BD/138326/2018.
The authors declare no conflict of interest.
Publisher’s Note: IMR Press stays neutral with regard to jurisdictional claims in published maps and institutional affiliations.