
- Academic Editor
†These authors contributed equally.
Background: This study aims to investigate the association between nine
tag single nucleotide polymorphisms (SNPs) in the C3 gene locus and the risk of coronary artery disease
(CAD) as well as lipid levels in the Chinese population, and to further explore
the interactions between SNPs and environmental factors that may be associated
with CAD risk. Methods: A case-control study was conducted to
investigate the association between CAD and C3 gene polymorphisms in a
hospital setting. The study consisted of 944 CAD patients with a mean age of
55.97
Coronary artery disease (CAD), caused by atherosclerotic plaque in the coronary arteries, is a global health risk, as it can reduce or completely block the flow of blood in the vascular lumen, leading to myocardial ischemia and hypoxia. Evidence suggests that both genetic and environmental elements may be involved in the development of this condition. Genetic studies have revealed significant information regarding the molecular cause of CAD. It has been observed that the genetic polymorphism of the C3 component of the complement is strongly correlated with CAD. Moreover, a single nucleotide polymorphism (SNP) in this gene may be a risk factor for CAD [1].
Ever since Rudolf Virchow made his groundbreaking discovery in the mid-1800s, numerous investigations have demonstrated that inflammation caused by the immune system plays a major role in the emergence and advancement of CAD [2]. The C3 gene is situated on the short arm of chromosome 19 at 19p13.3-2, measuring 41kb in length. The C3 protein, when fully developed, contains 1663 amino acids and has a molecular weight of 184 kD [1]. C3 is a type of adipocytokine, which is expressed in adipose tissue of obese patients and is associated with increased circulating levels [3]. The liver is the main source of C3 production, with adipose tissue being the primary secretor. Additionally, activated macrophages can also contribute to its secretion. C3 has been found to possess anti-infection and immune regulation functions, and can be implicated in pathological immune responses [4]. Various triggers can activate the various pathways of complement activation. Studies have explored a multitude of pathways in relation to human cardiovascular health and metabolism, with indications that they could be implicated in the formation of conditions including insulin resistance and diabetes, hypertension, non-alcoholic fatty liver disease, and atherosclerosis [5].
Numerous studies have examined the association between gene polymorphisms and the likelihood of CAD, however, comparatively few have explored the correlation between C3 polymorphism and CAD risk. Investigating the association between a particular compound and its influence on the body can be most effectively done by measuring the concentration of that compound in the bloodstream. Jiang H et al. [6] conducted a case-control study which revealed that serum C3 levels were significantly higher in coronary heart disease patients than in the healthy control group. The results of the study indicated that individuals with higher C3 levels had a greater likelihood of having severe CAD. Results from the CODAM (Cohort on Diabetes and Atherosclerosis Maastricht) study [7] suggest that individuals who smoke heavily and have elevated C3 levels are more likely to develop coronary heart disease. King R and colleagues discovered that by blocking the connection between complement C3 and fibrinogen, there may be a decrease in cardiovascular events for diabetic patients [8]. Széplaki G et al. [9] conducted a prospective study with 266 participants who had severe coronary heart disease, and observed them for 5 years. The research revealed that males with the disease had a significantly higher concentration of C3, implying that C3 can potentially be used as a biomarker for the condition. Additionally, the study demonstrated a positive correlation between C3 and triacylglycerol, as well as a negative correlation between C3 and adiponectin. It has been established by a recent study that the C3*F genotype is significantly associated with myocardial infarction in the Tunisian population [10]. A further study revealed that a higher C3 level is linked to the presence and degree of arterial calcification in middle-aged women, and could be a potential non-invasive marker for early diagnosis of atherosclerosis [11]. C3 is a major contributor to the development and progression of coronary artery disease.
This study sought to investigate the potential correlation between C3 gene polymorphisms and the development of CAD and lipid profiles in a Chinese population living in Xinjiang region. Furthermore, it aimed to analyze the interactions between SNPs and SNPs with environmental factors associated with CAD risk. The association between C3 tag SNPs and these conditions was examined to gain further insights.
A total of 1883 unrelated adult subjects were recruited for this study at the
First Affiliated Hospital of Xinjiang Medical University between August 2015 and
October 2019. The study population included 944 CAD patients (565 males, 288
females; mean age 55.97
 Fig. 1.
Inclusion and exclusion criteria used to select the study subjects. CAD, coronary artery disease.
The Ethics Committee of the First Affiliated Hospital of Xinjiang Medical University approved this research project (Approval No. K202309-08).
The International HapMap Project website (https://www.ncbi.nlm.nih.gov/snp) and the
Haploview 4.2 software (Broad Institute, Cambridge, MA, USA) were used to select 9 tag SNPs
of the C3 gene SNPs-rs1047286, rs11569562,
rs163913, rs2230199, rs2230204, rs2241393,
rs7257062, rs344550, rs8107911 (Table 1) with linkage
disequilibrium patterns (r
| SNPs | F-seq (5′-3′) | R-seq (5′-3′) |
| rs1047286 | GCCTCACCTGAGTGCAAGATGA | AAGCGCATTCCGGTACCATAGA |
| rs11569562 | CCATGTCACCATCCACACACAG | AGTGAGTGTGAGGTCCTGAAGTTACG |
| rs163913 | GCTACTGATTACCGCCCTGAGC | CAATTCATTTCATGCAGGGCTCA |
| rs2230199 | GCCAGGGGTGTAGATGGTCTTG | GGAACAGACCCCTGACAATGC |
| rs2230204 | TGGGTCACTGGCCCTTACCTTA | TGTCTTTCCACTCTAGCCCAGCA |
| rs2241393 | GAAGGTGGCCTAGAACCCACAA | GCATCCTCAGGGTCGCTAGACA |
| rs7257062_rs344548 | TGTGACATTGGGAGCCTGGTAG | GTGATTGCAGTGGAGTTGAGAATCA |
| rs344550 | TCCCTGTCTCCAGGTGGCTAAC | GGCAGCAGGGTCAACATCAC |
| rs8107911 | TGCGATTGCCGGTGTGAG | TGCCAAACTCGATGAGTGAACAG |
SNP, single nucleotide polymorphism.
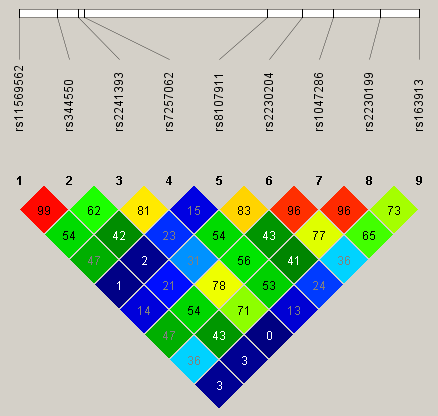 Fig. 2.
Linkage disequilibrium (LD) map covering C3 gene.
Smoking history, drinking history and past concomitant disease history were
collected through questionnaire surveys. Height, weight, and biochemical data are
obtained from medical health records and measurements conducted in hospital
laboratories. Definition of drinking history: frequency of drinking at least once
a week. Definition of Hypertension: according to the international Guidelines for
the Prevention and Treatment of Hypertension, a diagnosis of hypertension may be
made if a patient has their blood pressure checked three times in one day and
their systolic blood pressure readings are all
The data was analyzed using SPSS version 25.0 for Windows (IBM Corp., Armonk, NY, USA). The presence of coronary heart disease (CHD) risk alleles was coded as 0, 1, or 2, and the genotype distribution was assessed using a Chi-square test. The Hardy-Weinberg Equilibrium (HWE) test was used to examine the differences in genotype and allele frequencies between different groups. The Student’s t-test or analysis of variance was used to compare clinical parameters between cases and controls. Qualitative variables were reported as frequencies and percentages and evaluated using the Chi-square test. Multivariate logistic regression analyses were performed for SNPs and other risk factors associated with CHD. The odds ratio (OR) and 95% confidence interval (CI) were then calculated in order to evaluate the contribution of the major risk factors. Finally, we used multifactor dimensionality reduction (MDR) to explore potential interactions among SNPs, SNPs and environmental risk factors in CAD.
This study included 959 CAD patients and 924 healthy controls. The controls were
matched for age and sex. As shown in Table 2, the levels of ApoA (1.08 vs 1.09, p = 0.699),
BMI (25.81 vs 26.09, p = 0.346), and drinking history (30.3% vs
29.5%, p = 0.379) were not significantly different between the CAD
group and the healthy controls. There were significant differences between the
CAD group and the control group in terms of smoking history (45.6% vs 35.9%,
p
| Characteristics | CAD | Control | t/ |
p |
| Age/year | 55.97 |
55.94 |
–0.075 | 0.940 |
| Male/Female | 656 (69.5%)/288 (30.5%) | 583 (65.0%)/314 (35.0%) | 4.227 | 0.042 |
| Smoking history (%) | 430 (45.6%) | 322 (35.9%) | 18.072 | |
| Drinking history (%) | 290 (30.8%) | 262 (29.2%) | 0.544 | 0.476 |
| Diabetes (%) | 174 (18.7%) | 136 (15.7%) | 3.580 | |
| Hypertension (%) | 473 (54.2%) | 400 (45.8%) | 6.886 | 0.005 |
| BMI (kg/m |
25.91 |
26.09 |
0.779 | 0.346 |
| TG (mmol/L) | 1.90 |
1.72 |
–2.522 | 0.012 |
| TC (mmol/L) | 4.12 |
3.82 |
–4.010 | |
| HDL-C (mmol/L) | 0.91 |
1.00 |
4.909 | 0.003 |
| LDL-C (mmol/L) | 2.61 |
2.41 |
–3.822 | |
| ApoA (mmol/L) | 1.08 |
1.09 |
0.387 | 0.699 |
| ApoB (mmol/L) | 0.89 |
0.84 |
–3.561 |
CAD, coronary artery disease; BMI, body mass index; TC, total cholesterol; TG, triglyceride; HDL-C, high density lipoprotein cholesterol; LDL-C, low density lipoprotein cholesterol; ApoA, apolipoprotein A; ApoB, apolipoprotein B.
The genotypic and allelic distributions of rs1047286,
rs11569562, rs163913, rs2230199, rs2230204,
rs2241393, rs7257062, rs344550 and rs8107911
were exhibited in Table 3. The distributions of CC (10.9% vs 7.7%),
CT (44.2% vs 43.0%), and TT (44.9% vs 49.3%) genotypes in
rs7257062 of the CAD patients were statistically different relative to
the control group. Compared with the T allele (67.0% vs 70.8%), the
C allele frequency showed an increased level in the CAD group relative
to the control group (33.0% vs 29.2%), p
| SNP/Genotype | Control | CAD | p | OR (95% CI) | |
| rs1047286 | |||||
| AA | 3 (0.3%) | 3 (0.3%) | 0.951 | 1.051 (0.212–5.223) | |
| GA | 57 (6.4%) | 60 (6.4%) | 0.999 | 1 (0.687–1.454) | |
| GG | 837 (93.3%) | 881 (93.3%) | Reference | ||
| A | 63 (1.7%) | 66 (1.8%) | 0.979 | 1.005 (0.707–1.428) | |
| G | 1731 (47.0%) | 1822 (49.5%) | |||
| rs11569562 | |||||
| AA | 203 (22.7%) | 221 (23.4%) | 0.701 | 0.958 (0.771–1.191) | |
| GA | 462 (51.6%) | 494 (52.3%) | 0.742 | 0.97 (0.808–1.164 | |
| GG | 231 (25.8%) | 229 (24.3%) | Reference | ||
| A | 868 (48.4%) | 936 (49.6%) | 0.490 | 0.955 (0.84–1.087) | |
| G | 924 (51.6%) | 952 (50.4%) | |||
| rs163913 | |||||
| CC | 93 (10.5%) | 105 (11.2%) | 0.609 | 0.926 (0.689–1.244) | |
| TC | 415 (46.8%) | 440 (47.1%) | 0.907 | 0.989 (0.823–1.189) | |
| TT | 379 (42.7%) | 390 (41.7%) | Reference | ||
| C | 601 (33.9%) | 650 (34.8%) | 0.576 | 0.962 (0.839–1.103) | |
| T | 1173 (66.1%) | 1220 (65.2%) | |||
| rs2230199 | |||||
| CC | 4 (0.4%) | 2 (0.2%) | 0.378 | 2.11 (0.385–11.547) | |
| GC | 63 (7.0%) | 76 (8.1%) | 0.404 | 0.863 (0.61–1.221) | |
| GG | 830 (92.5) | 866 (91.7%) | Reference | ||
| C | 71 (4.0%) | 80 (4.2%) | 0.669 | 0.931 (0.672–1.291) | |
| G | 1723 (96.0%) | 1808 (95.8%) | |||
| rs2230204 | |||||
| CC | 265 (29.5%) | 309 (32.7%) | 0.140 | 0.862 (0.707–1.050) | |
| TC | 461 (51.4%) | 454 (48.1%) | 0.157 | 1.141 (0.95–1.37) | |
| TT | 171 (19.1%) | 181 (19.2%) | Reference | ||
| C | 991 (48.0%) | 1072 (52.0%) | 0.347 | 0.939 (0.825–1.07) | |
| T | 803 (49.6%) | 816 (50.4%) | |||
| rs2241393 | |||||
| CC | 308 (34.3%) | 312 (33.1%) | 0.560 | 1.059 (0.873–1.285) | |
| GC | 434 (48.4%) | 480 (50.8%) | 0.291 | 0.906 (0.755–1.088) | |
| GG | 155 (17.3%) | 152 (16.1%) | Reference | ||
| C | 1050 (58.5%) | 1104 (58.5%) | 0.974 | 1.002 (0.879–1.143) | |
| G | 744 (41.5%) | 784 (41.5%) | |||
| rs344550 | |||||
| CC | 120 (13.4%) | 115 (12.2%) | 0.442 | 1.113 (0.847–1.464) | |
| GC | 429 (47.8%) | 460 (48.7%) | 0.698 | 0.964 (0.803–1.158) | |
| GG | 348 (38.8%) | 369 (39.1%) | Reference | ||
| C | 669 (37.3%) | 690 (36.5%) | 0.640 | 1.032 (0.903–1.18) | |
| G | 1125 (62.7%) | 1198 (63.5%) | |||
| rs7257062 | |||||
| CC | 69 (7.7%) | 103 (10.9%) | **0.009 | 1.556 (1.116–2.170) | |
| CT | 385 (43.0%) | 417 (44.2%) | 0.216 | 1.129 (0.932–1.368) | |
| TT | 442 (49.3%) | 424 (44.9%) | Reference | ||
| C | 523 (29.2%) | 623 (33.0%) | *0.012 | 1.197 (1.041–1.377) | |
| T | 1271 (70.8%) | 1265 (67.0%) | |||
| rs8107911 | |||||
| AA | 691 (77.0%) | 735 (77.9%) | 0.672 | 0.954 (0.766–1.187) | |
| GA | 193 (21.5%) | 197 (20.9%) | 0.734 | 1.04 (0.831–1.3) | |
| GG | 13 (1.4%) | 12 (1.3%) | Reference | ||
| A | 1757 (88.9%) | 1667 (88.3%) | 0.543 | 1.064 (0.872–1.297) | |
| G | 219 (11.1%) | 221 (11.7%) | |||
SNP, single nucleotide polymorphism; CAD, coronary artery disease; OR, odds
ratio; CI, confidence interval. *: p
The results of the multivariable logistic regression analysis are shown in Table 4. We included variables with significant differences identified in Table 2, as well as the rs7257062 CC genotype, in the multivariable logistic regression. After adjusting the confounders including gender, smoking history, diabetes, hypertension, TG, TC, HDL-C, LDL-C and ApoB, the CC genotype of rs7257062 was identified to be an independent risk factor for CAD (OR = 1.581, 95% CI: 1.094–2.284, p = 0.015). The power of our study on CC genotype of rs7257062 is 76.29%. Our study was adequately powered to detect this association.
| Variables | B | S.E. | Wald | OR | 95% CI | p value |
| Male/Female | 0.031 | 0.140 | 0.049 | 1.031 | 0.784–1.356 | 0.825 |
| Smoking history (%) | 0.333 | 0.129 | 6.668 | 1.395 | 1.084–1.796 | 0.010* |
| Diabetes (%) | 0.260 | 0.138 | 3.566 | 1.297 | 0.990–1.699 | 0.059 |
| Hypertension (%) | 0.303 | 0.107 | 8.111 | 1.354 | 1.099–1.669 | 0.004* |
| TG (mmol/L) | –0.061 | 0.045 | 1.878 | 0.940 | 0.861–1.027 | 0.171 |
| TC (mmol/L) | 0.463 | 0.112 | 17.137 | 1.589 | 1.276–1.979 | |
| HDL-C (mmol/L) | –1.566 | 0.225 | 48.246 | 0.209 | 0.134–0.325 | |
| LDL-C (mmol/L) | –0.051 | 0.132 | 0.148 | 0.951 | 0.734–1.231 | 0.700 |
| ApoB (mmol/L) | –0.329 | 0.255 | 1.660 | 0.720 | 0.437–1.187 | 0.198 |
| rs7257062 CC genotype | 0.458 | 0.188 | 5.949 | 1.581 | 1.094–2.284 | 0.015* |
*: p
Table 5 demonstrates that there are significant differences in the serum levels
of TG between the genotypes of rs7257062. Since the C allele
was major allele, we grouped the CC + CT genotype as carriers of the
C allele. The mean values for the TT and CC + CT
genotypes in the CAD subgroup are significantly different (2.326
| SNP | Genotypes | TG | TC | HDL-C | LDL-C | ApoA | ApoB |
| rs1047286 | CAD subgroup | ||||||
| GG | 2.749 |
4.471 |
0.984 |
2.841 |
1.179 |
0.906 | |
| AA + GA | 2.985 |
4.342 |
0.965 |
2.712 |
1.168 |
0.846 | |
| p | 0.389 | 0.472 | 0.608 | 0.361 | 0.755 | 0.069 | |
| Control group | |||||||
| GG | 1.89 |
4.15 |
1.07 |
2.63 |
1.19 |
0.85 | |
| AA + GA | 1.75 |
4.03 |
1.12 |
2.54 |
1.22 |
0.83 | |
| p | 0.287 | 0.189 | 0.626 | 0.306 | 0.588 | 0.482 | |
| rs11569562 | CAD subgroup | ||||||
| GG | 2.474 |
4.392 |
0.999 |
2.864 |
1.172 |
0.904 | |
| AA + GA | 2.271 |
4.487 |
0.977 |
2.823 |
1.18 |
0.901 | |
| p | 0.065 | 0.351 | 0.295 | 0.610 | 0.727 | 0.892 | |
| Control group | |||||||
| GG | 1.96 |
4.068 |
1.067 |
2.525 |
1.198 |
0.847 | |
| AA + GA | 1.856 |
4.168 |
1.077 |
2.659 |
1.192 |
0.852 | |
| p | 0.484 | 0.418 | 0.991 | 0.167 | 0.767 | 0.824 | |
| rs163913 | CAD subgroup | ||||||
| TT | 2.272 |
4.540 |
0.995 |
2.872 |
1.185 |
0.922 | |
| CC + TC | 2.159 |
4.419 |
0.975 |
2.811 |
1.174 |
0.890 | |
| p | 0.309 | 0.180 | 0.280 | 0.391 | 0.636 | 0.203 | |
| Control group | |||||||
| TT | 1.837 |
4.132 |
1.069 |
2.618 |
1.189 |
0.850 | |
| CC + TC | 1.916 |
4.154 |
1.081 |
2.632 |
1.199 |
0.852 | |
| p | 0.314 | 0.700 | 0.577 | 0.786 | 0.598 | 0.937 | |
| rs2230199 | CAD subgroup | ||||||
| GG | 2.033 |
4.475 |
0.983 |
2.841 |
1.178 |
0.905 | |
| CC + GC | 2.188 |
4.324 |
0.976 |
2.737 |
1.179 |
0.863 | |
| p | 0.207 | 0.349 | 0.854 | 0.410 | 0.971 | 0.190 | |
| Control group | |||||||
| GG | 1.891 |
4.152 |
1.071 |
2.633 |
1.194 |
0.853 | |
| CC + GC | 1.774 |
4.015 |
1.111 |
2.523 |
1.191 |
0.821 | |
| p | 0.337 | 0.132 | 0.73 | 0.225 | 0.947 | 0.357 | |
| rs2230204 | CAD subgroup | ||||||
| TT | 2.069 |
4.643 |
0.995 |
2.966 |
1.197 |
0.933 | |
| CC + TC | 2.234 |
4.420 |
0.979 |
2.800 |
1.173 |
0.894 | |
| p | 0.259 | 0.053 | 0.485 | 0.074 | 0.364 | 0.137 | |
| Control group | |||||||
| TT | 1.896 |
4.052 |
1.051 |
2.598 |
1.188 |
0.865 | |
| CC + TC | 1.879 |
4.164 |
1.080 |
2.631 |
1.195 |
0.847 | |
| p | 0.893 | 0.175 | 0.186 | 0.567 | 0.755 | 0.466 | |
| rs2241393 | CAD subgroup | ||||||
| GG | 2.347 |
4.484 |
0.999 |
2.761 |
1.211 |
0.872 | |
| CC + GC | 2.163 |
4.460 |
0.979 |
2.846 |
1.172 |
0.927 | |
| p | 0.194 | 0.845 | 0.472 | 0.356 | 0.441 | 0.231 | |
| Control group | |||||||
| GG | 1.876 |
4.122 |
1.065 |
2.598 |
1.173 |
0.864 | |
| CC + GC | 1.884 |
4.146 |
1.076 |
2.630 |
1.197 |
0.848 | |
| p | 0.612 | 0.89 | 0.871 | 0.937 | 0.314 | 0.478 | |
| rs344550 | CAD subgroup | ||||||
| GG | 2.174 |
4.469 |
1.004 |
2.842 |
1.182 |
0.907 | |
| CC + GC | 2.307 |
4.460 |
0.968 |
2.827 |
1.176 |
0.899 | |
| p | 0.576 | 0.920 | 0.056 | 0.824 | 0.790 | 0.723 | |
| Control group | |||||||
| GG | 1.992 |
4.109 |
1.085 |
2.563 |
1.204 |
0.853 | |
| CC + GC | 1.815 |
4.162 |
1.068 |
2.663 |
1.187 |
0.849 | |
| p | 0.078 | 0.709 | 0.241 | 0.209 | 0.375 | 0.817 | |
| rs7257062 | CAD subgroup | ||||||
| TT | 2.059 |
4.473 |
0.976 |
2.872 |
1.174 |
0.906 | |
| CC + TC | 2.326 |
4.454 |
0.987 |
2.800 |
1.180 |
0.898 | |
| p | 0.019* | 0.833 | 0.566 | 0.304 | 0.779 | 0.749 | |
| Control group | |||||||
| TT | 1.913 |
4.128 |
1.066 |
2.615 |
1.187 |
0.851 | |
| CC + TC | 1.851 |
4.156 |
1.083 |
2.635 |
1.200 |
0.850 | |
| p | 0.382 | 0.584 | 0.395 | 0.590 | 0.478 | 0.951 | |
| rs8107911 | CAD subgroup | ||||||
| GG | 2.456 |
4.226 |
0.918 |
2.649 |
1.106 |
0.836 | |
| AA + GA | 2.199 |
4.466 |
0.983 |
2.835 |
1.179 |
0.903 | |
| p | 0.628 | 0.389 | 0.226 | 0.449 | 0.213 | 0.294 | |
| Control group | |||||||
| GG | 1.668 |
4.129 |
2.574 |
1.294 |
0.803 |
0.803 | |
| AA + GA | 1.886 |
4.142 |
1.071 |
2.626 |
1.192 |
0.851 | |
| p | 0.611 | 0.901 | 0.065 | 0.745 | 0.209 | 0.466 |
*: p
Gensini score and vascular stenosis number were compared between the genotypes
of all nine tagSNPs: rs1047286, rs11569562, rs163913,
rs2230199, rs2230204, rs2241393, rs344550,
rs7257062 and rs8107911. The results showed that there were no
significant differences in any aspect between the two groups (p
| SNPs | Genotypes | Gensini score | Number of stenosed vessels |
| rs1047286 | AA | 94.333 |
2.67 |
| GA | 52.042 |
2.25 | |
| GG | 56.214 |
2.48 | |
| F-test | 1.174 | 0.626 | |
| p | 0.310 | 0.353 | |
| rs11569562 | AA | 55.336 |
2.36 |
| GA | 55.874 |
2.52 | |
| GG | 57.198 |
2.44 | |
| F-test | 0.071 | 0.842 | |
| p | 0.932 | 0.431 | |
| rs163913 | CC | 57.177 |
1.56 |
| TC | 56.811 |
2.61 | |
| TT | 54.788 |
2.39 | |
| F-test | 0.255 | 1.353 | |
| p | 0.775 | 0.259 | |
| rs2230199 | CC | 98.500 |
2.50 |
| GC | 50.954 |
2.25 | |
| GG | 56.422 |
2.48 | |
| F-test | 1.237 | 0.778 | |
| p | 0.291 | 0.460 | |
| rs2230204 | CC | 56.912 |
2.47 |
| TC | 53.847 |
2.48 | |
| TT | 60.144 |
2.41 | |
| F-test | 1.187 | 0.100 | |
| p | 0.306 | 0.905 | |
| rs2241393 | CC | 57.672 |
2.44 |
| GC | 54.923 |
2.45 | |
| GG | 56.432 |
2.54 | |
| F-test | 0.269 | 0.264 | |
| p | 0.764 | 0.768 | |
| rs344550 | CC | 59.724 |
2.52 |
| GC | 56.124 |
2.47 | |
| GG | 54.865 |
2.44 | |
| F-test | 0.476 | 0.107 | |
| p | 0.621 | 0.898 | |
| rs7257062 | CC | 49.692 |
2.38 |
| TC | 55.537 |
2.47 | |
| TT | 58.165 |
2.47 | |
| F-test | 1.284 | 0.167 | |
| p | 0.277 | 0.846 | |
| rs8107911 | AA | 57.454 |
2.47 |
| GA | 49.917 |
2.42 | |
| GG | 71.667 |
2.58 | |
| F-test | 2.690 | 0.173 | |
| p | 0.068 | 0.841 |
SNP, single nucleotide polymorphism.
After applying the ReliefF filter, rs7257062, smoking, diabetes, hypertension, BMI, and TG were included in the MDR analysis of SNP–environment interactions. As is shown in Table 7, the six factor model (rs7257062, smoking, diabetes, hypertension, BMI, and TG) was determined to be the best model, as it had the highest cross-validation consistency (CVC) of 10/10 with a testing accuracy of 61.59% (0.0457). However, no significant SNP–SNP interaction model was identified.
| Model | Training accuracy (%) | Testing accuracy (%) | CVC | p value | |
| SNPs | |||||
| rs11569562, rs163913 | 55.99 | 51.23 | 7/10 | 0.8304 | |
| rs2230204, rs2241393, rs8107911 | 58.93 | 48.80 | 5/10 | 0.8360 | |
| rs11569562, rs163913, rs7257062, rs8107911 | 62.60 | 50.66 | 5/10 | 0.9091 | |
| rs11569562, rs163913, rs2230204, rs2241393, rs8107911 | 66.84 | 49.02 | 5/10 | 0.8652 | |
| rs11569562, rs163913, rs2230204, rs2241393, rs7257062, rs8107911 | 71.25 | 49.67 | 9/10 | 0.9543 | |
| rs11569562, rs163913, rs2230204, rs2241393, rs344550, rs7257062, rs8107911 | 74.17 | 48.74 | 10/10 | 0.8259 | |
| rs11569562, rs163913, rs2230199, rs2230204, rs2241393, rs344550, rs7257062, rs8107911 | 75.70 | 47.14 | 10/10 | 0.6168 | |
| rs1047286, rs11569562, rs163913, rs2230199, rs2230204, rs2241393, rs344550, rs7257062, rs8107911 | 75.81 | 47.04 | 10/10 | 0.6046 | |
| SNPs and environmental factors | |||||
| smoke | 60.48 | 60.48 | 10/10 | 0.0691 | |
| rs7257062, smoke | 61.74 | 61.74 | 10/10 | 0.0431 | |
| rs7257062, smoke, TG | 63.65 | 63.15 | 10/10 | 0.0235 | |
| rs7257062, smoke, BMI, TG | 65.37 | 57.69 | 4/10 | 0.1851 | |
| rs7257062, smoke, diabetes, BMI, TG | 68.49 | 57.45 | 6/10 | 0.1990 | |
| rs7257062, smoke, diabetes, hypertension, BMI, TG | 71.98 | 61.59 | 10/10 | 0.0457 | |
MDR, multifactor dimensionality reduction; SNP, single nucleotide polymorphism; TG, triglyceride; BMI, body mass index; CVC, cross-validation consistency.
After utilizing the multifactor dimensionality reduction (MDR) algorithm to identify a high-risk combination of SNPs and environmental factors, we further employed the concept of information gain to interpret their relationship. Subsequently, we created a hierarchical interaction graph to visualize the interactions (as shown in Fig. 3A). The results revealed a positive correlation between rs7257062 and smoke, with an interaction entropy of 0.43%, and between rs7257062 and TG with an interaction entropy of 0.38%. The remaining relationships were all negative correlations, with the highest interaction entropies occurring between smoke and TG (–0.69%), TG and diabetes (–0.65%), BMI and diabetes (–0.51%), hypertension and diabetes (–0.45%), and smoke and diabetes (–0.44%).
 Fig. 3.
Hierarchical interaction graph and interaction dendrogram. (A) The percentage at the bottom of each factor in a hierarchical interaction graph represents its entropy, while the percentage on each line indicates the interaction percentage of entropy between two factors. The red line symbolizes synergy redundancy interaction, and the blue line indicates redundancy interaction. (B) interaction dendrogram illustrates the intensity of interaction from left to right, with the red line signifying stronger synergy interaction and the orange line representing weaker synergy interaction. TG, triglyceride; BMI, body mass index.
The interaction dendrogram in Fig. 3B reveals that rs7257062 and TG have the strongest synergy interaction, as indicated by the red line. In contrast, the rs7257062 SNPs is located on a different branch than diabetes, BMI, smoke, and hypertension, indicating a weak synergy interaction, as indicated by the orange line. Moreover, the results suggest that diabetes and BMI have a strong synergy interaction.
To ascertain the connection between C3 gene polymorphisms and CAD in China, a comprehensive, multicenter study with a large sample size is indispensable. We aimed to investigate whether C3 gene variants are linked to the risk of CAD and lipid levels in the Chinese population.
This study was conducted to evaluate the roles of C3 related SNPs (rs1047286, rs11569562, rs163913, rs2230199, rs2230204, rs2241393, rs344550, rs7257062, and rs8107911) in patients with CAD. The results depicted that the CC genotype in rs7257062 was an independent risk factor for CAD after adjusting gender, smoking history, diabetes, hypertension, TG, TC, HDL-C, LDL-C and ApoB. The CAD subgroup showed significant differences in TG levels between the TT and CC + TC genotypes in rs7257062. There were no differences in Gensini score or vascular stenosis that were statistically significant between the groups for any of these SNPs. Rs7257062, smoking, diabetes, hypertension, BMI, and TG were all found to have a significant correlation with CAD risk when taken together. According to Barrington R et al. [15], the levels of complement C3 and C4 both increase during chronic inflammation, and a high level of C3 has been found to be associated with myocardial infarction. The study by Muscari A et al. [16] found that C3 and C-reactive protein (CRP) were significantly elevated in patients with myocardial infarction and cardiovascular disease, compared to a healthy control group. This suggests that C3 is an independent risk factor for myocardial infarction, and that C3 is a more specific marker. According to Phillips CM et al. [17] when C3 levels are elevated, it is associated with insulin resistance, abnormal obesity, and low HDL-C. The study of the relationship between C3 polymorphism and metabolic syndrome in the French population found that the rs2250656 polymorphism was related to C3 levels. The study found that carriers of the A allele for rs1569562 had significantly higher levels of C3 than patients with the GG genotype; the study also found that the AA genotype had higher levels of C3 than the GG genotype. Nsaiba MJ et al. [18] found that the rs2230199 polymorphism of C3 was associated with blood lipids in a study of Tunisian patients with schizophrenia. Their study results showed that patients with the CG and GG genotypes of rs2230199 had significantly higher levels of TG and TC, respectively, compared to those with the CC genotype. This suggests that the GG genotype of rs223019 may be associated with higher levels of HDL-C. The study conducted by Torres T et al. [19] revealed that C3 levels were linked with various conditions like abdominal visceral fat, insulin resistance, and the metabolic syndrome. These conditions are often attributed to oxidized LDL-C in patients with psoriasis. Garcia-Arguinzonis M et al. [20] indicated in their research that C3 complement pathway could be a novel player in vascular remodeling and in the progression of advanced human atherosclerotic lesions. Copenhaver MM et al.’s [21] study found that C3 plasma concentrations increased in obese individuals, which may contribute to the early onset of cardiovascular disease. The findings of a study conducted by Dissing J et al. [22] indicate that the C3 gene polymorphism may play a role in the development of atherosclerotic disease in older individuals residing in Copenhagen. According to the research of Leban et al. [10], individuals with the C3*F genotype had a greater chance of suffering from a myocardial infarction. They estimated that this polymorphism significantly increased the likelihood of myocardial infarction.
It has been proven that the elevated levels of TG, TC, LDL-C, ApoB and Lp(a), together with the decreased HDL-C and ApoA1 levels, are indicators of dyslipidemia, which is associated with the pathogenesis of CAD [23]. The alternative C3 complement system, as a key inflammatory mediator, seems to be involved in the atherosclerotic process, studies have reported an increase in the expression of complement cascade components, including C3-derived products, in Familial hypercholesterolemia patients who show no clinical signs of coronary artery disease [24]. We found that, compared to the control group, patients with CAD had noticeably higher levels of TC, TG, ApoB, and LDL-C. There was a significant difference in the level of HDL-C between the control group and the CAD group, with the control group having a higher level. ApoA levels were similar between these two groups.
The relationship between C3 polymorphisms and susceptibility to CAD is
not well-established in the literature. We selected nine SNPs as tagSNPs for our
investigation. No association was found between rs1047286,
rs11569562, rs163913, rs2230199, rs2230204,
rs2241393, rs344550, rs8107911 polymorphisms and CAD
or with lipid levels, except for rs7257062. rs7257062 was found
to be an independent risk factor of CAD (OR = 1.581, 95% CI: 1.094–2.284,
p = 0.015) in a multivariable logistic analysis, after controlling for
potential confounders including gender, smoking history, diabetes, hypertension,
TG, TC, HDL-C, LDL-C and ApoB. The distribution of the CC genotype of
rs7257062 between the CAD and control groups were 103 (10.9%) and 69
(7.7%), p = 0.009. Individuals with the C allele in
rs7257062 genotype had higher TG levels than in the TT and
CT genotype in the control and CAD groups (TT = 2.059
In our study, we found no differences between the alleles of nine SNPs and the Gensini score and vascular stenosis numbers in terms of the relationship between the C3 polymorphisms and the severity of CAD.
The aim of this study was to explore the correlation between C3 related tag SNPs and CAD. Our findings showed that CC genotype in rs7257062 was an independent risk factor for CAD. We also discovered a noteworthy correlation between rs7257062, smoke, diabetes, hypertension, BMI, and TG, which is affected by the environment. The rs7257062 variant impacted the levels of TG in CAD patients. C3 gene polymorphisms were associated with both lipid metabolism and CAD susceptibility in the Chinese population in Xinjiang region. Our outcome may indicate a potential route of investigation into the origin of Coronary Artery Disease.
The present study had several limitations that should be acknowledged. Firstly, the sample size was relatively small and limited to a single region, which might have reduced the statistical efficacy of our findings. Secondly, the biological function of C3 gene was not validated in this work. Larger studies with functional assays are needed to confirm the conclusions of this study.
Our research data is not available for sharing due to the sensitive nature of the data. The data used in this study contain personally identifiable information and are subject to privacy regulations and ethical considerations. As a result, we are unable to share the data with external parties to ensure the protection of participants’ confidentiality and privacy.
SA and CH designed the research study and contributed equally. DA performed the research. WX, HA, HQ and HL analyzed and visualized the data; ML, YC and WX provided help and advice on performing the research. YG and JZ contributed to the study’s design and played a major role in critically revising the manuscript. All authors contributed to editorial changes in the manuscript. All authors read and approved the final manuscript. All authors have participated sufficiently in the work and agreed to be accountable for all aspects of the work.
This study was designed in accordance with the principles of the 1964 Helsinki Declaration and was approved by the Ethics Committee of the First Affiliated Hospital of Xinjiang Medical University on September 5th, 2023, with registration number K202309-08. Furthermore, informed consent was obtained from all subjects involved in the study.
We are grateful to our colleagues in the Department of Cardiology at Xinjiang Medical University First Affiliated Hospital.
This study was supported by Key Project of Natural Science Foundation of Xinjiang Uygur Autonomous Region (Grant No.2023D01D13).
The authors declare no conflict of interest.
Publisher’s Note: IMR Press stays neutral with regard to jurisdictional claims in published maps and institutional affiliations.